
Tutorial: Flyer Page 4 - Content
This is a step-by-step guide to gather and input the content for page 4 of the flyer.
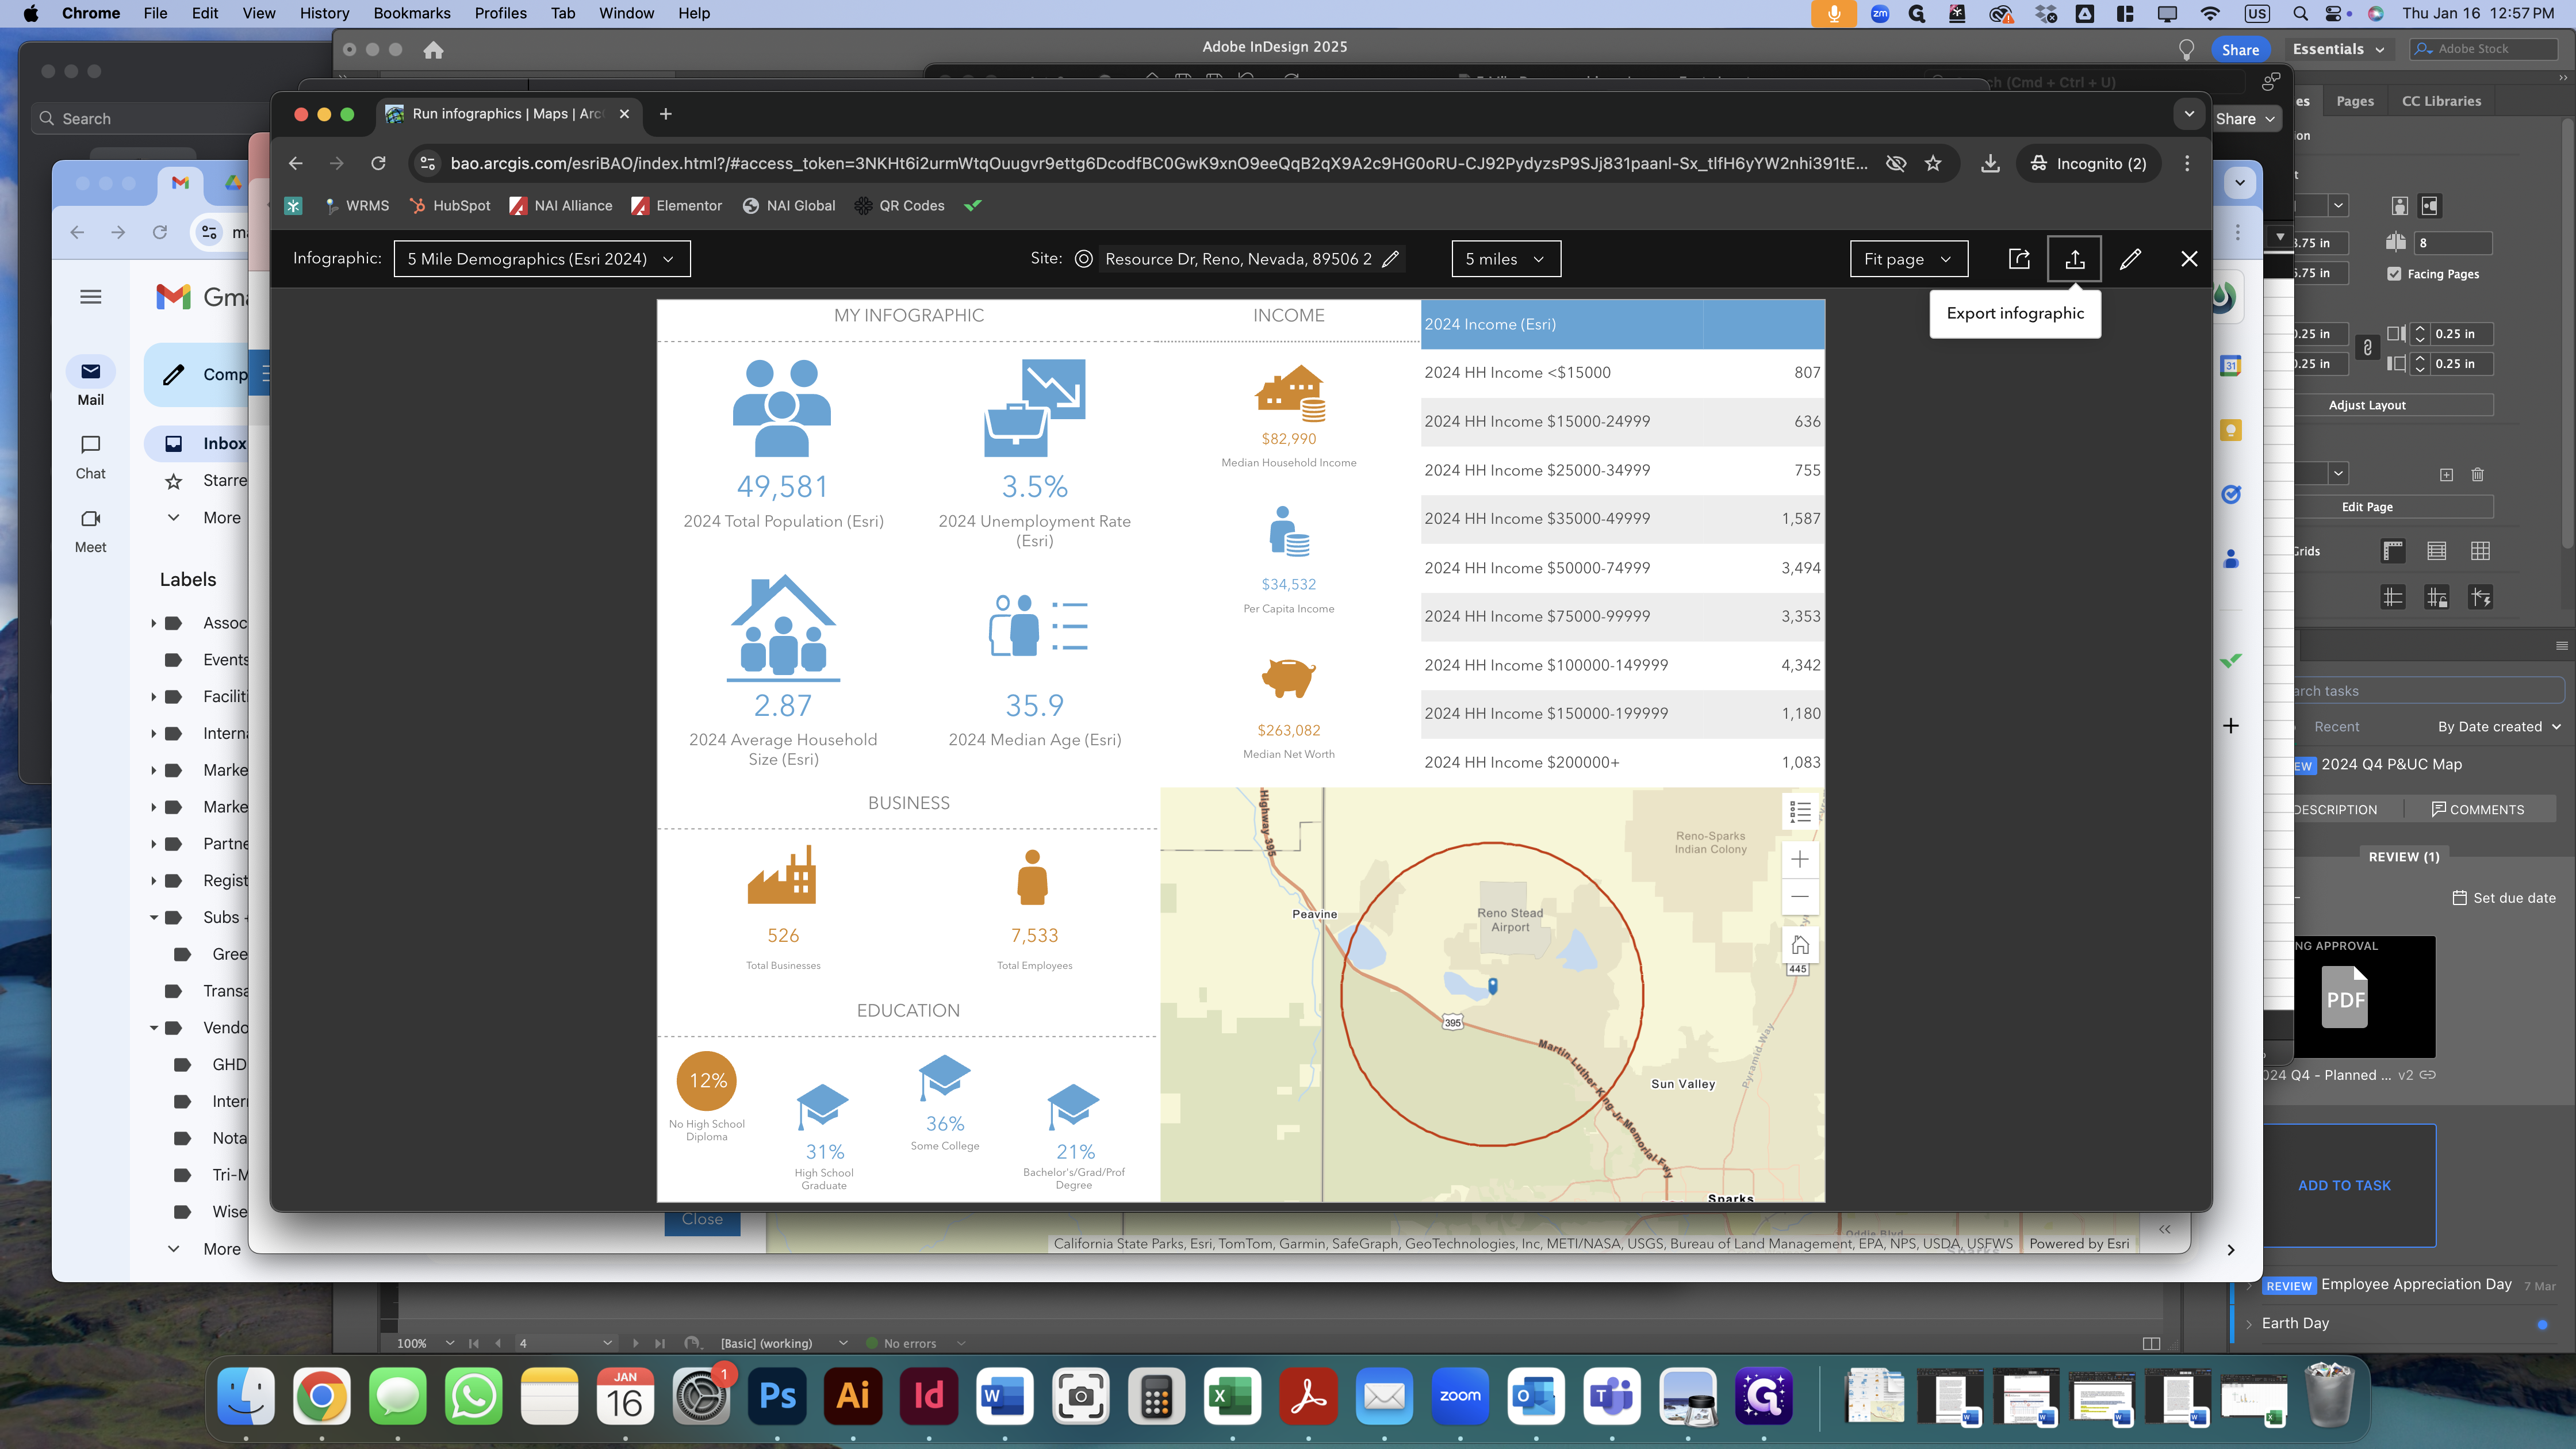
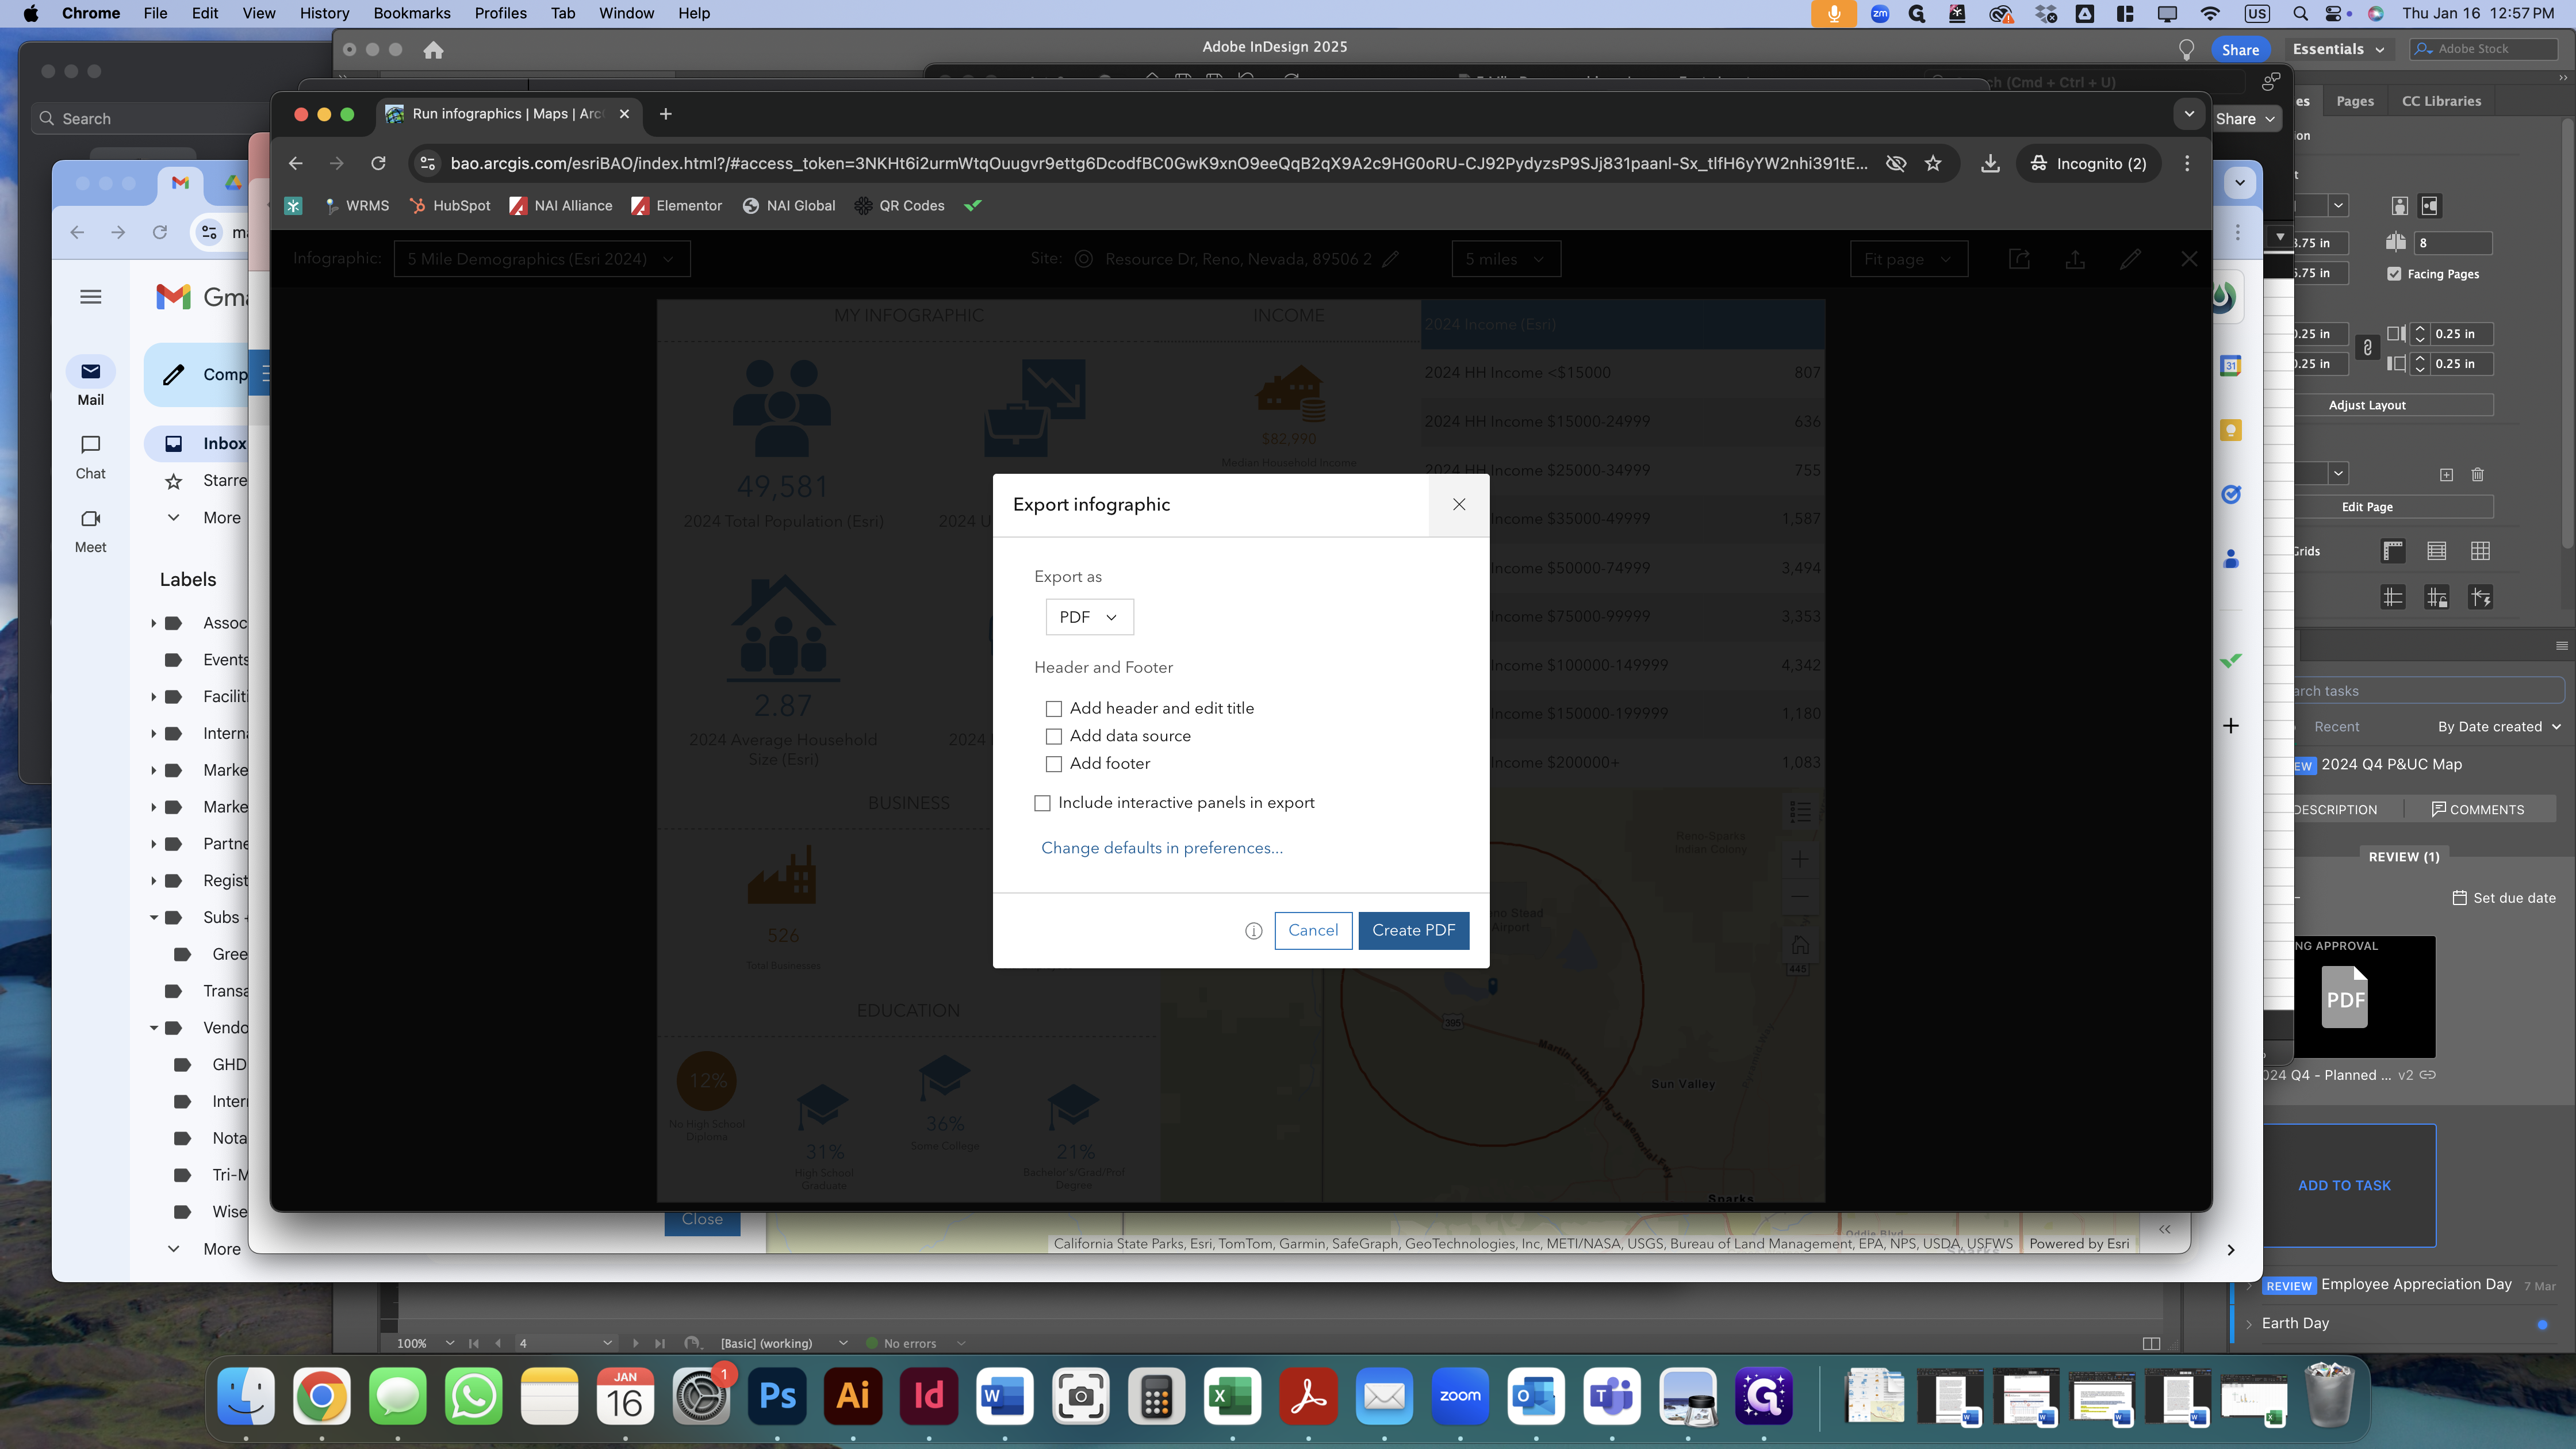
In this guide, we'll learn how to create the demographics page for a flyer using data from SiteToDoBusiness. We'll start by accessing the necessary demographic information online and exporting it to a PDF. Next, we'll use some of the data to create a chart in Excel. Finally, we'll add the data and graphic to the flyer.
Let's get started
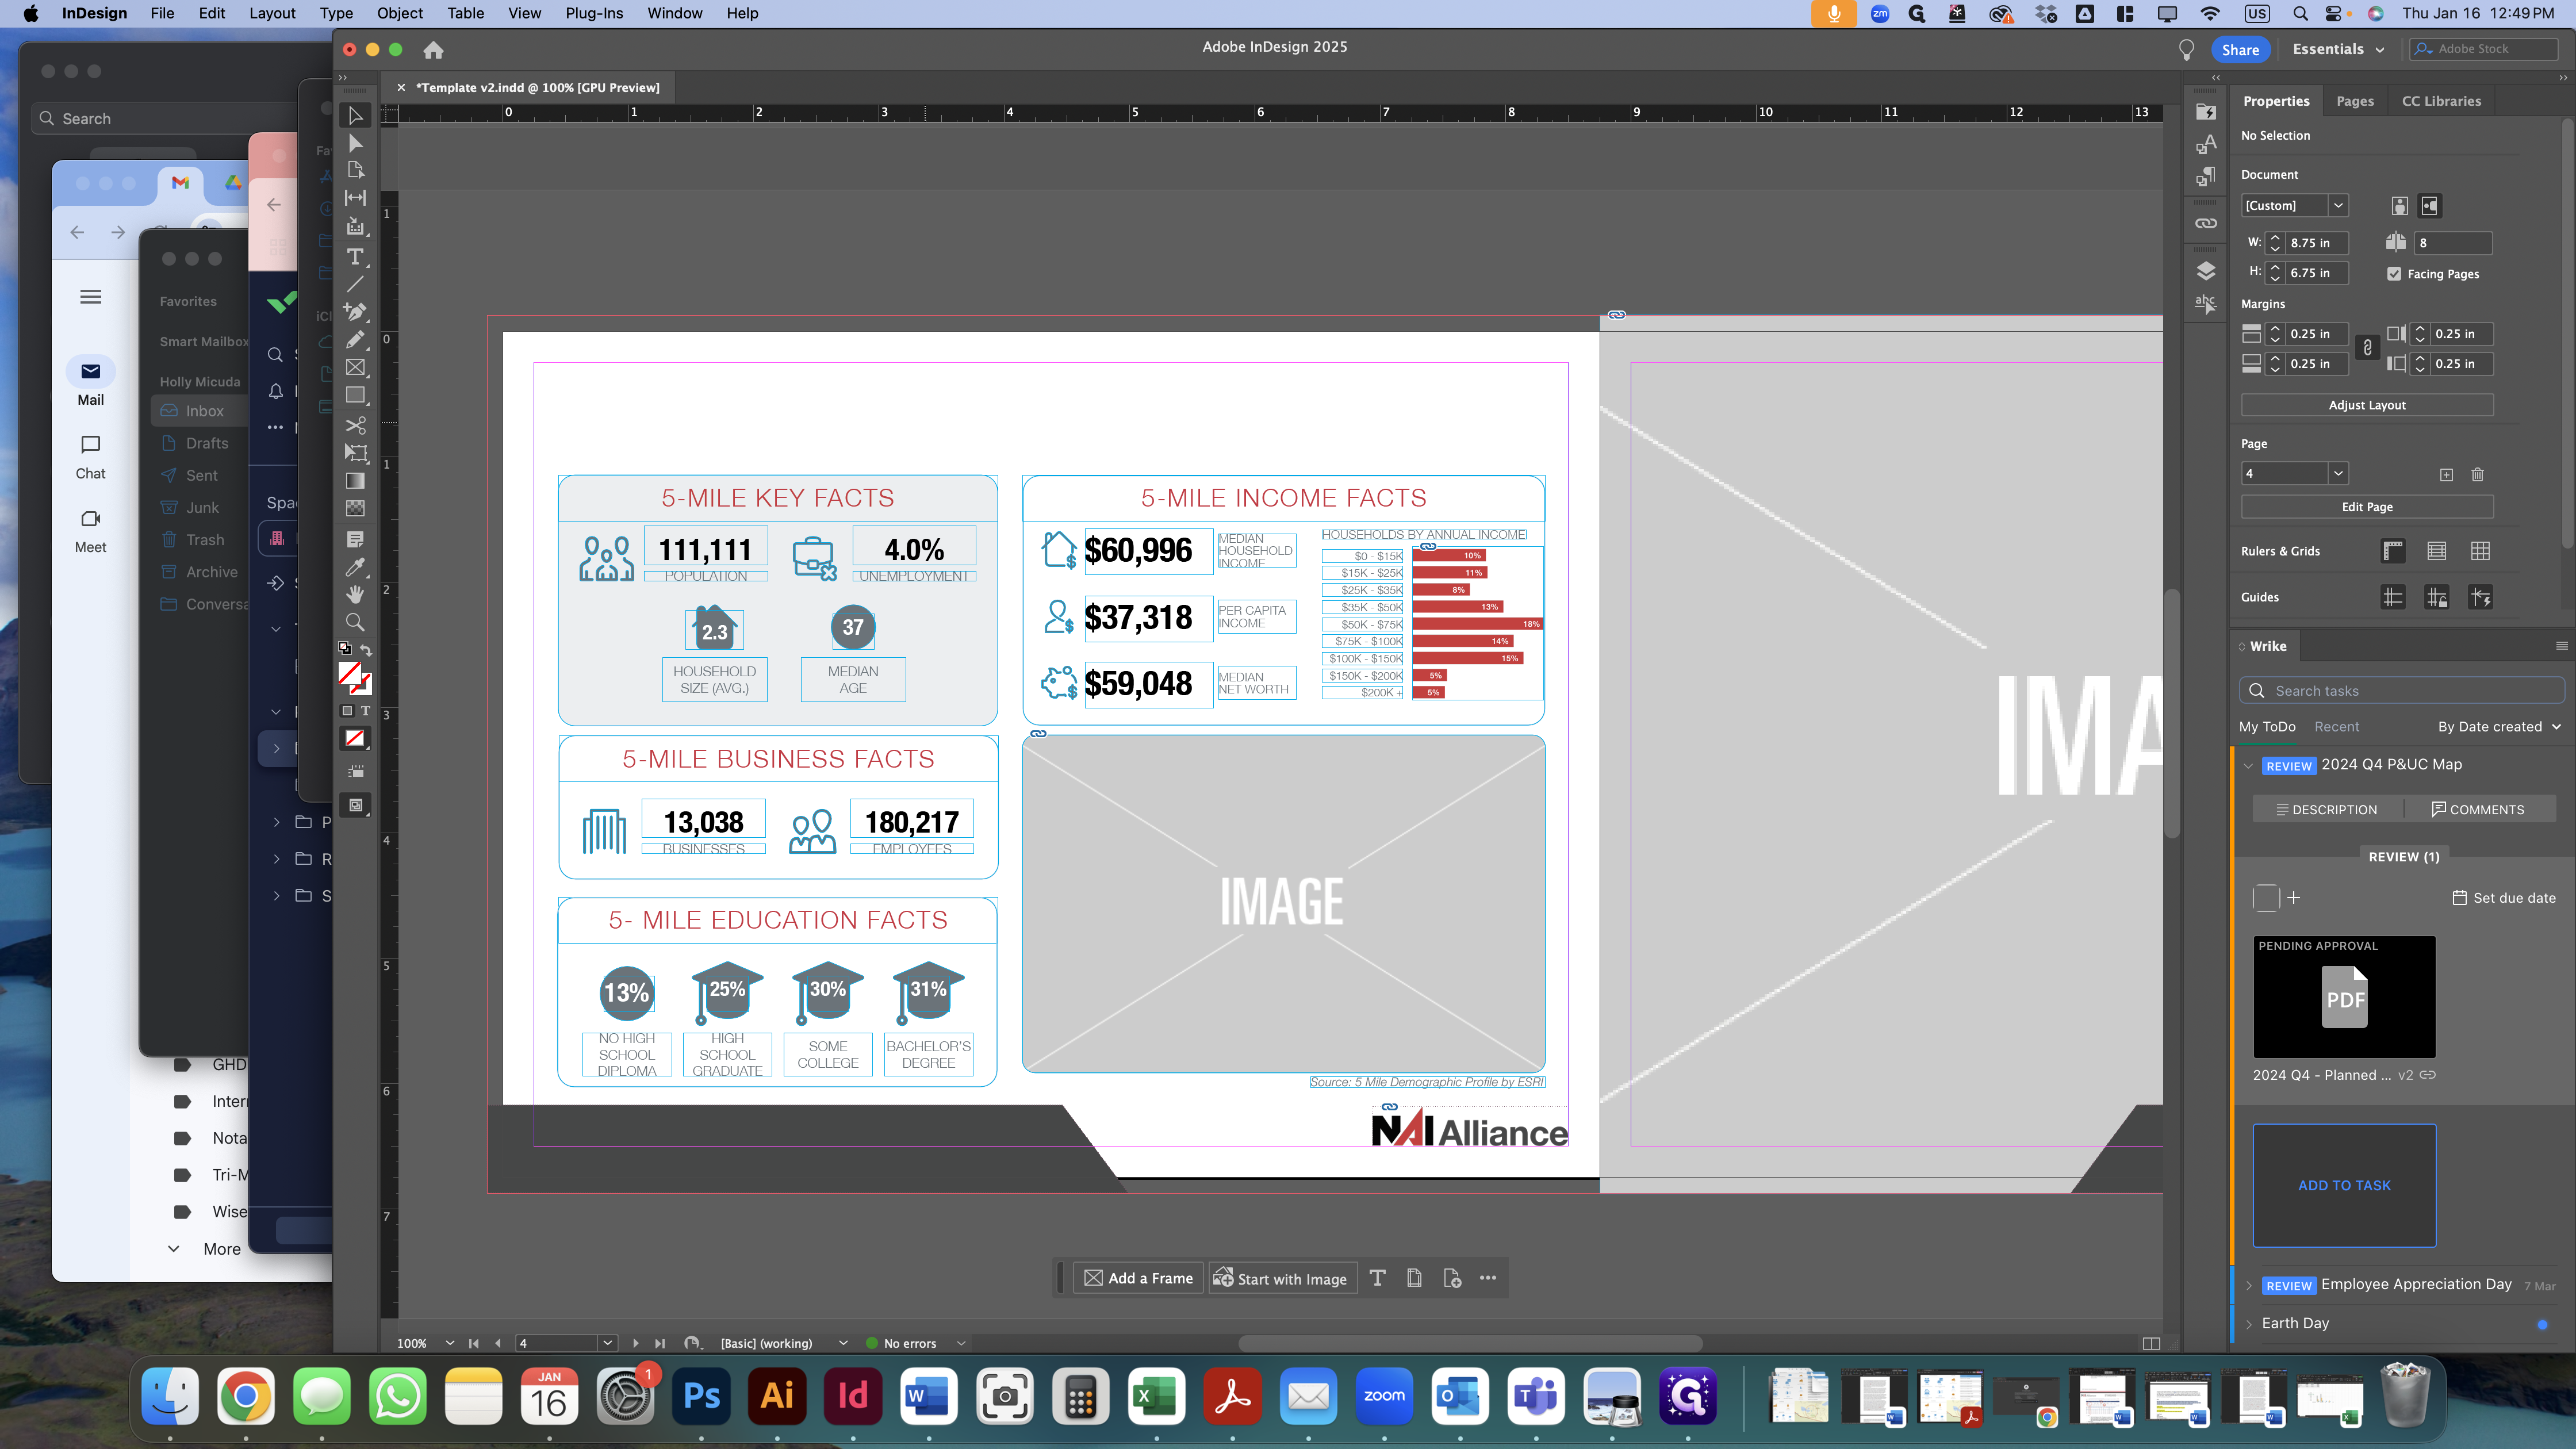
We will create the content for the demographics page in the flyer, which is page 4. Here is what the slide looks like.
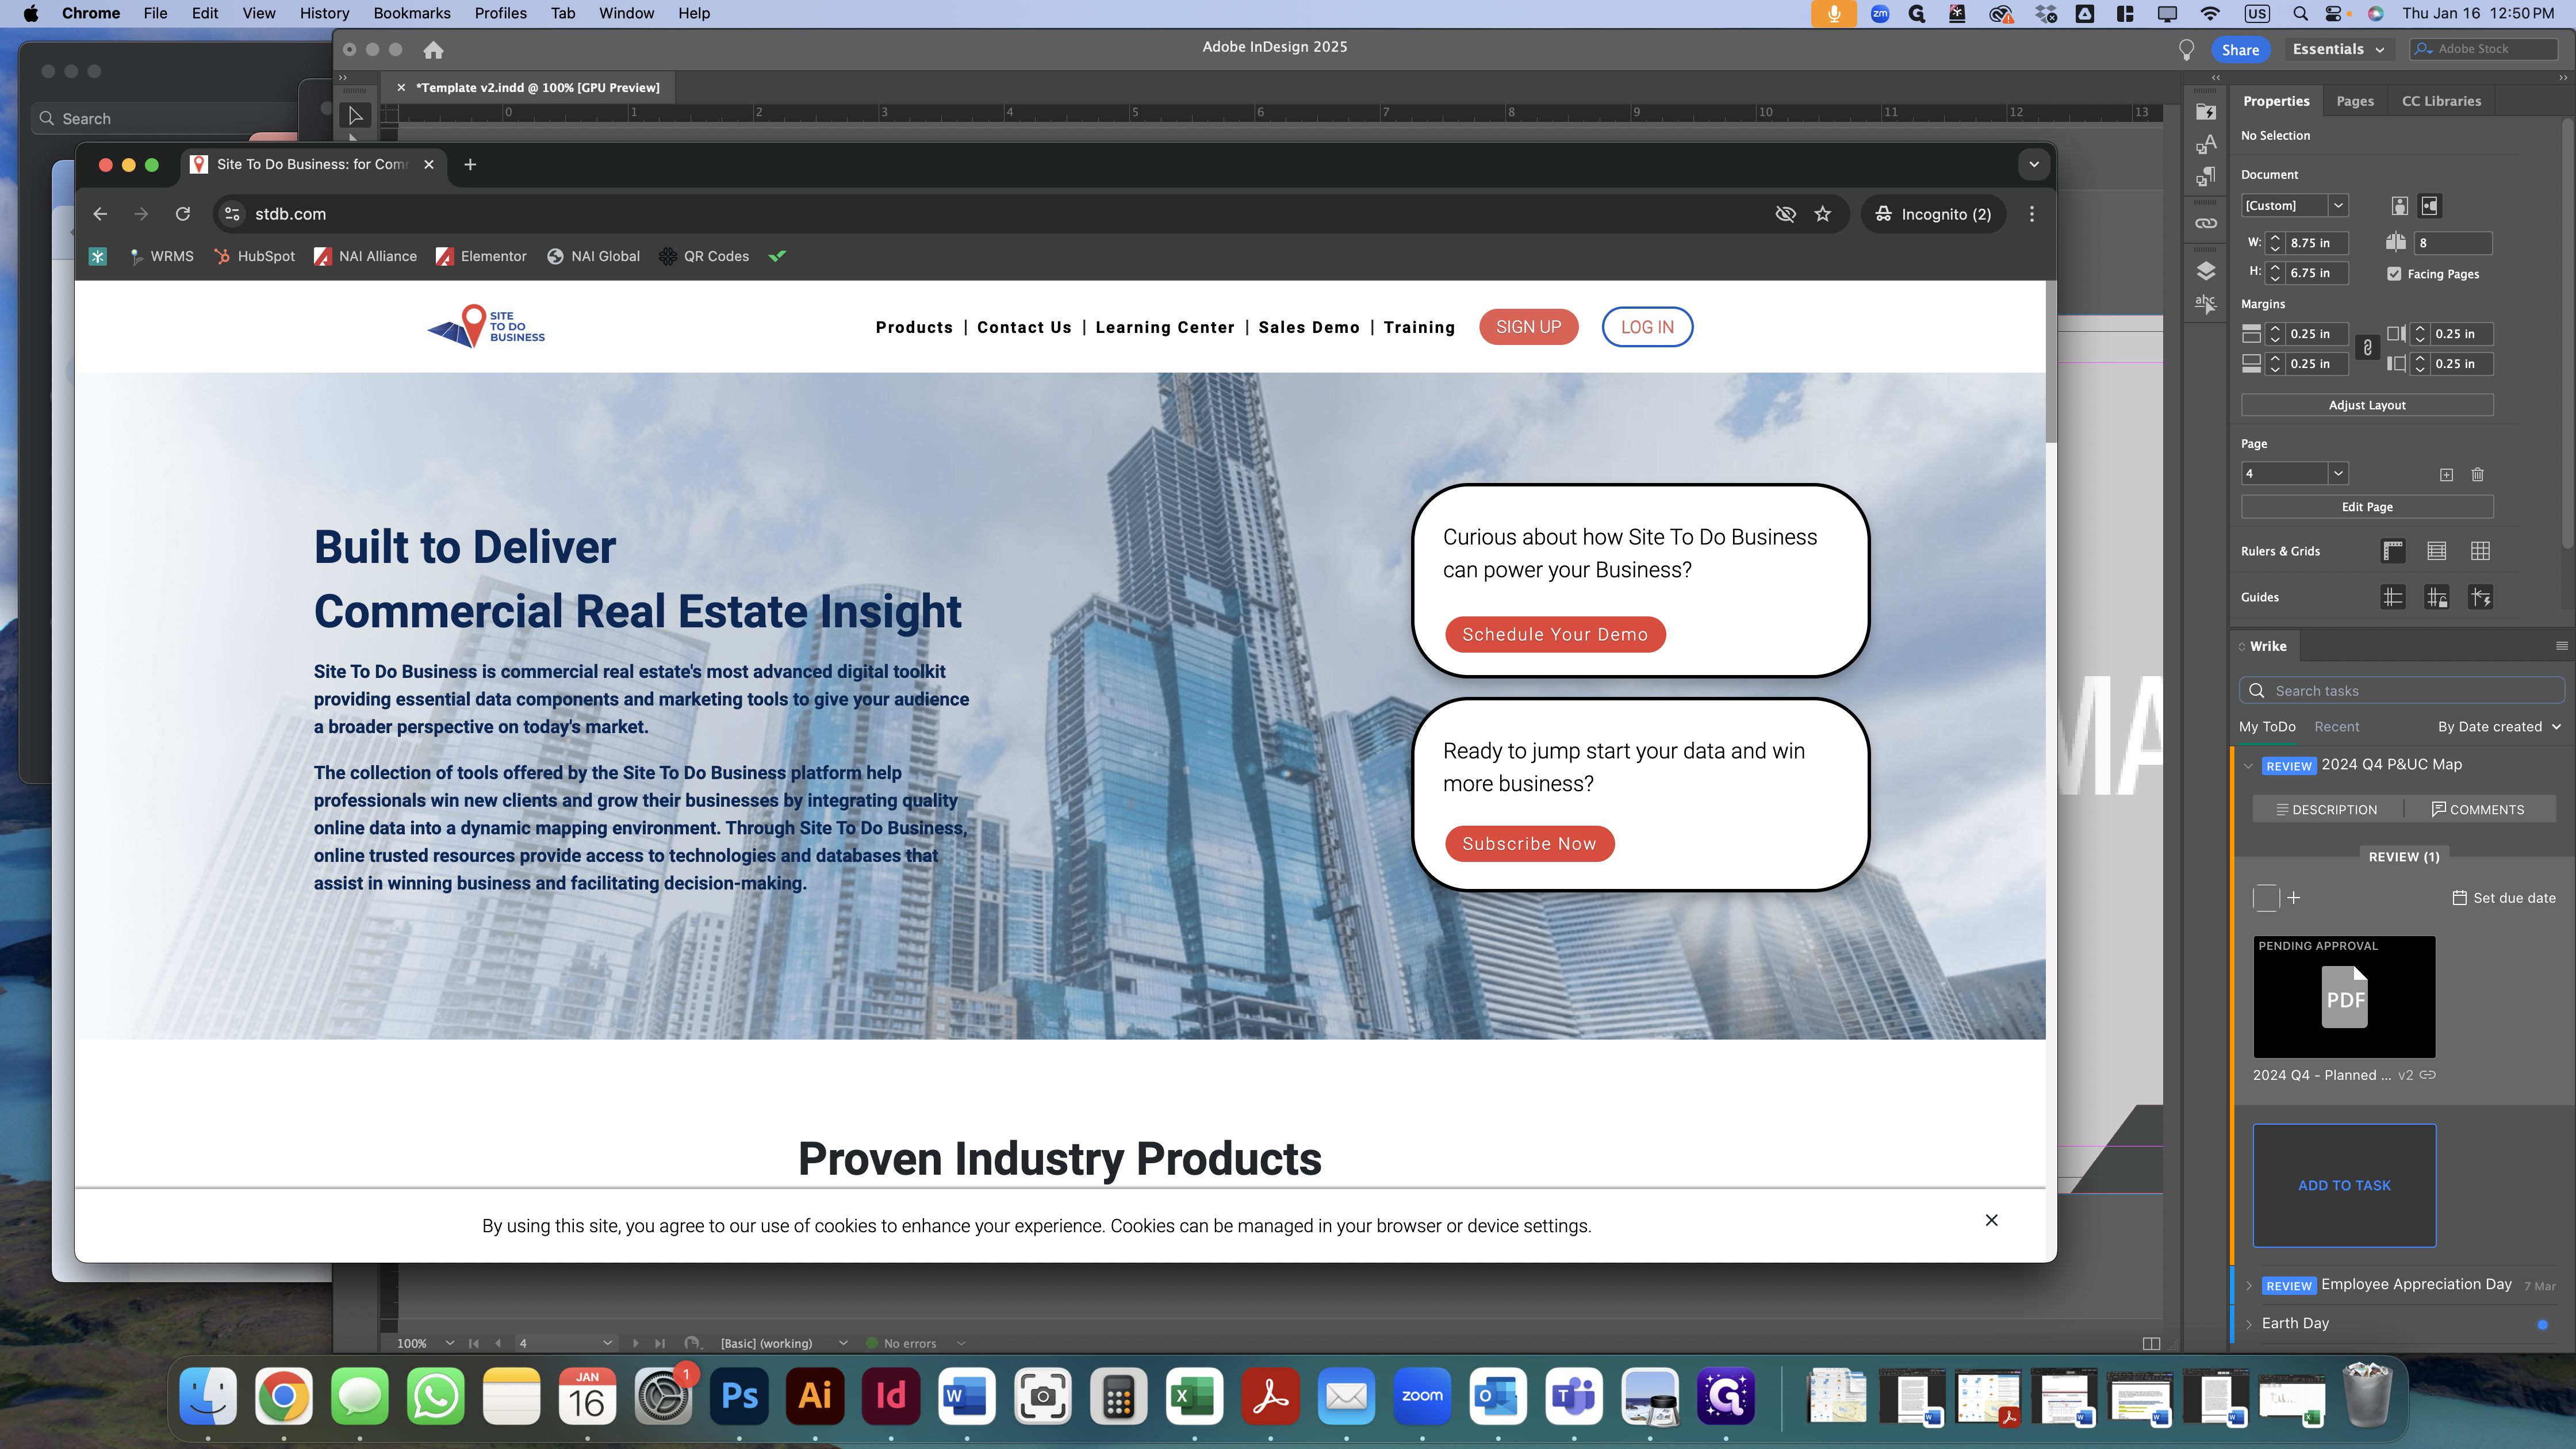
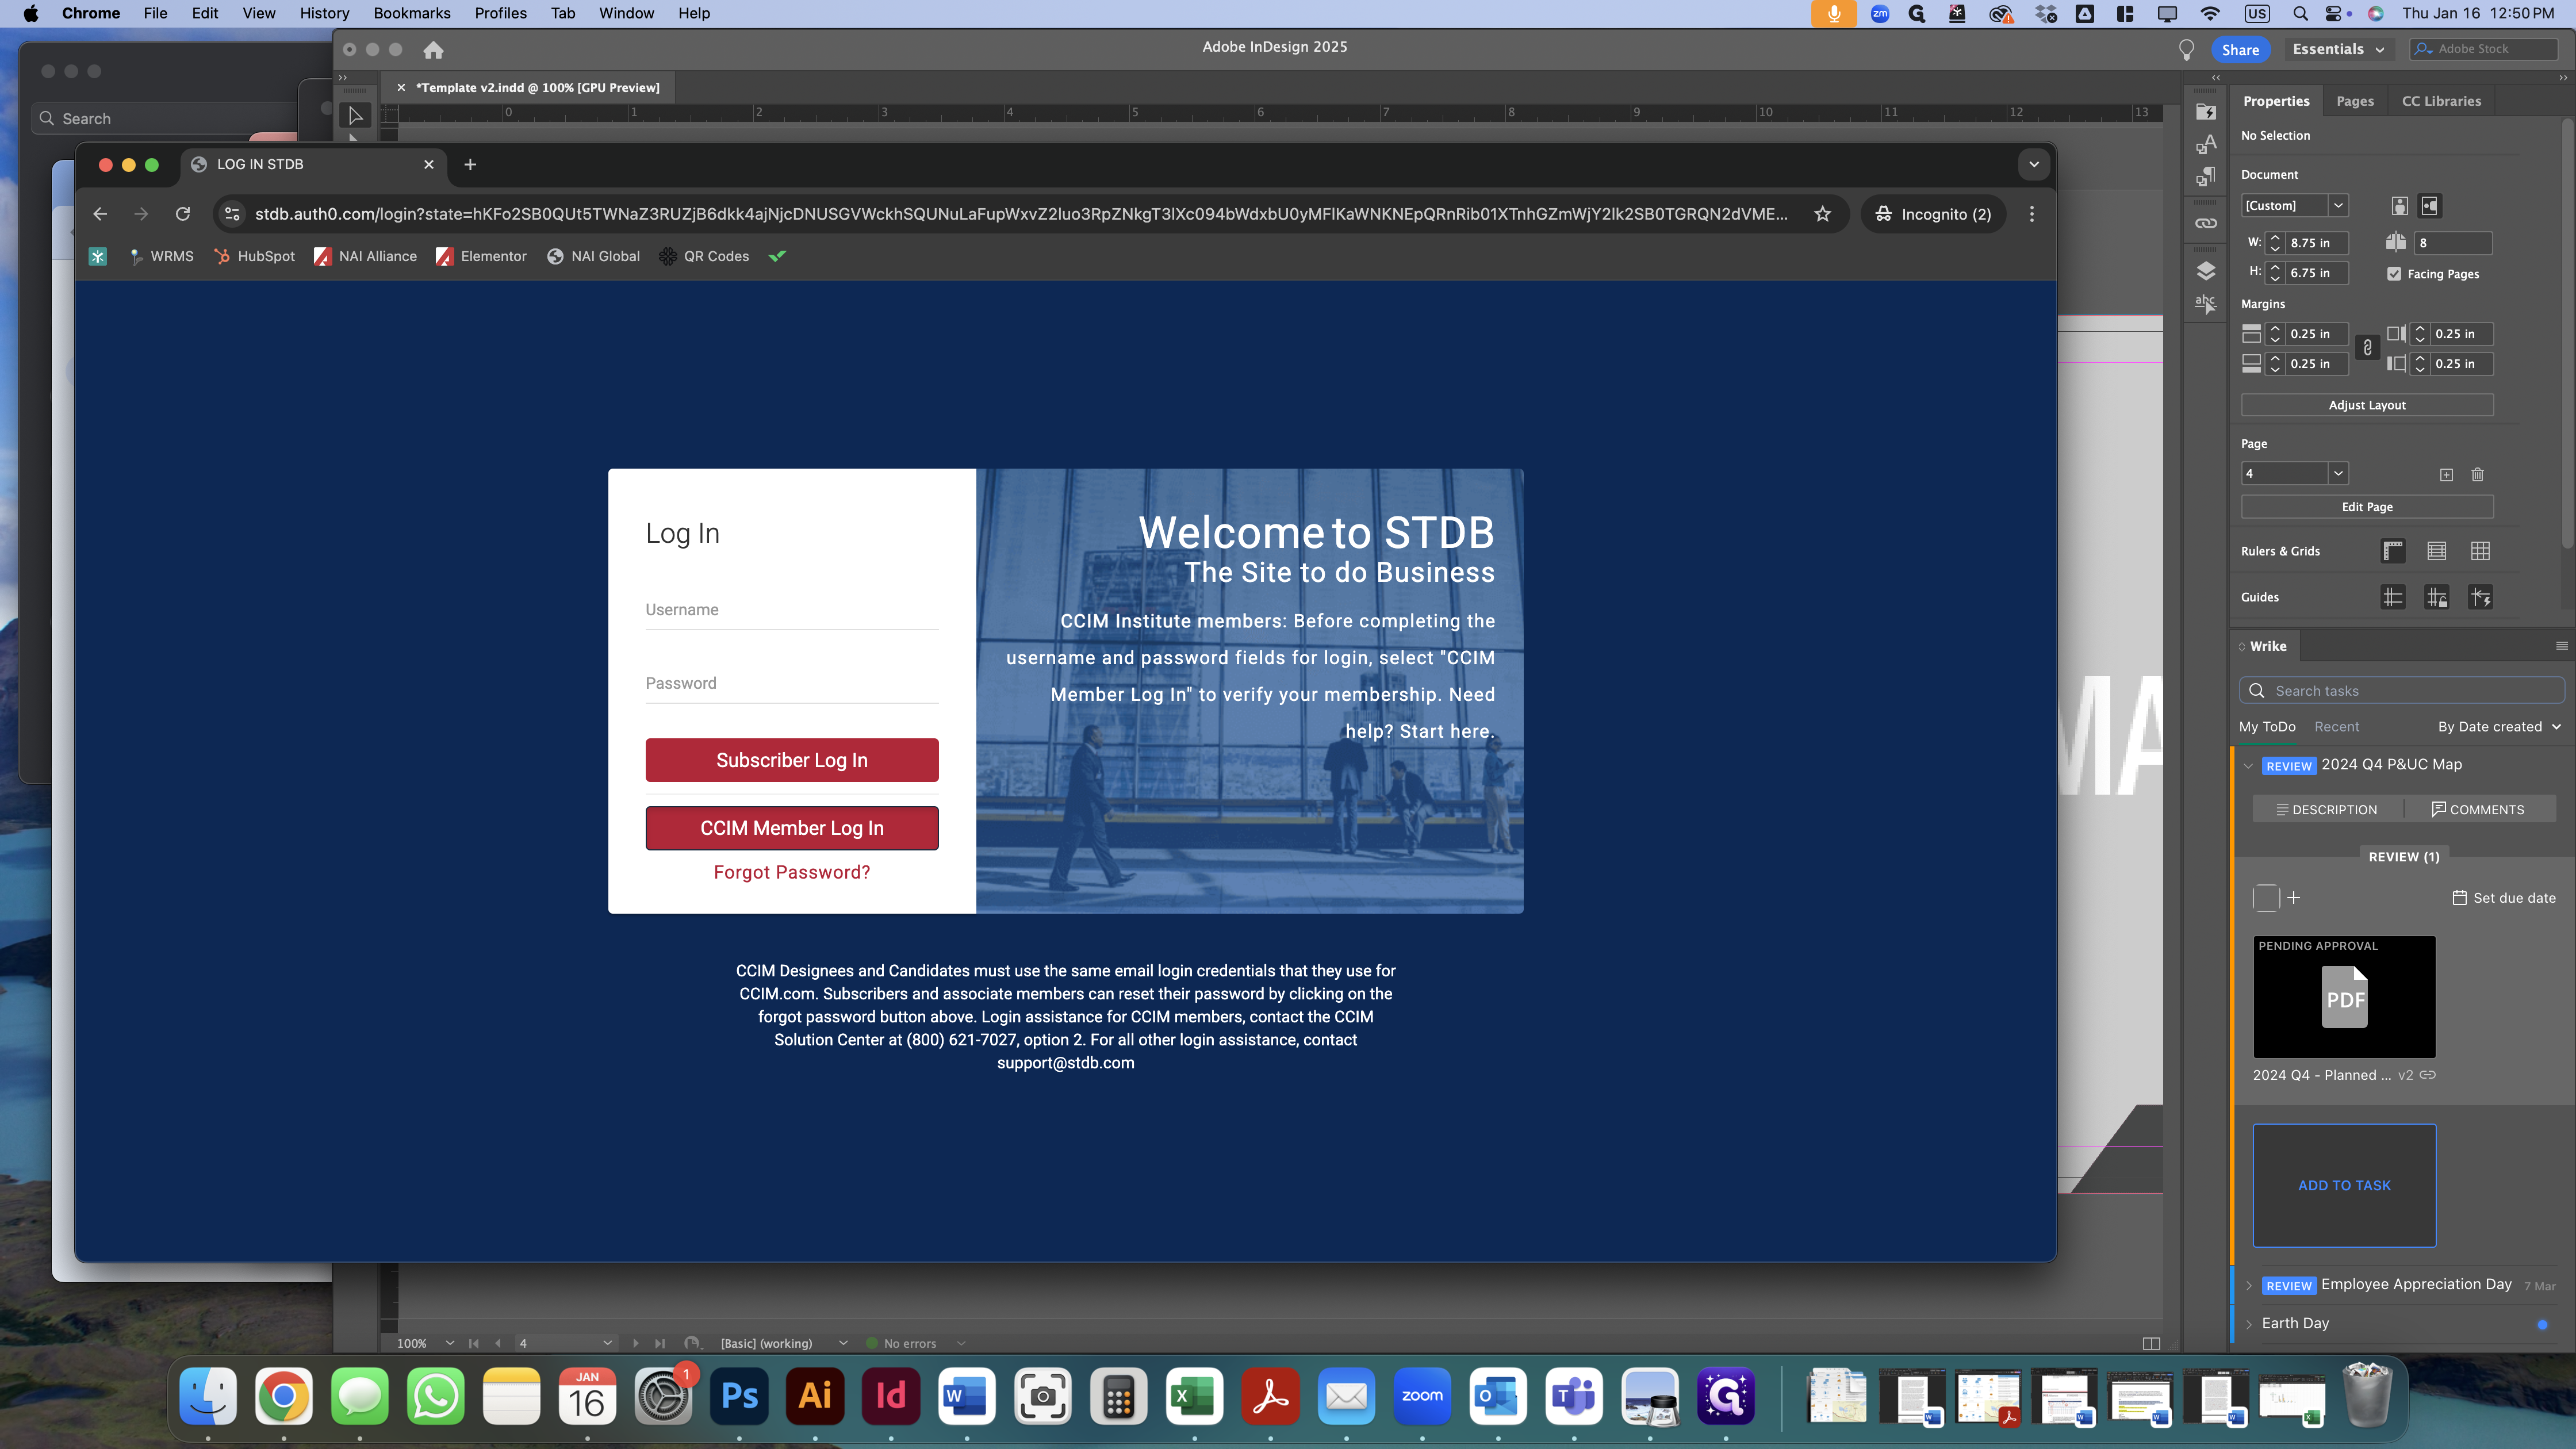
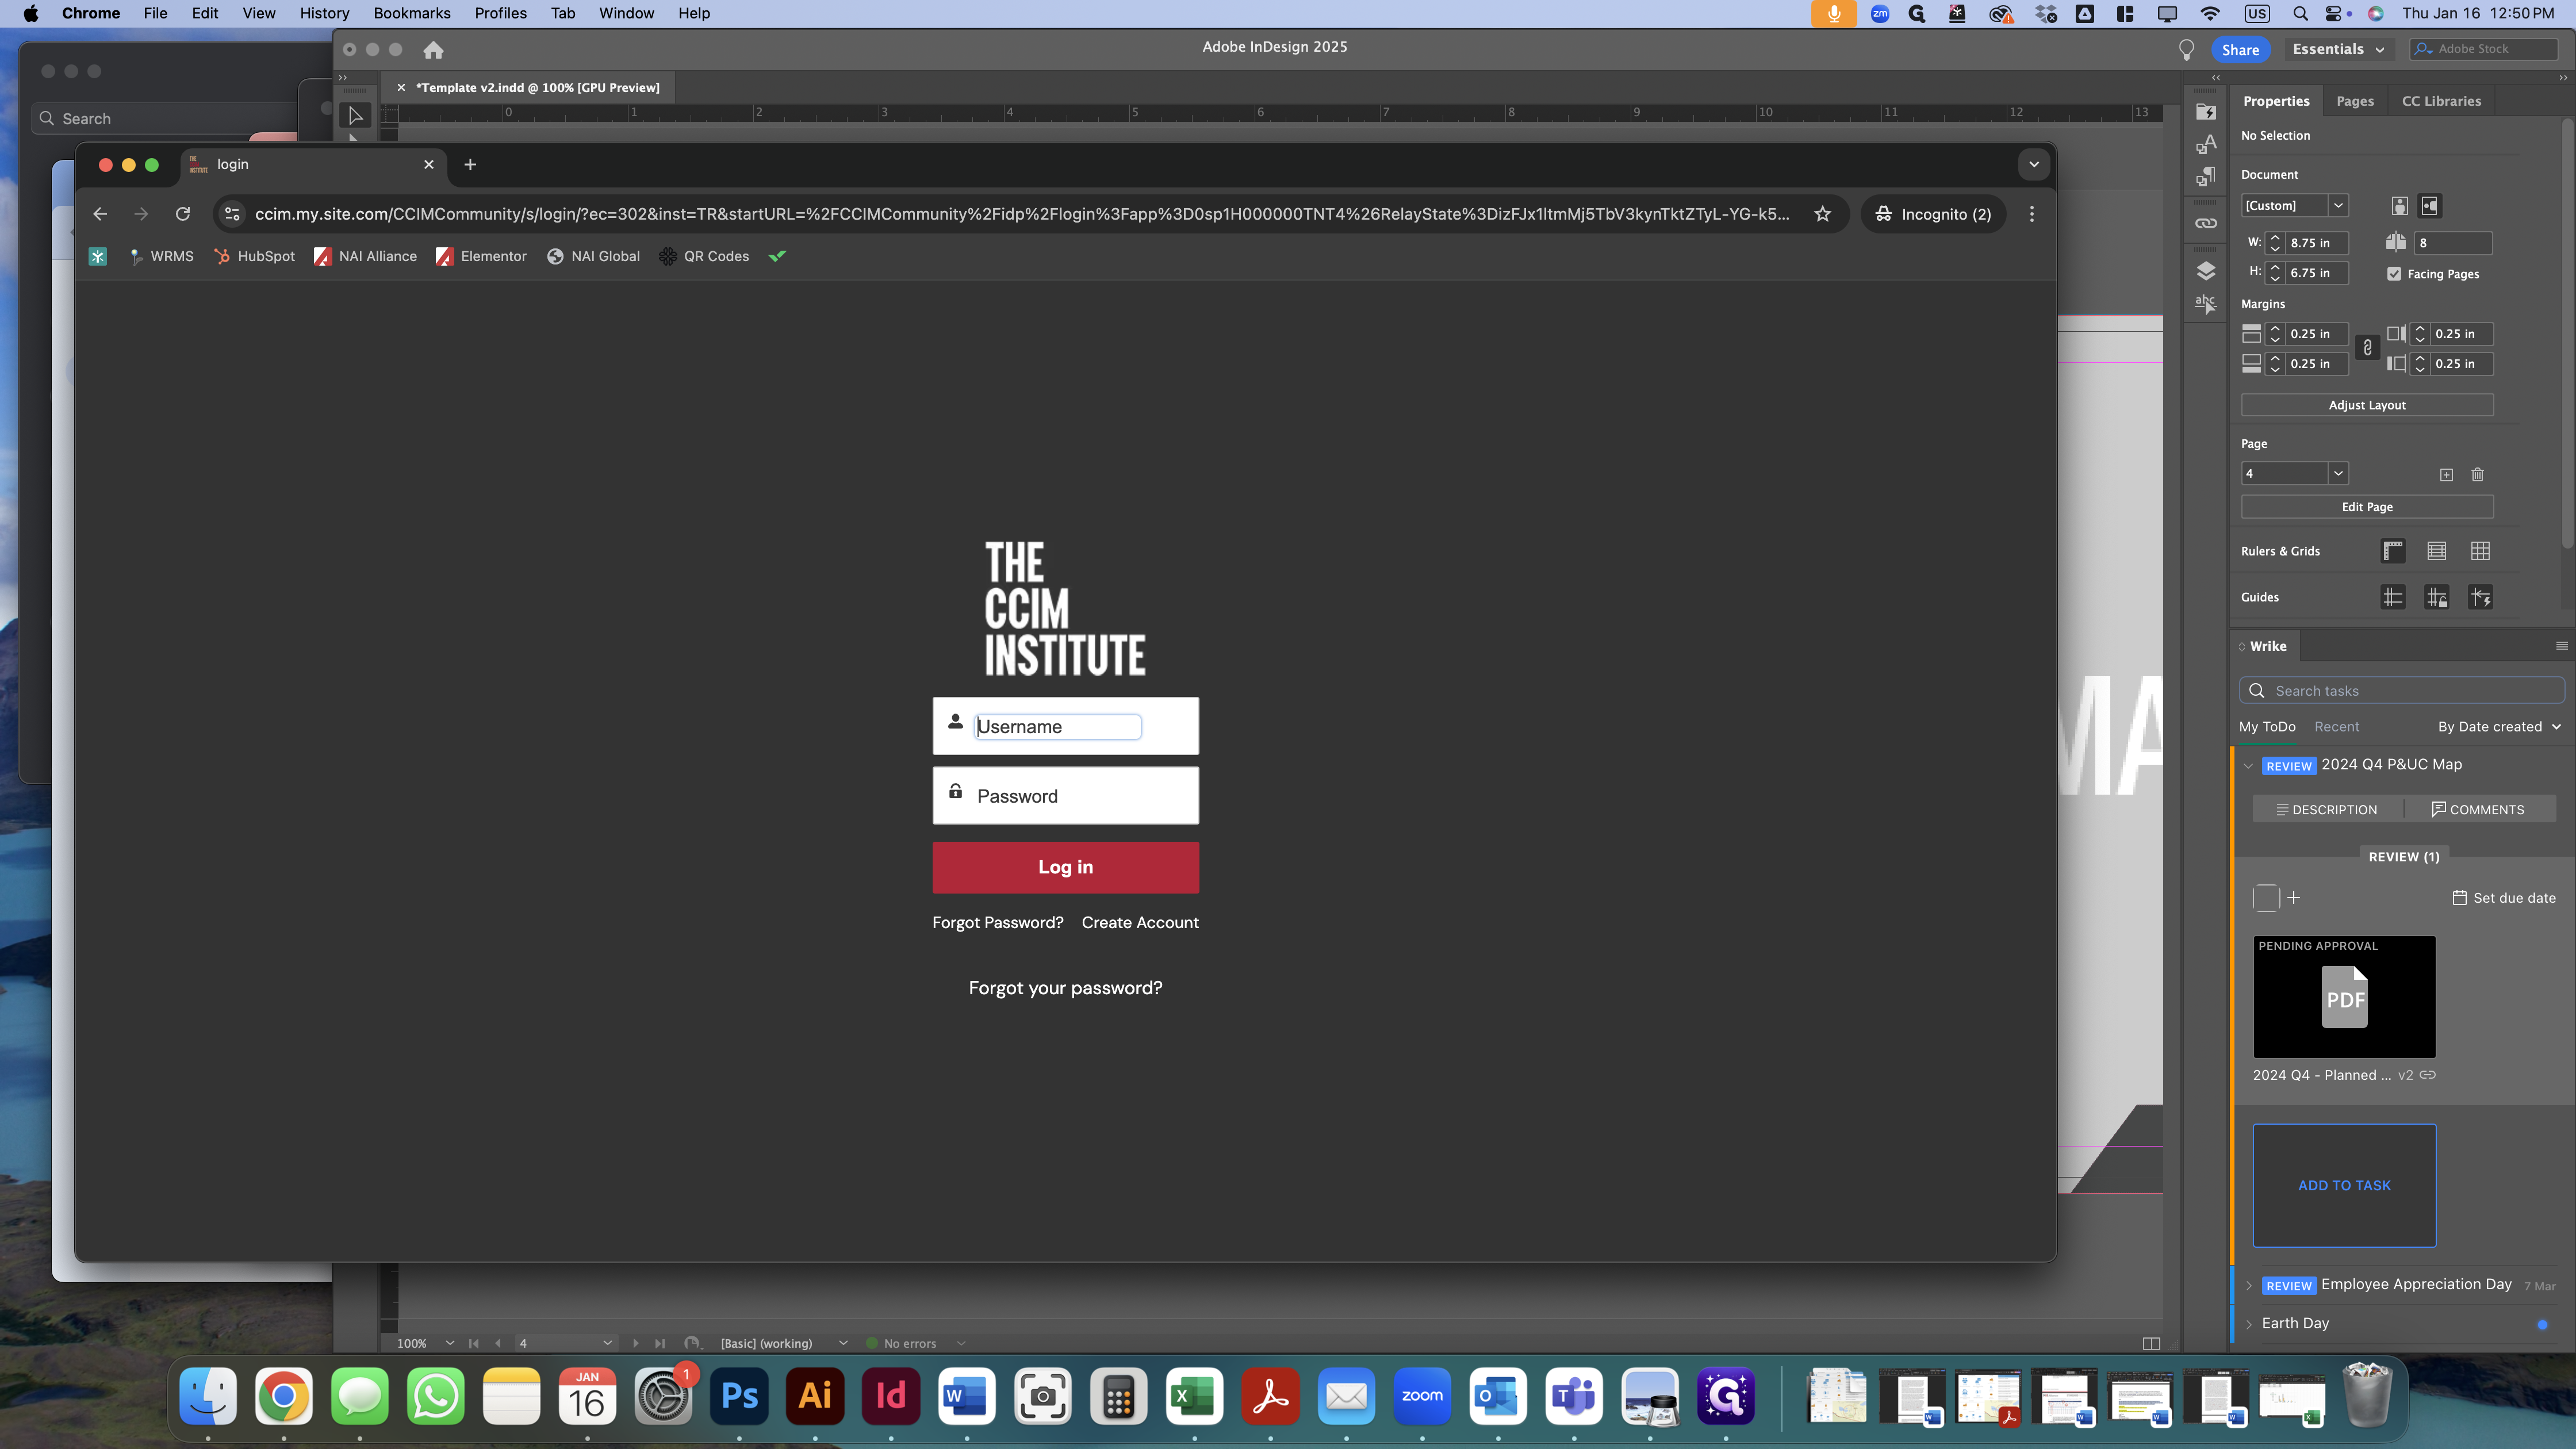
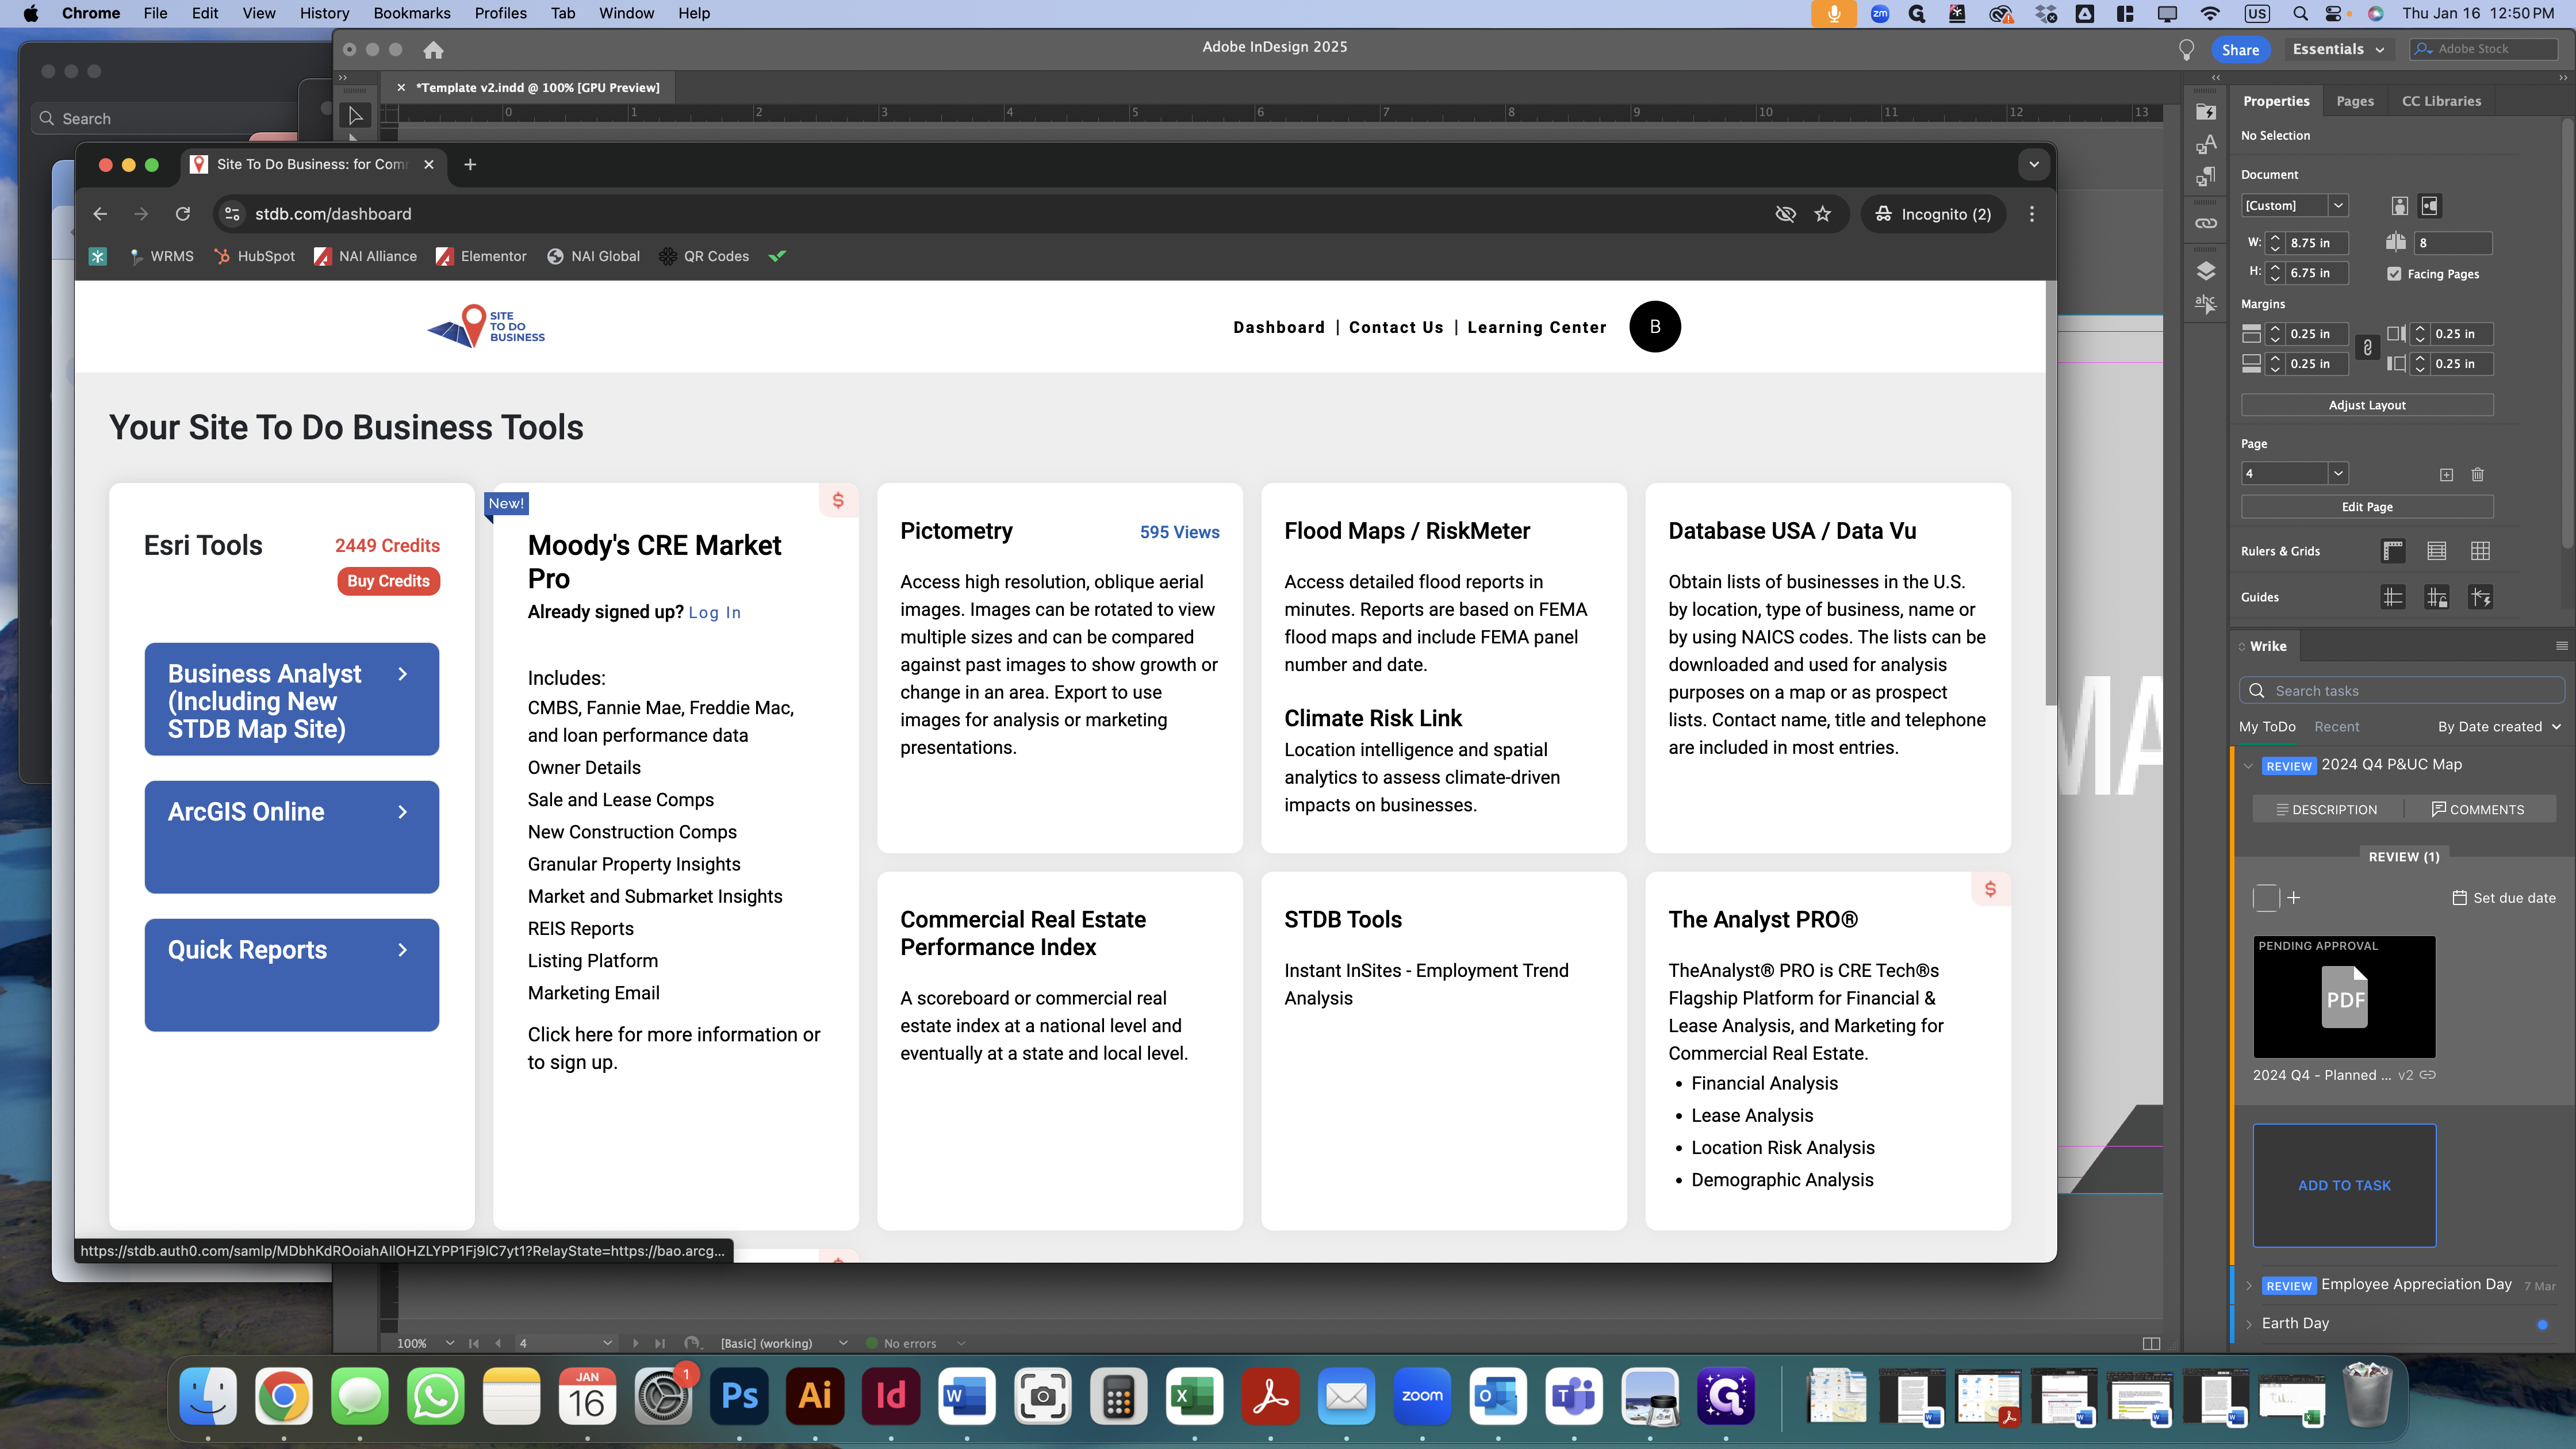
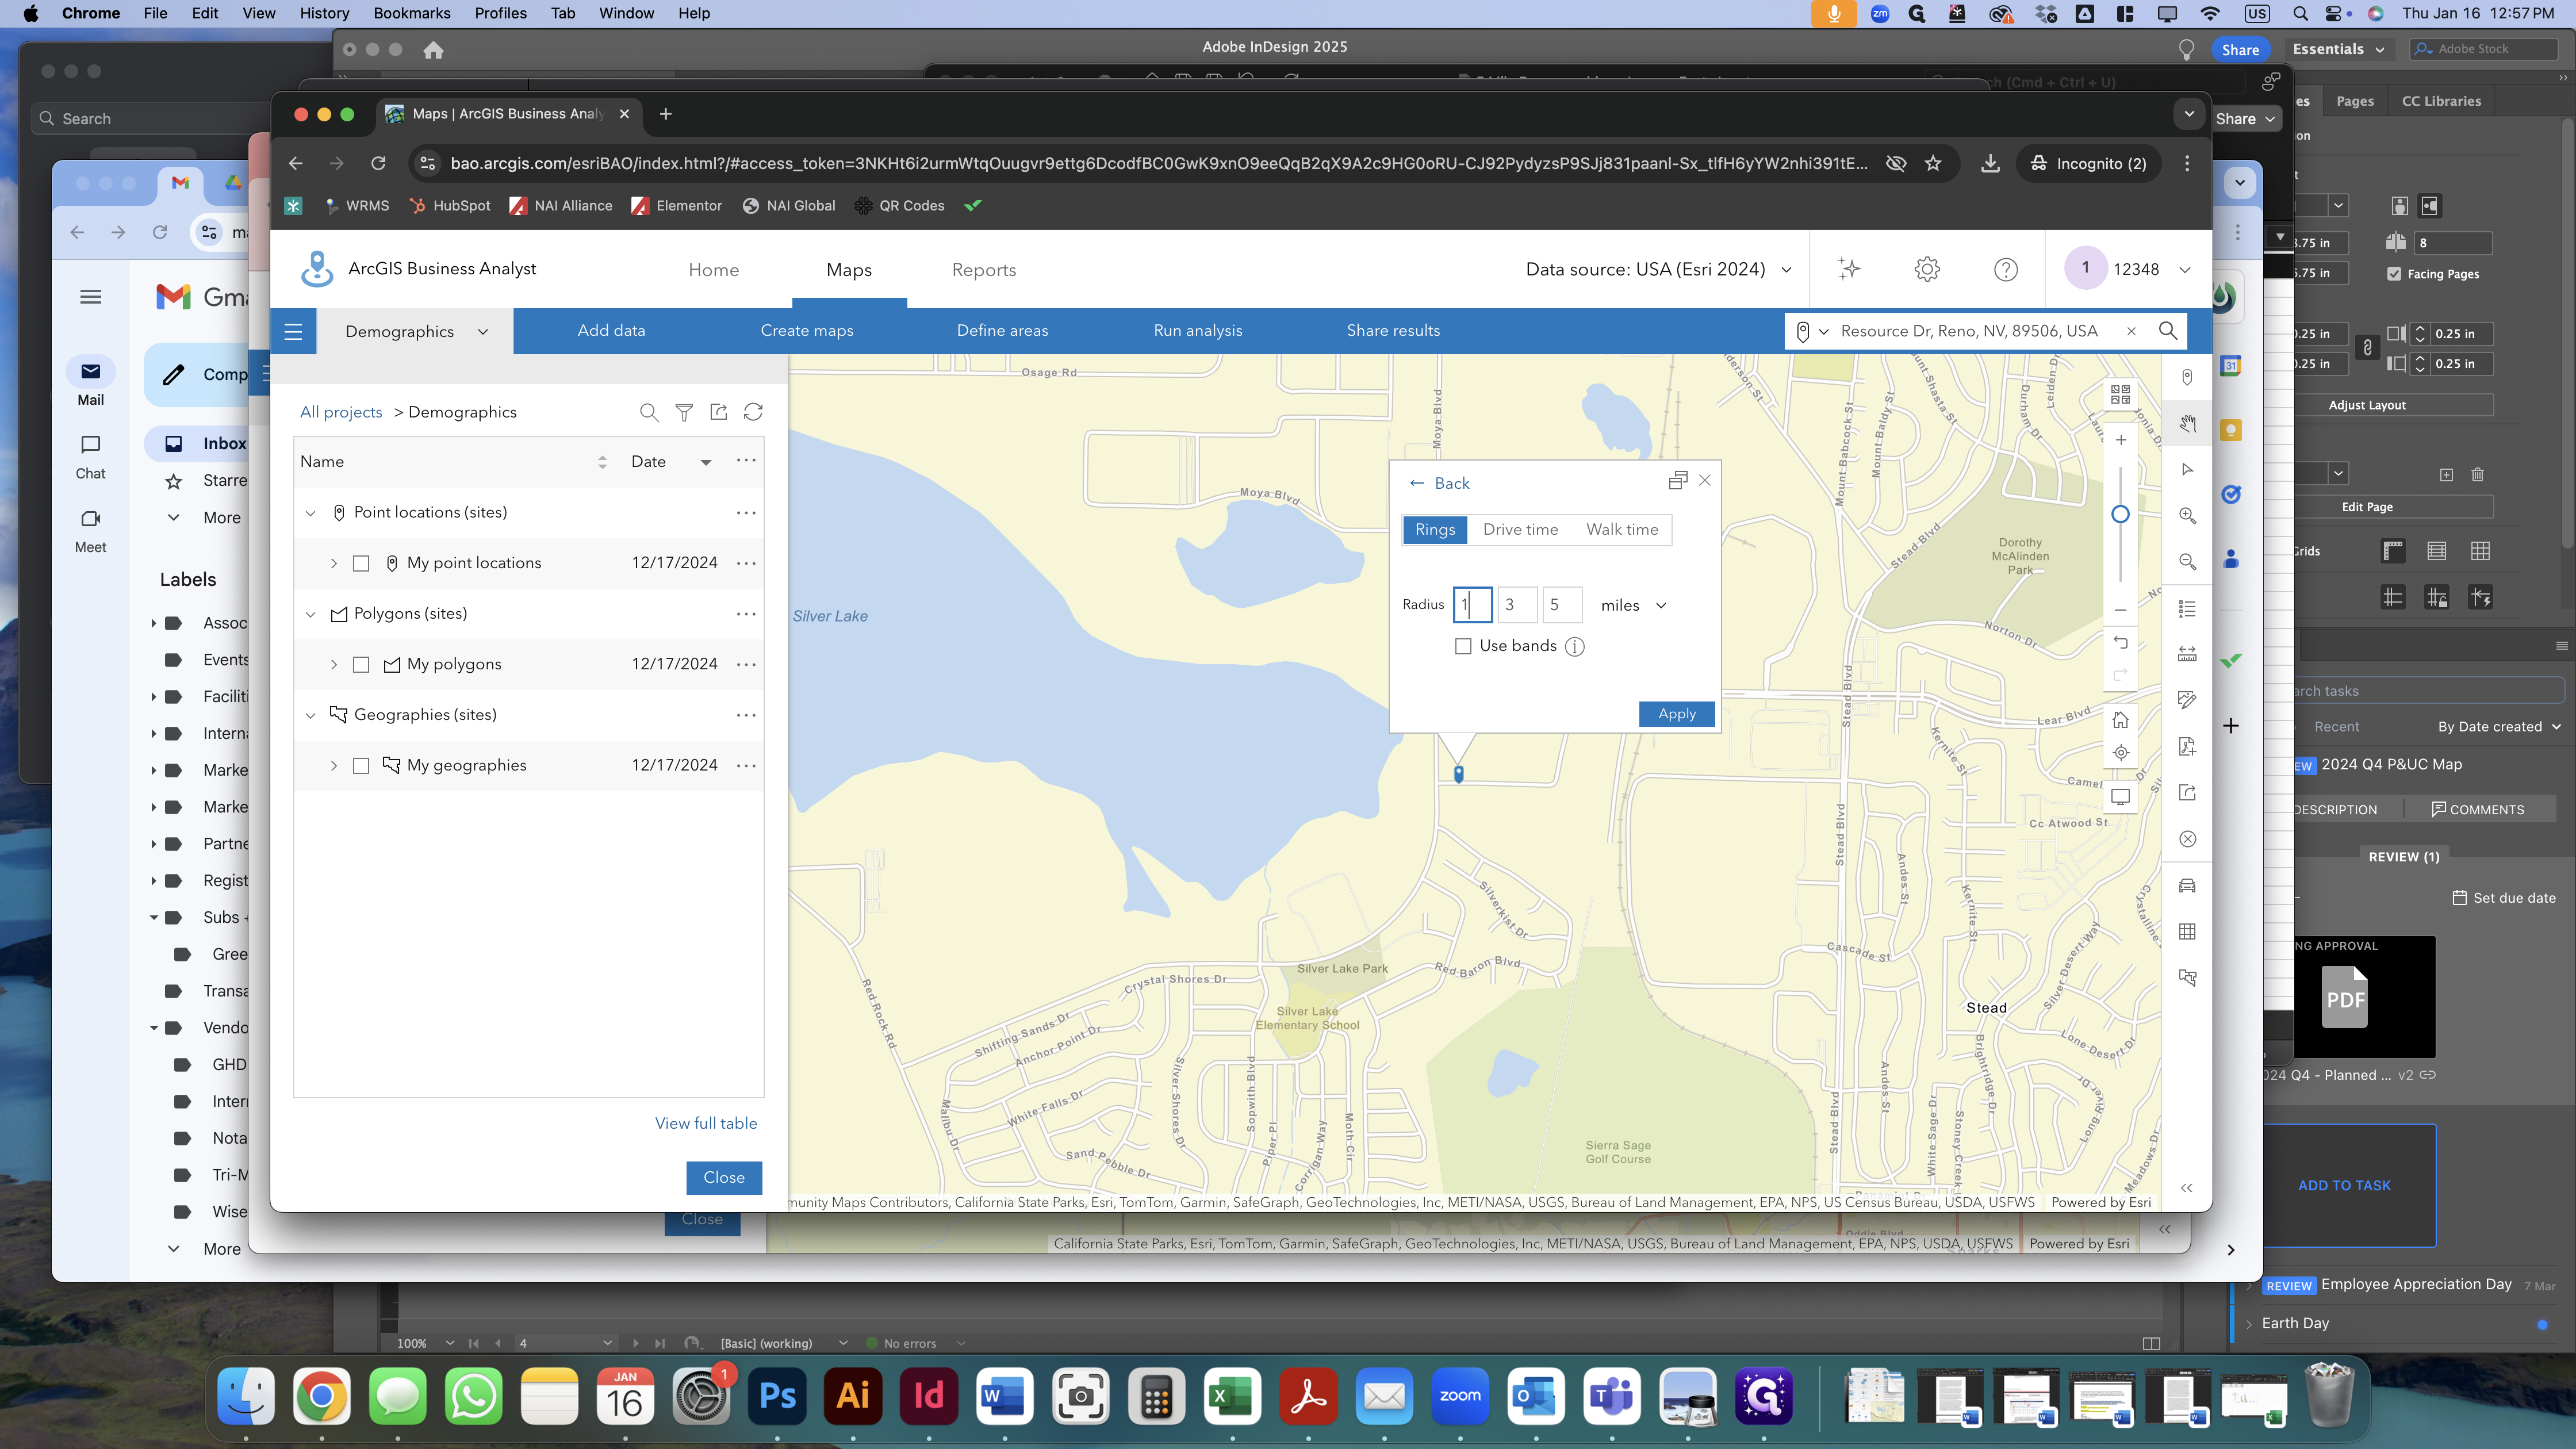
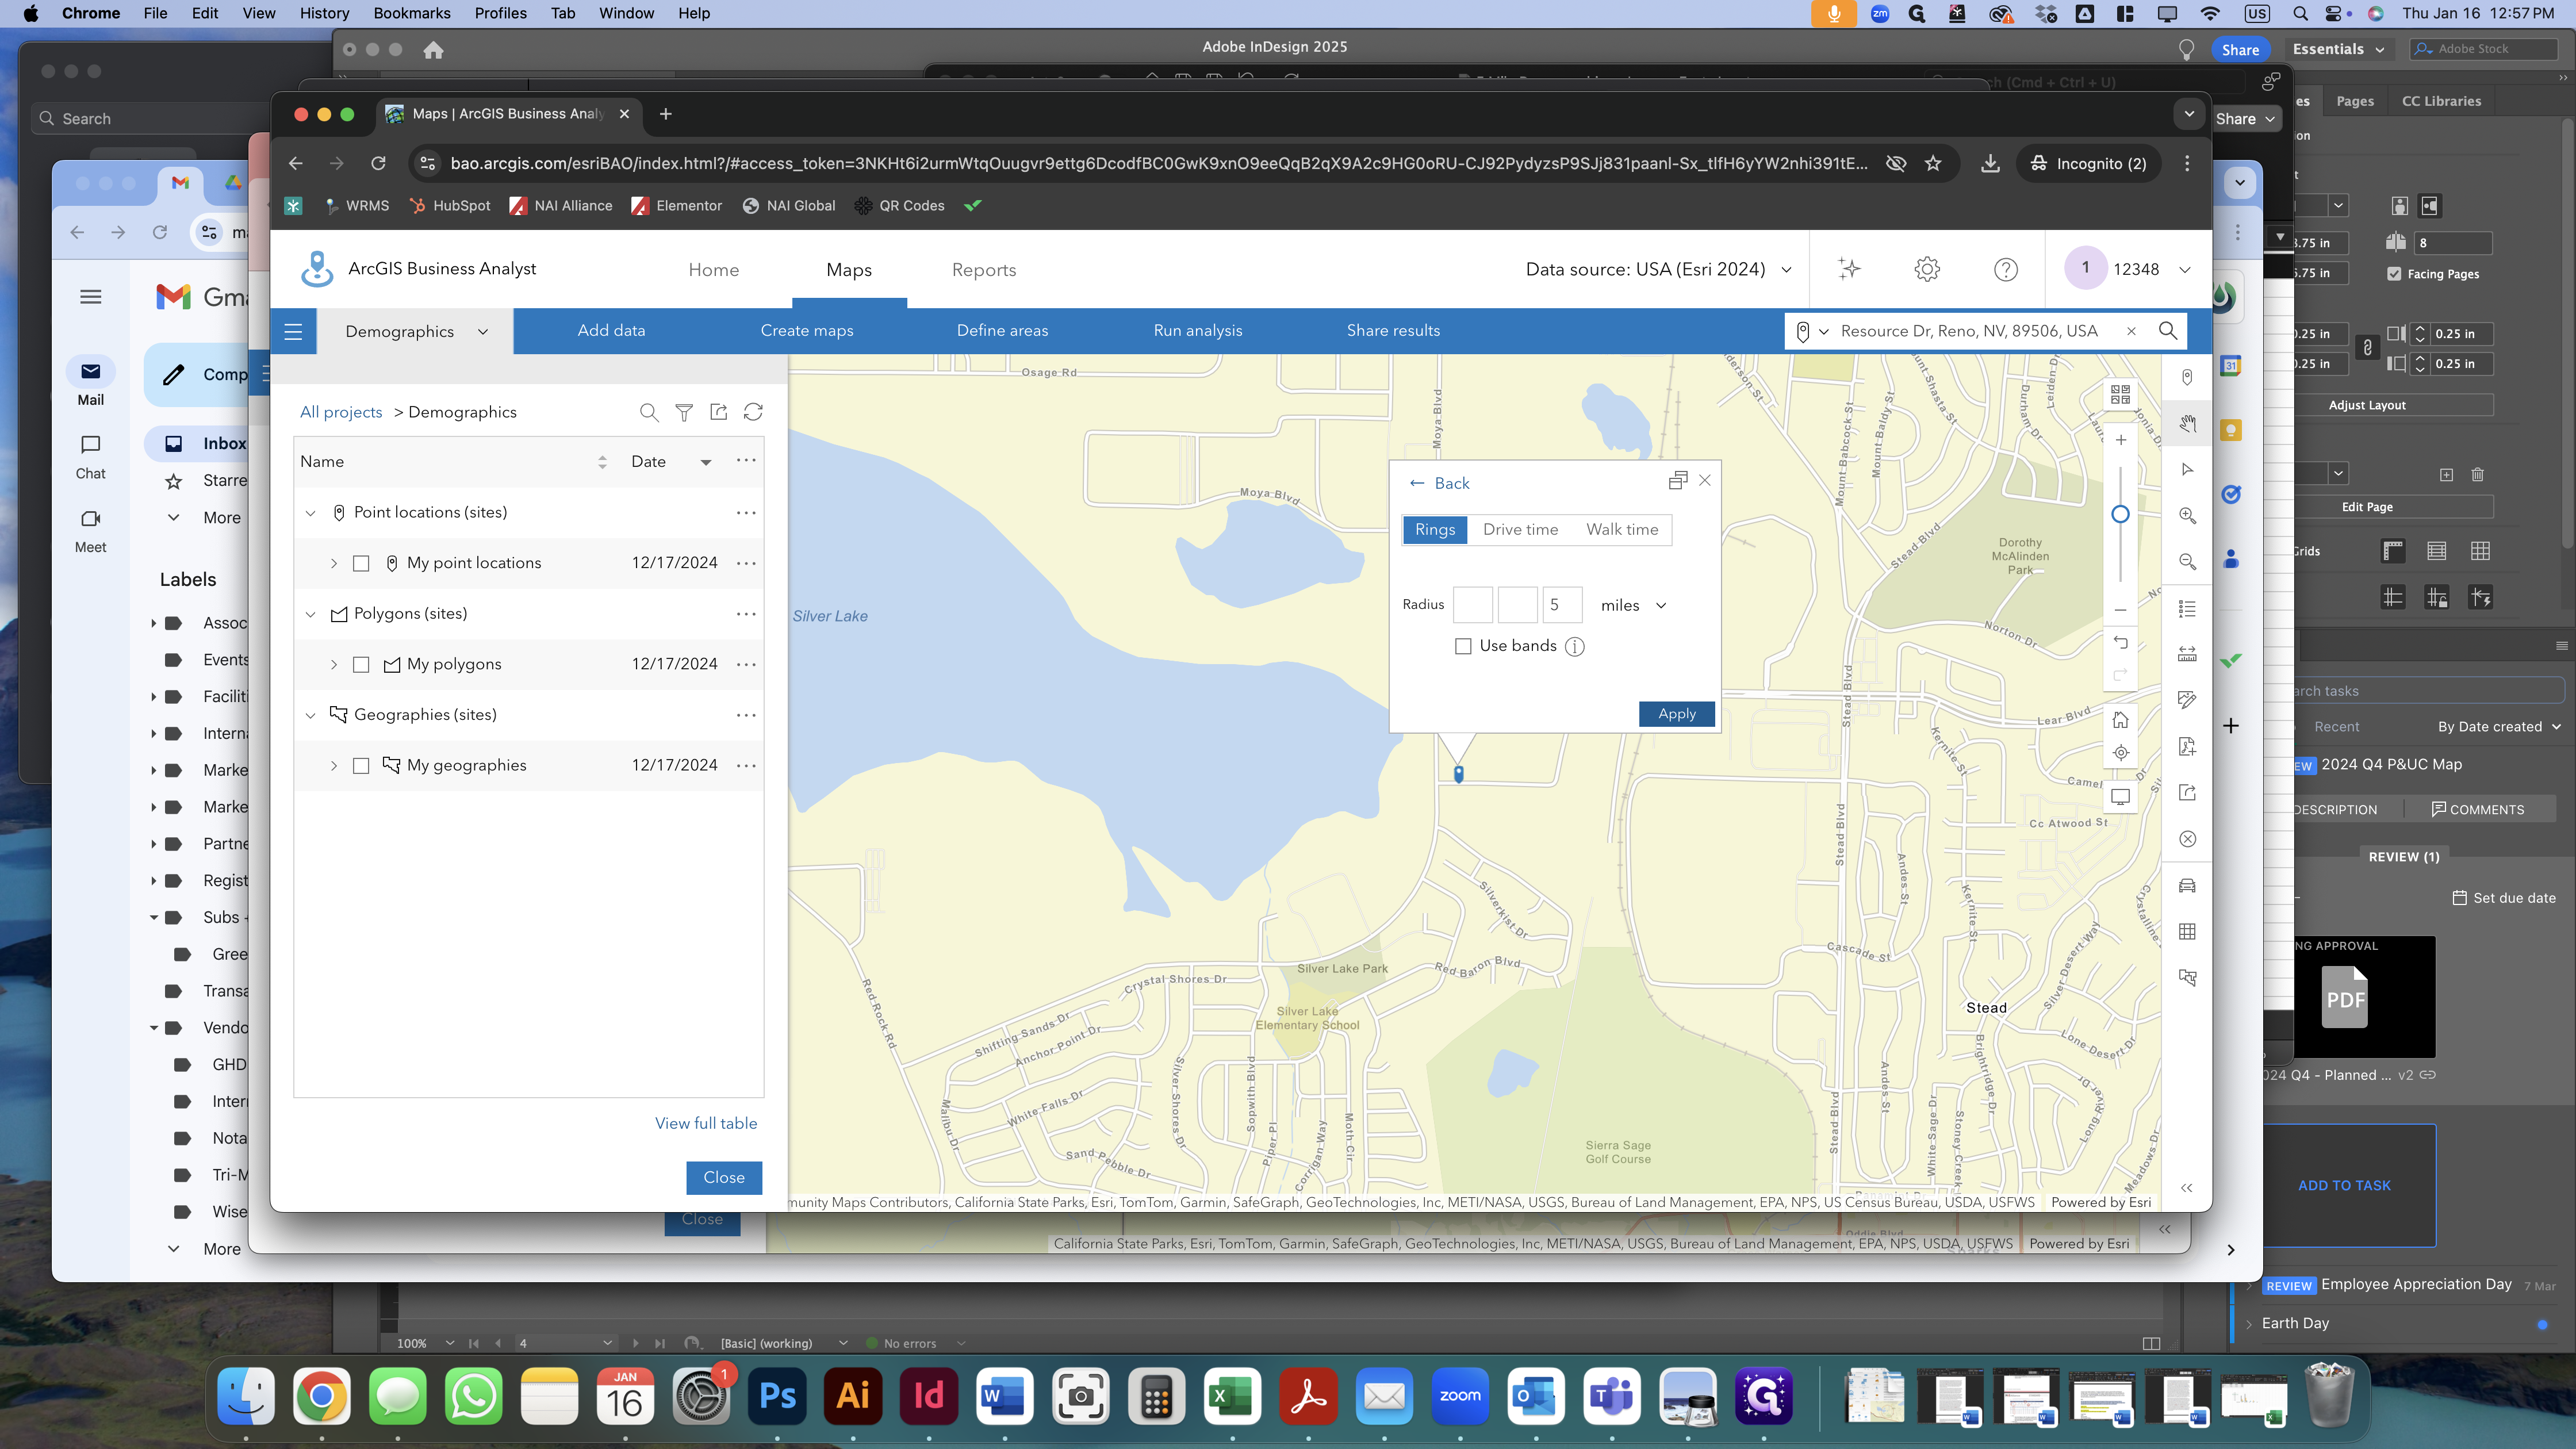
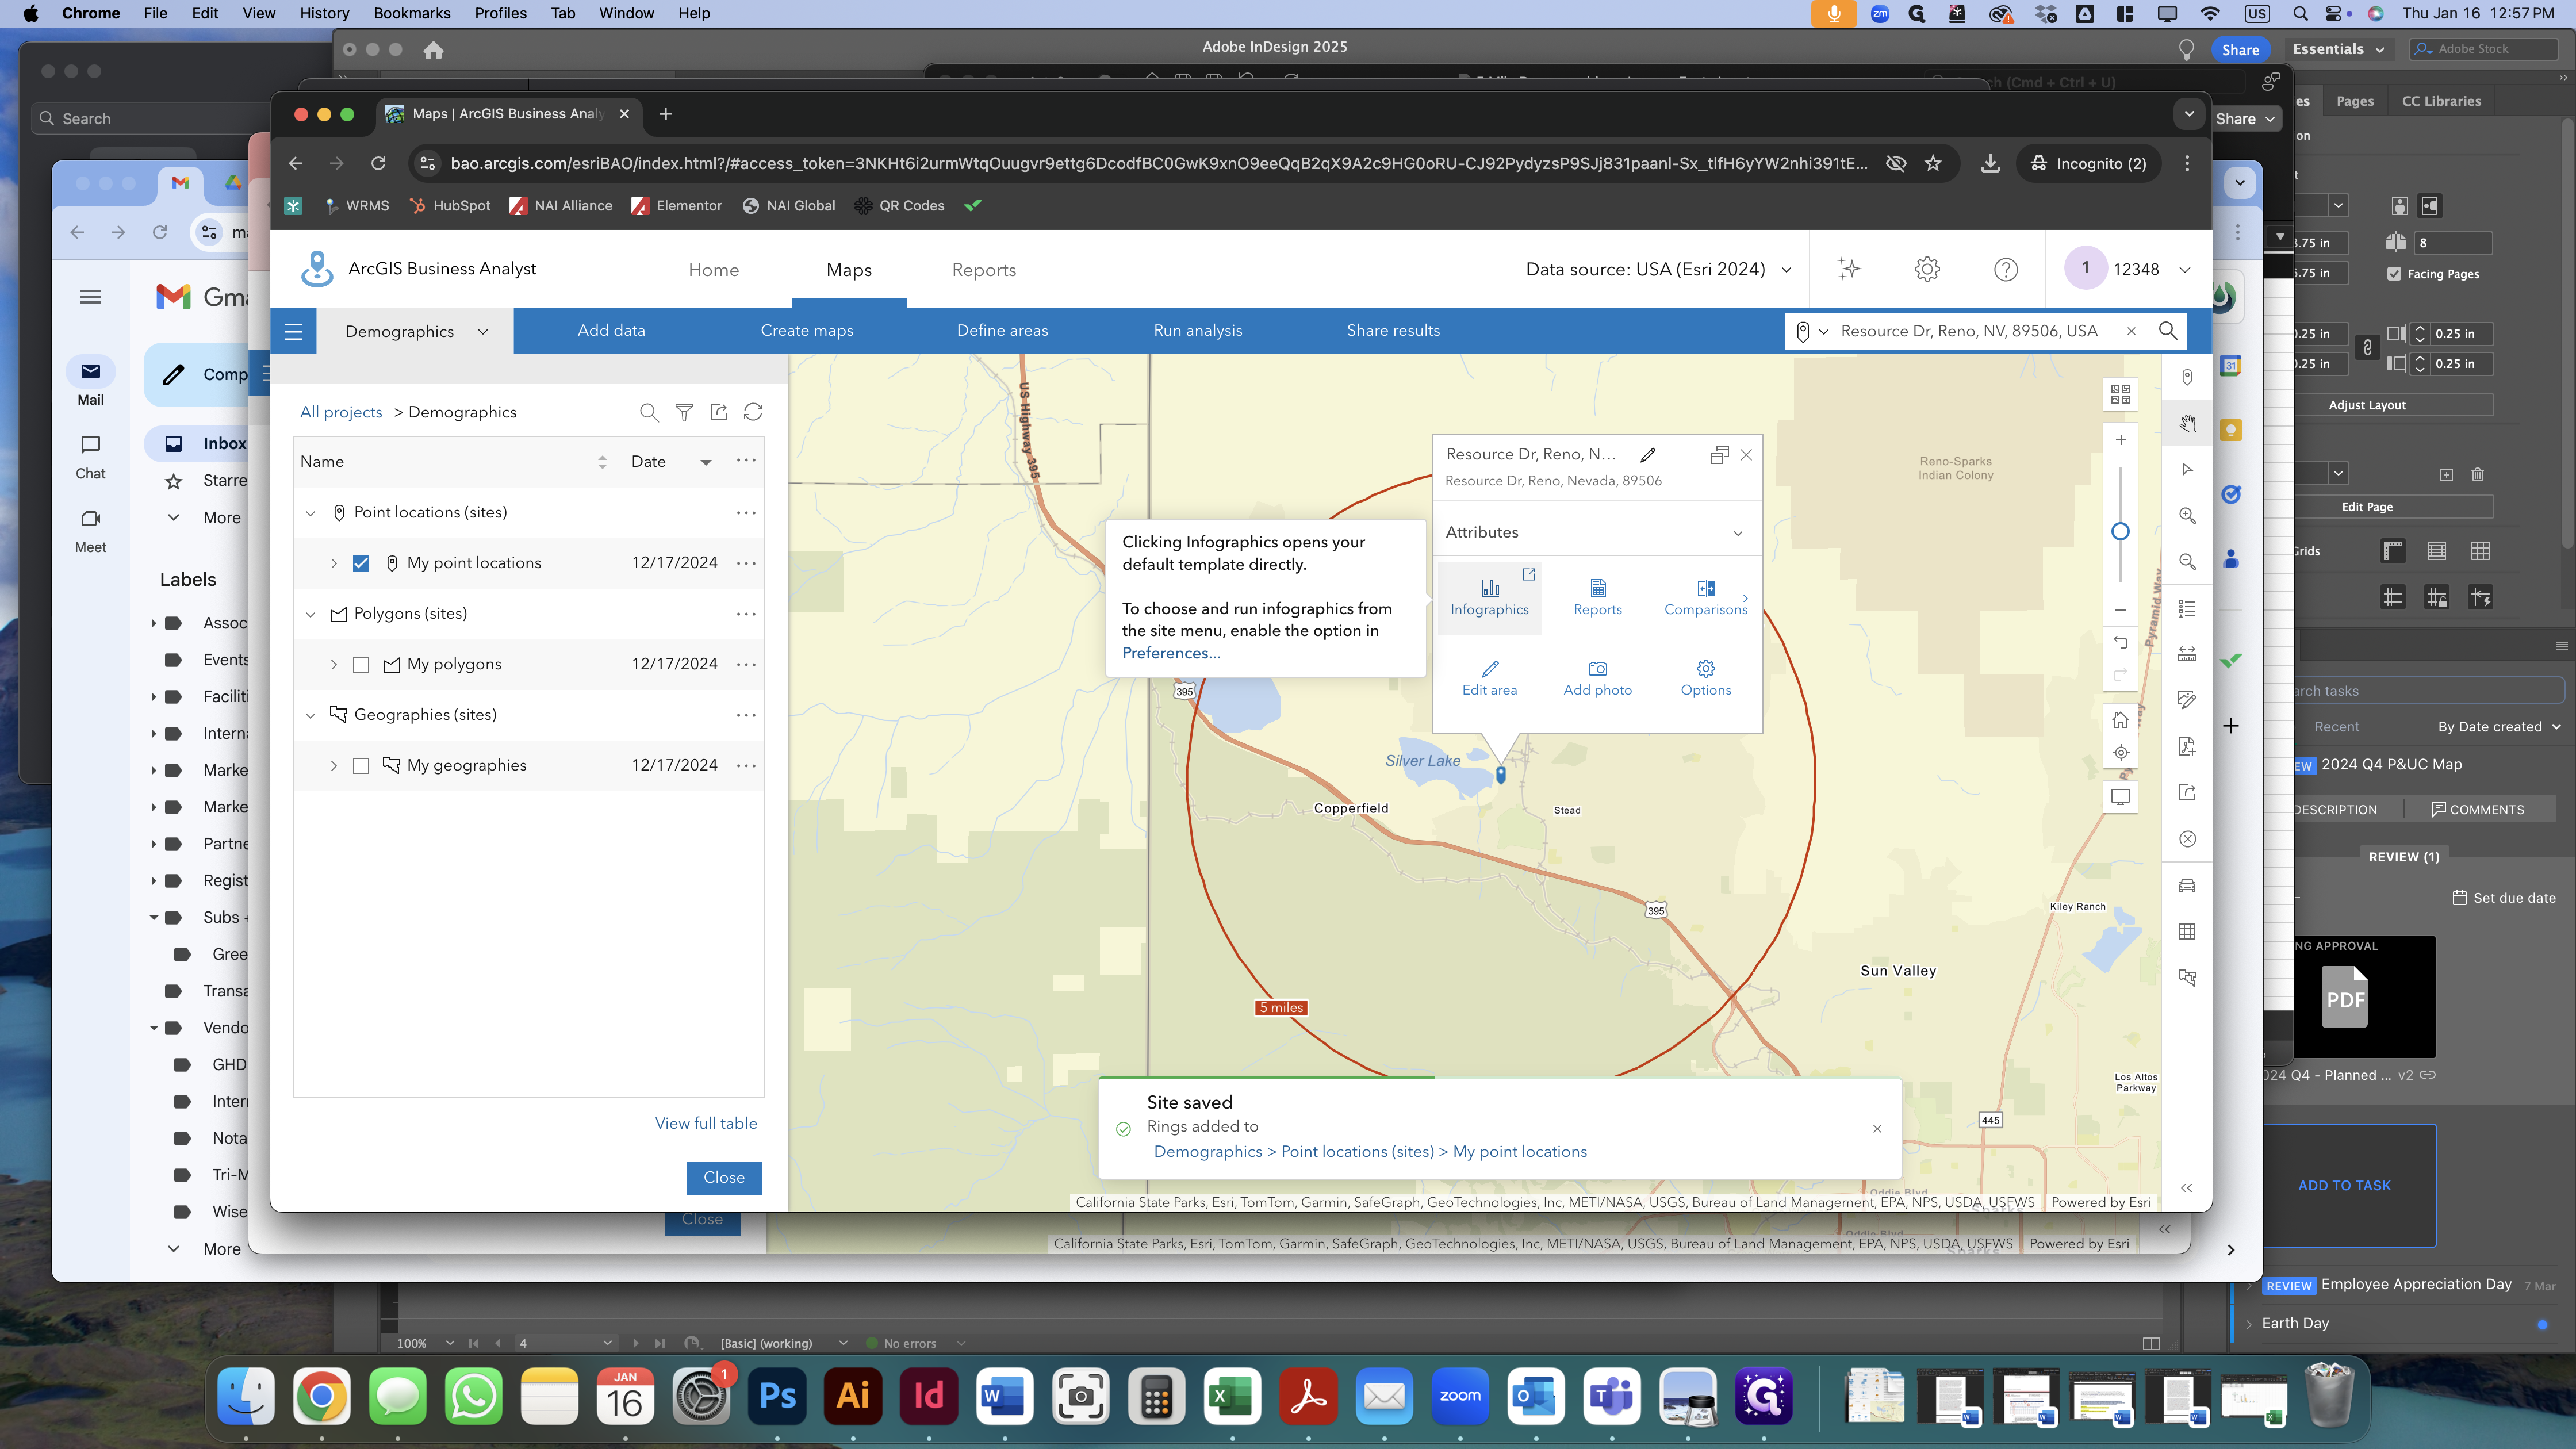
First, open your internet browser and go to Site to do Business.
This is where we'll obtain the demographic information data.
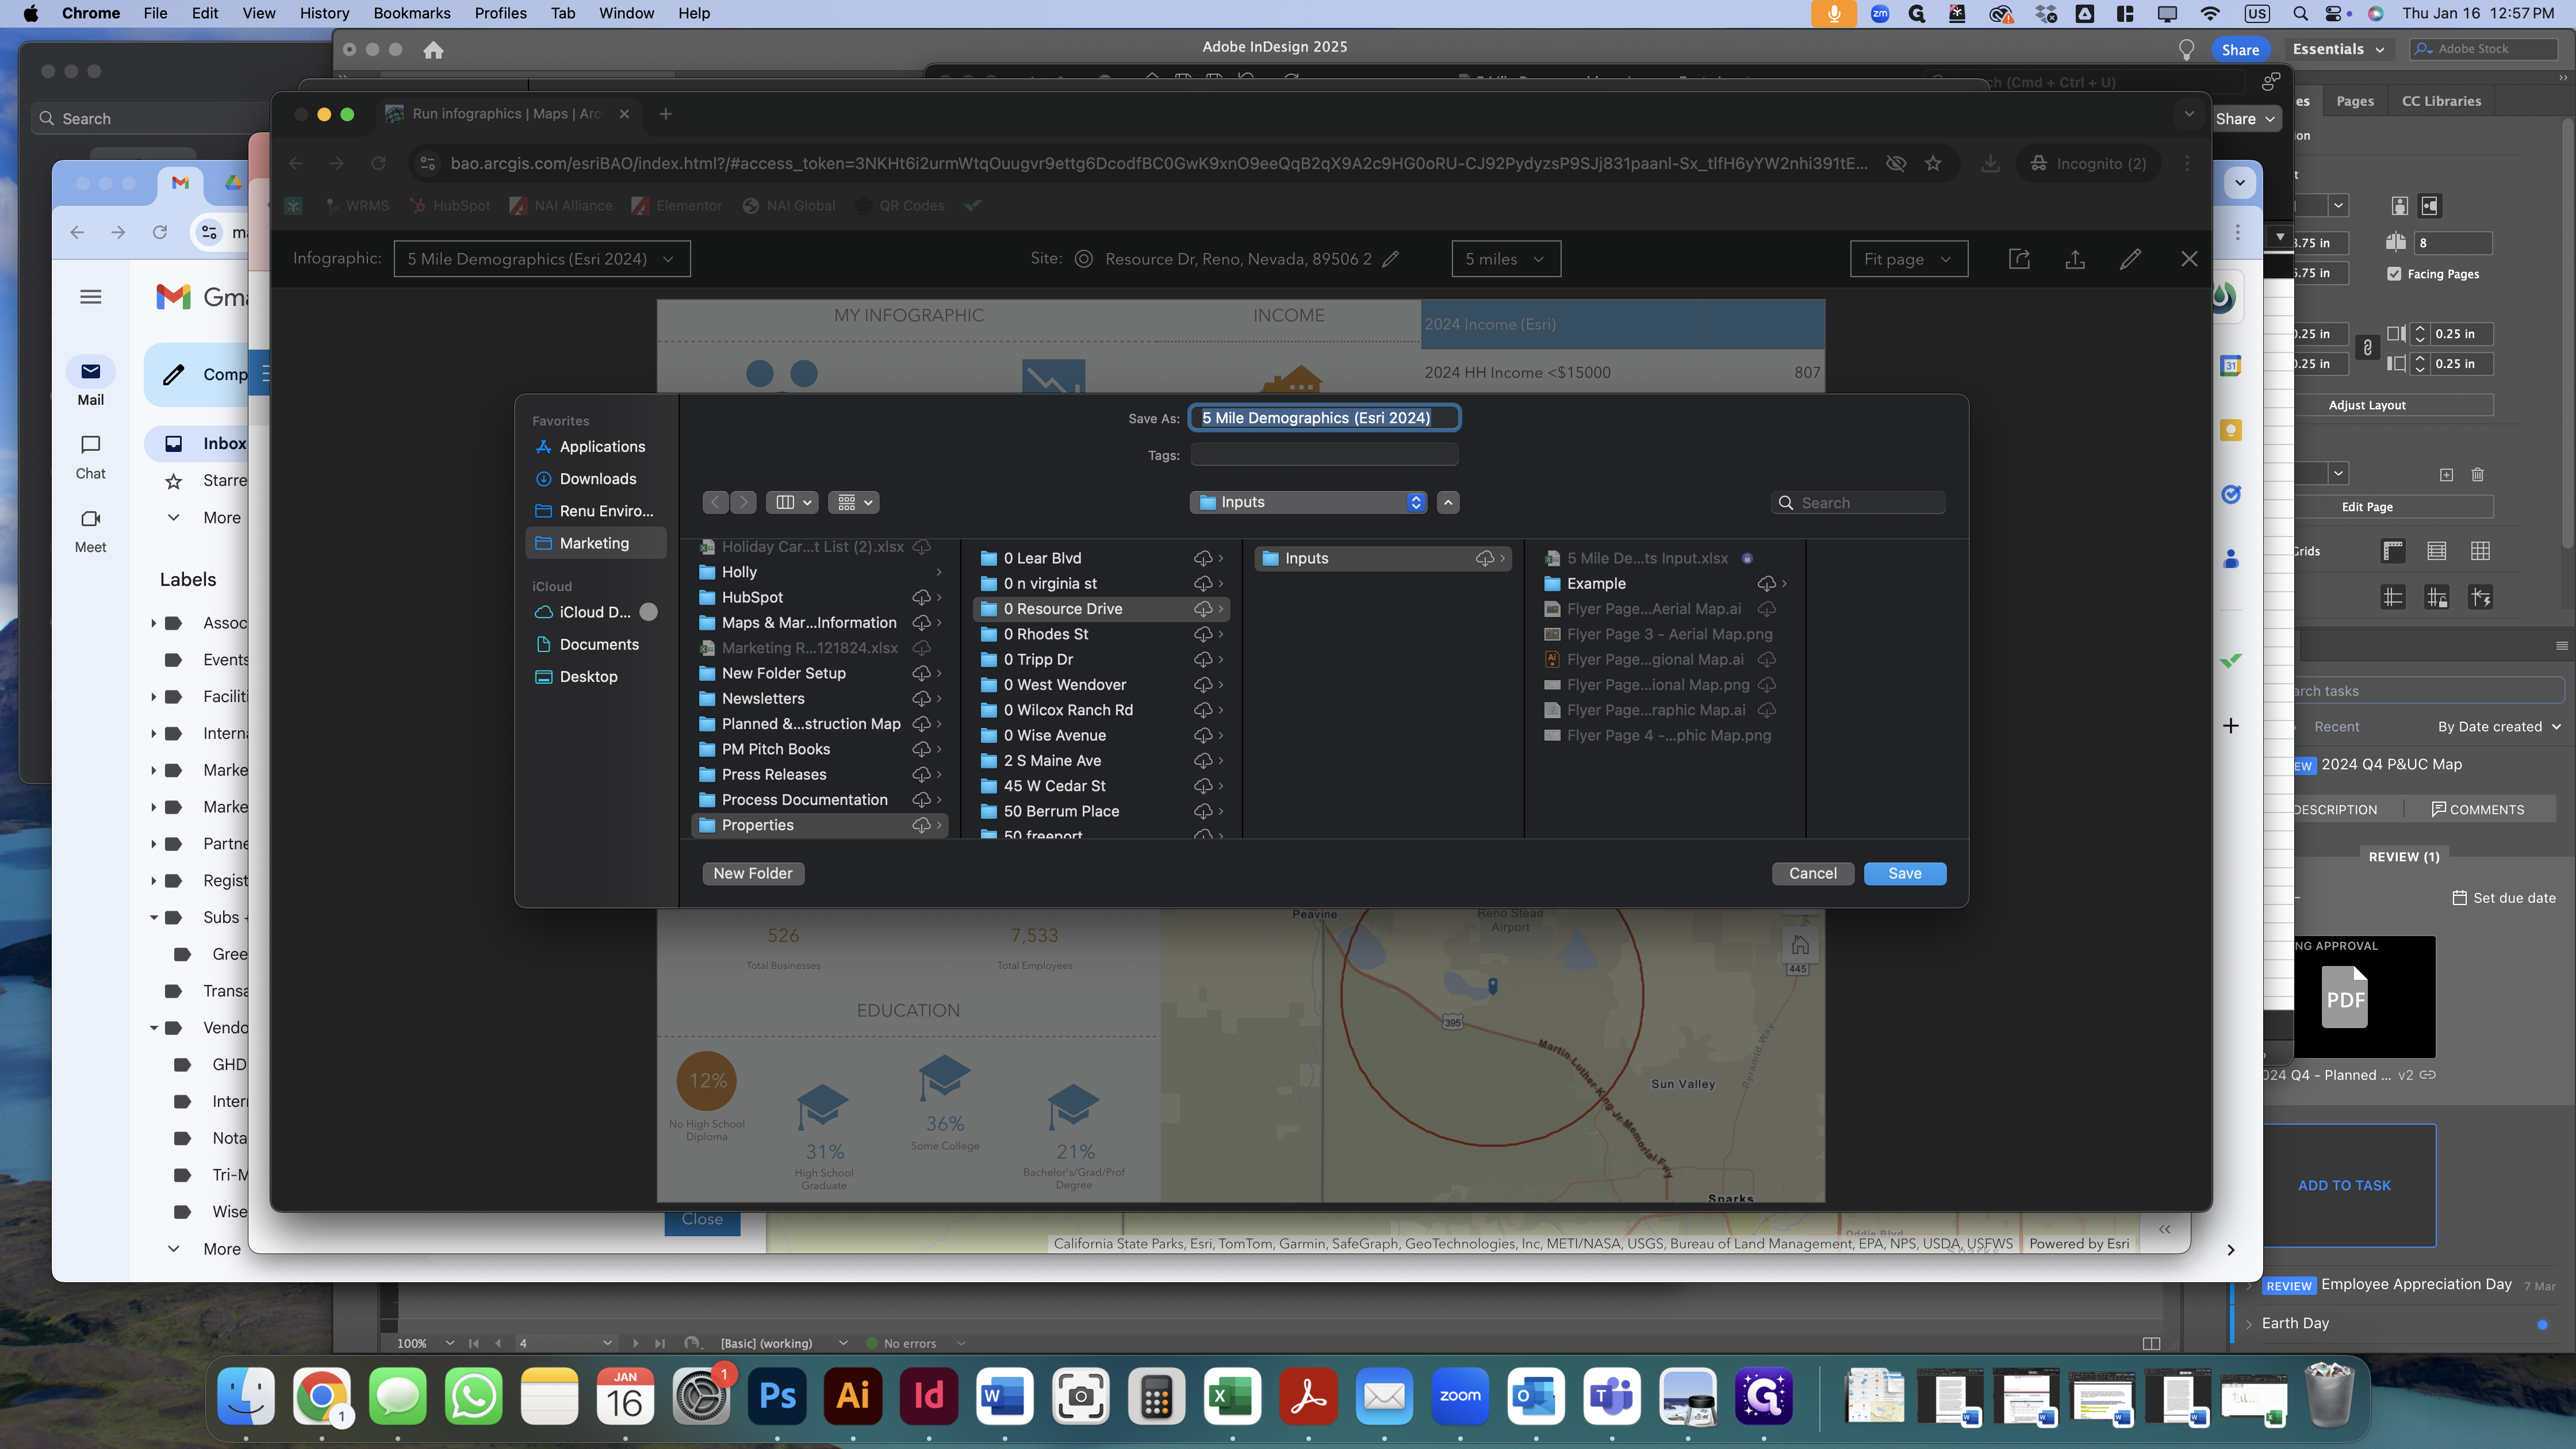
Save the file to the Inputs folder within the subject property folder.
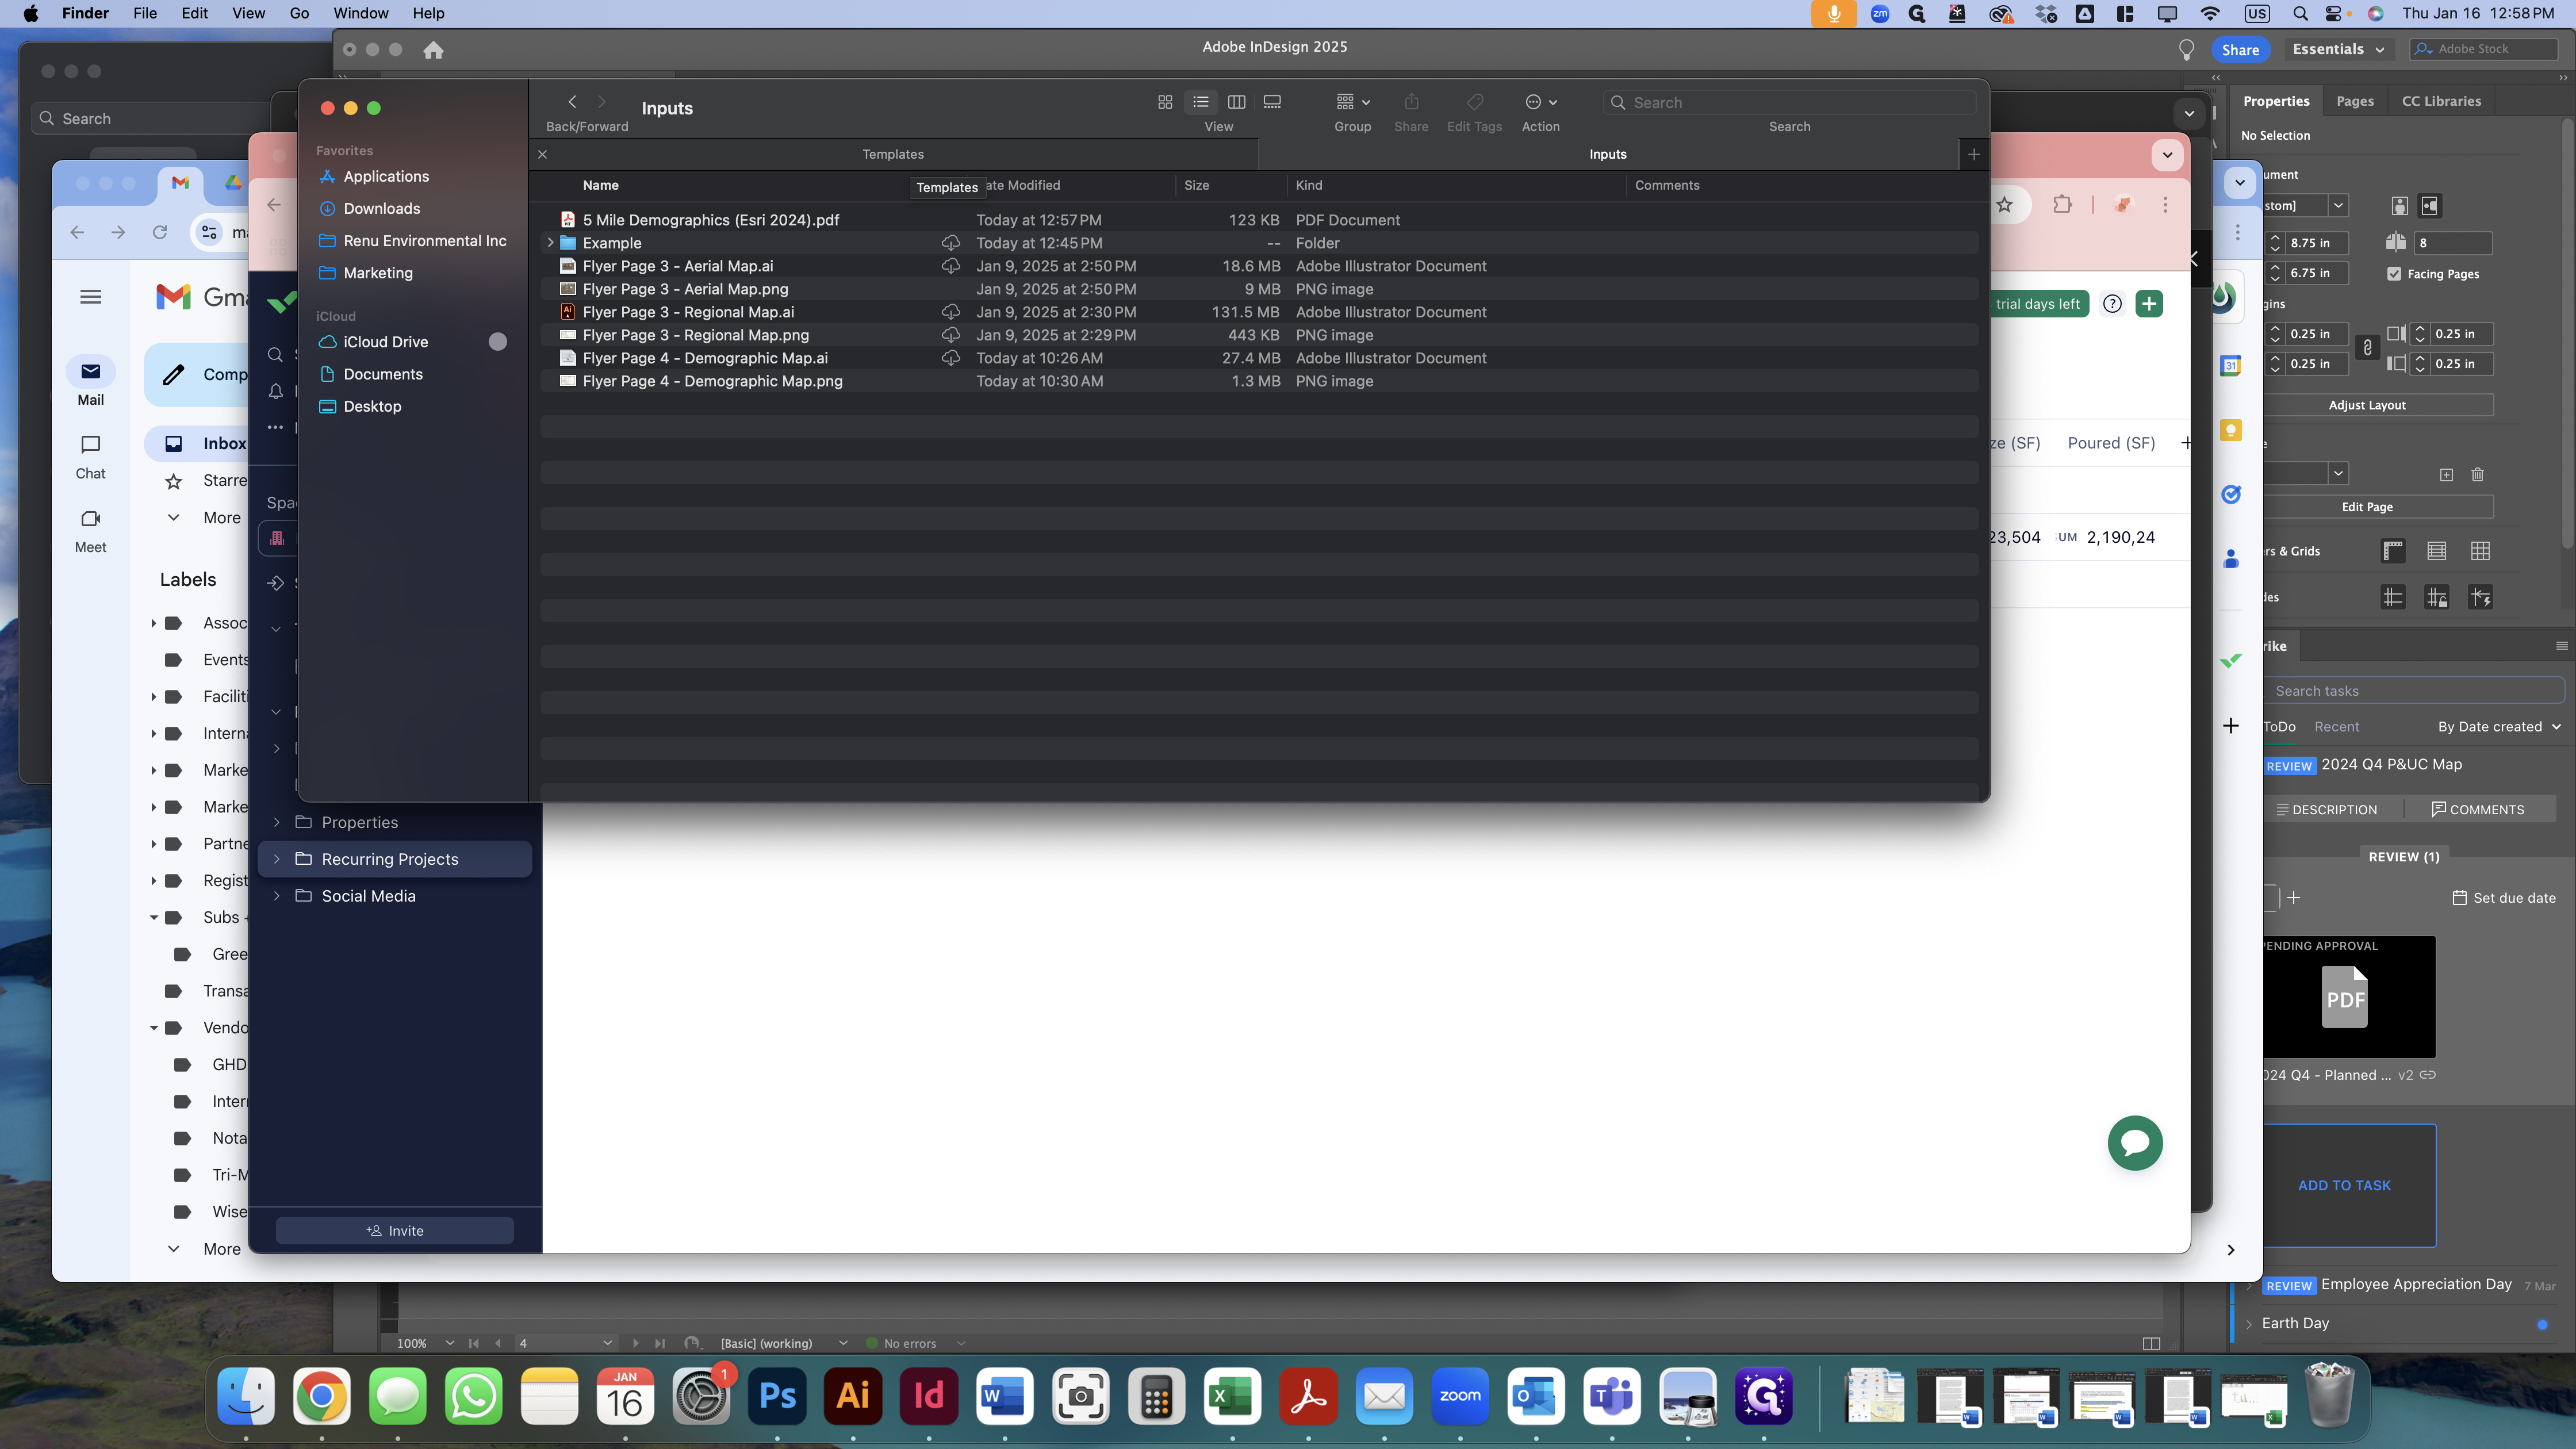
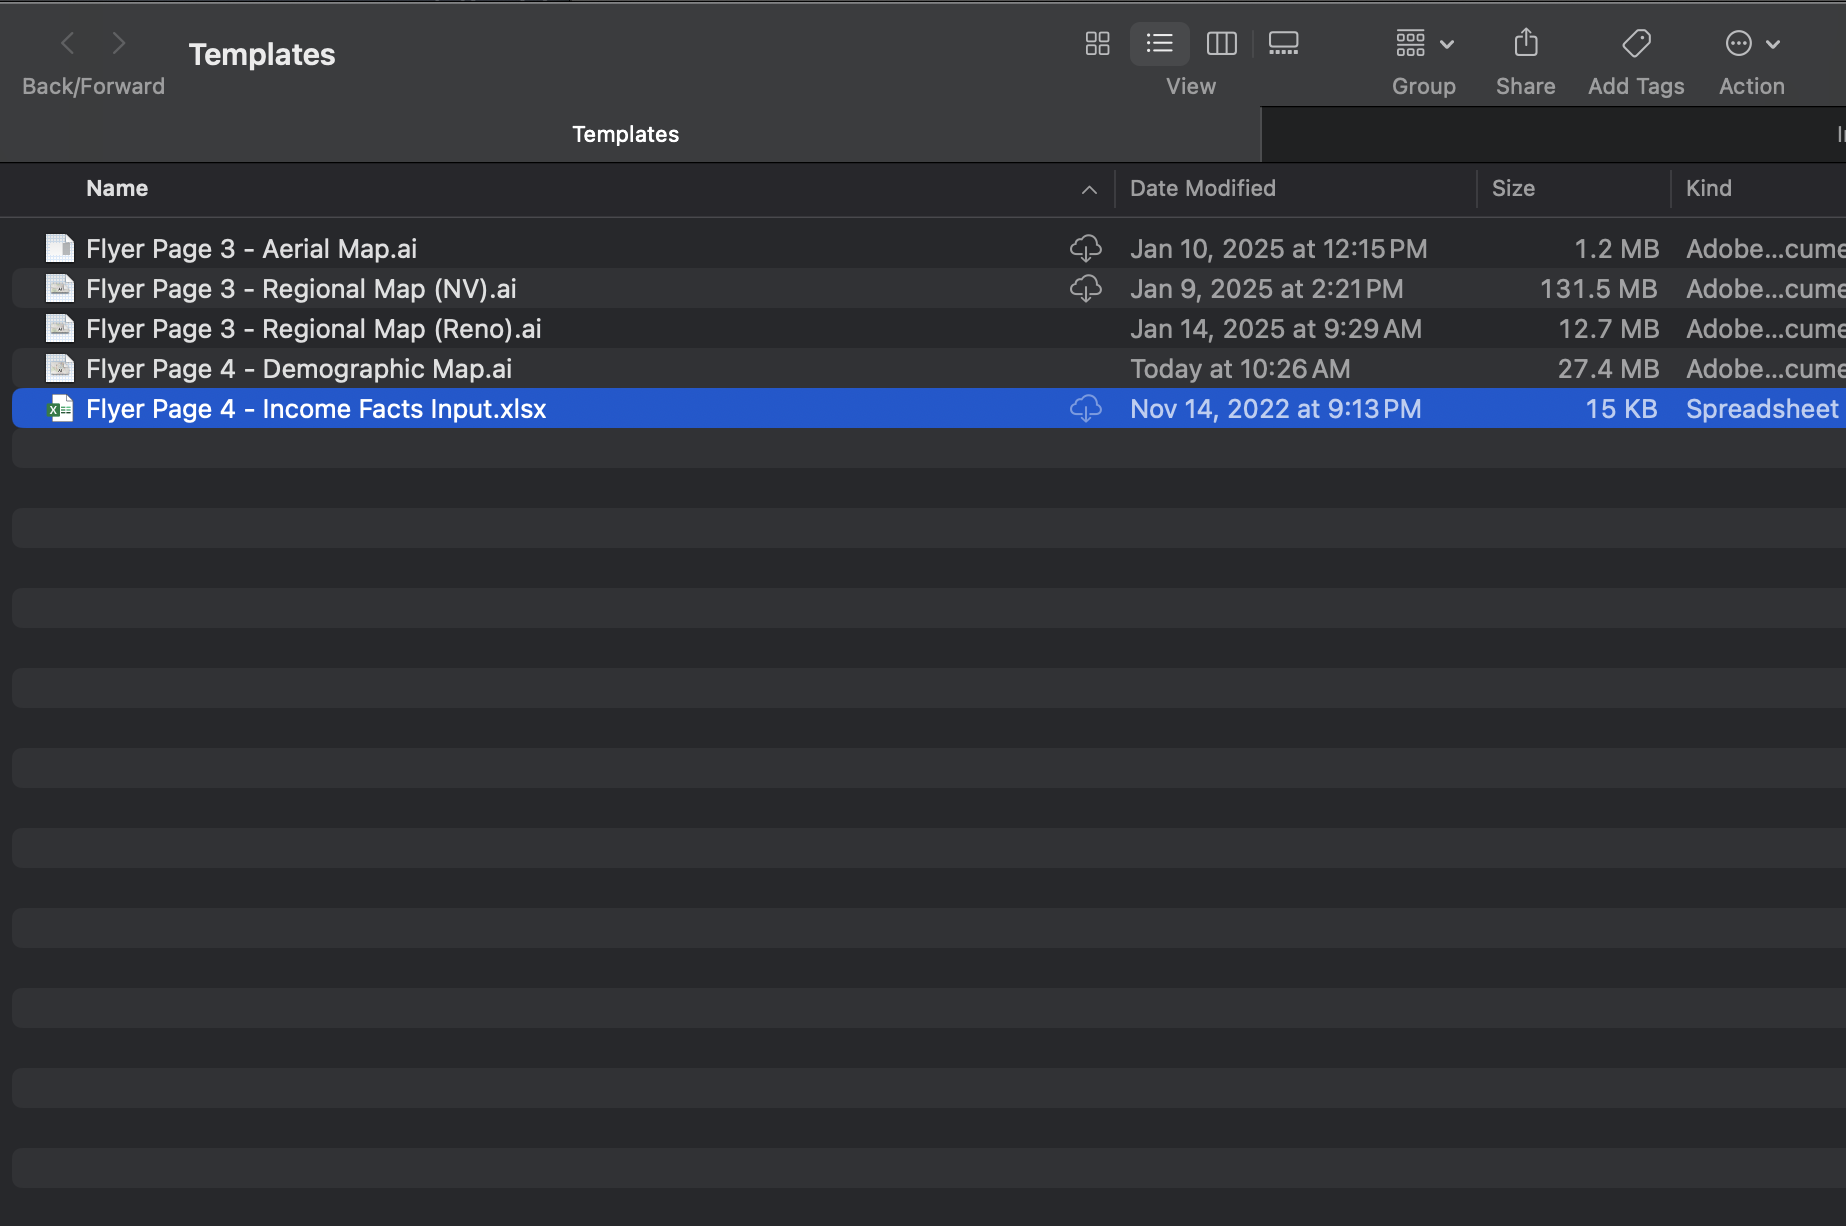
Next, go to the templates folder and copy the 5-mile demographics income facts input spreadsheet. Paste it into the subject property folder in the inputs.
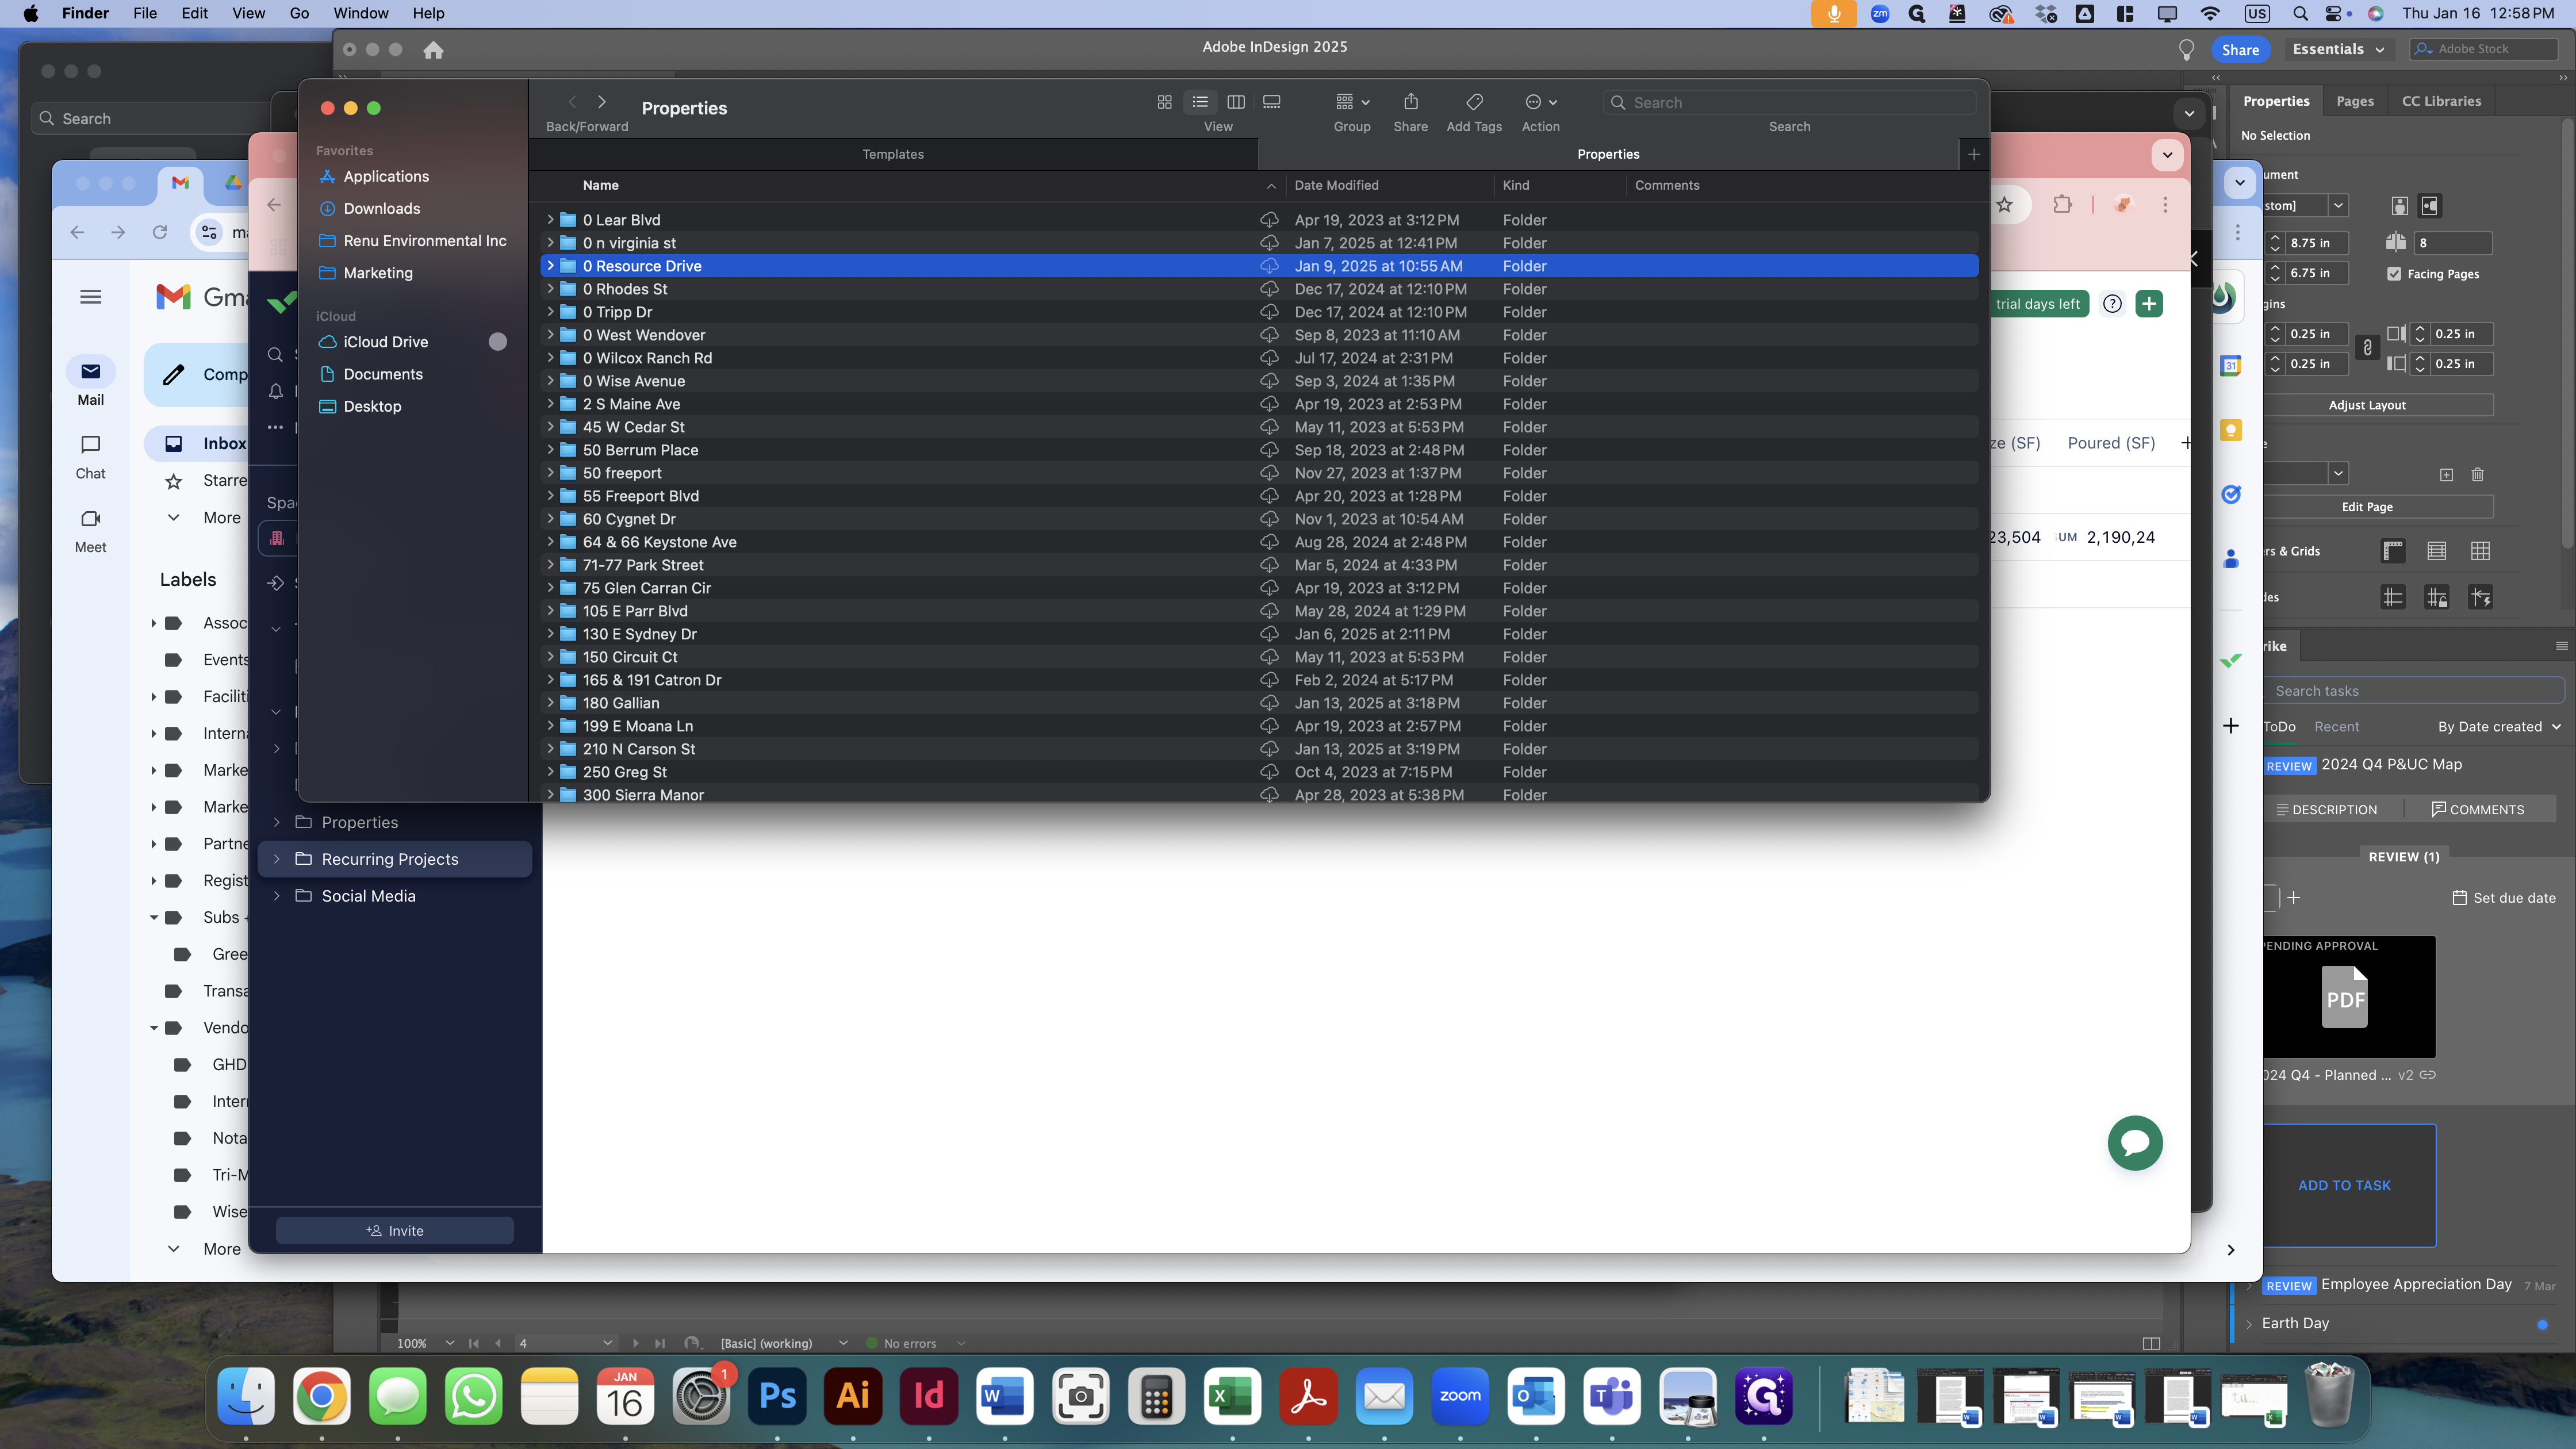
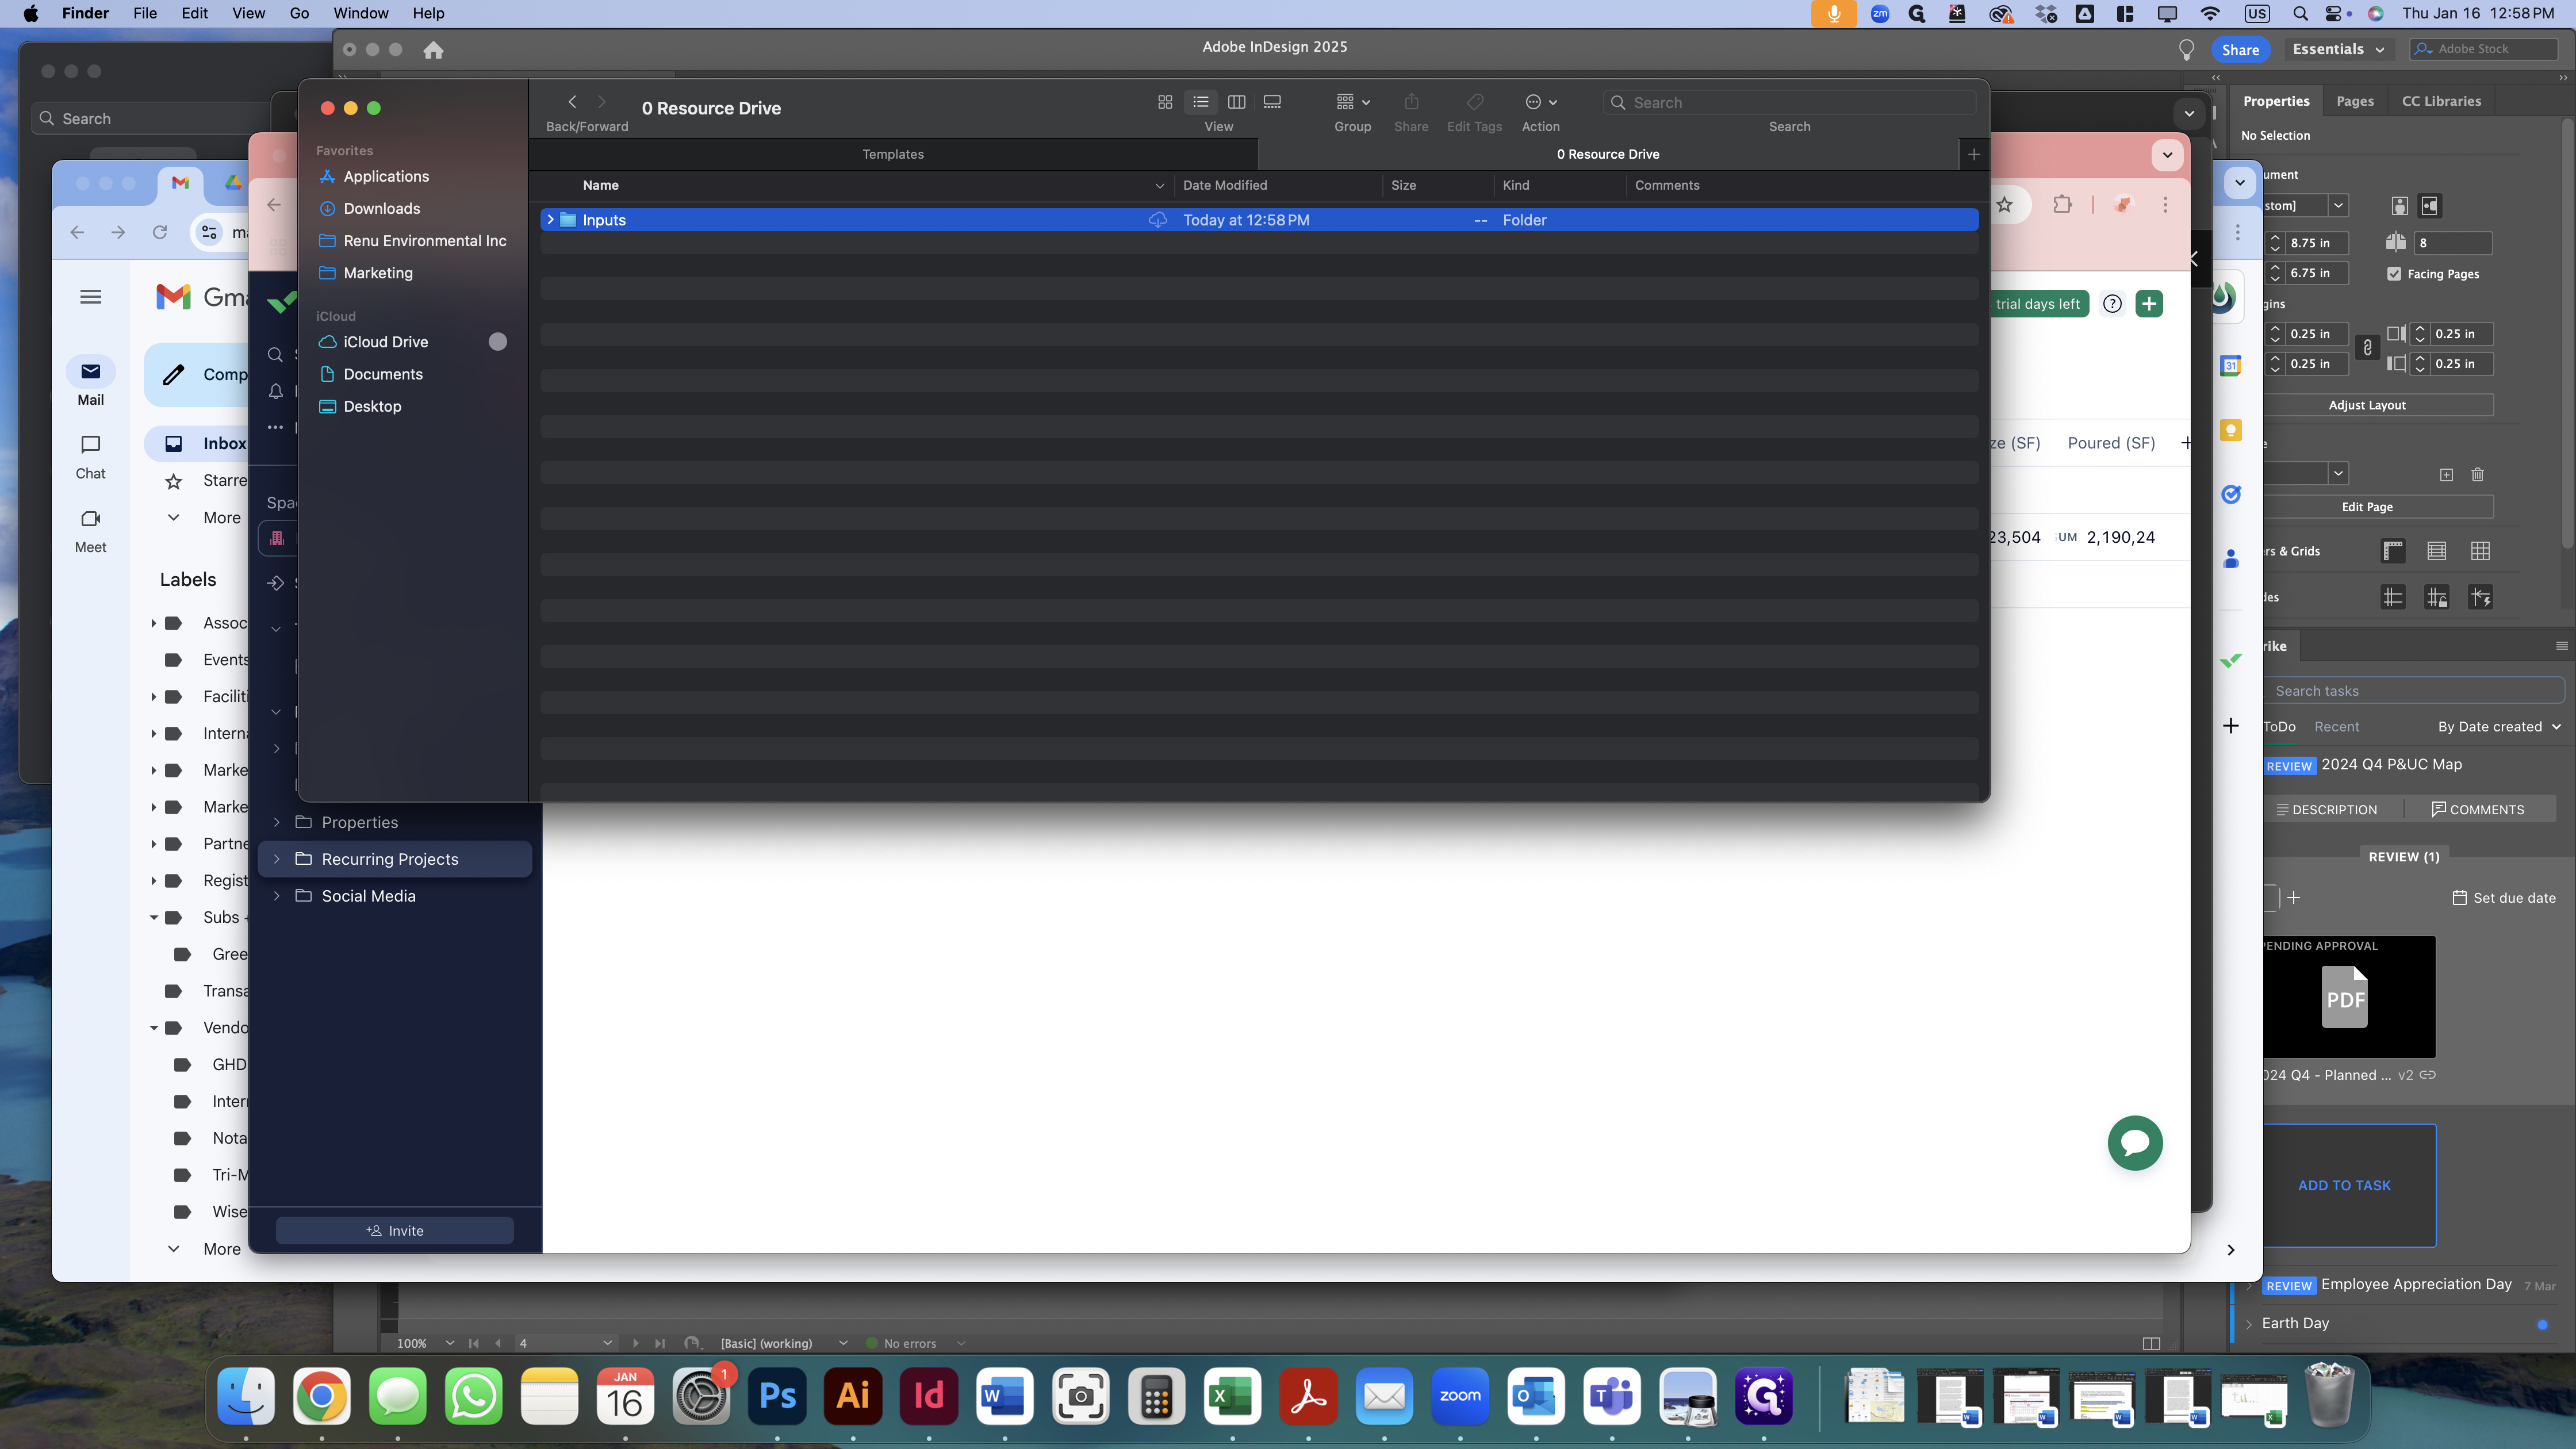
Paste the file into the Inputs folder.
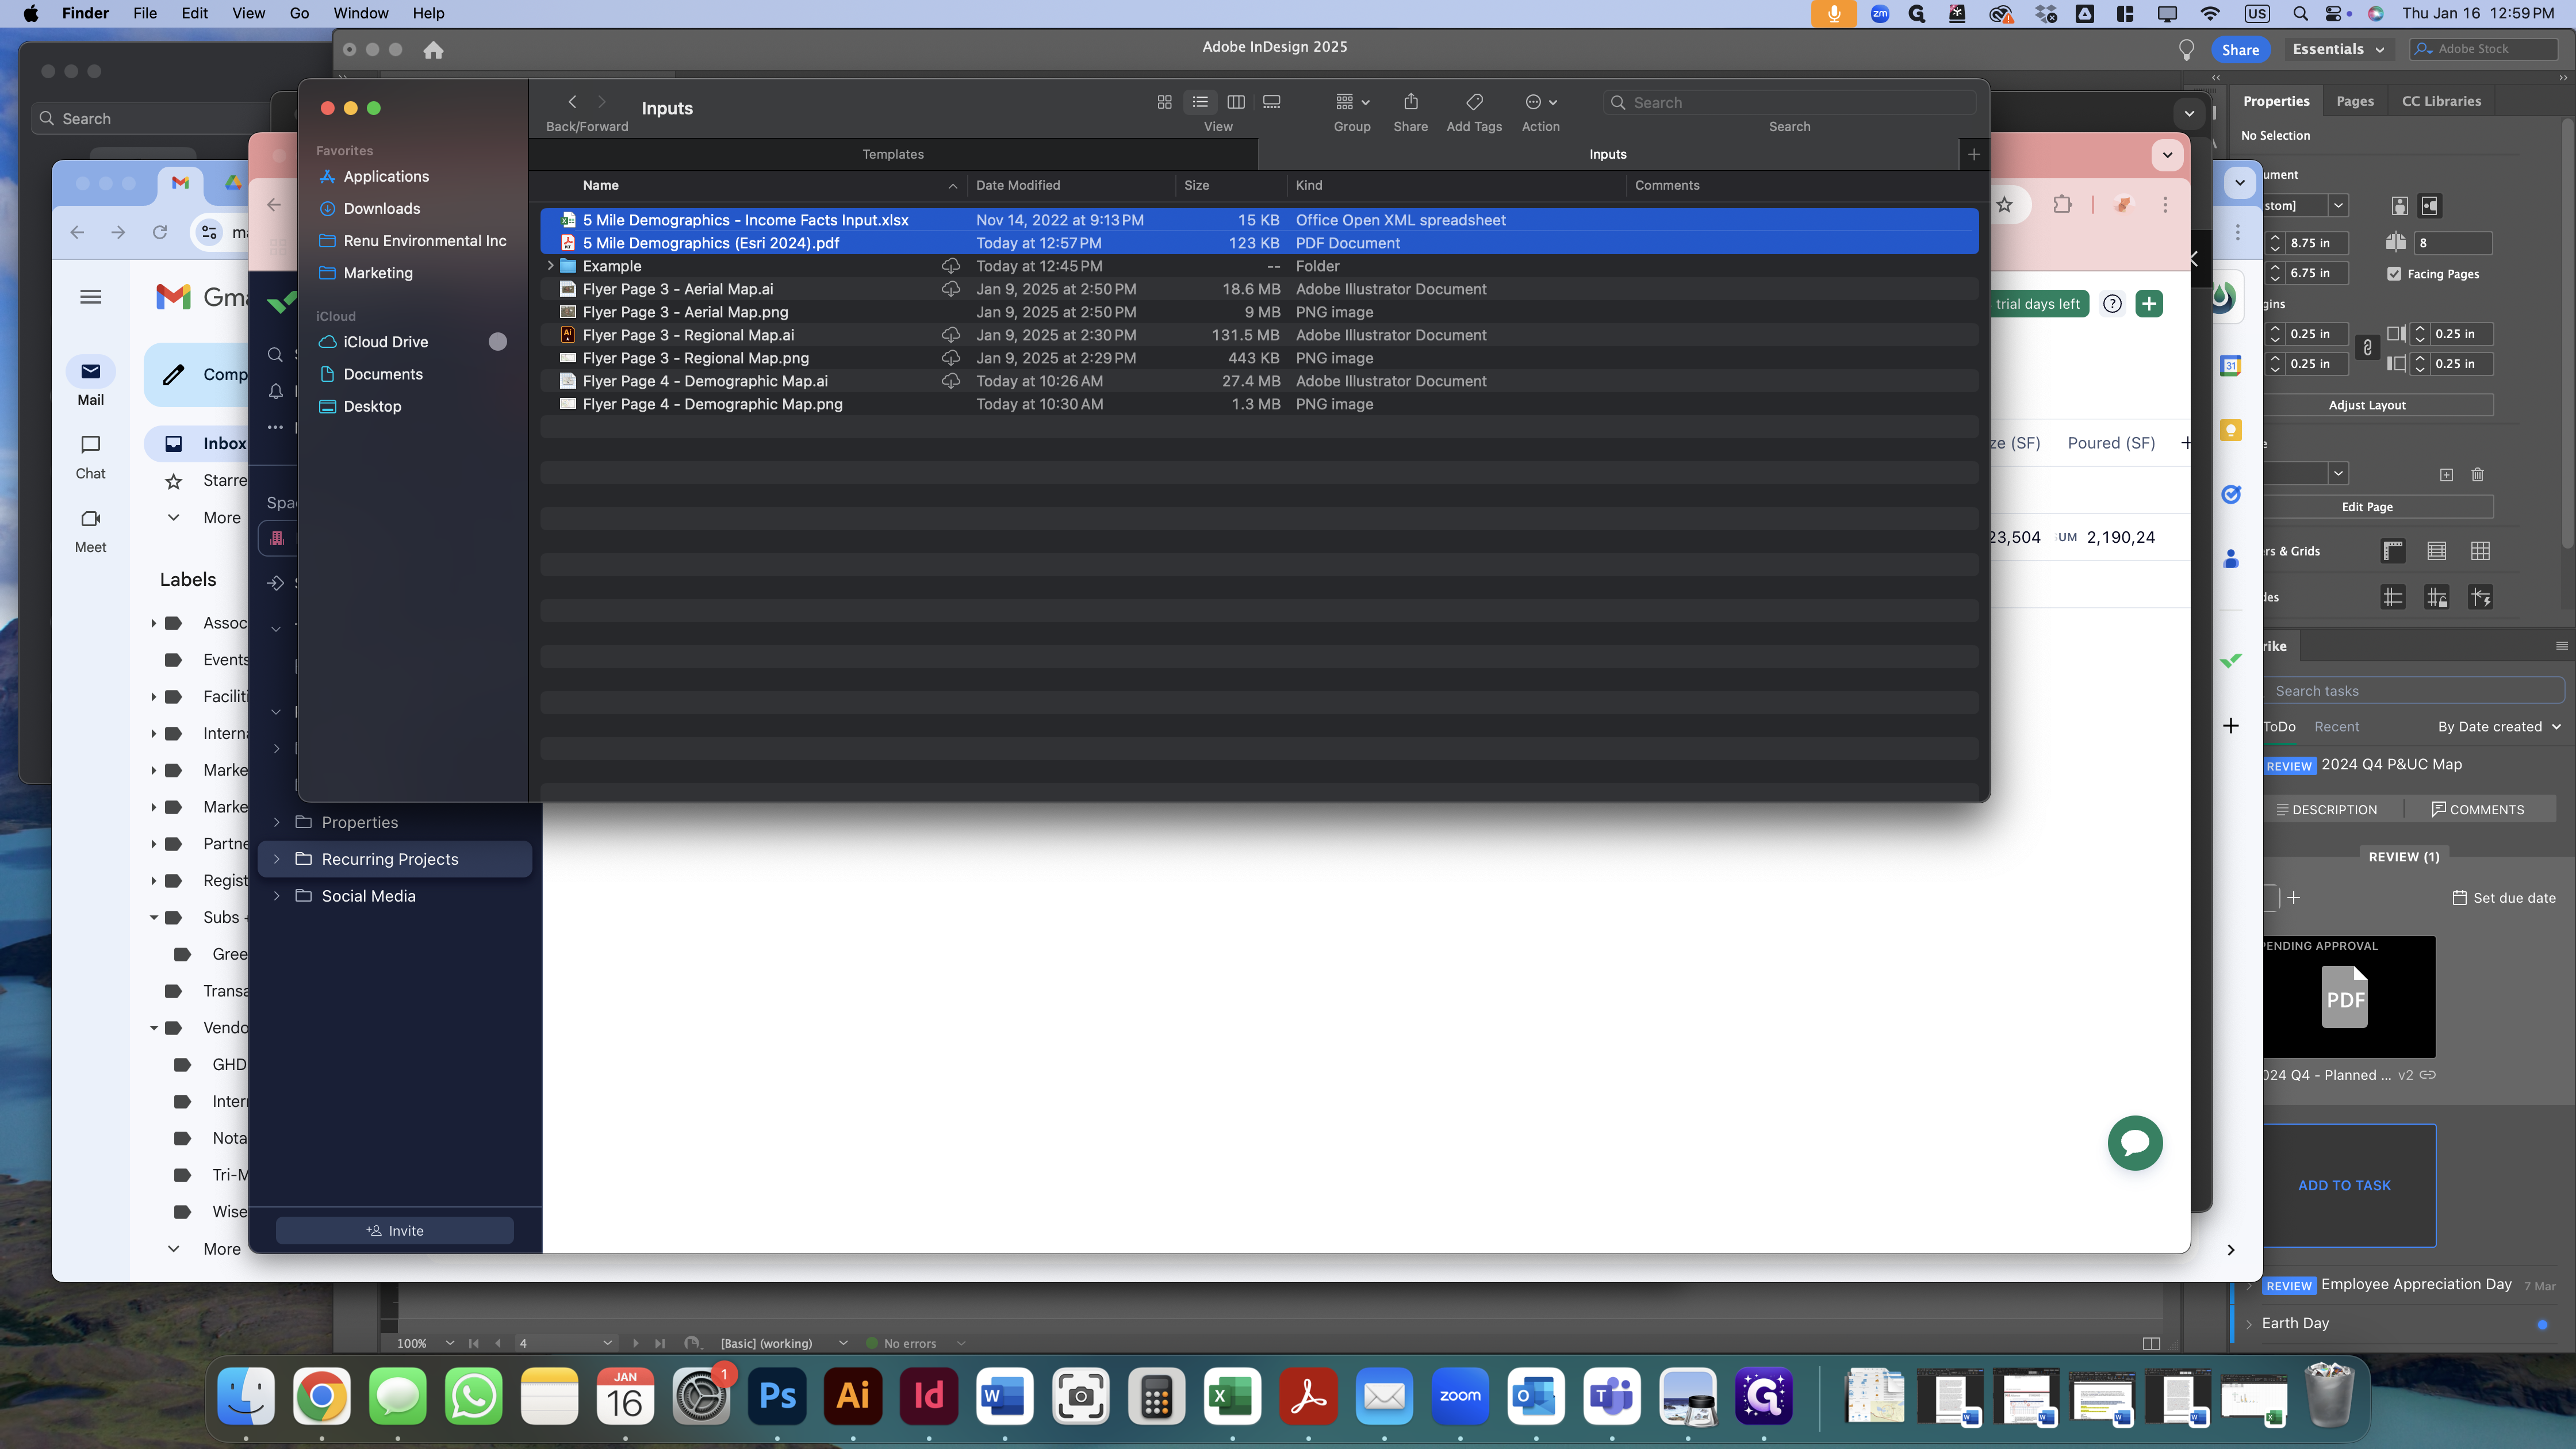
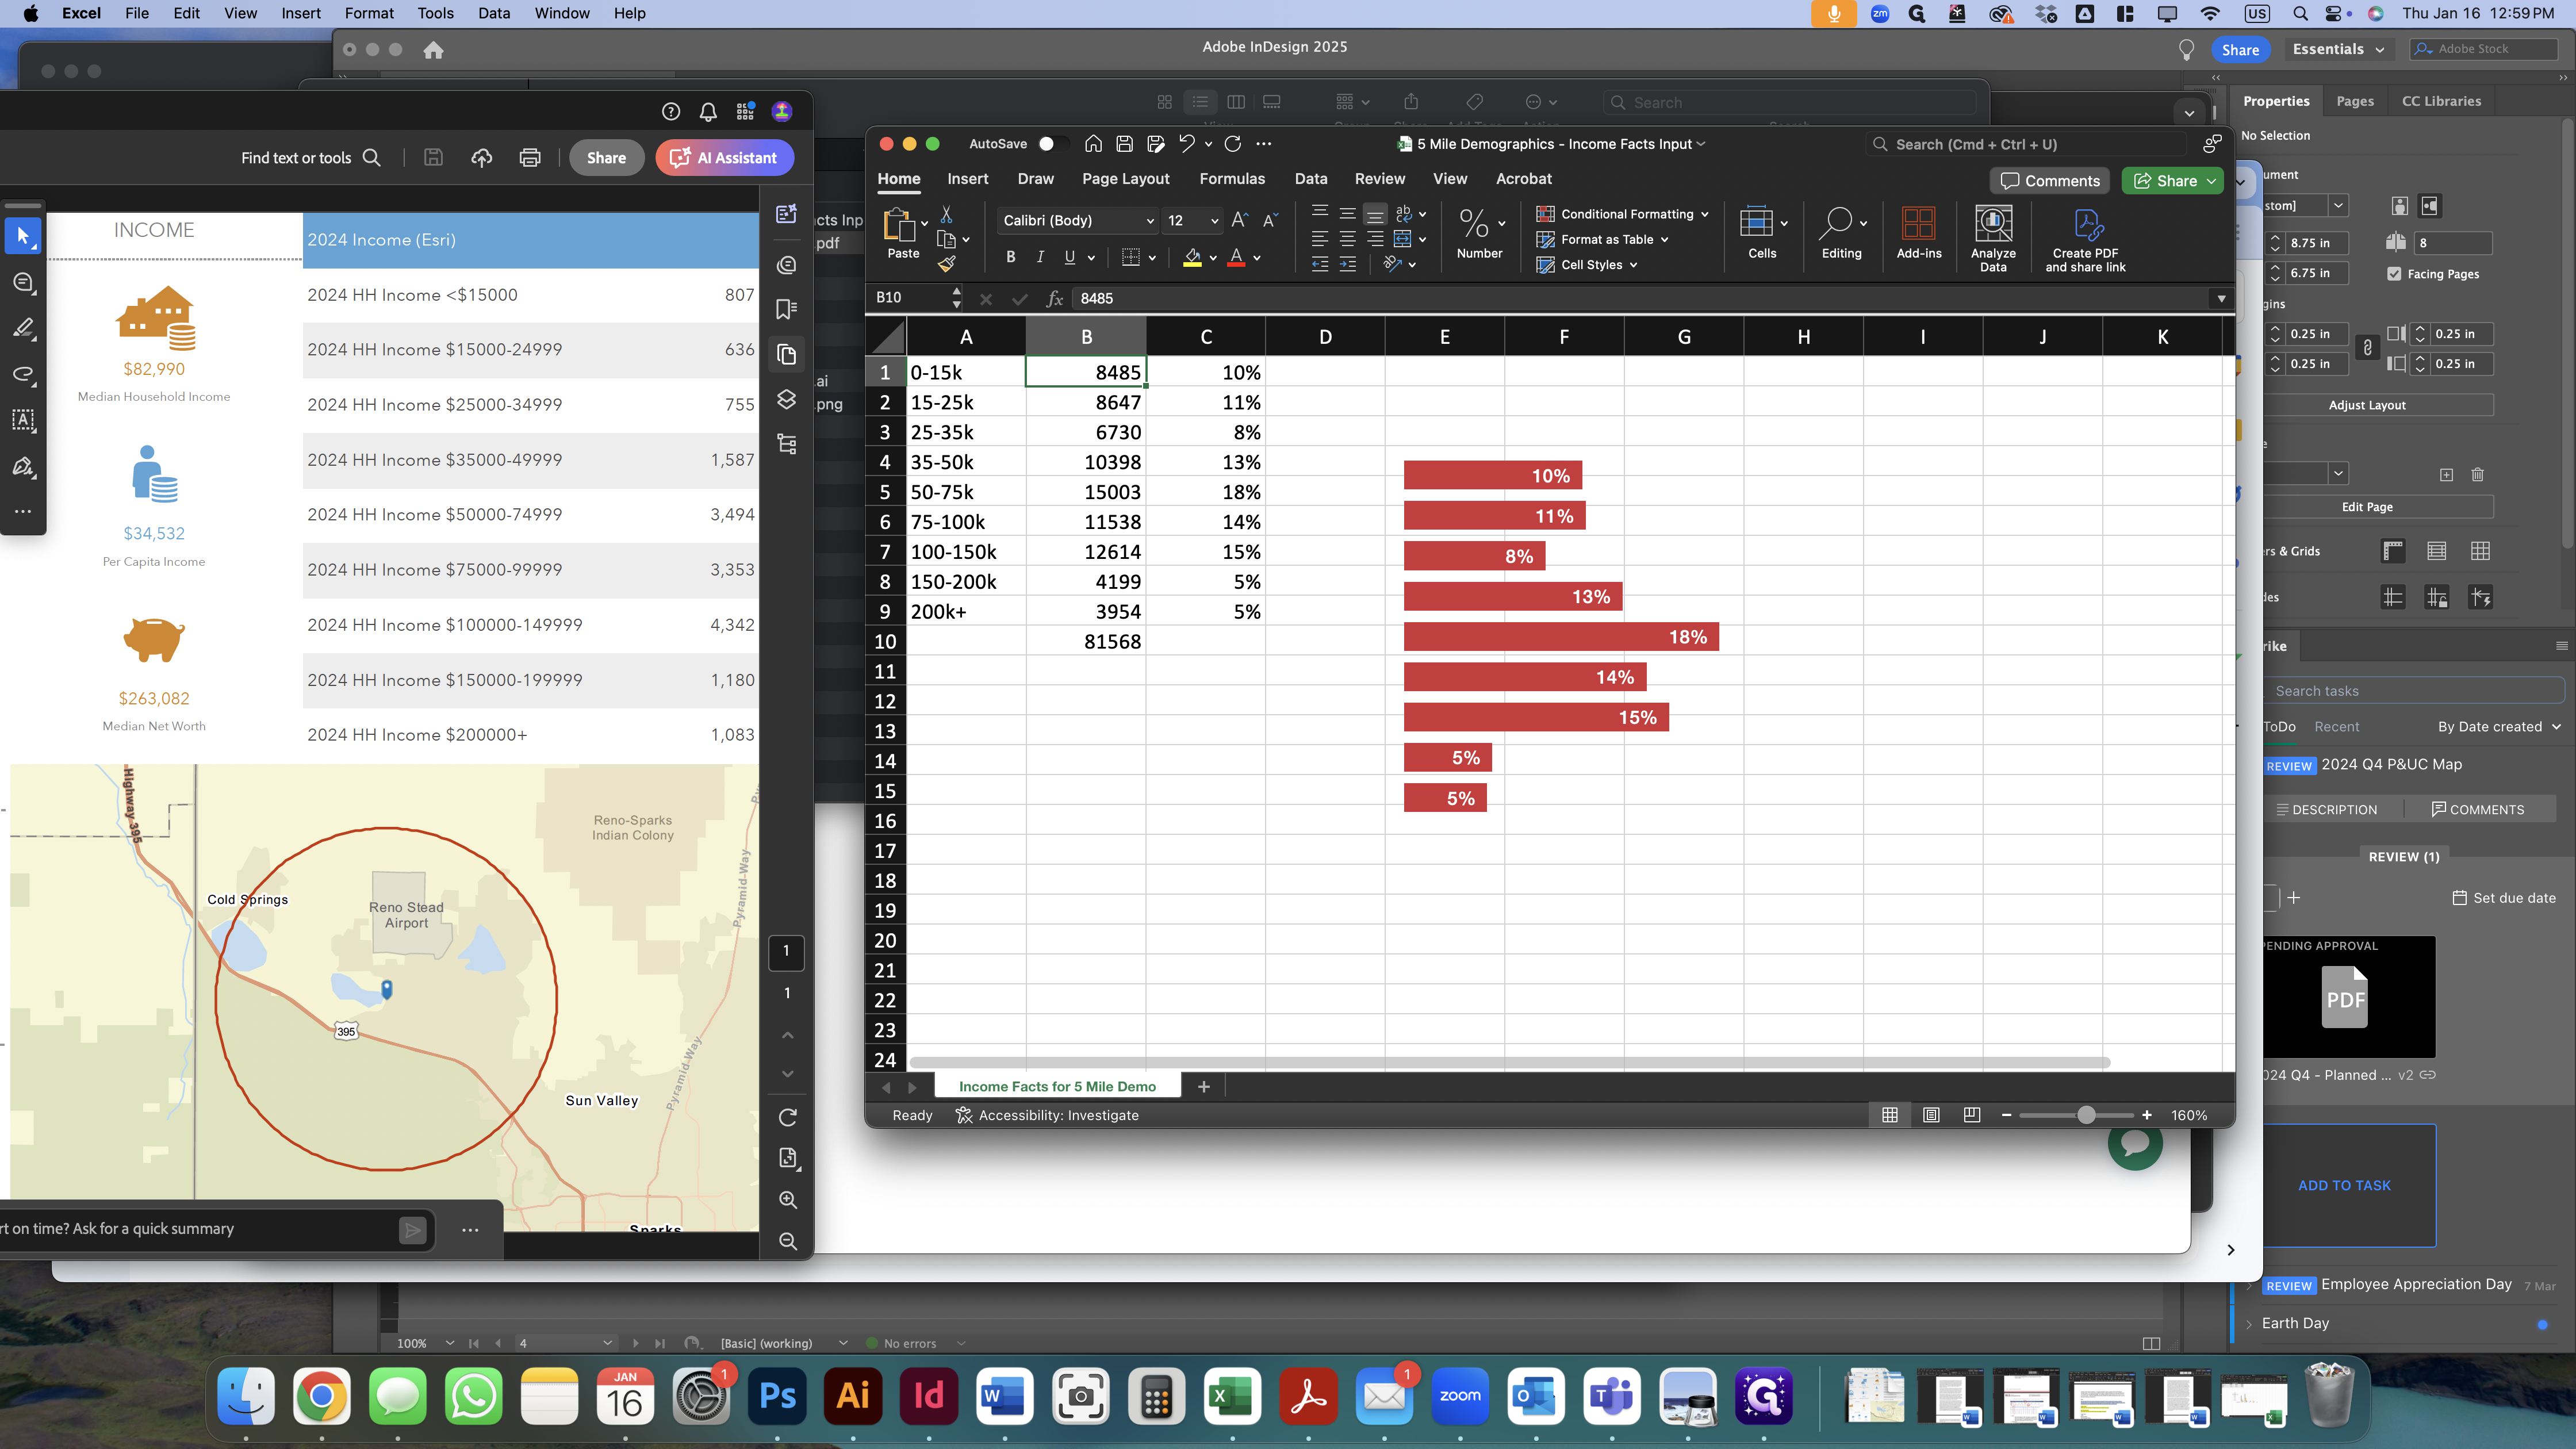
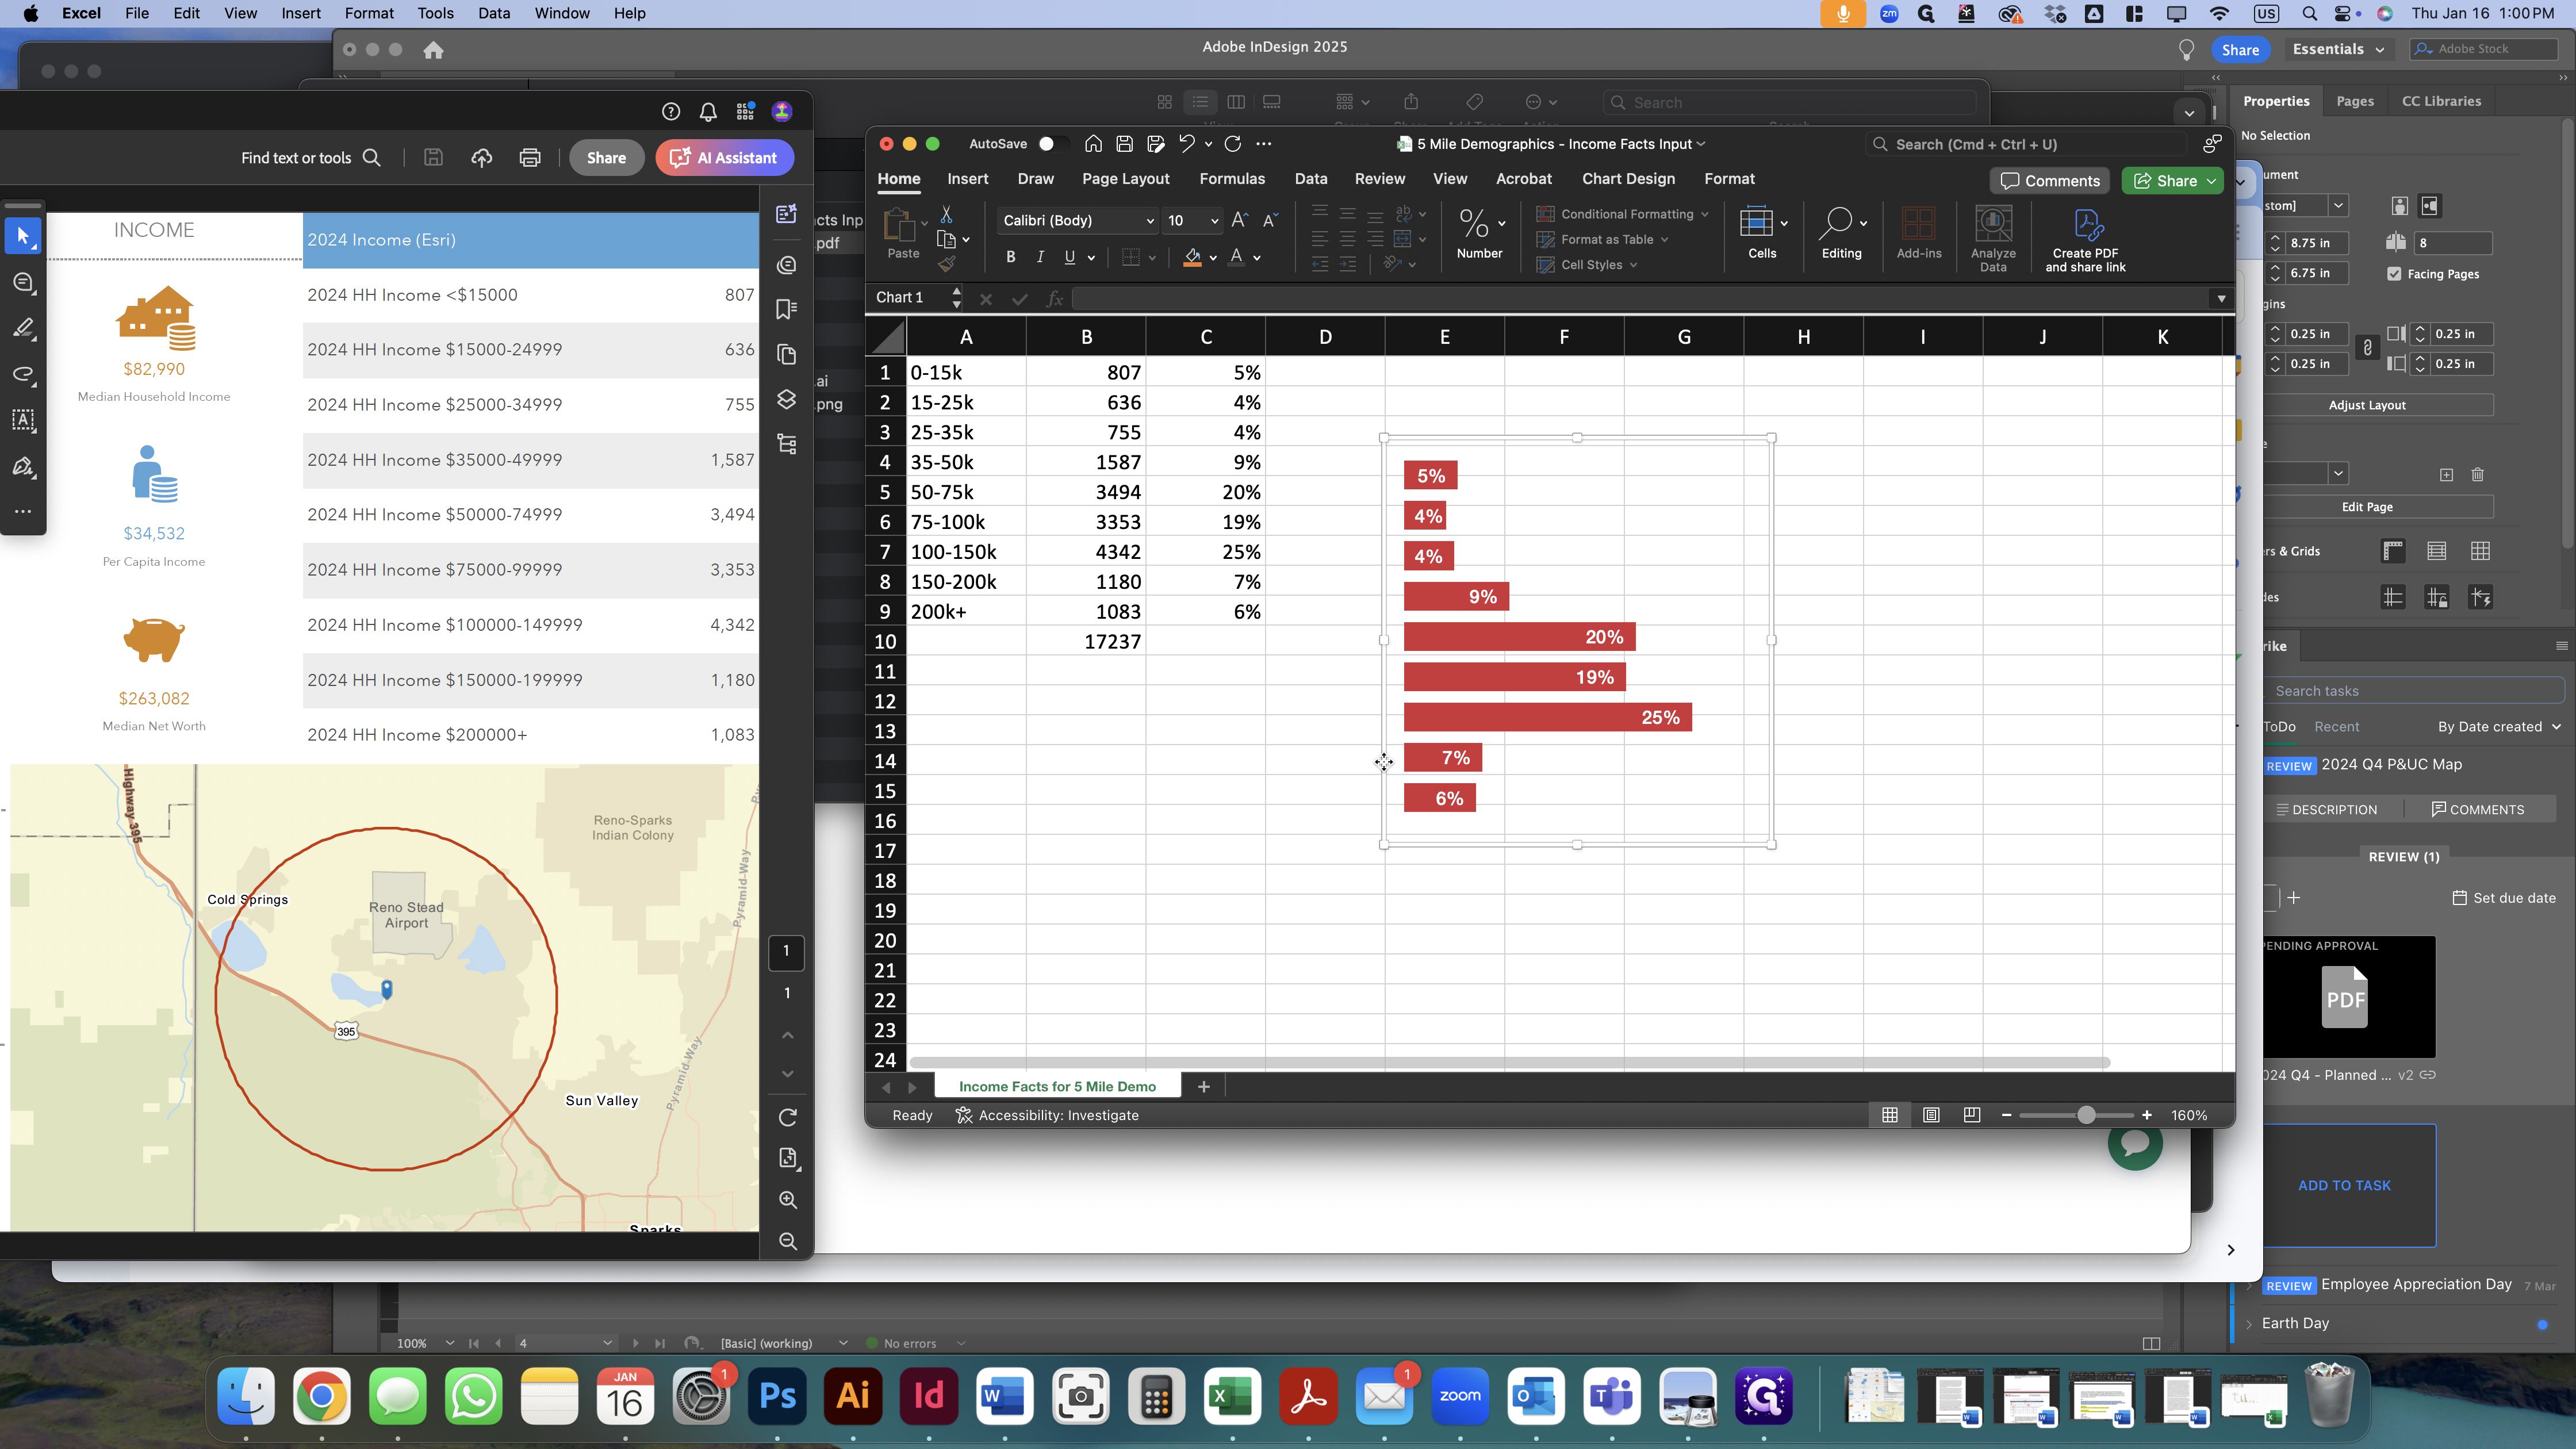
Open both the Excel spreadsheet and the PDF. Use the information from the 2024 income table to fill out the spreadsheet.
The first A1 cell shows an income range of zero to 15,000, matching the first row of the table. Update that number accordingly. Continue down column B, updating all rows to match the data from the PDF exported from SiteToDoBusiness.
To save the map as a picture, click on the chart to display the border panel, then right-click on the outside edge. This will bring up a menu with the option to save the map as a picture. Clicking elsewhere on the chart will not provide this option.
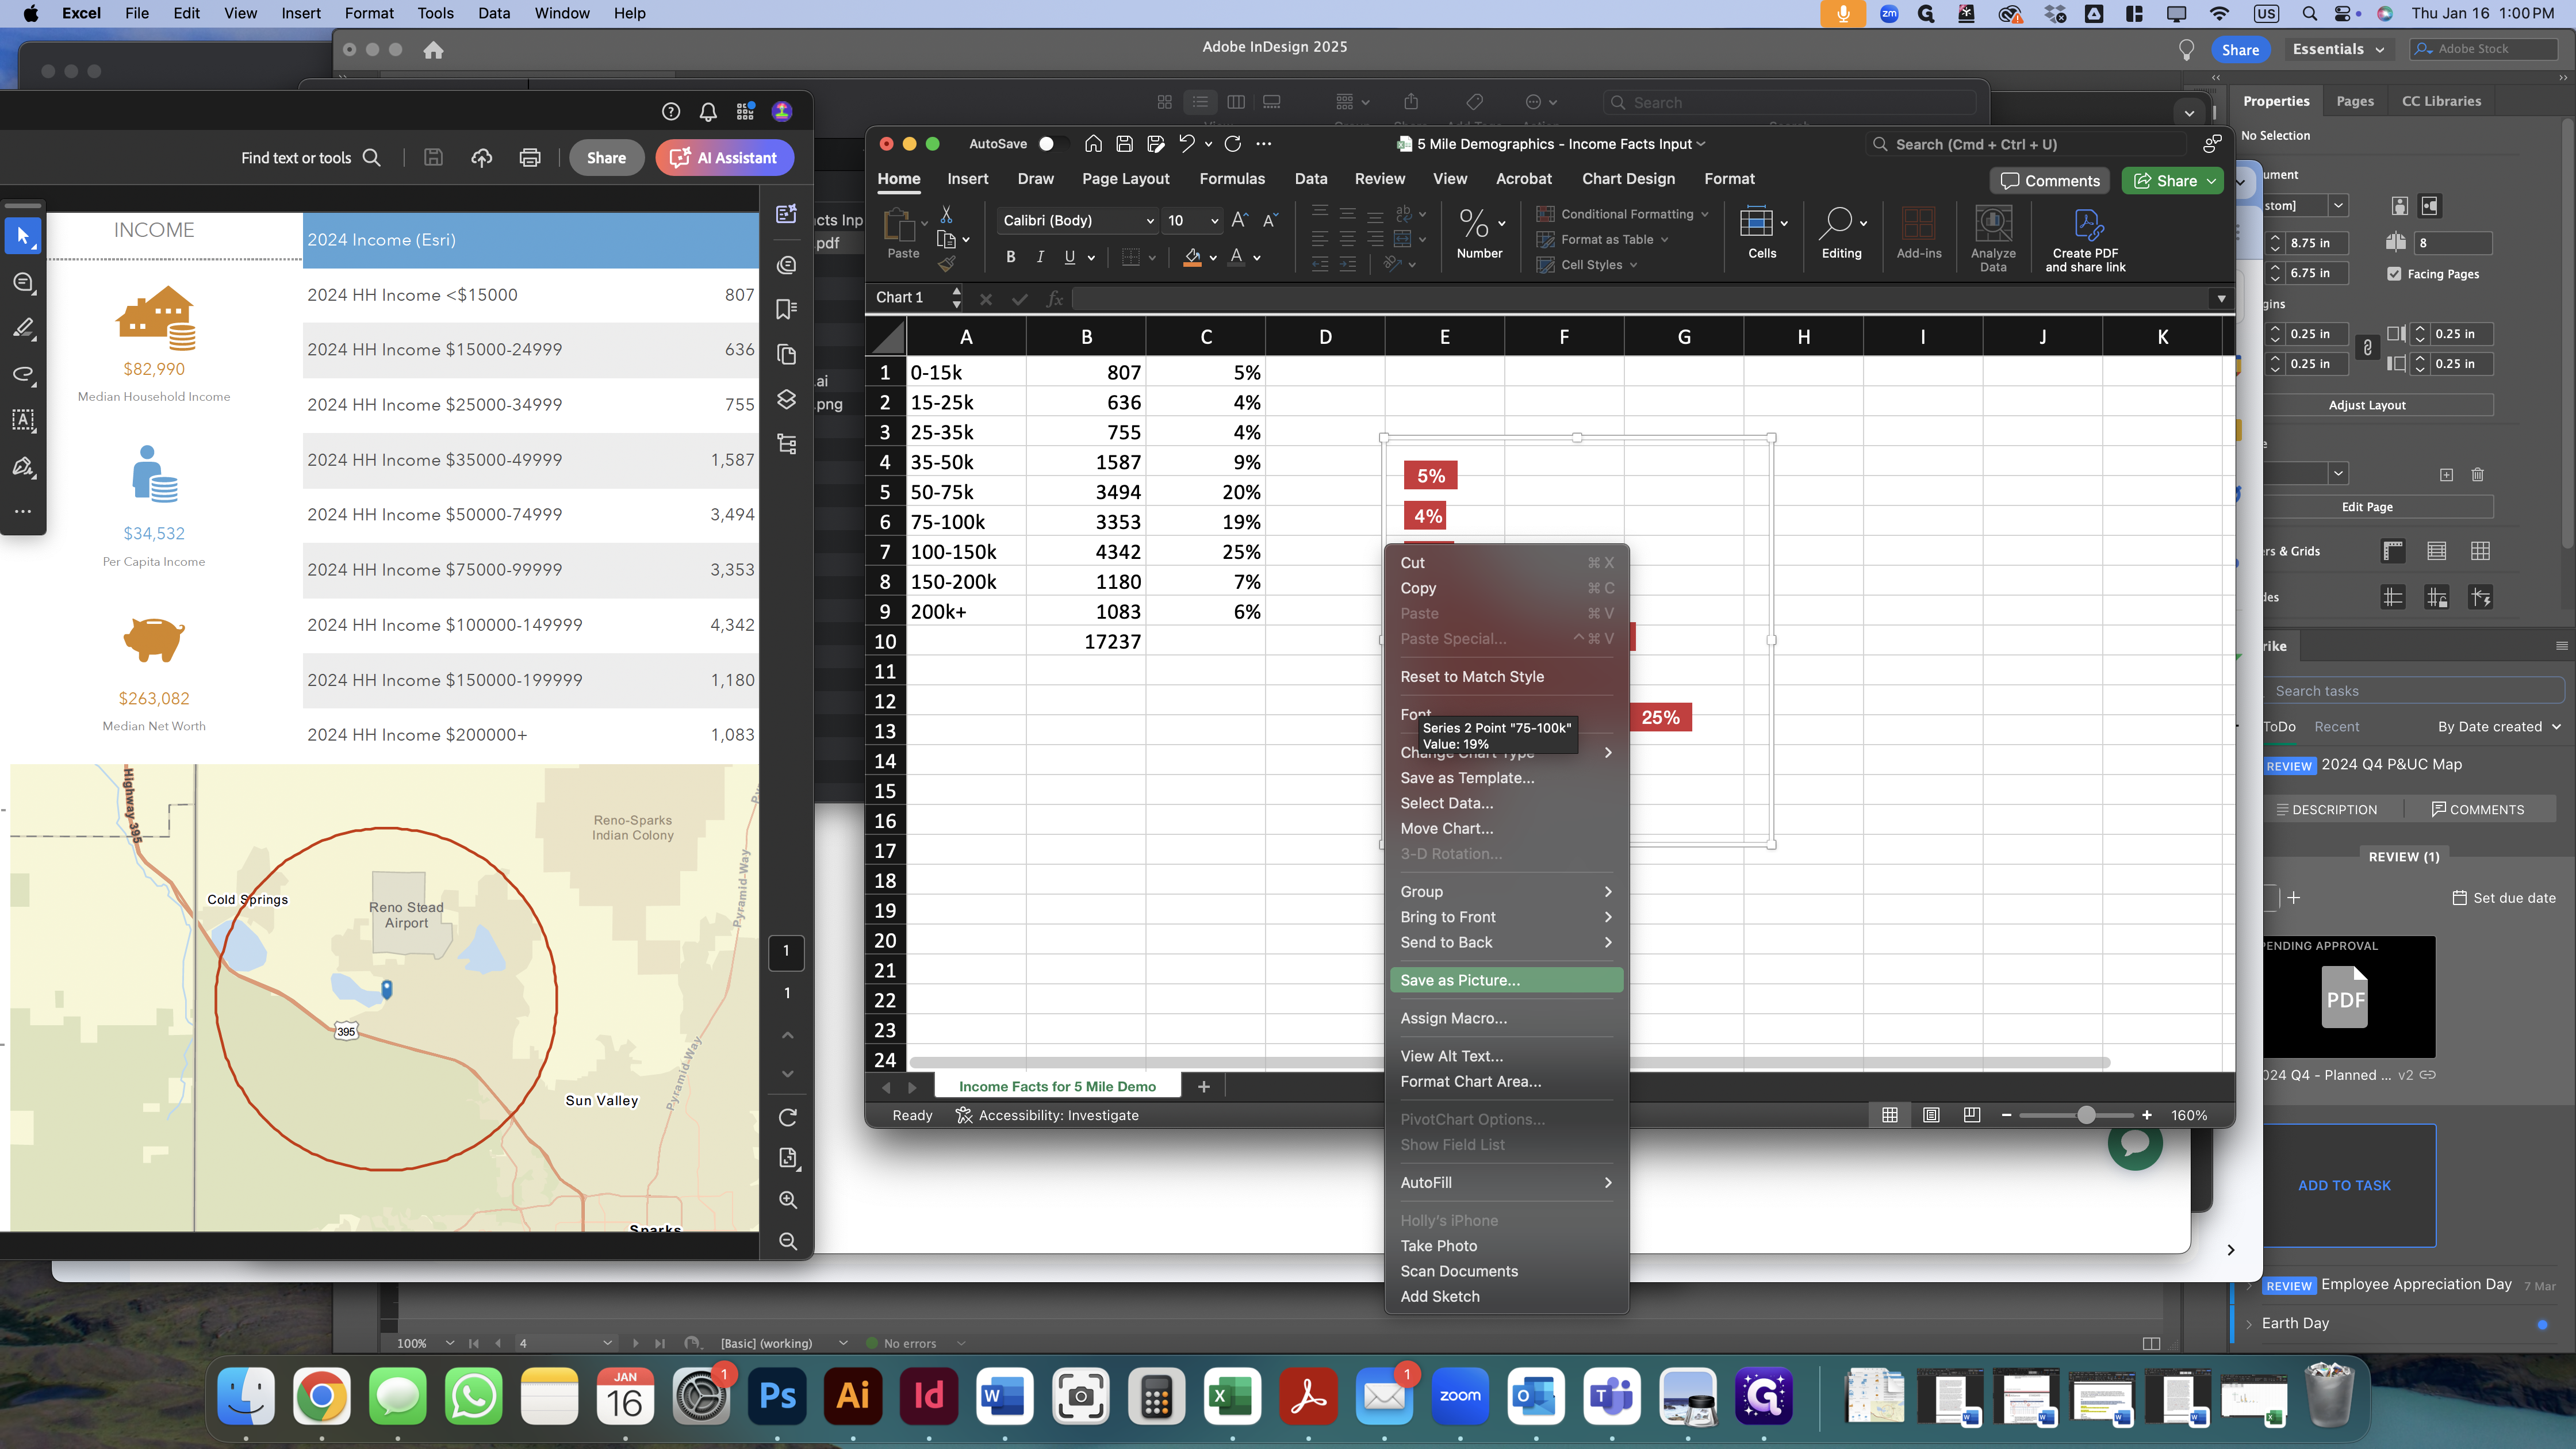
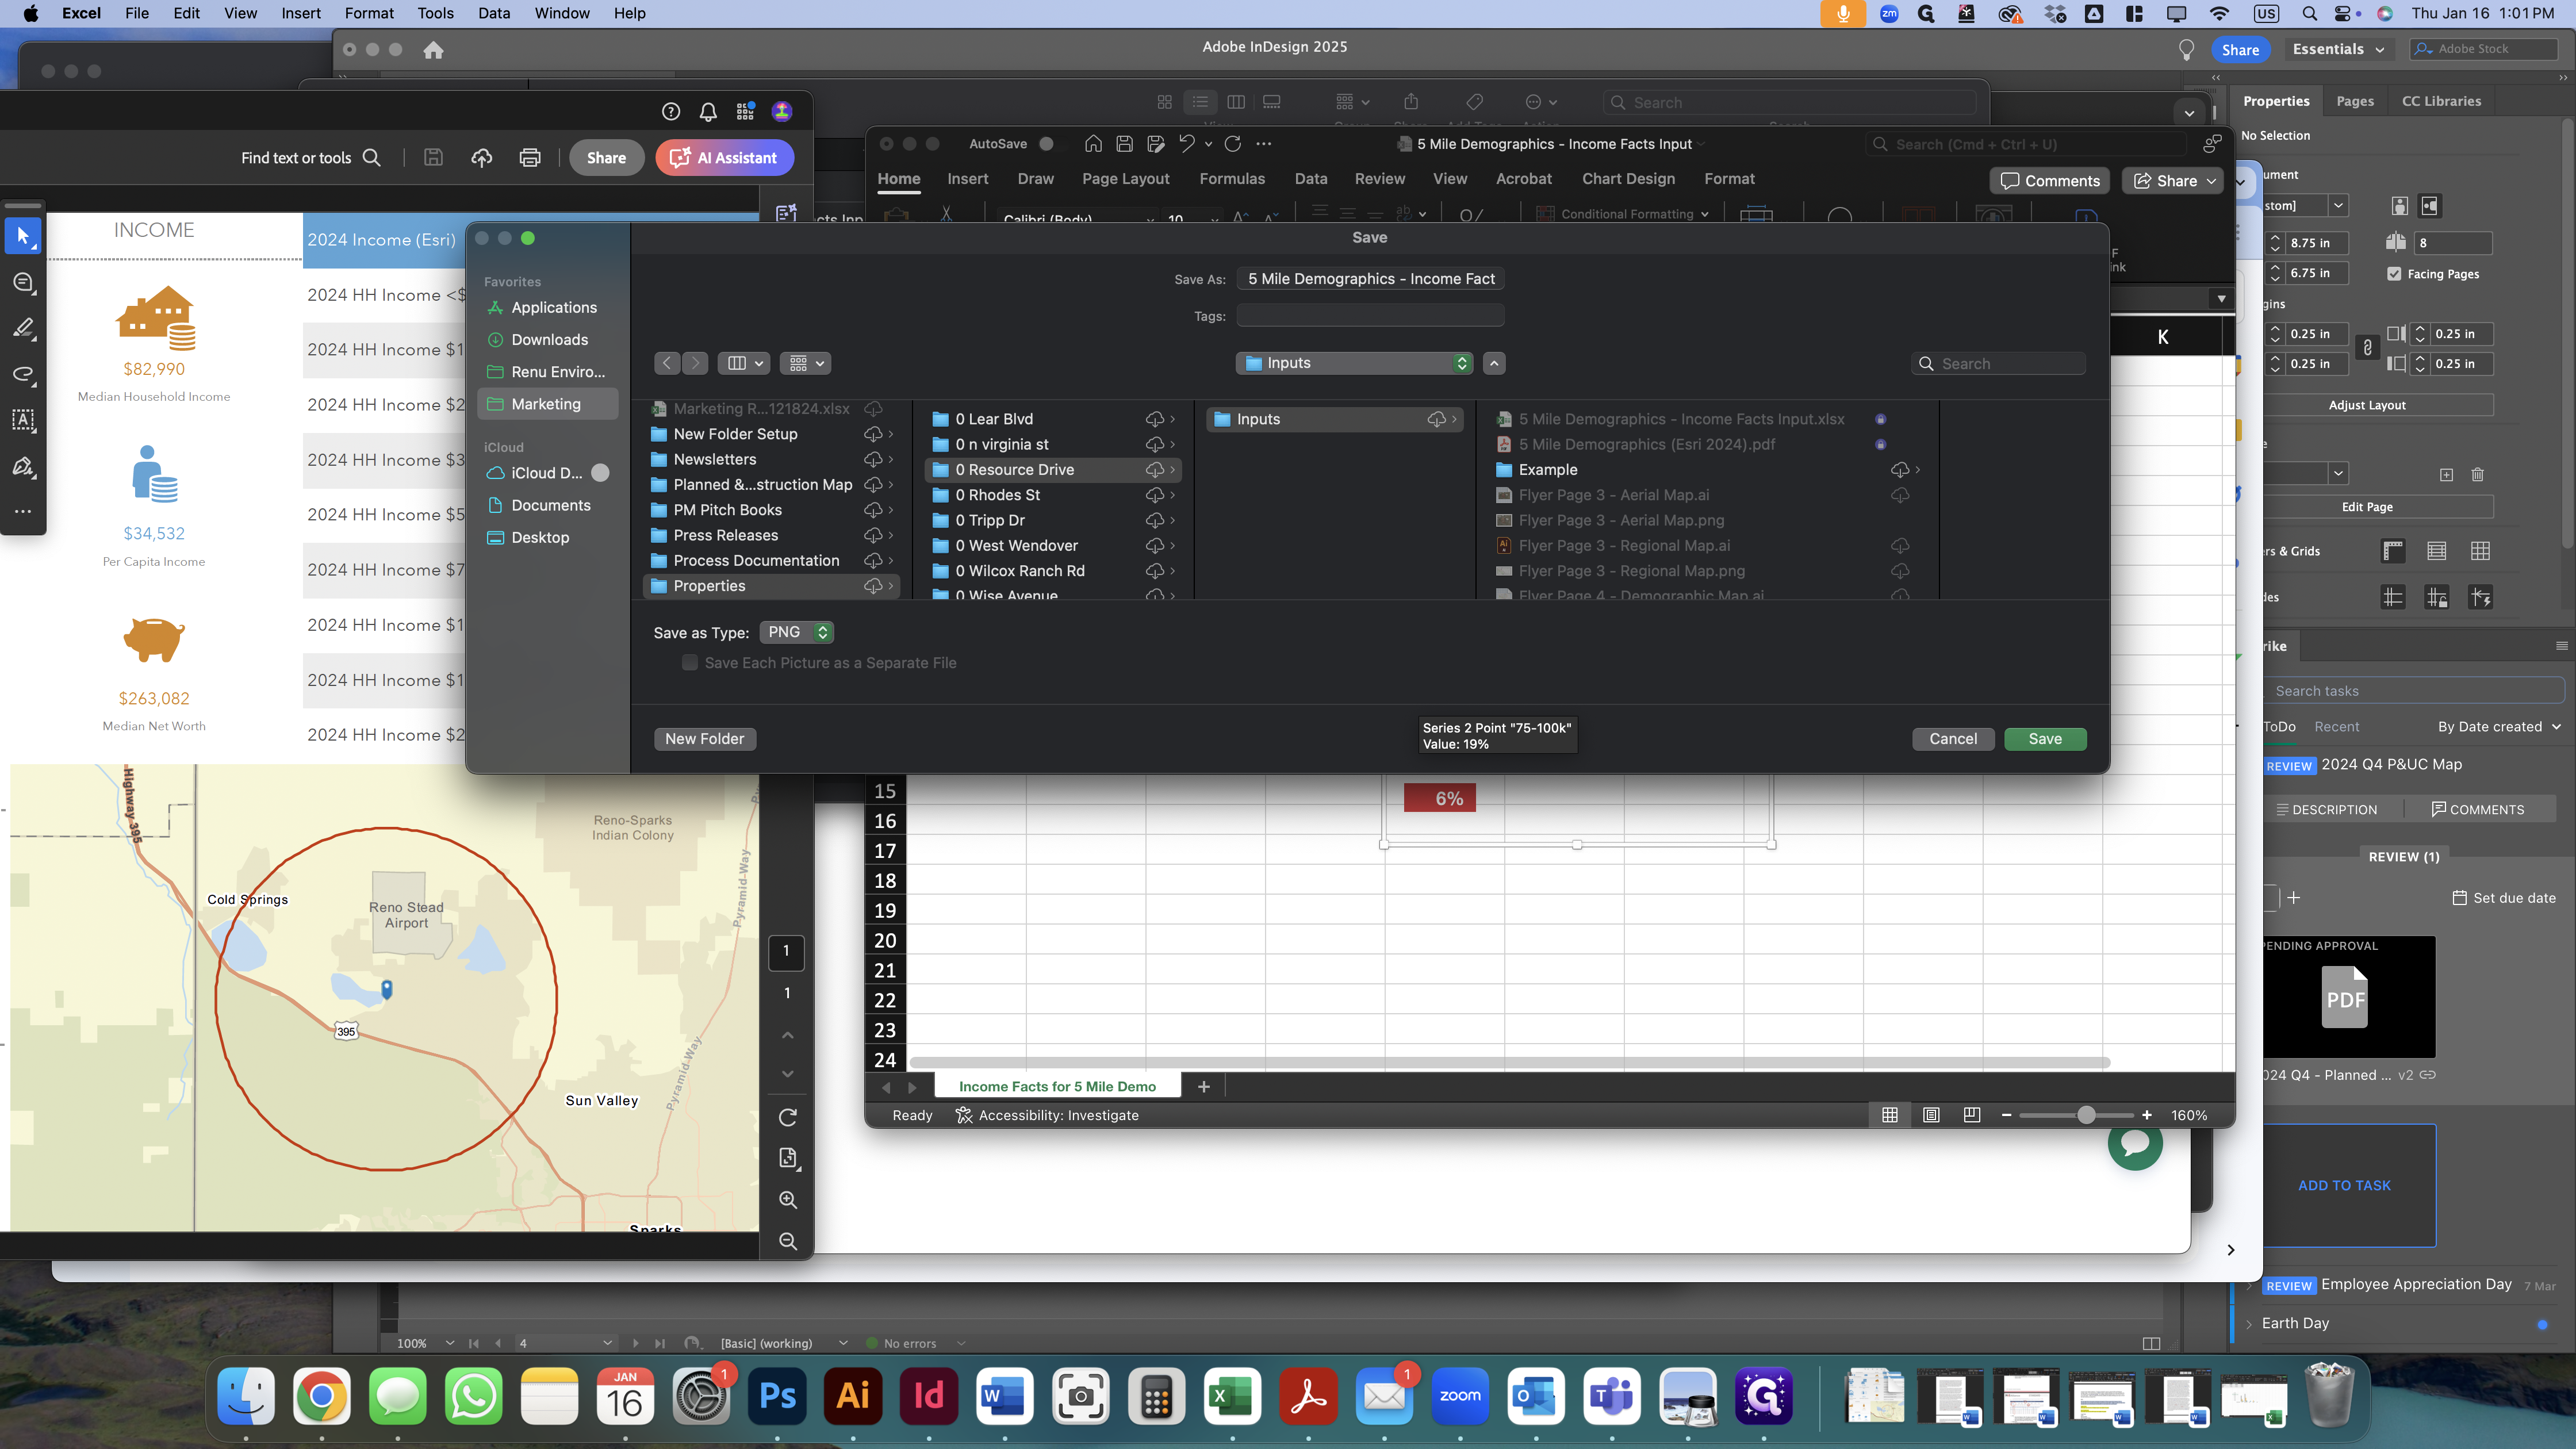
Save it as a picture in the inputs folder of the subject property you're working on. Name it the same as the Excel spreadsheet by clicking on the spreadsheet while the save window is open.

Next, go to your flyer template in InDesign and fill out the demographic information using the PDF we just generated.
Keep the following in mind while you're updating the figures:
Unemployment should be rounded to 1 decimal place
Household size should be rounded to 1 decimal place
Median age should be a whole number (no decimal places)
The education percentages should add to 100%. Due to rounding errors in the software, this might not happen, and you may need to add 1% to one or more sections. However, if the sum is 99%, add one percentage point to the lowest category.
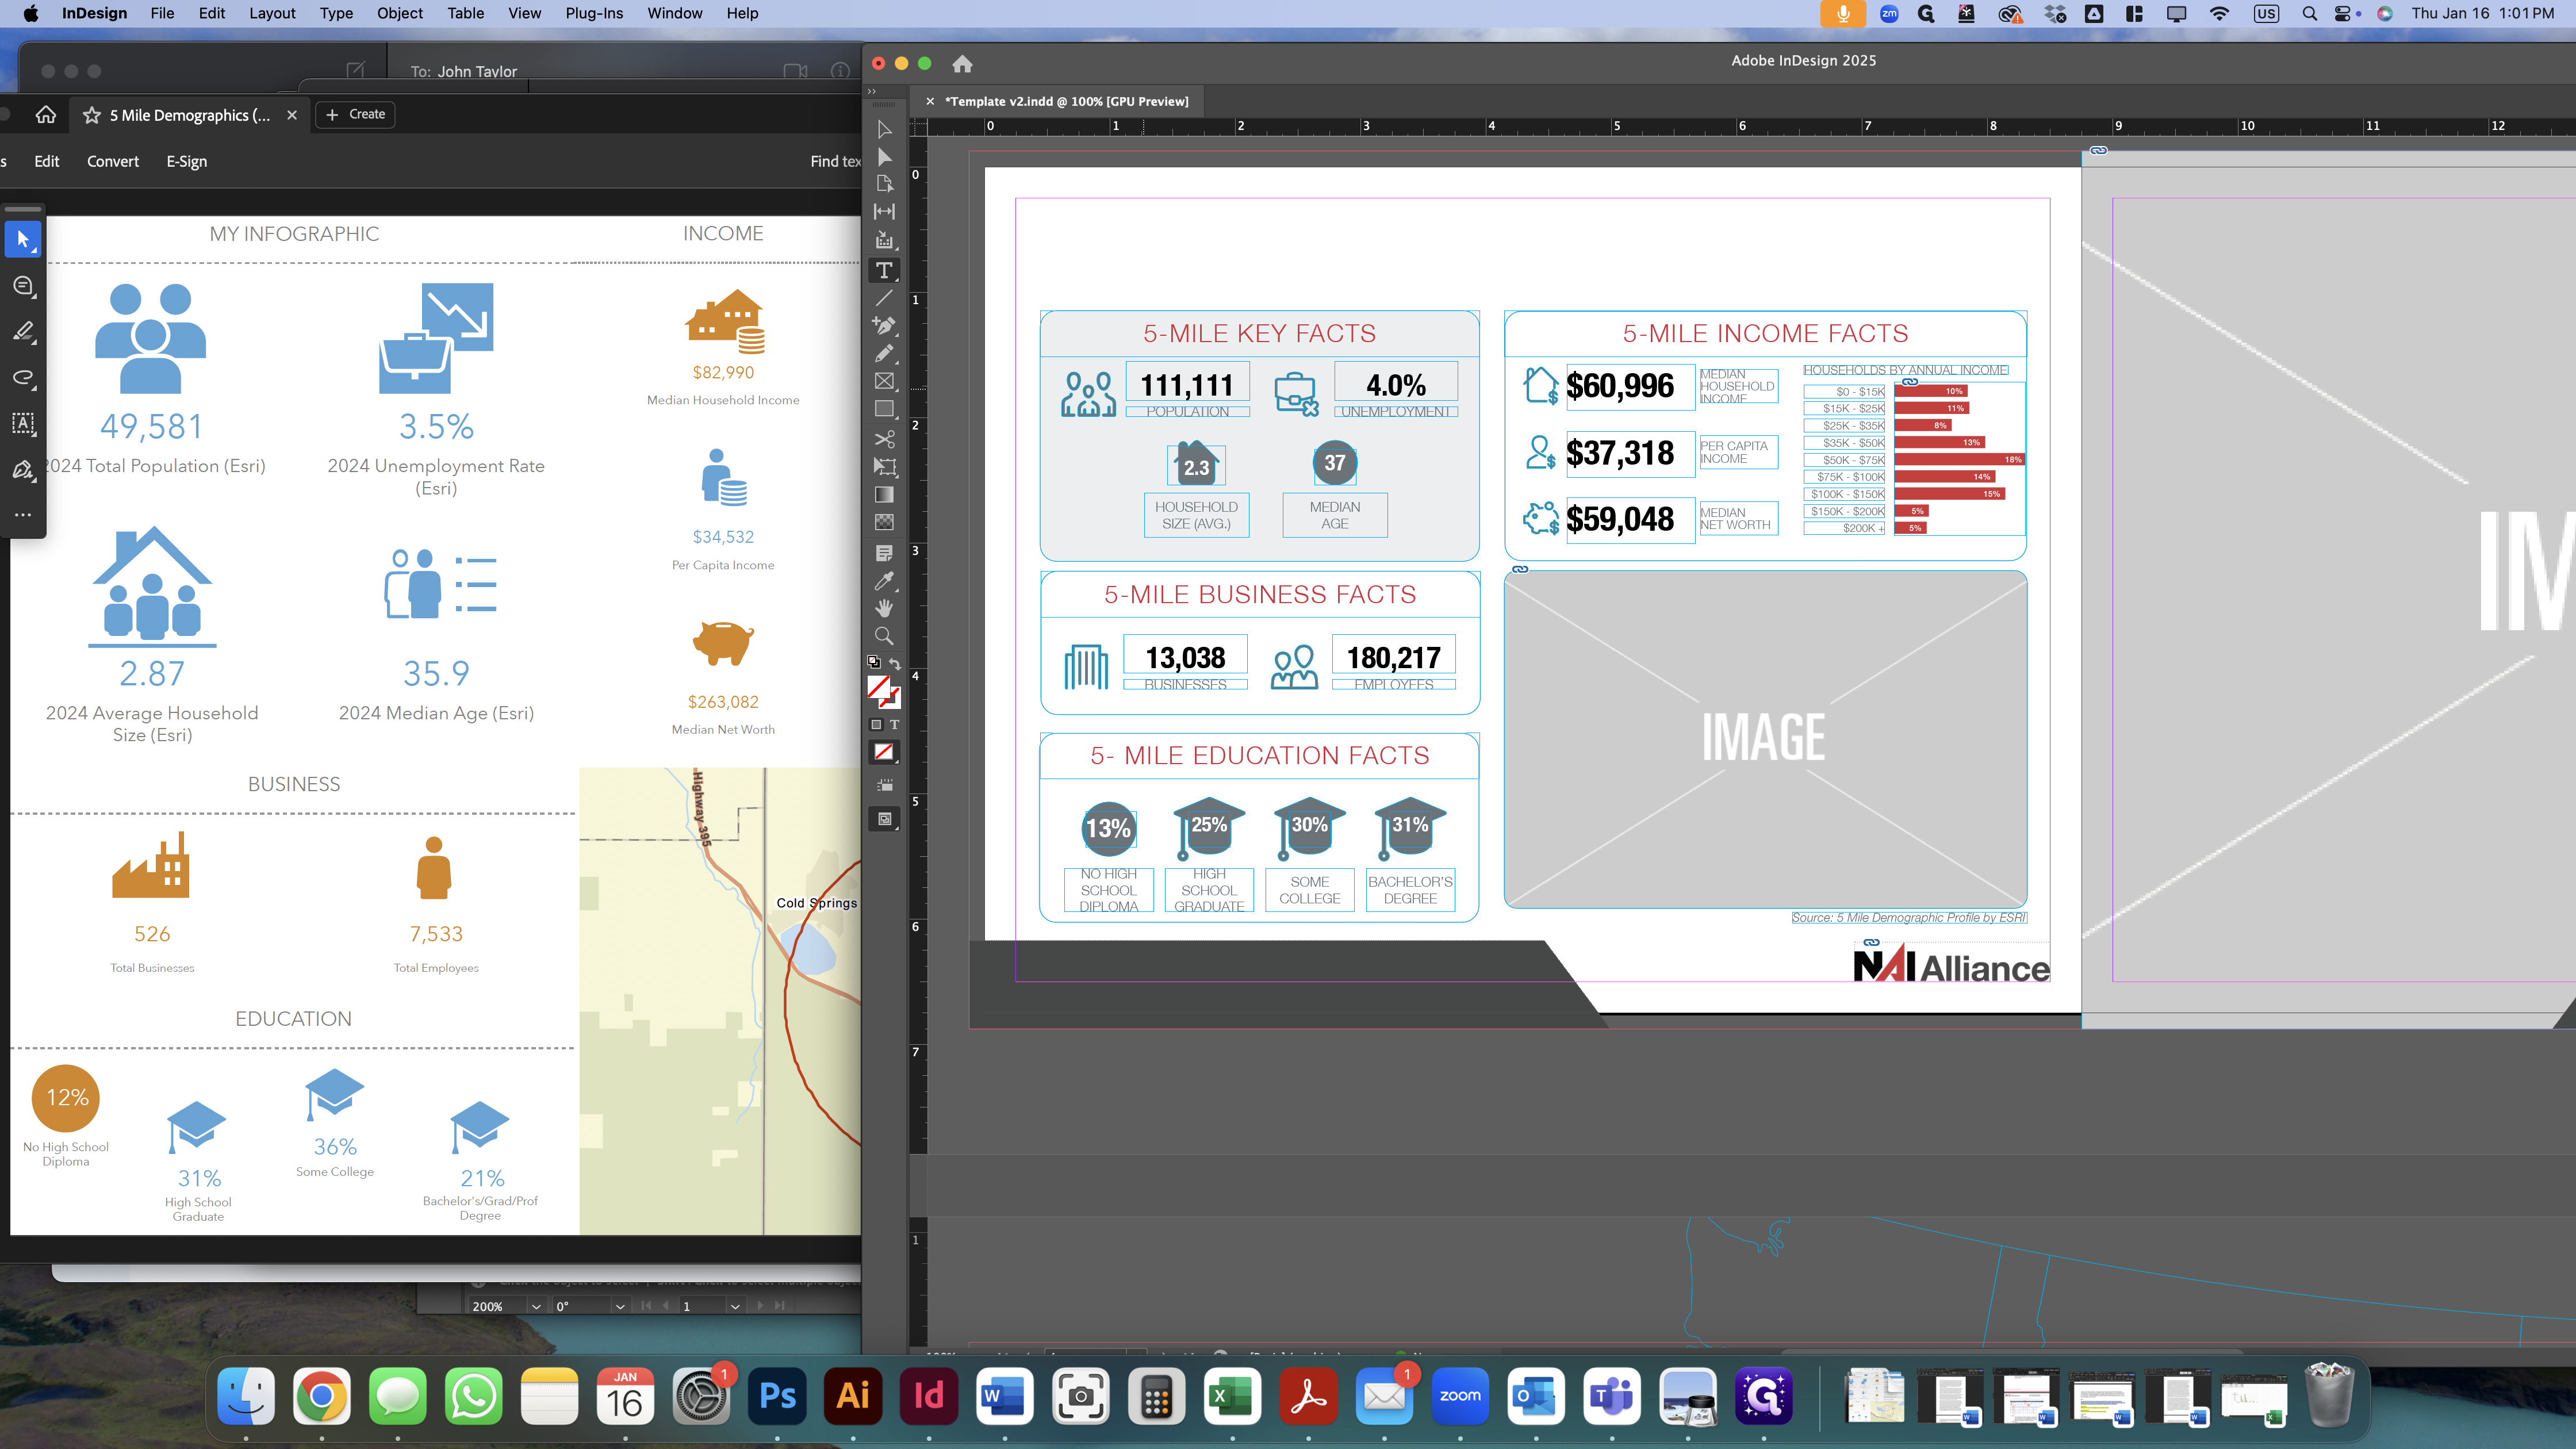
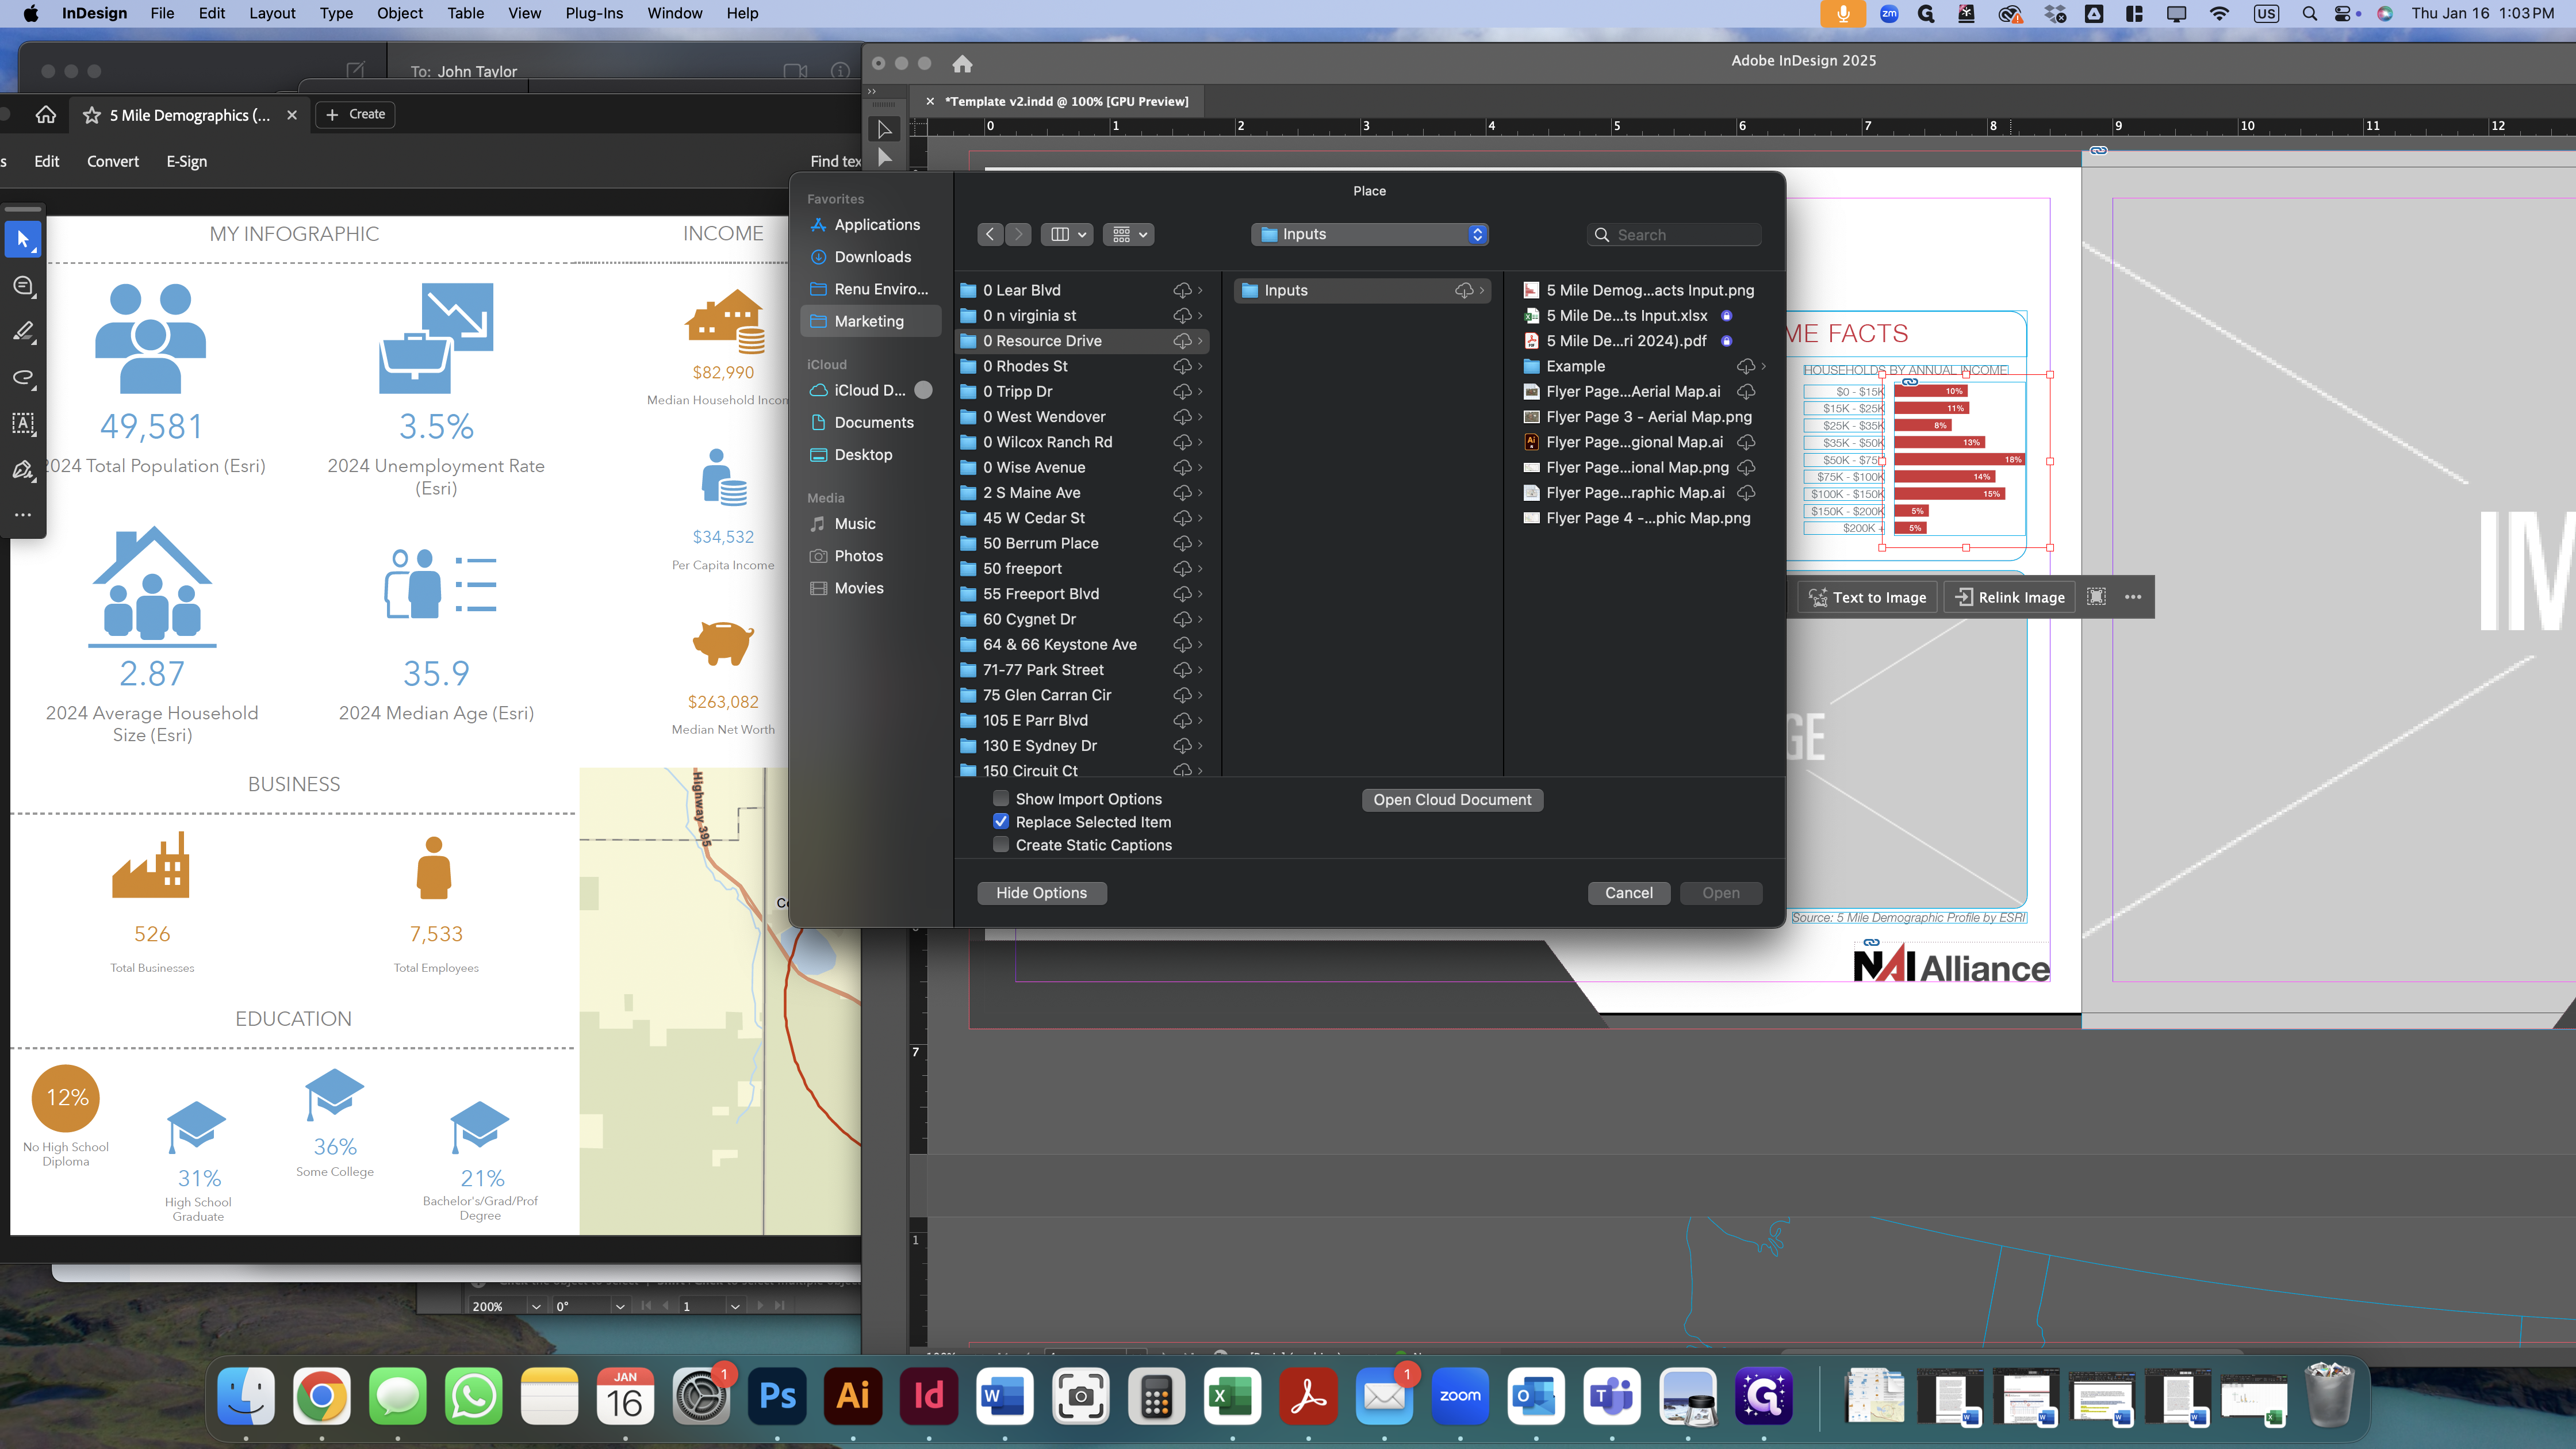
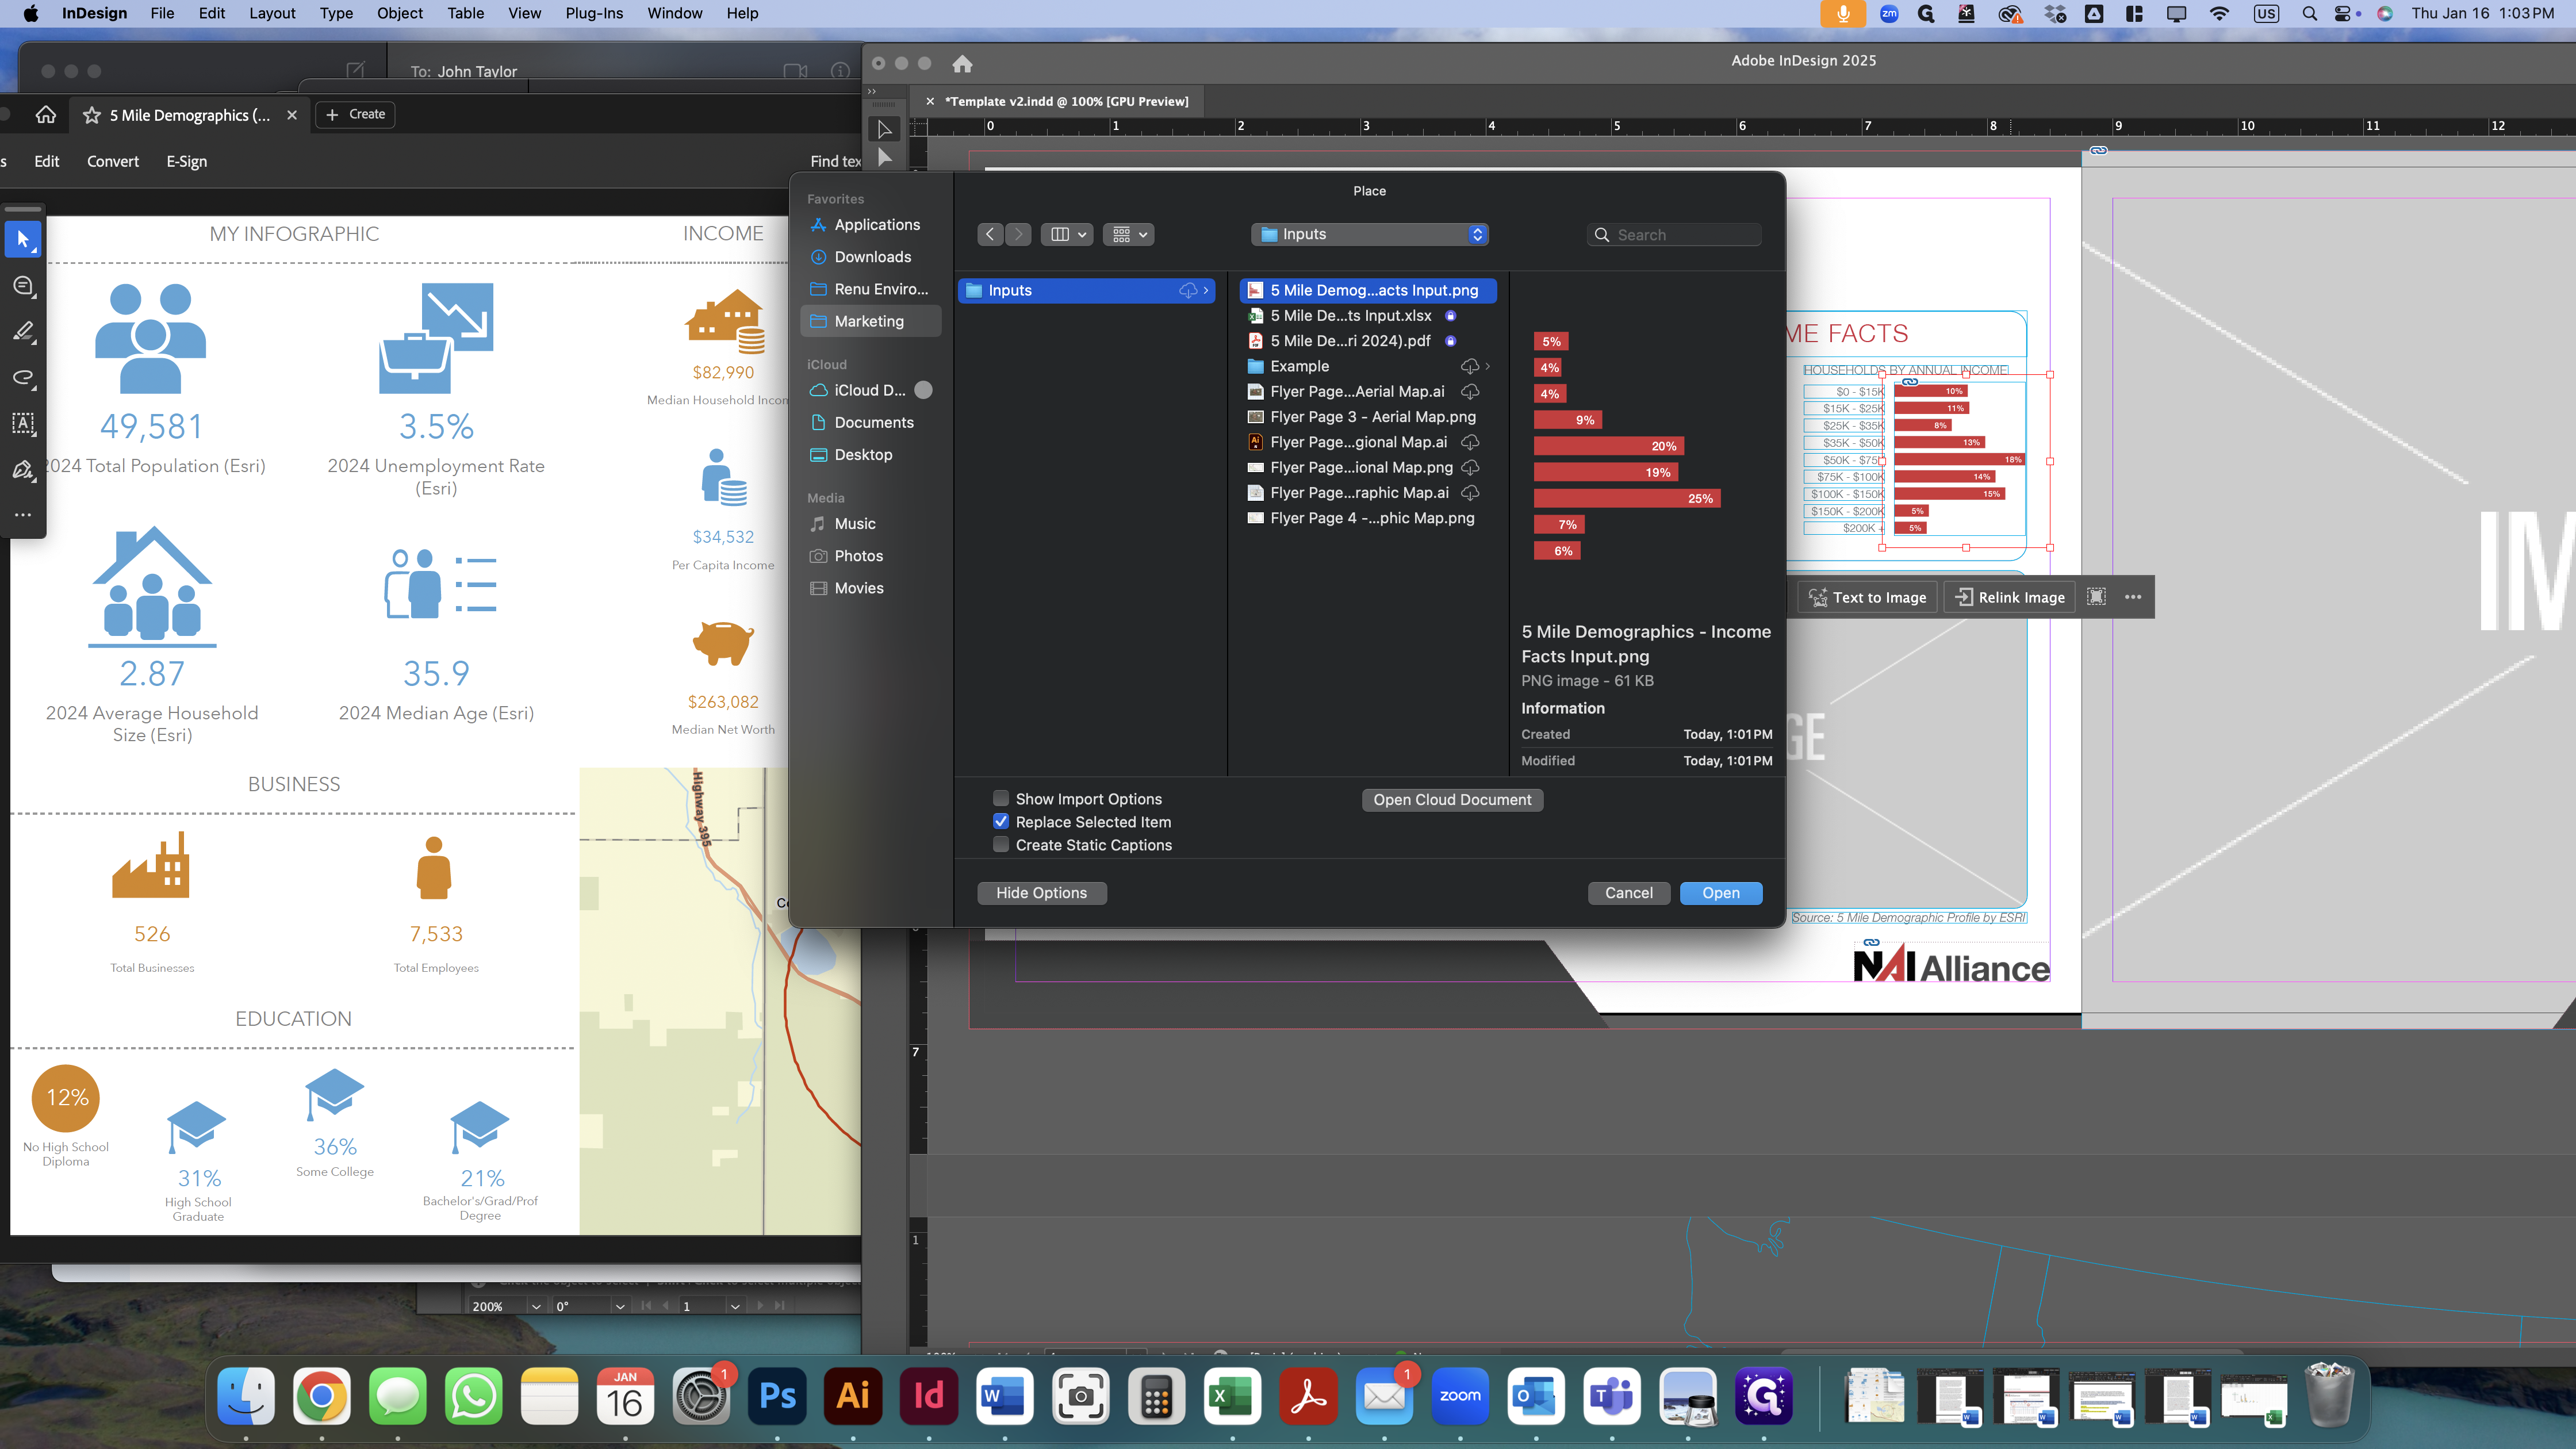
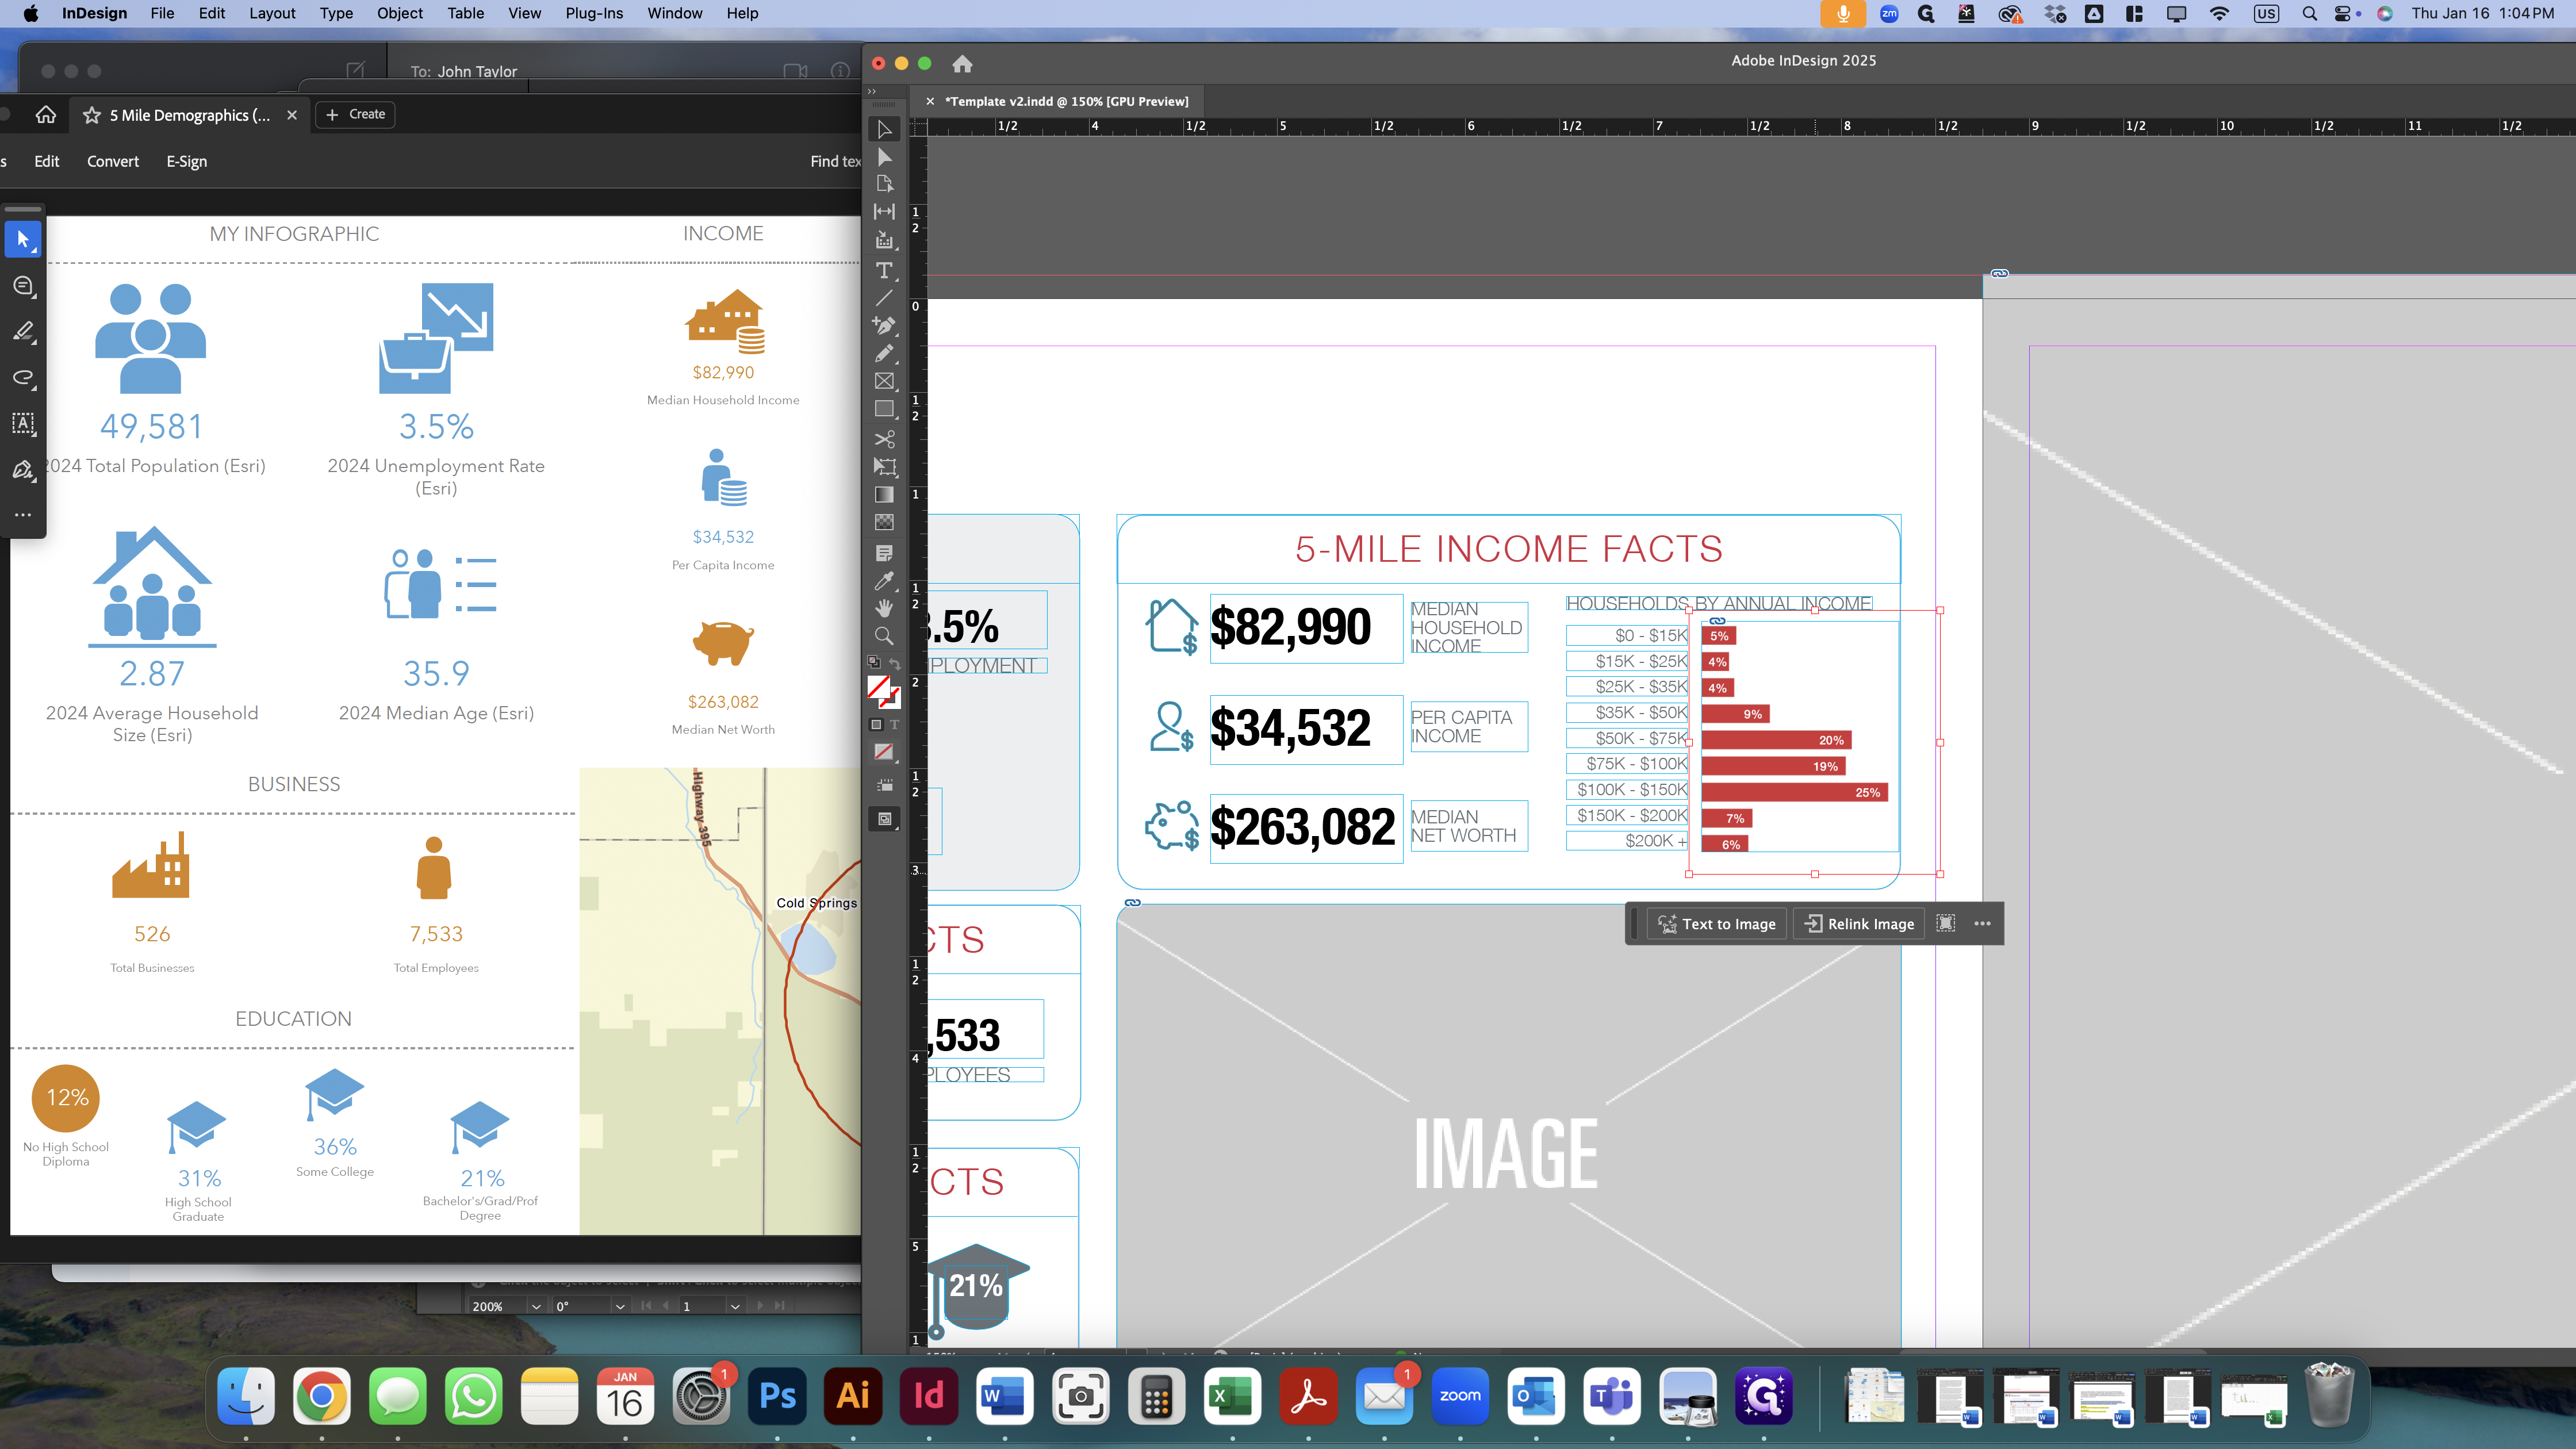
Finally, relink the "households by annual income" image to the one you just created. Go to the subject property inputs folder and select the five-mile demographics income facts input image you just made.
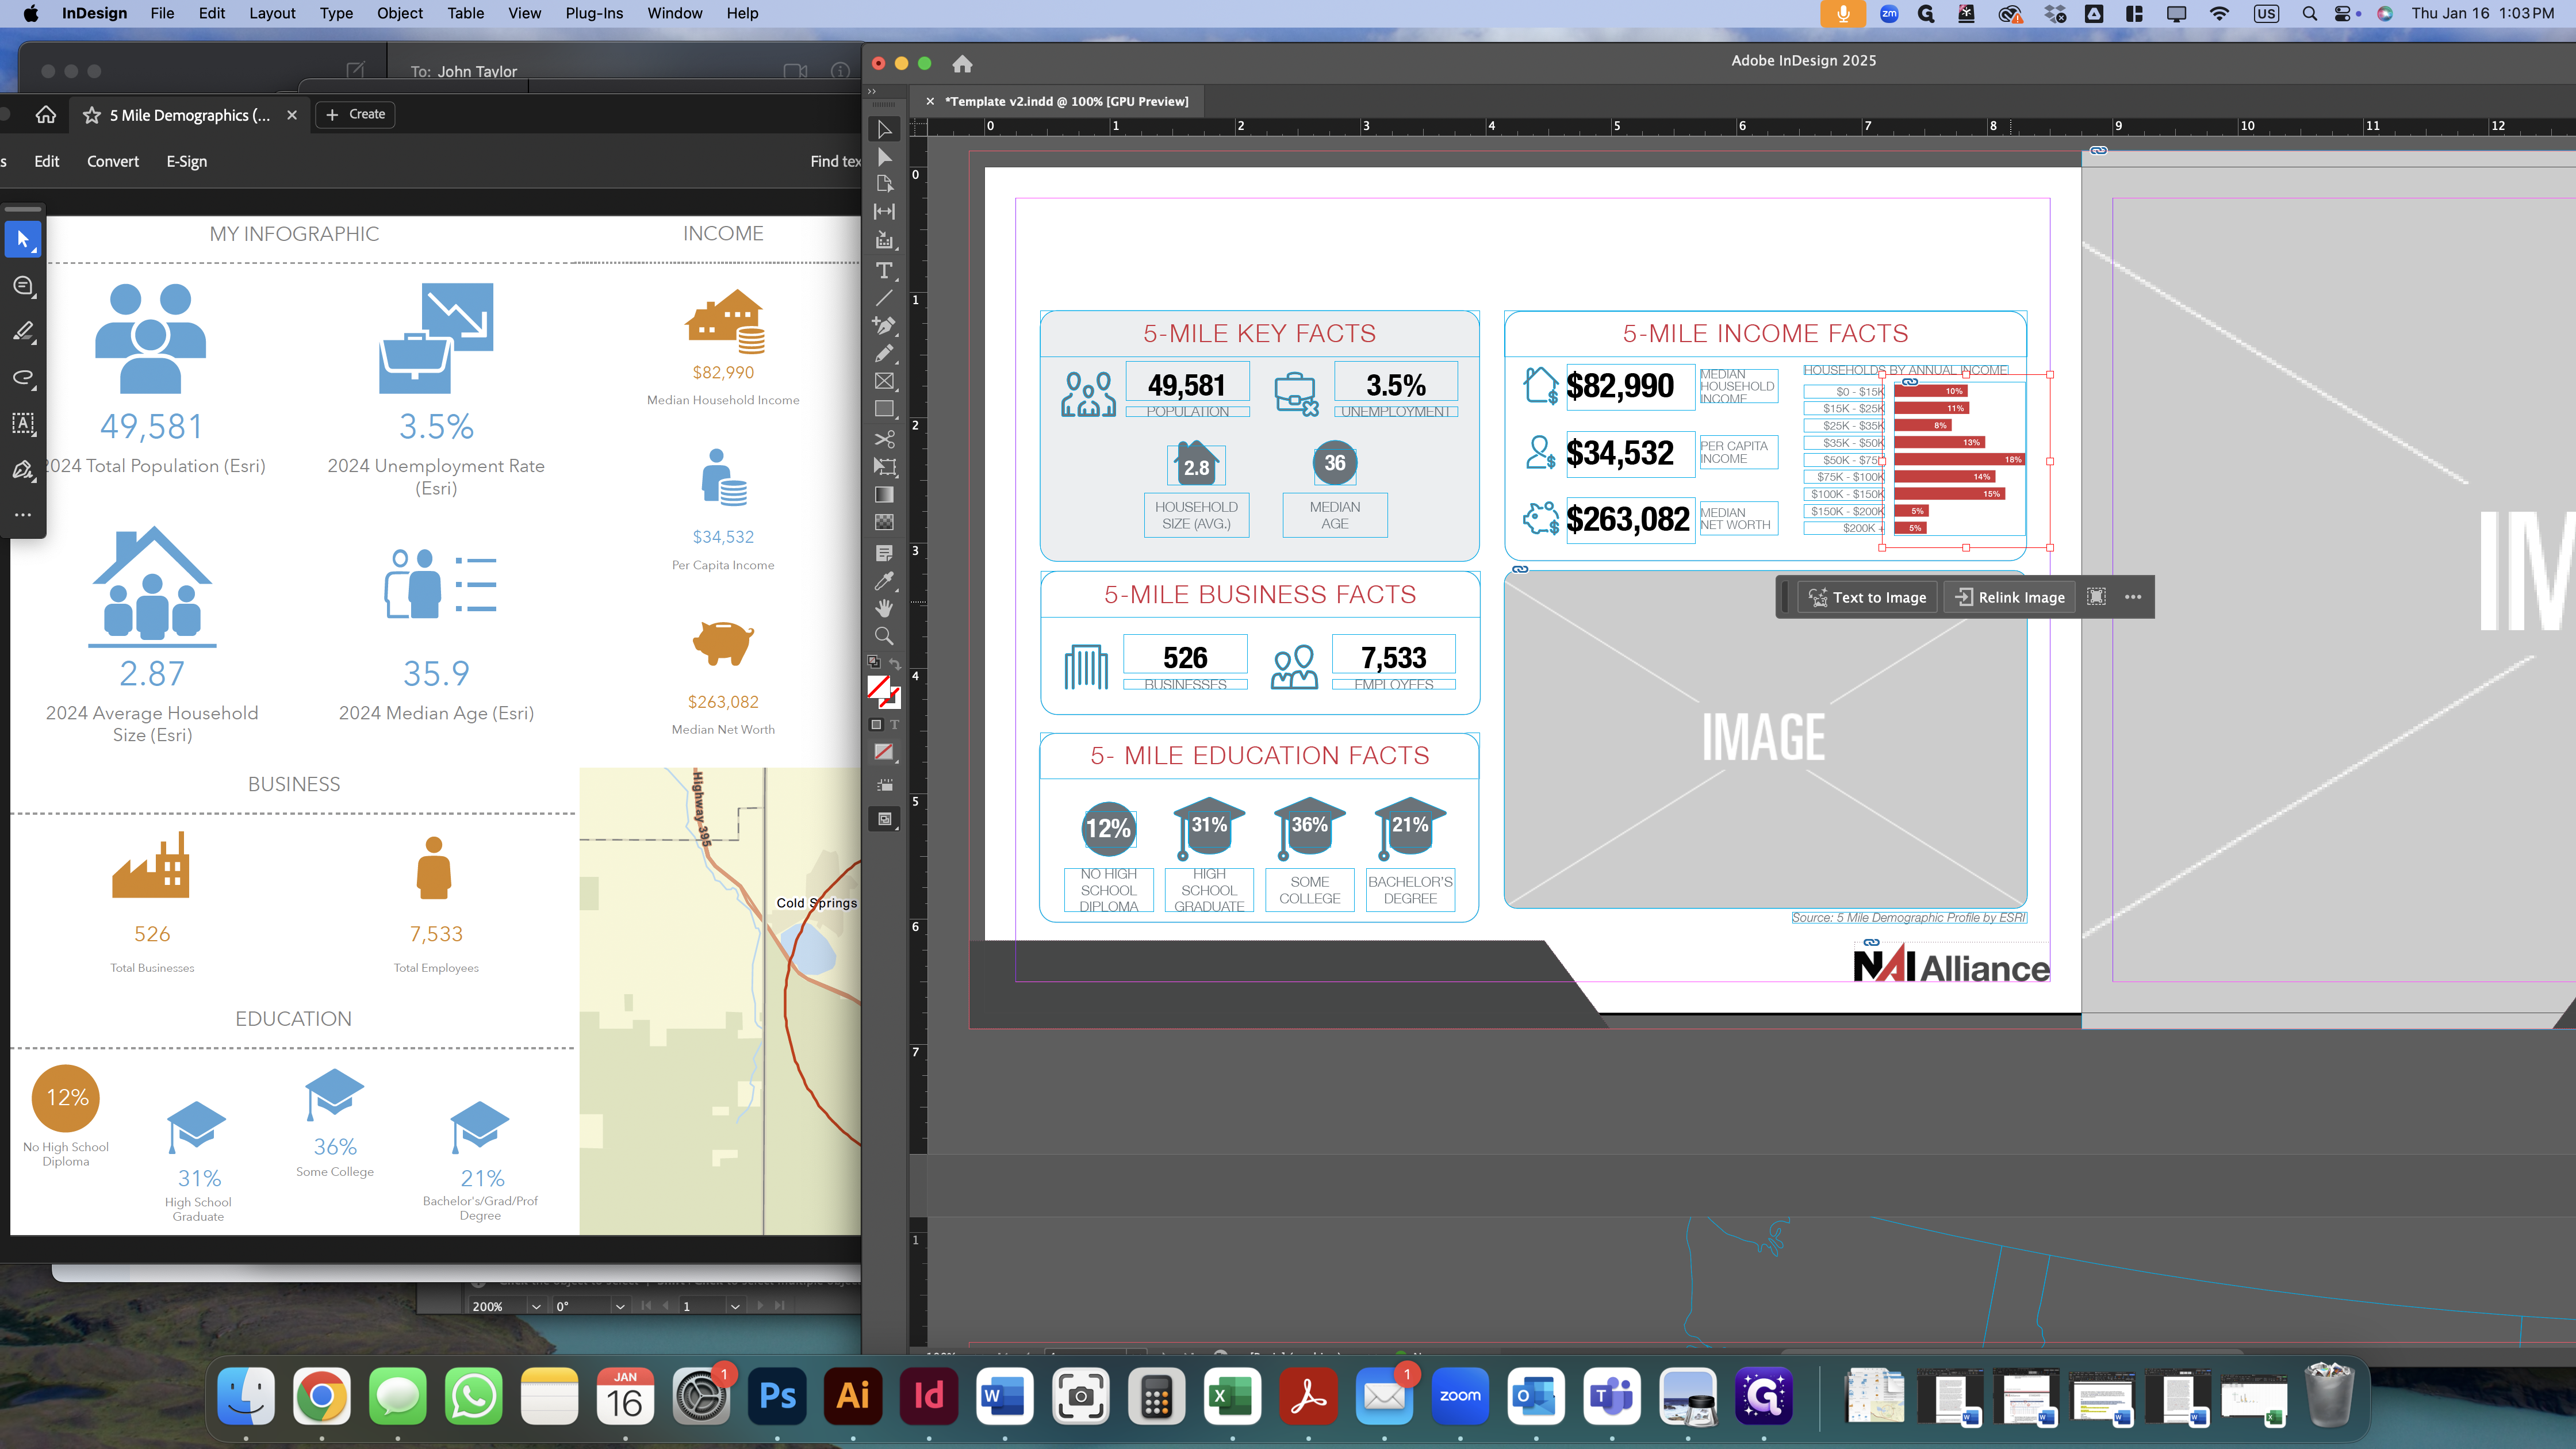
Move the image (not the box containing the image, just the image) to the right a bit so that the full bar of the graph is visible.
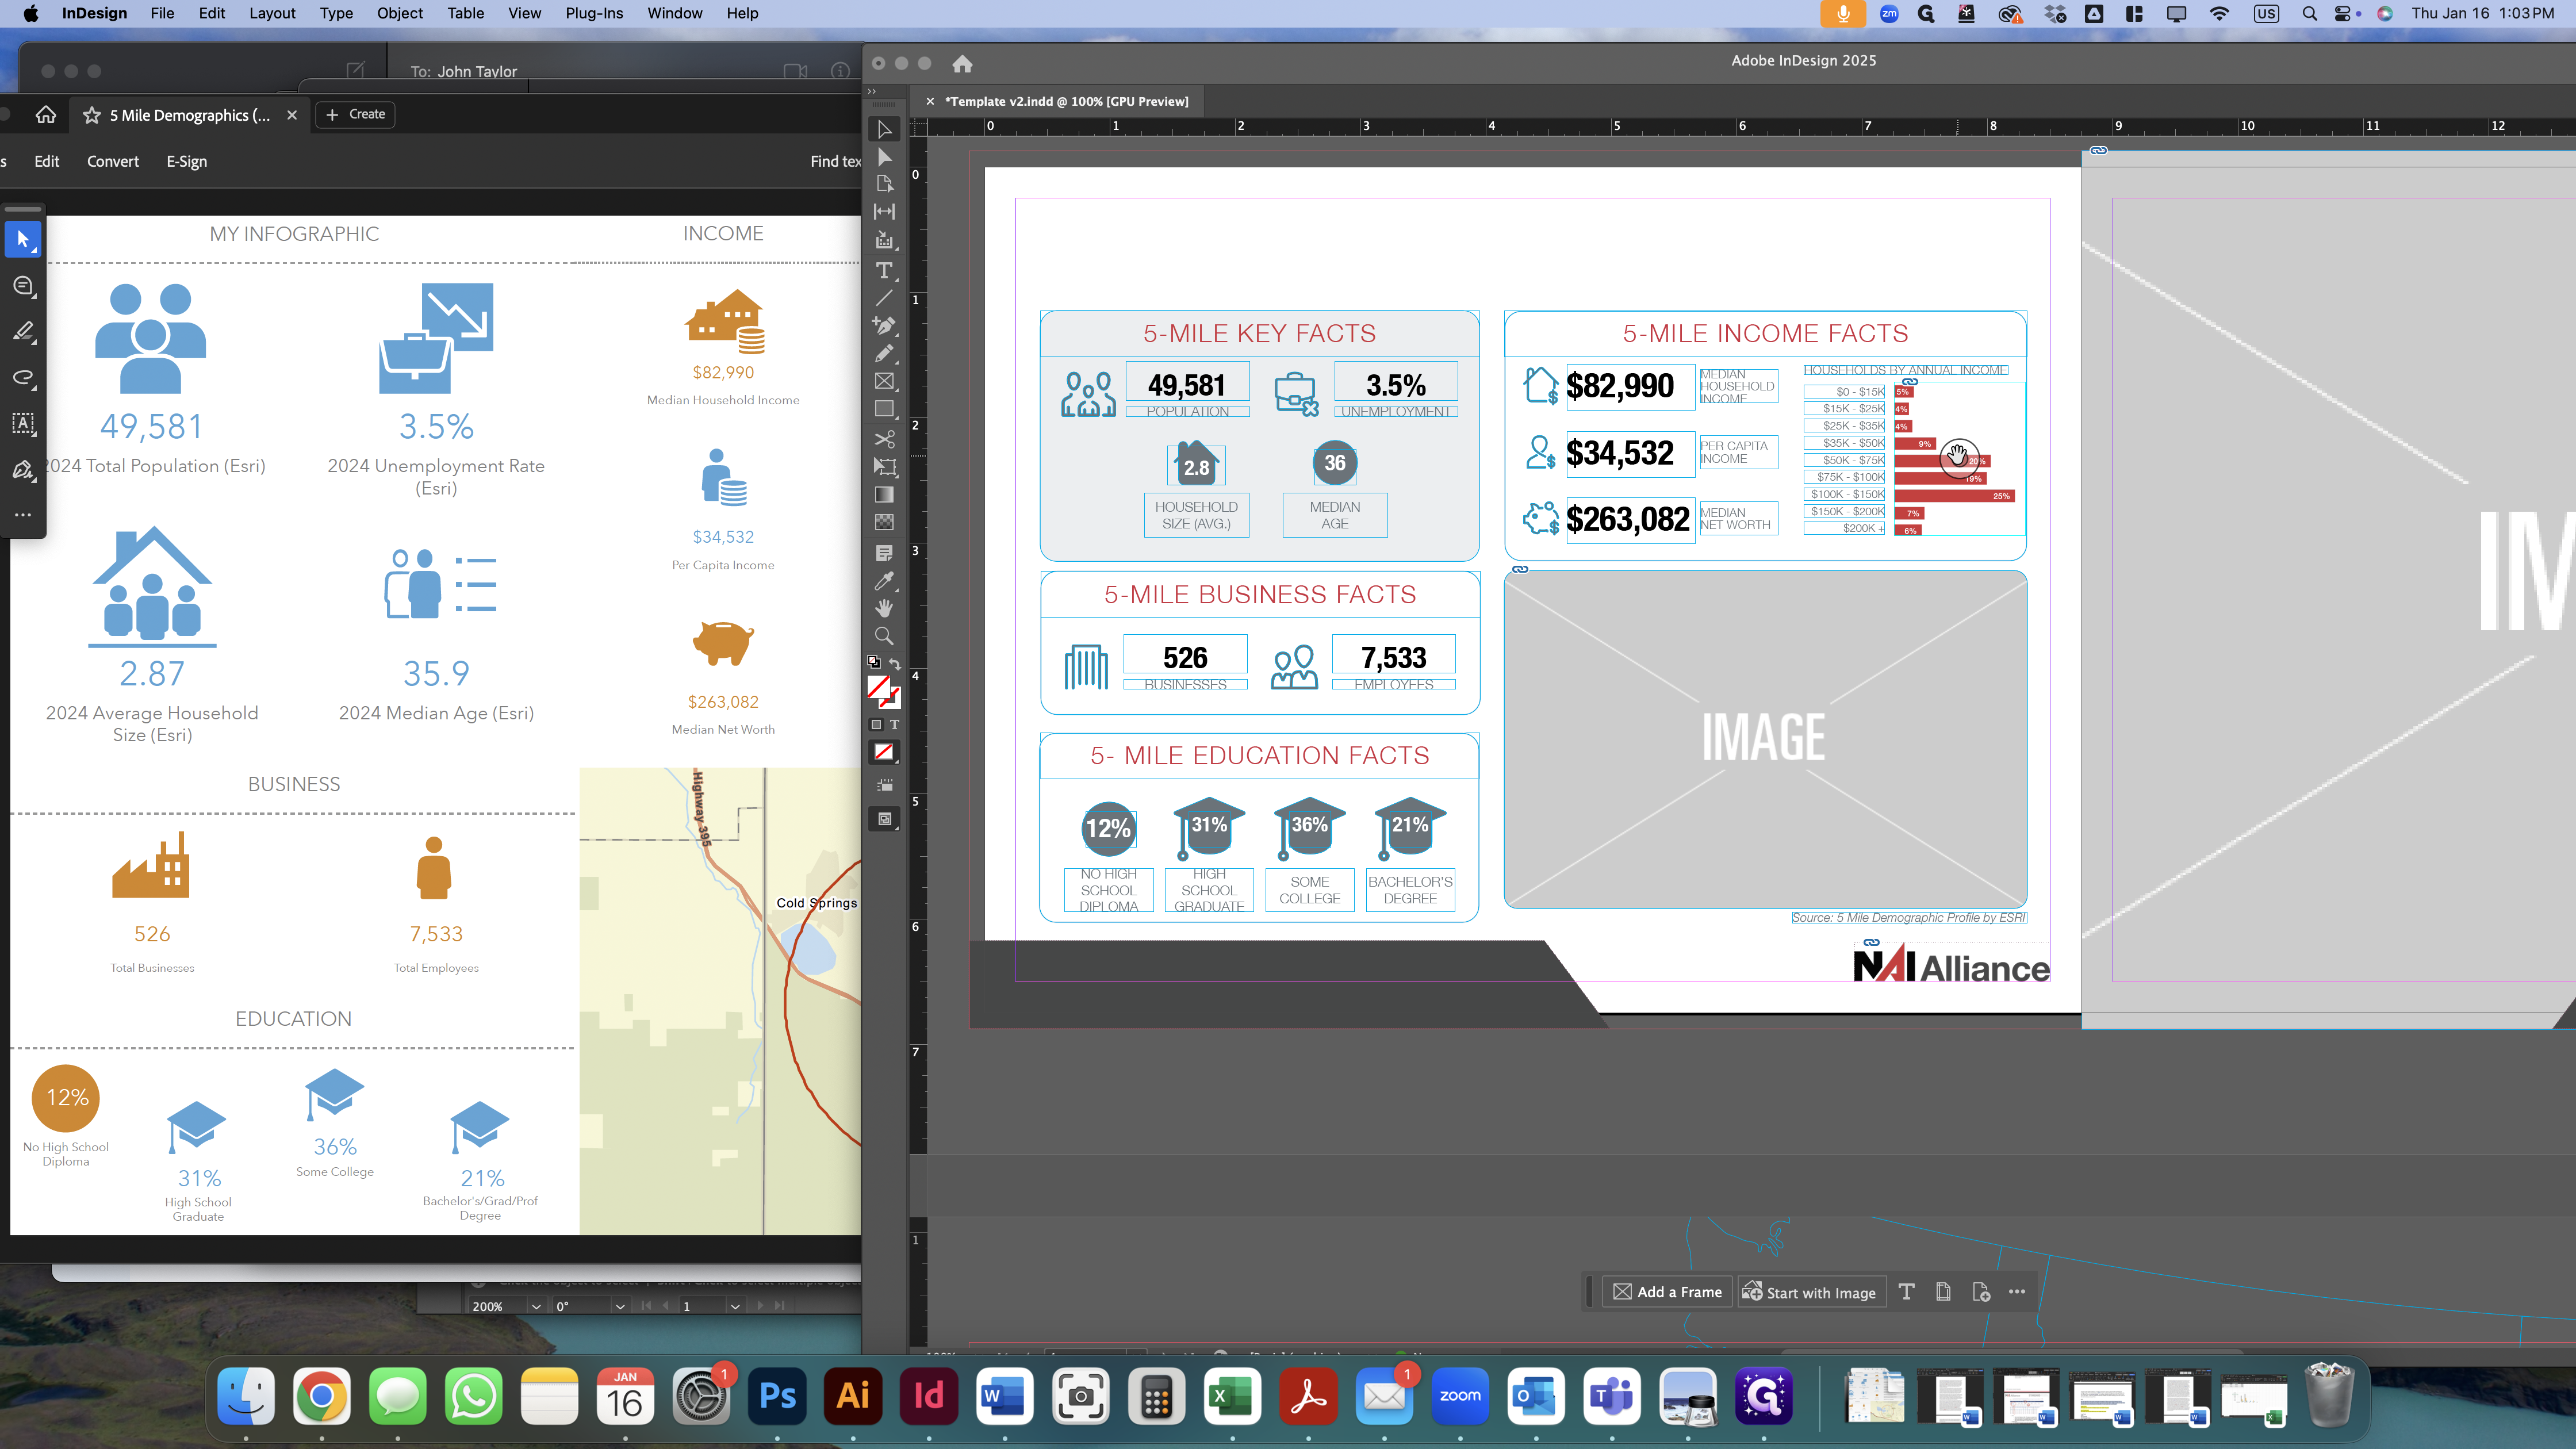
That's it! You're done.