
How to Access the Power BI OrderWise Dashboard
Learn how to access Power BI via a web browser to view the OrderWise V3 dashboard, track production stats, and review lab data.
This guide explains how to log into Power BI through a web browser to access the OrderWise V3 dashboard. Completing this ensures you can review key production, sales, and lab data directly without needing to route through Microsoft Teams.
This guide applies to Resincoat team members who need to monitor production statistics, sales activity, and lab data. It is used when you need direct, full-window access to reporting dashboards during your daily workflow.
To view Resincoat metrics outside of Microsoft Teams, you can access Power BI directly through any web browser (such as Google Chrome).
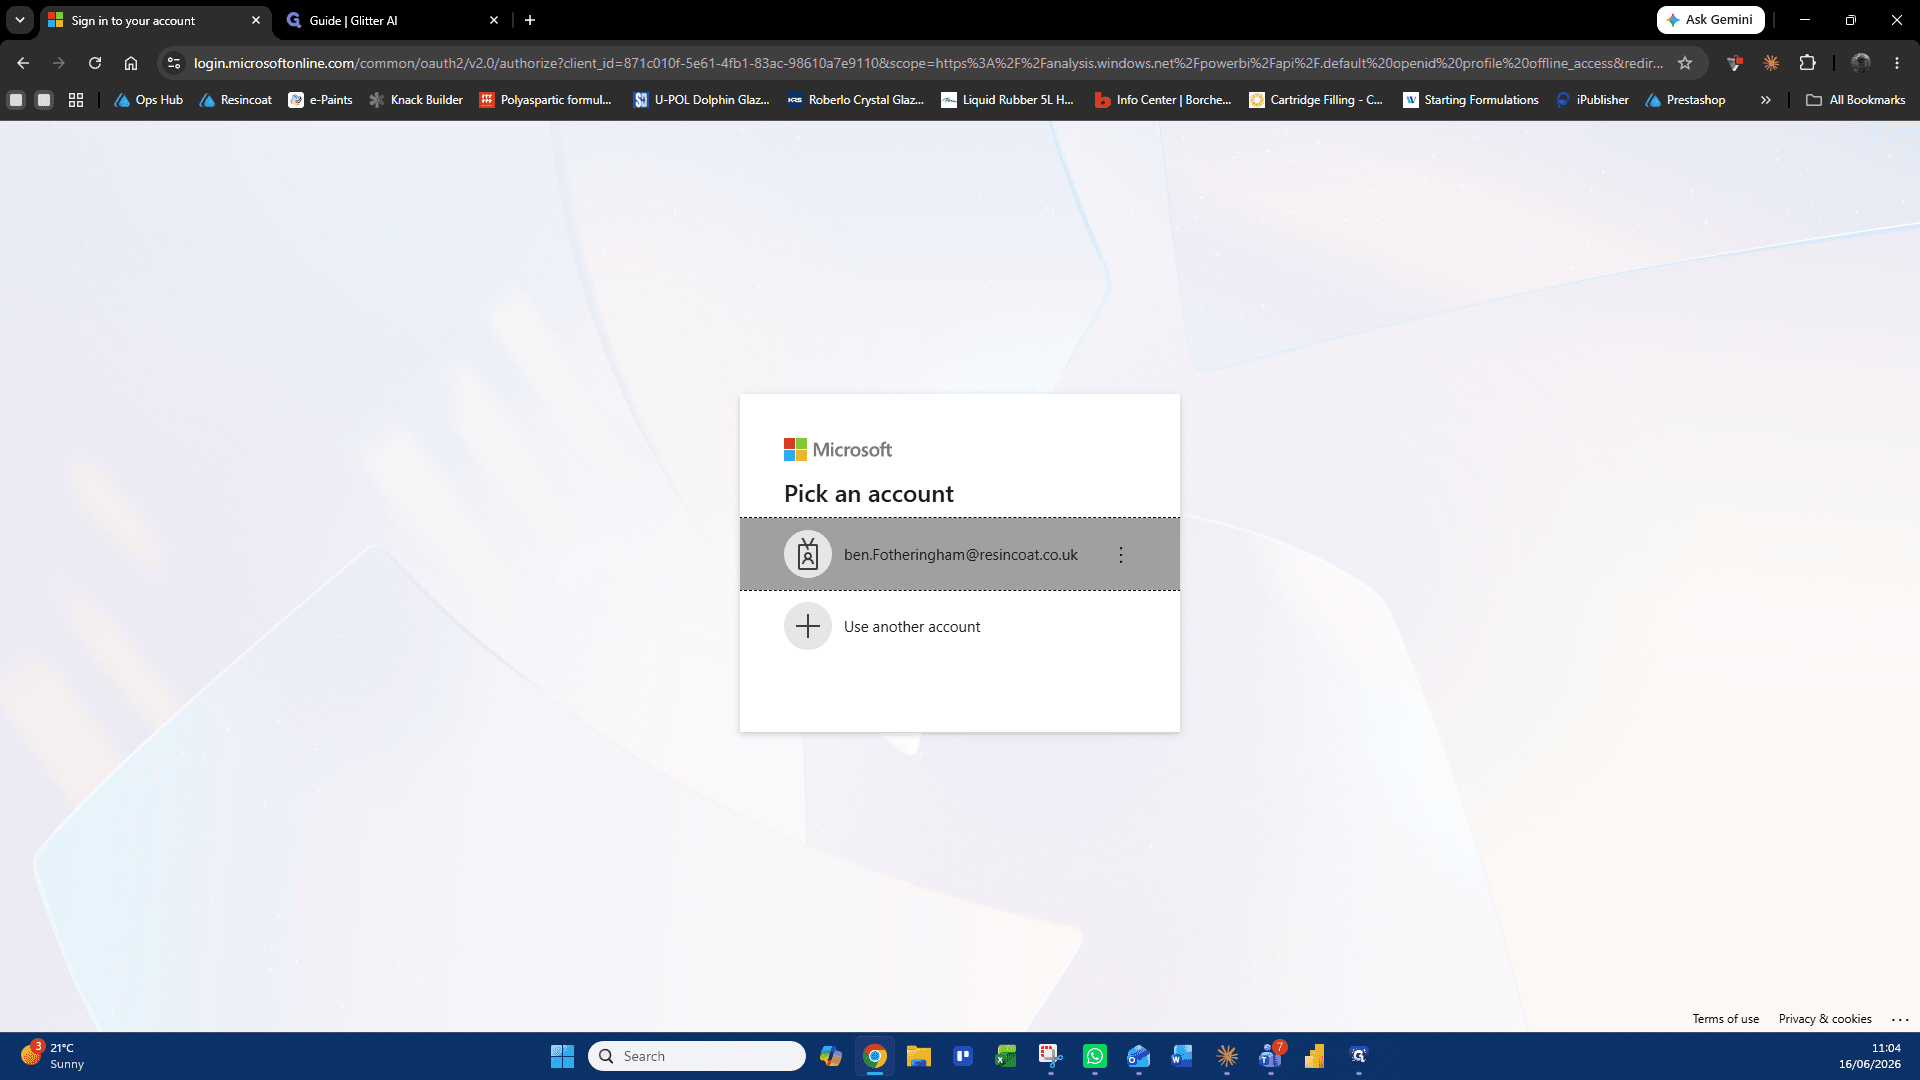
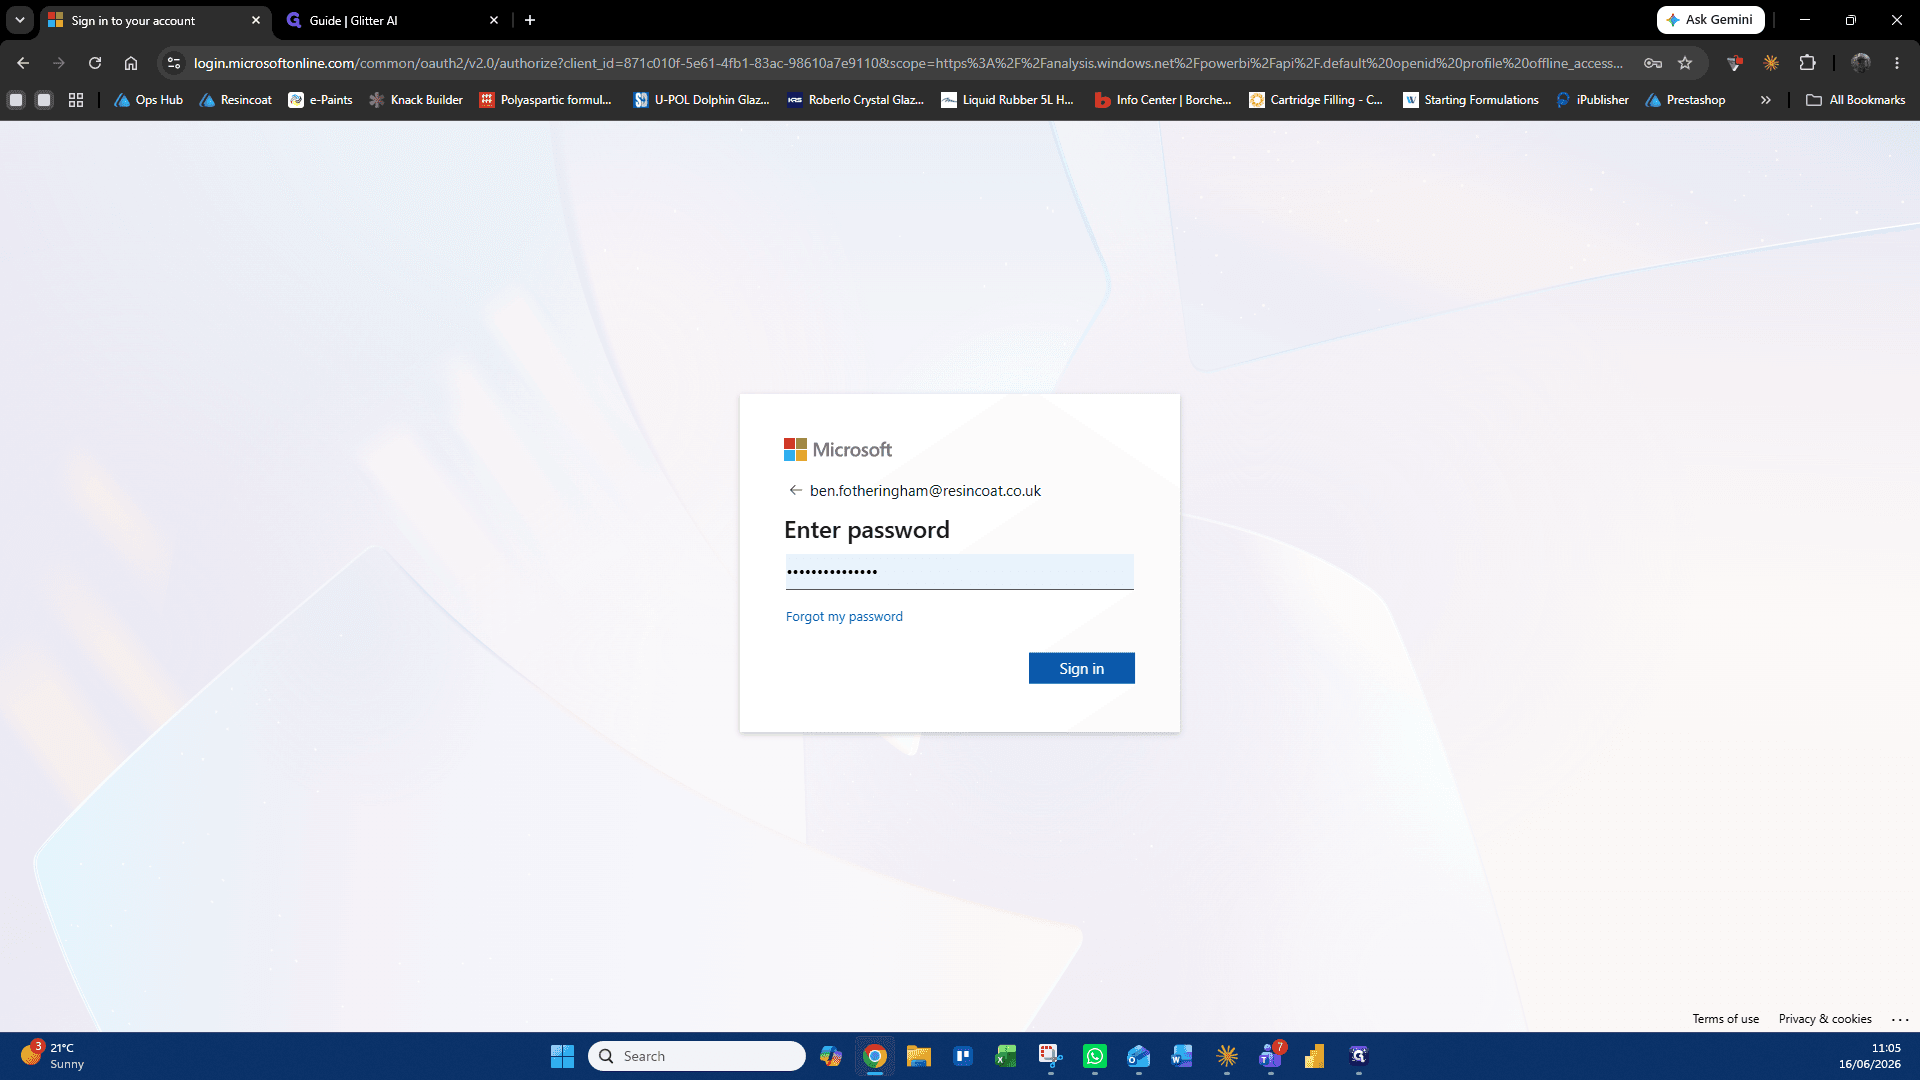
Logging into Power BI
Accessing OrderWise V3
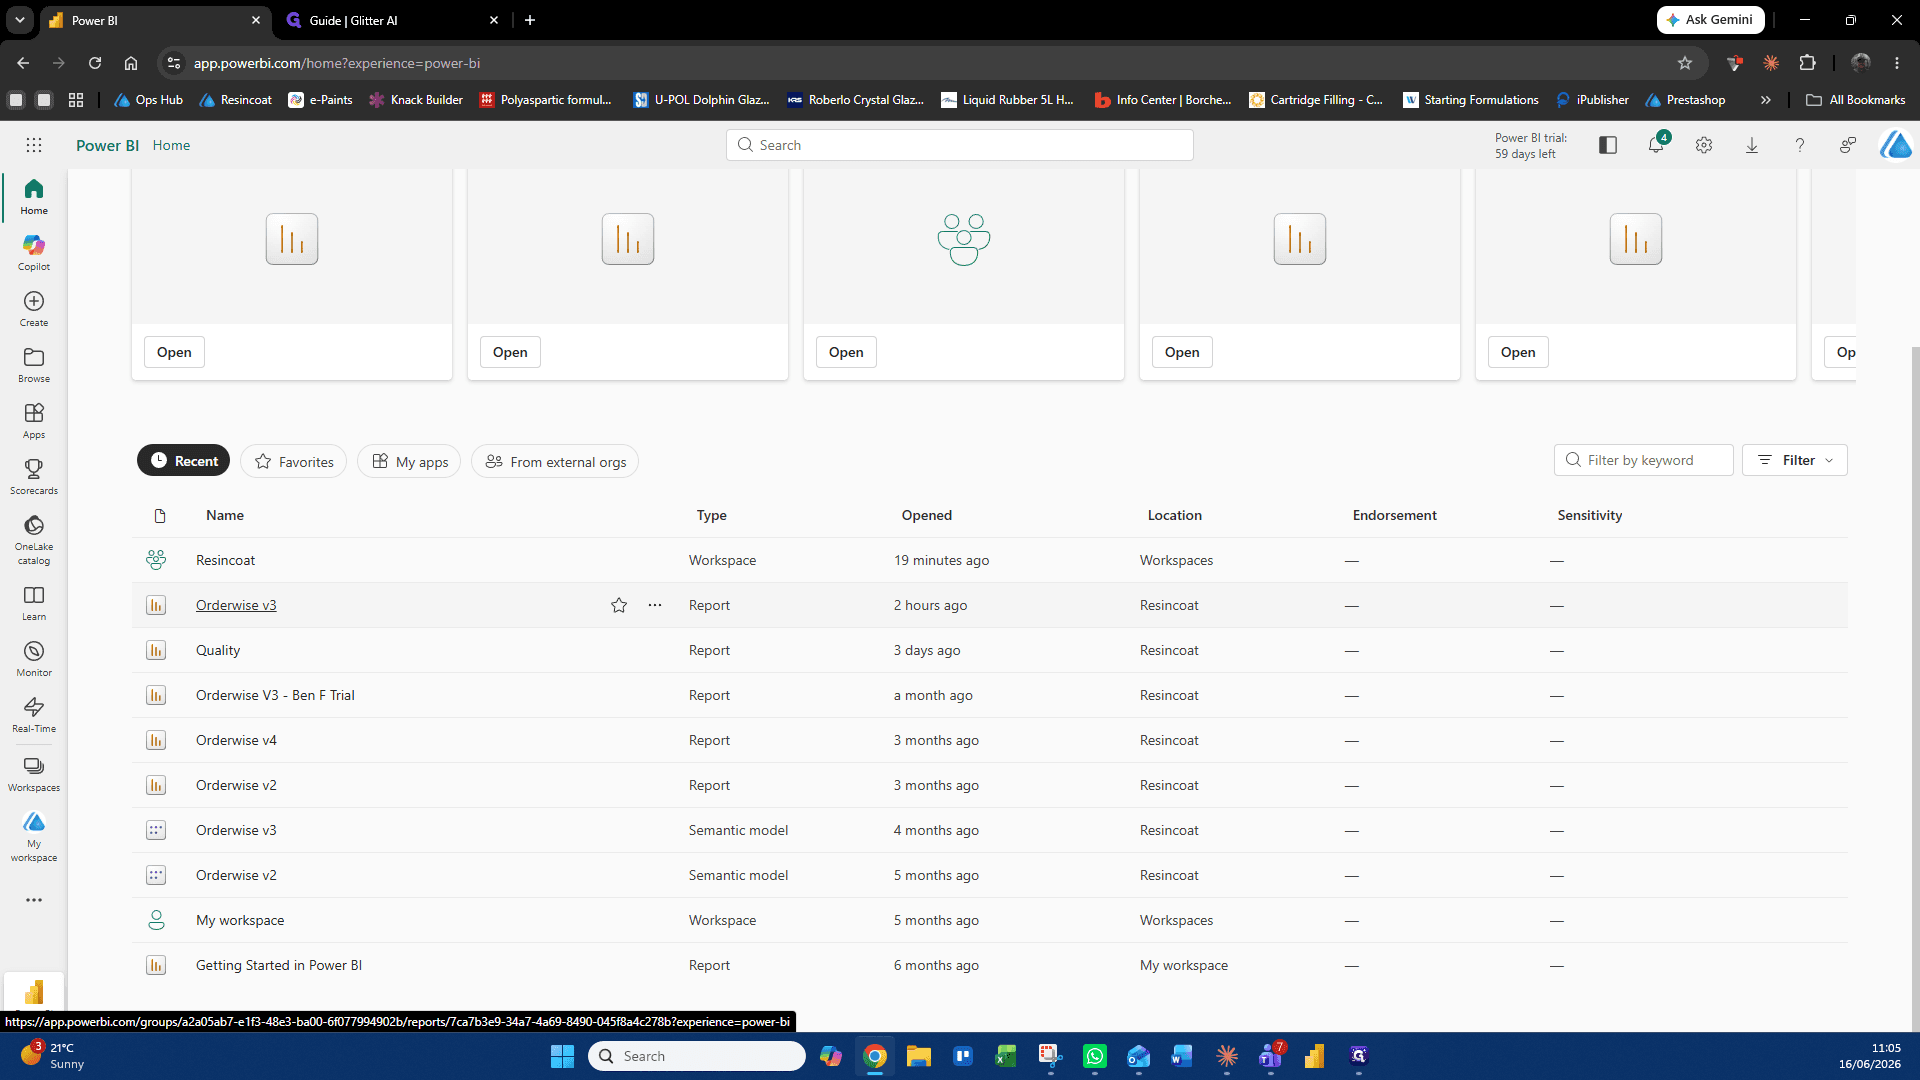
Once logged in, you will see your available workspaces and recent reports.
Dashboard Modules Overview
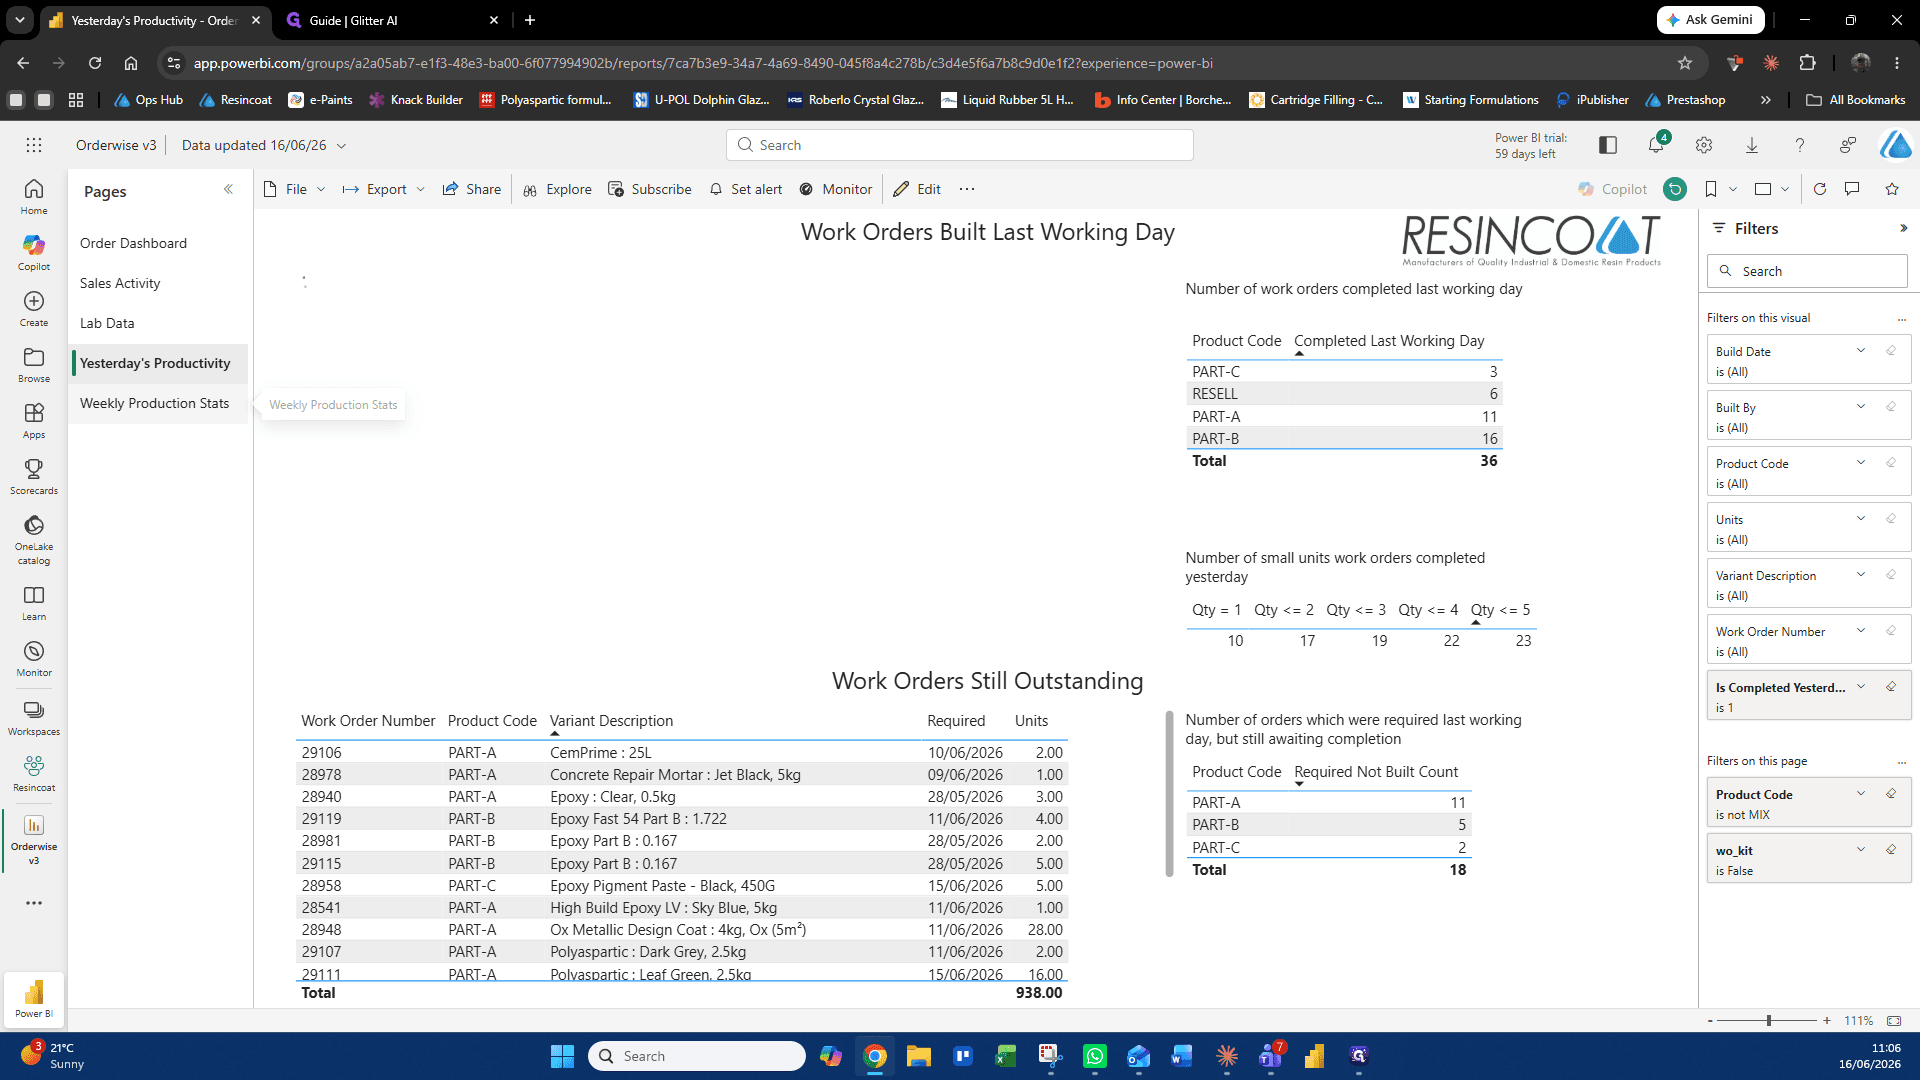
The OrderWise V3 report contains several tabs located on the left-hand side of the screen. Below is a breakdown of the available dashboard views:
Dashboard Tab | Description |
|---|---|
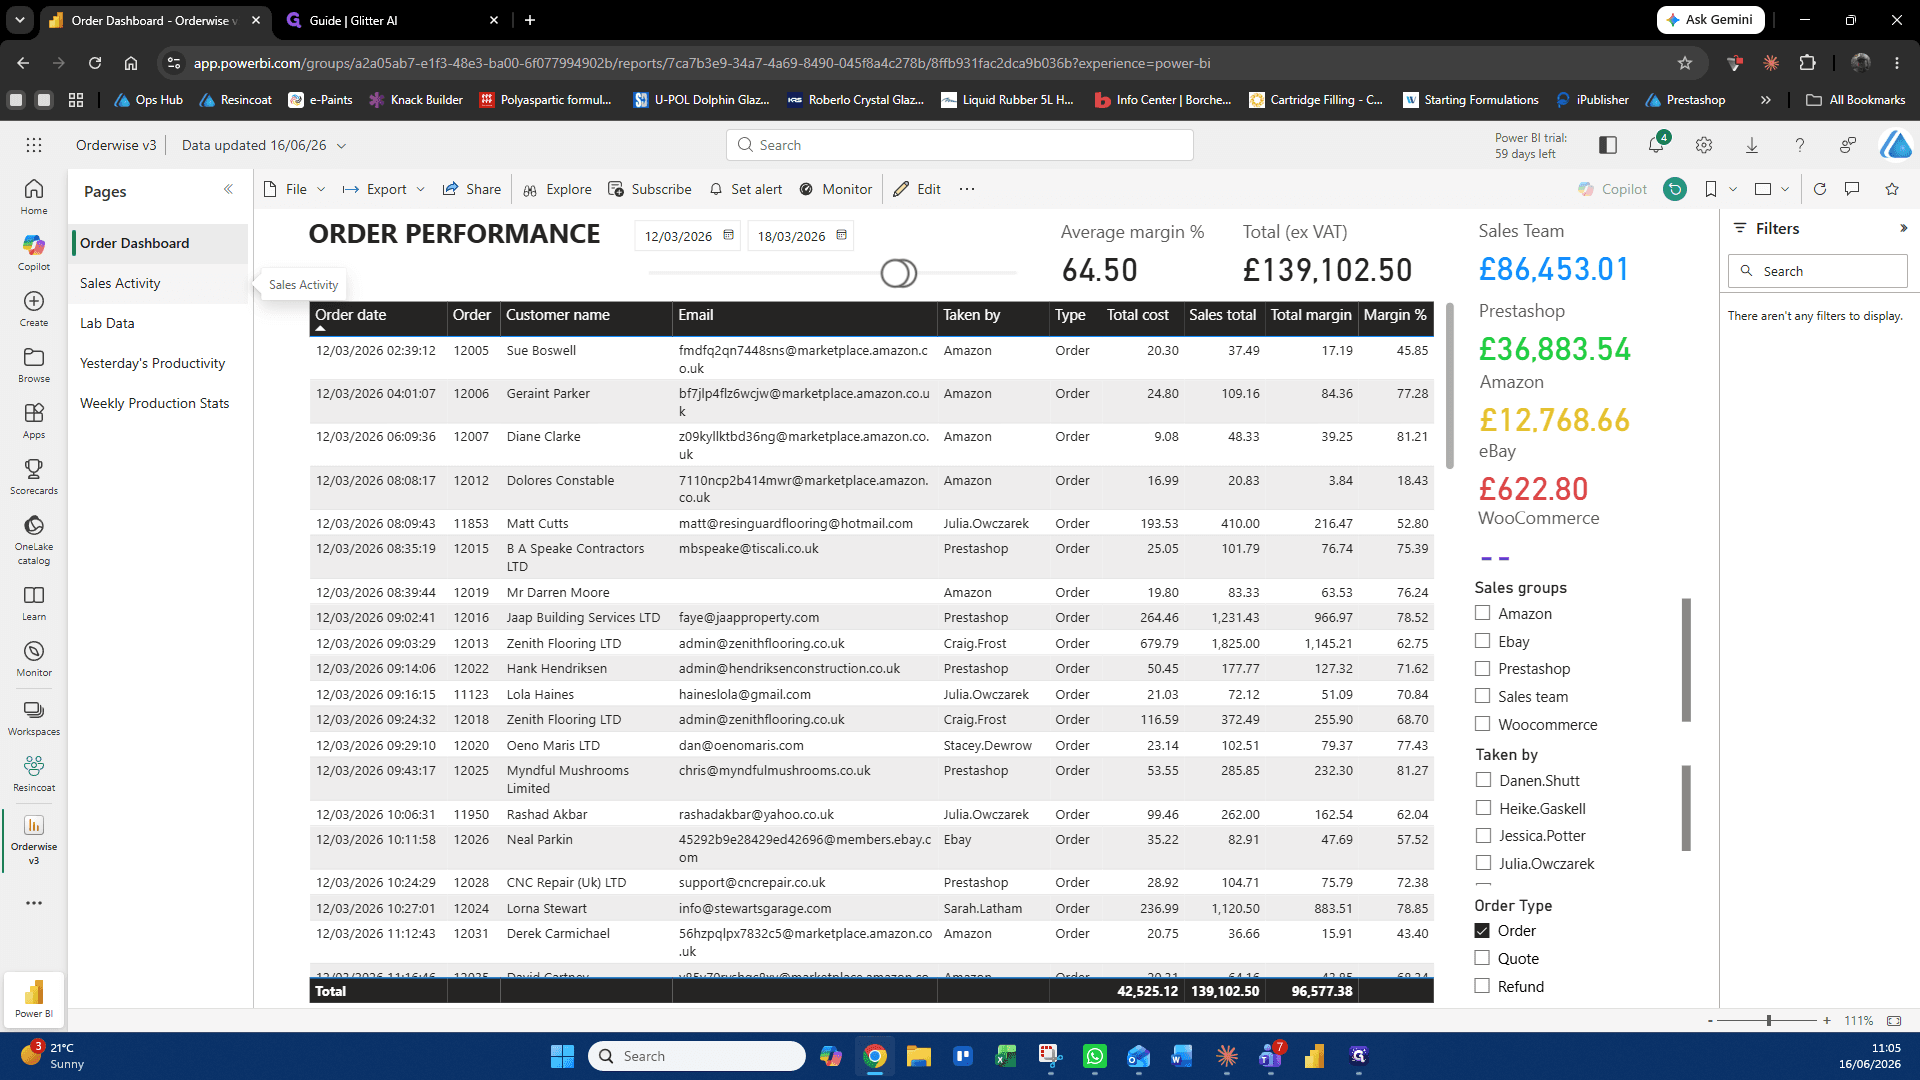
Order Dashboard | High-level Order metrics highlighting recent orders, value of orders and source of orders |
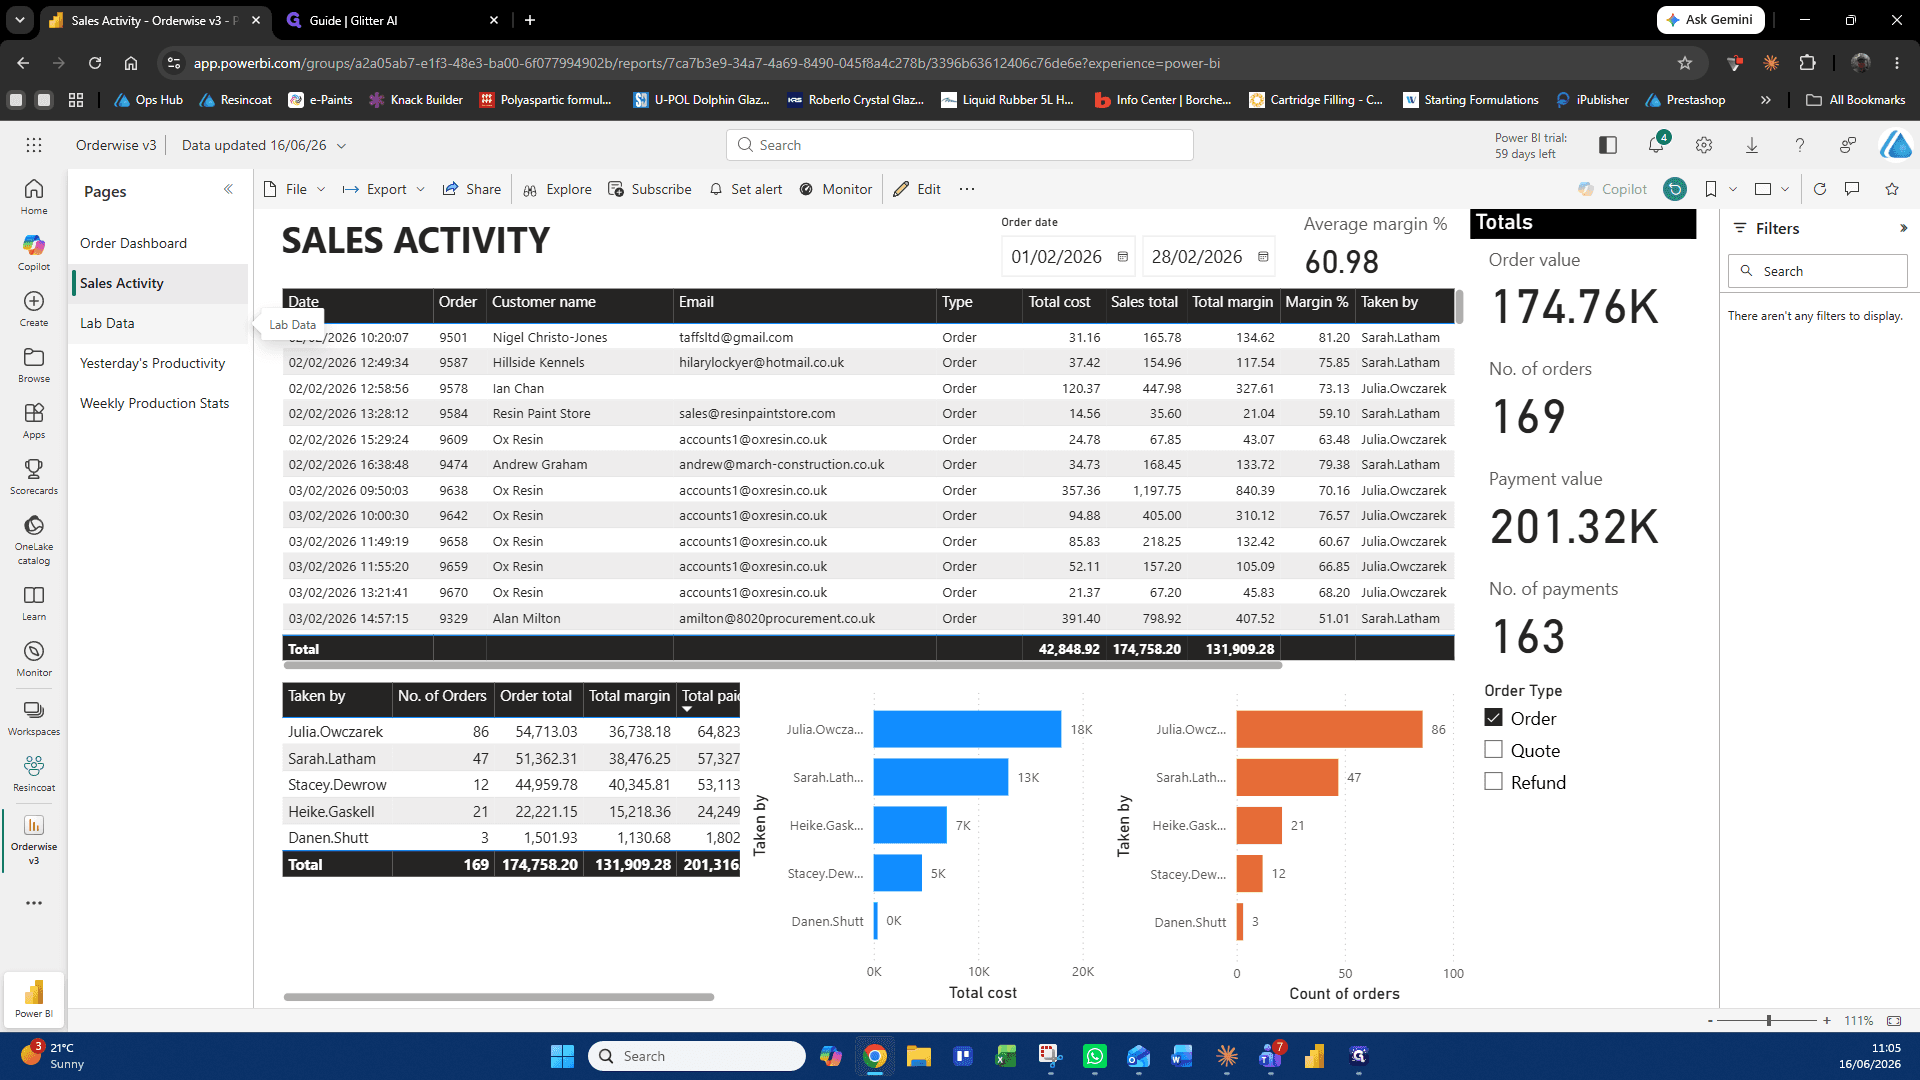
Sales Activity | Similar to above, but focus shifted to actual sales and payment values |
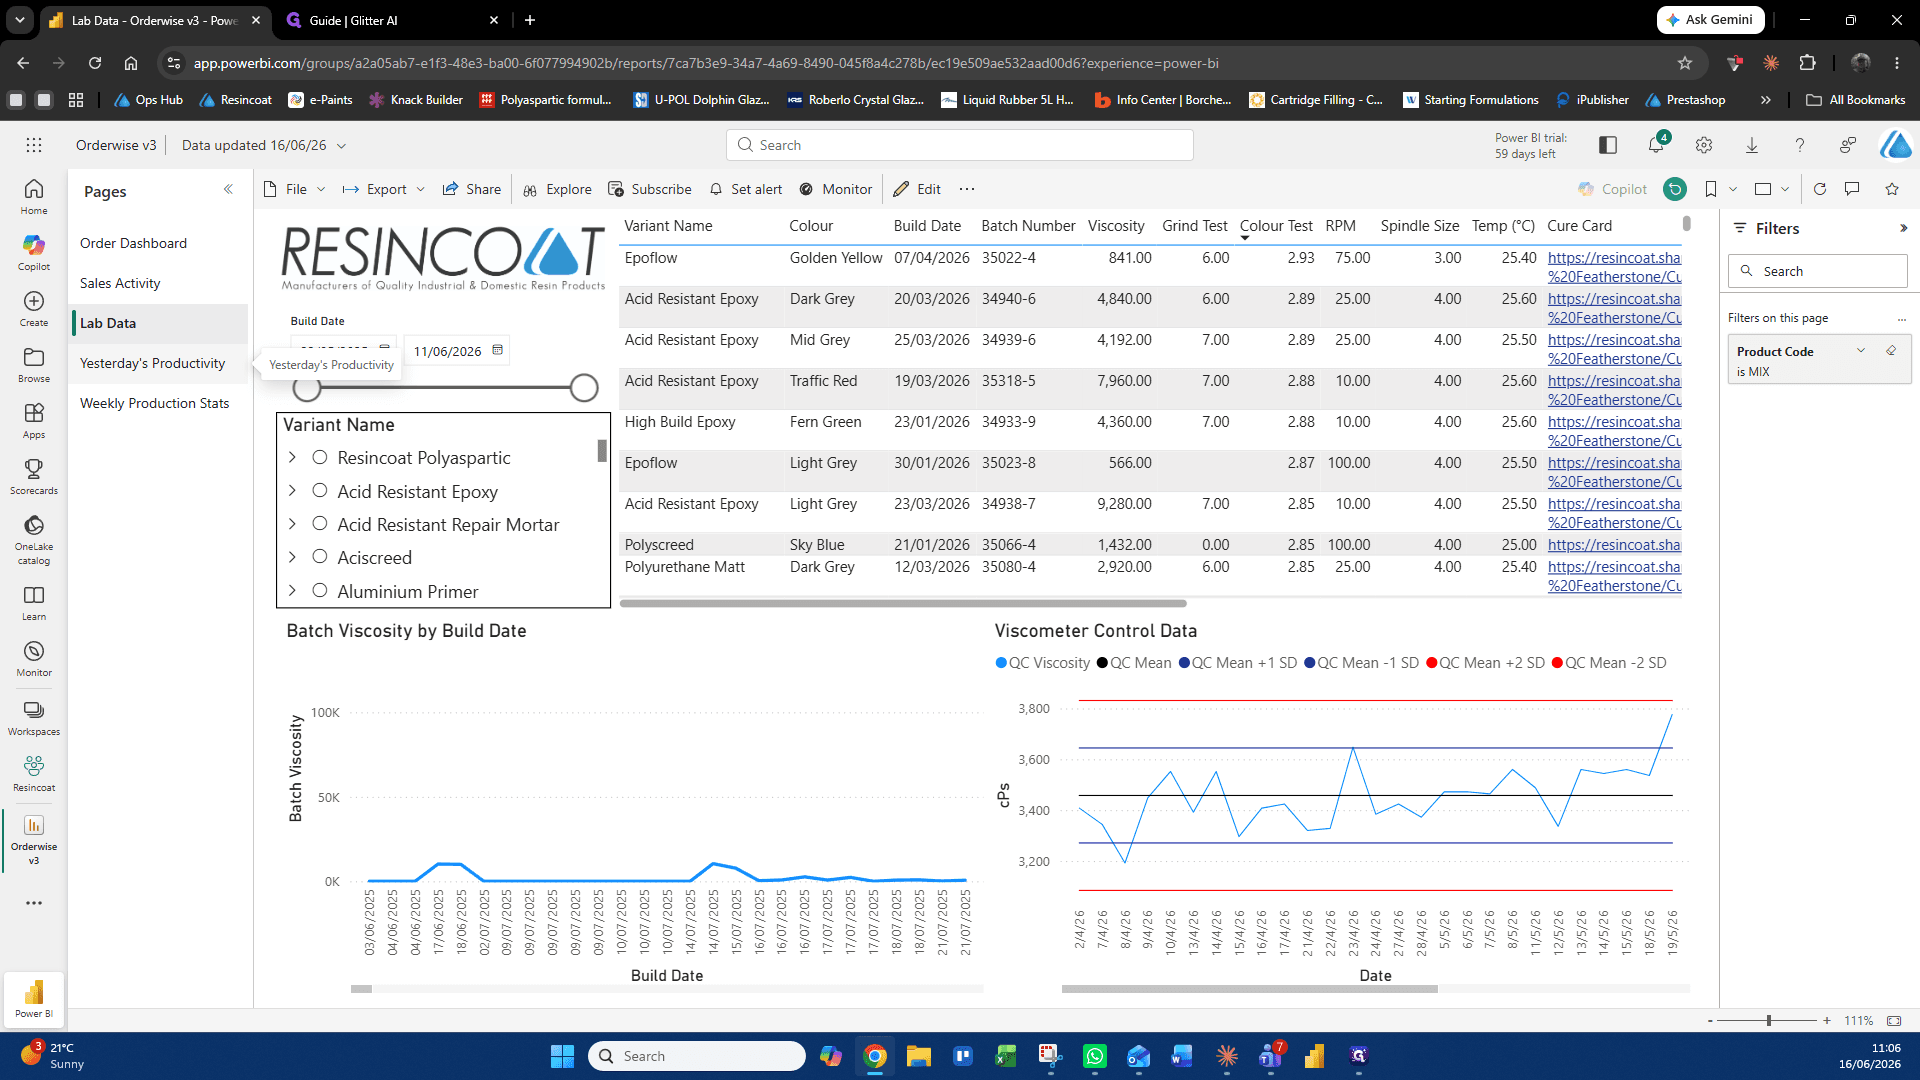
Lab Data | Product batch records, viscosity graphs, and viscometer control data. |
Yesterday's Productivity | Tracking for completed work orders and items still outstanding. |
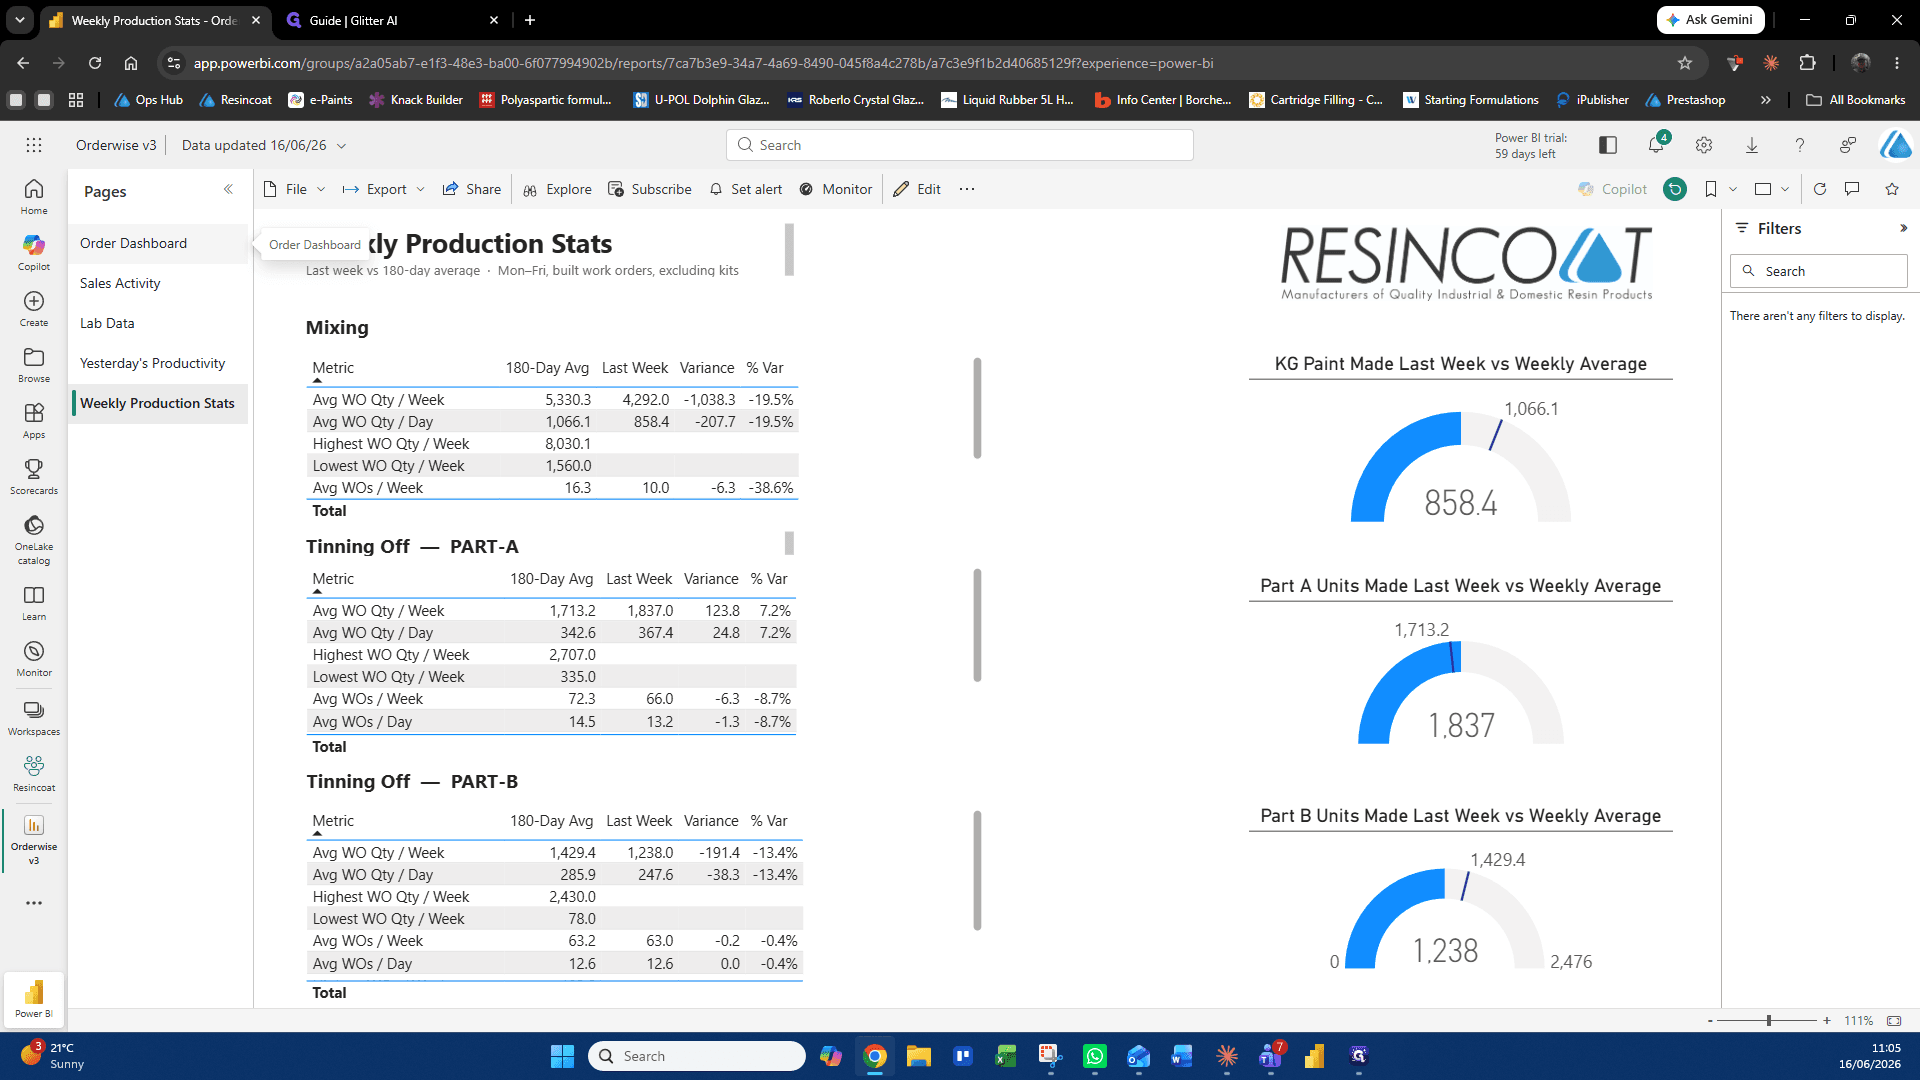
Weekly Production Stats | High-level Production metrics and gauge charts comparing recent output against weekly averages. |
Q: What should I do if the dashboard is taking a long time to load?
A: Some modules contain large amounts of data. If you see a spinning circle at the top of the screen, simply wait for it to finish processing and the visuals will load automatically.
Q: Which account should I use to sign into Power BI?
A: You can use your personal Resincoat email account. If you do not have one, you can sign in using the shared powerbi@resincoat.co.uk account.
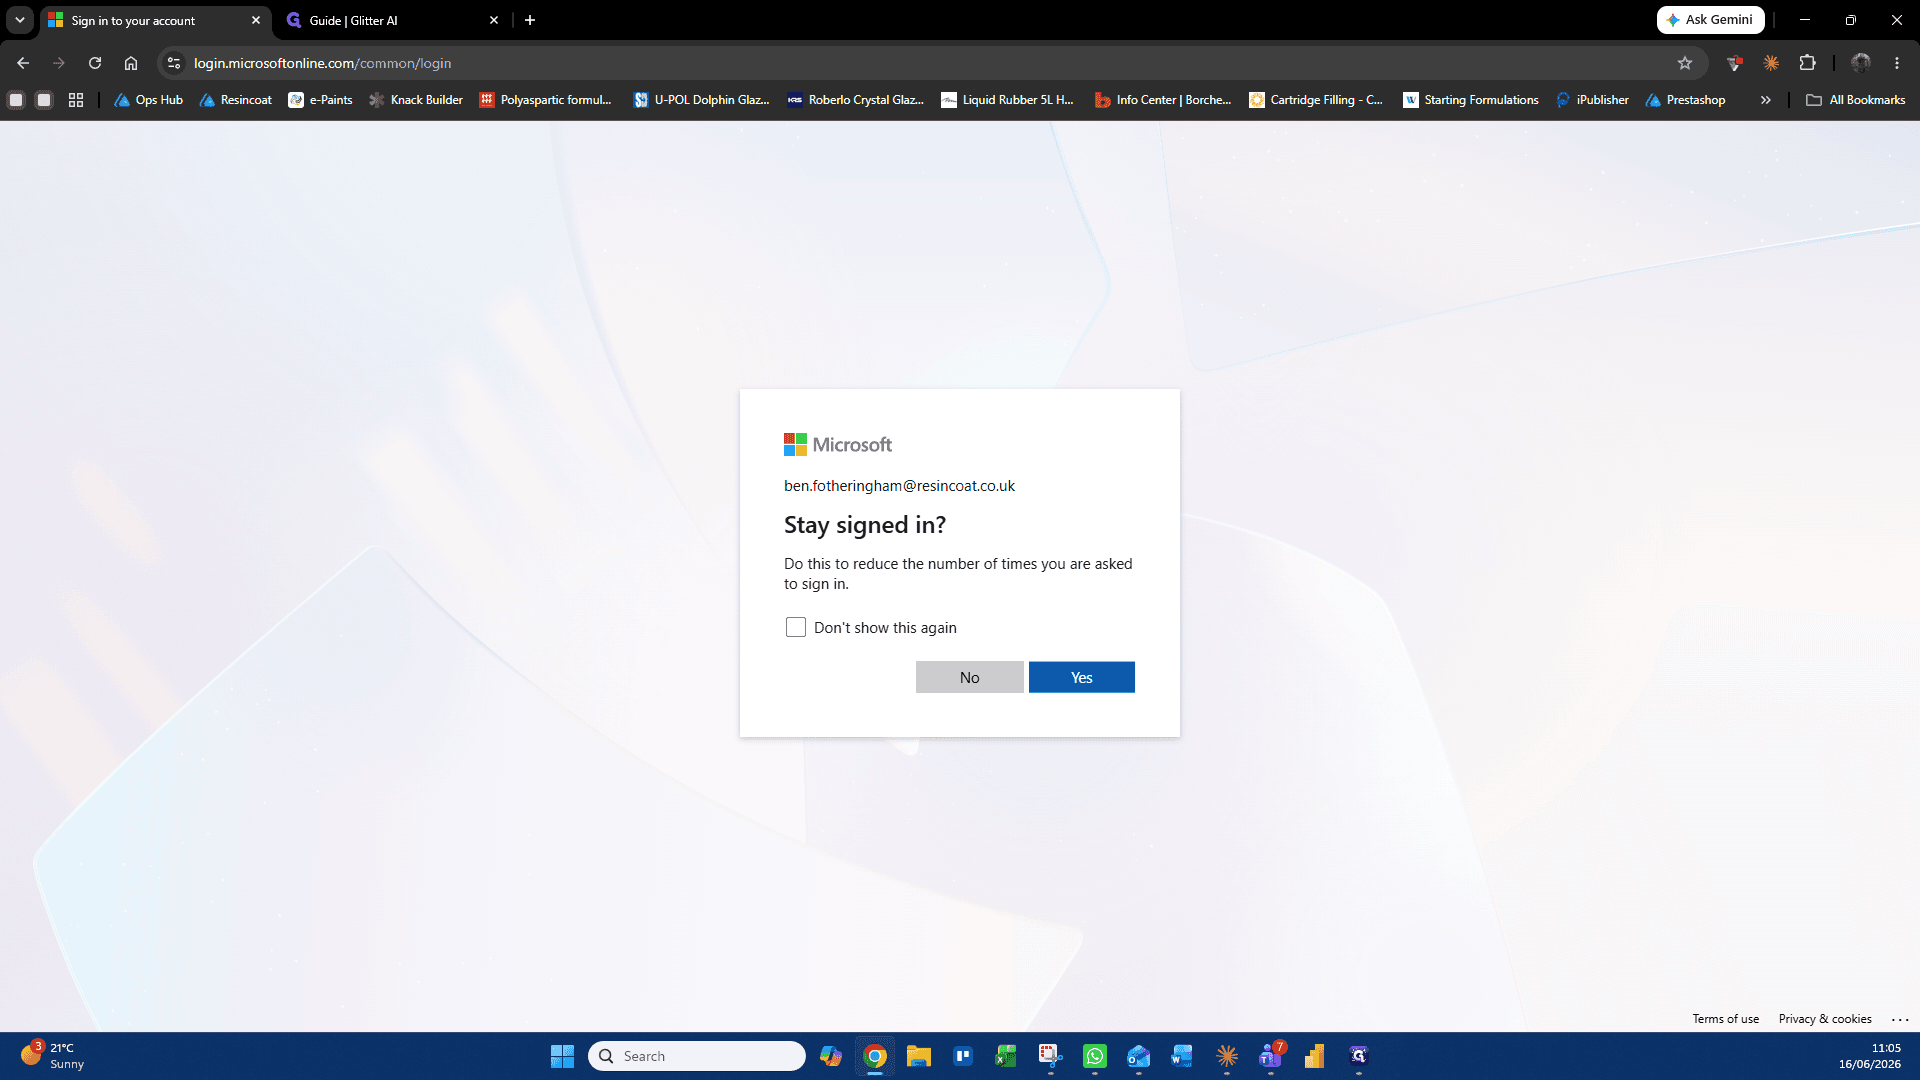
Q: Should I click "Yes" on the "Stay signed in?" prompt?
A: If you are using your personal account, you can click "Yes". However, if you are logging in with the shared Resincoat account, you should click "No".
Term | Definition |
|---|---|
Power BI | A business intelligence tool used to view interactive data dashboards and reports. |
OrderWise V3 | The primary reporting dashboard used to track sales, lab data, and production statistics. |
Work Order | A specific task or job scheduled for production, tracked as either completed or outstanding. |