
Airtable Field Schema Documentation: Field Dependencies Counts & Field Percent (%) Filled
Learn how to systematically audit Airtable fields by recording their dependency counts and fill percentages into a tracking spreadsheet.
This guide demonstrates how to audit an Airtable base by documenting the dependency count and usage percentage for every field. Completing this task provides a comprehensive overview of your data schema to assist with cleanup and optimisation.
This process is intended for database administrators or operations team members conducting a schema audit or base cleanup project.
You will be recording field data from Airtable into a Google Sheet. Ensure you are looking at the Main ABOB Community grid view (Do not change view) MASS copy in Airtable and the Main ABOB Community grid view Field Data Schema sheet in Google Worksheet named Mass (Airtable Services Partner) Plan.
1. Check Field Dependencies
For each field listed in your spreadsheet, locate the corresponding column in Airtable.
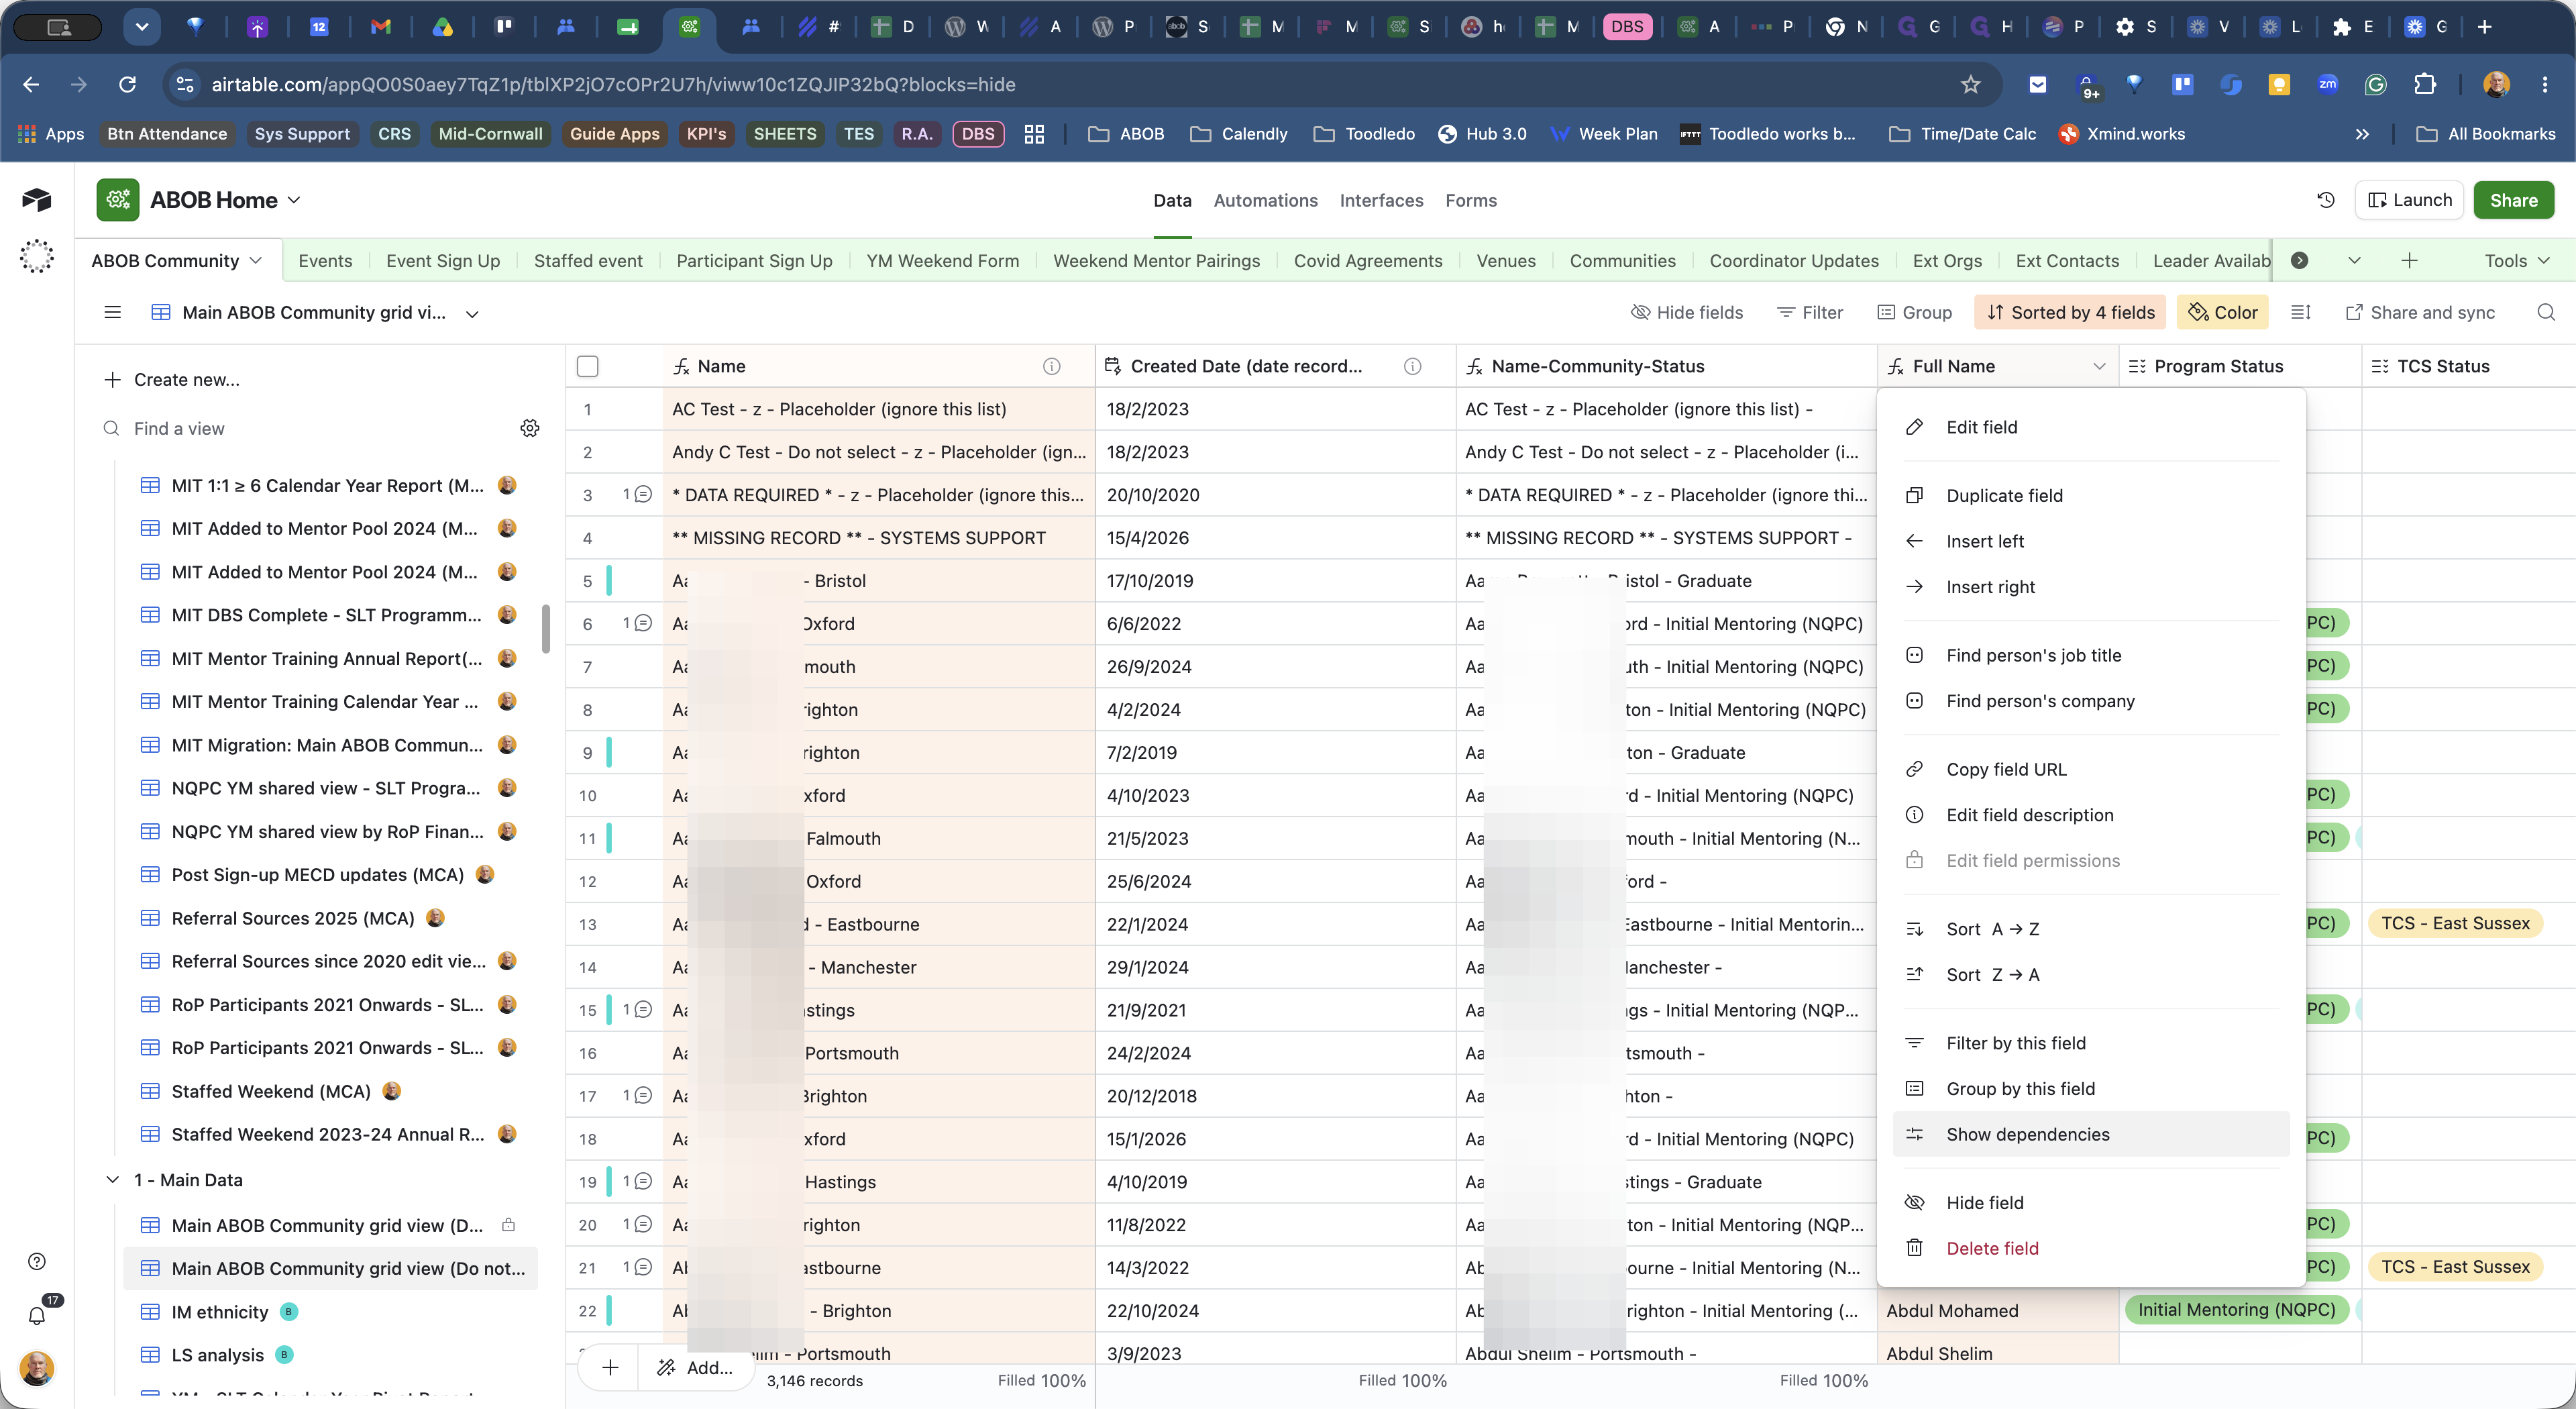
Note the number of dependencies listed at the top of the panel.
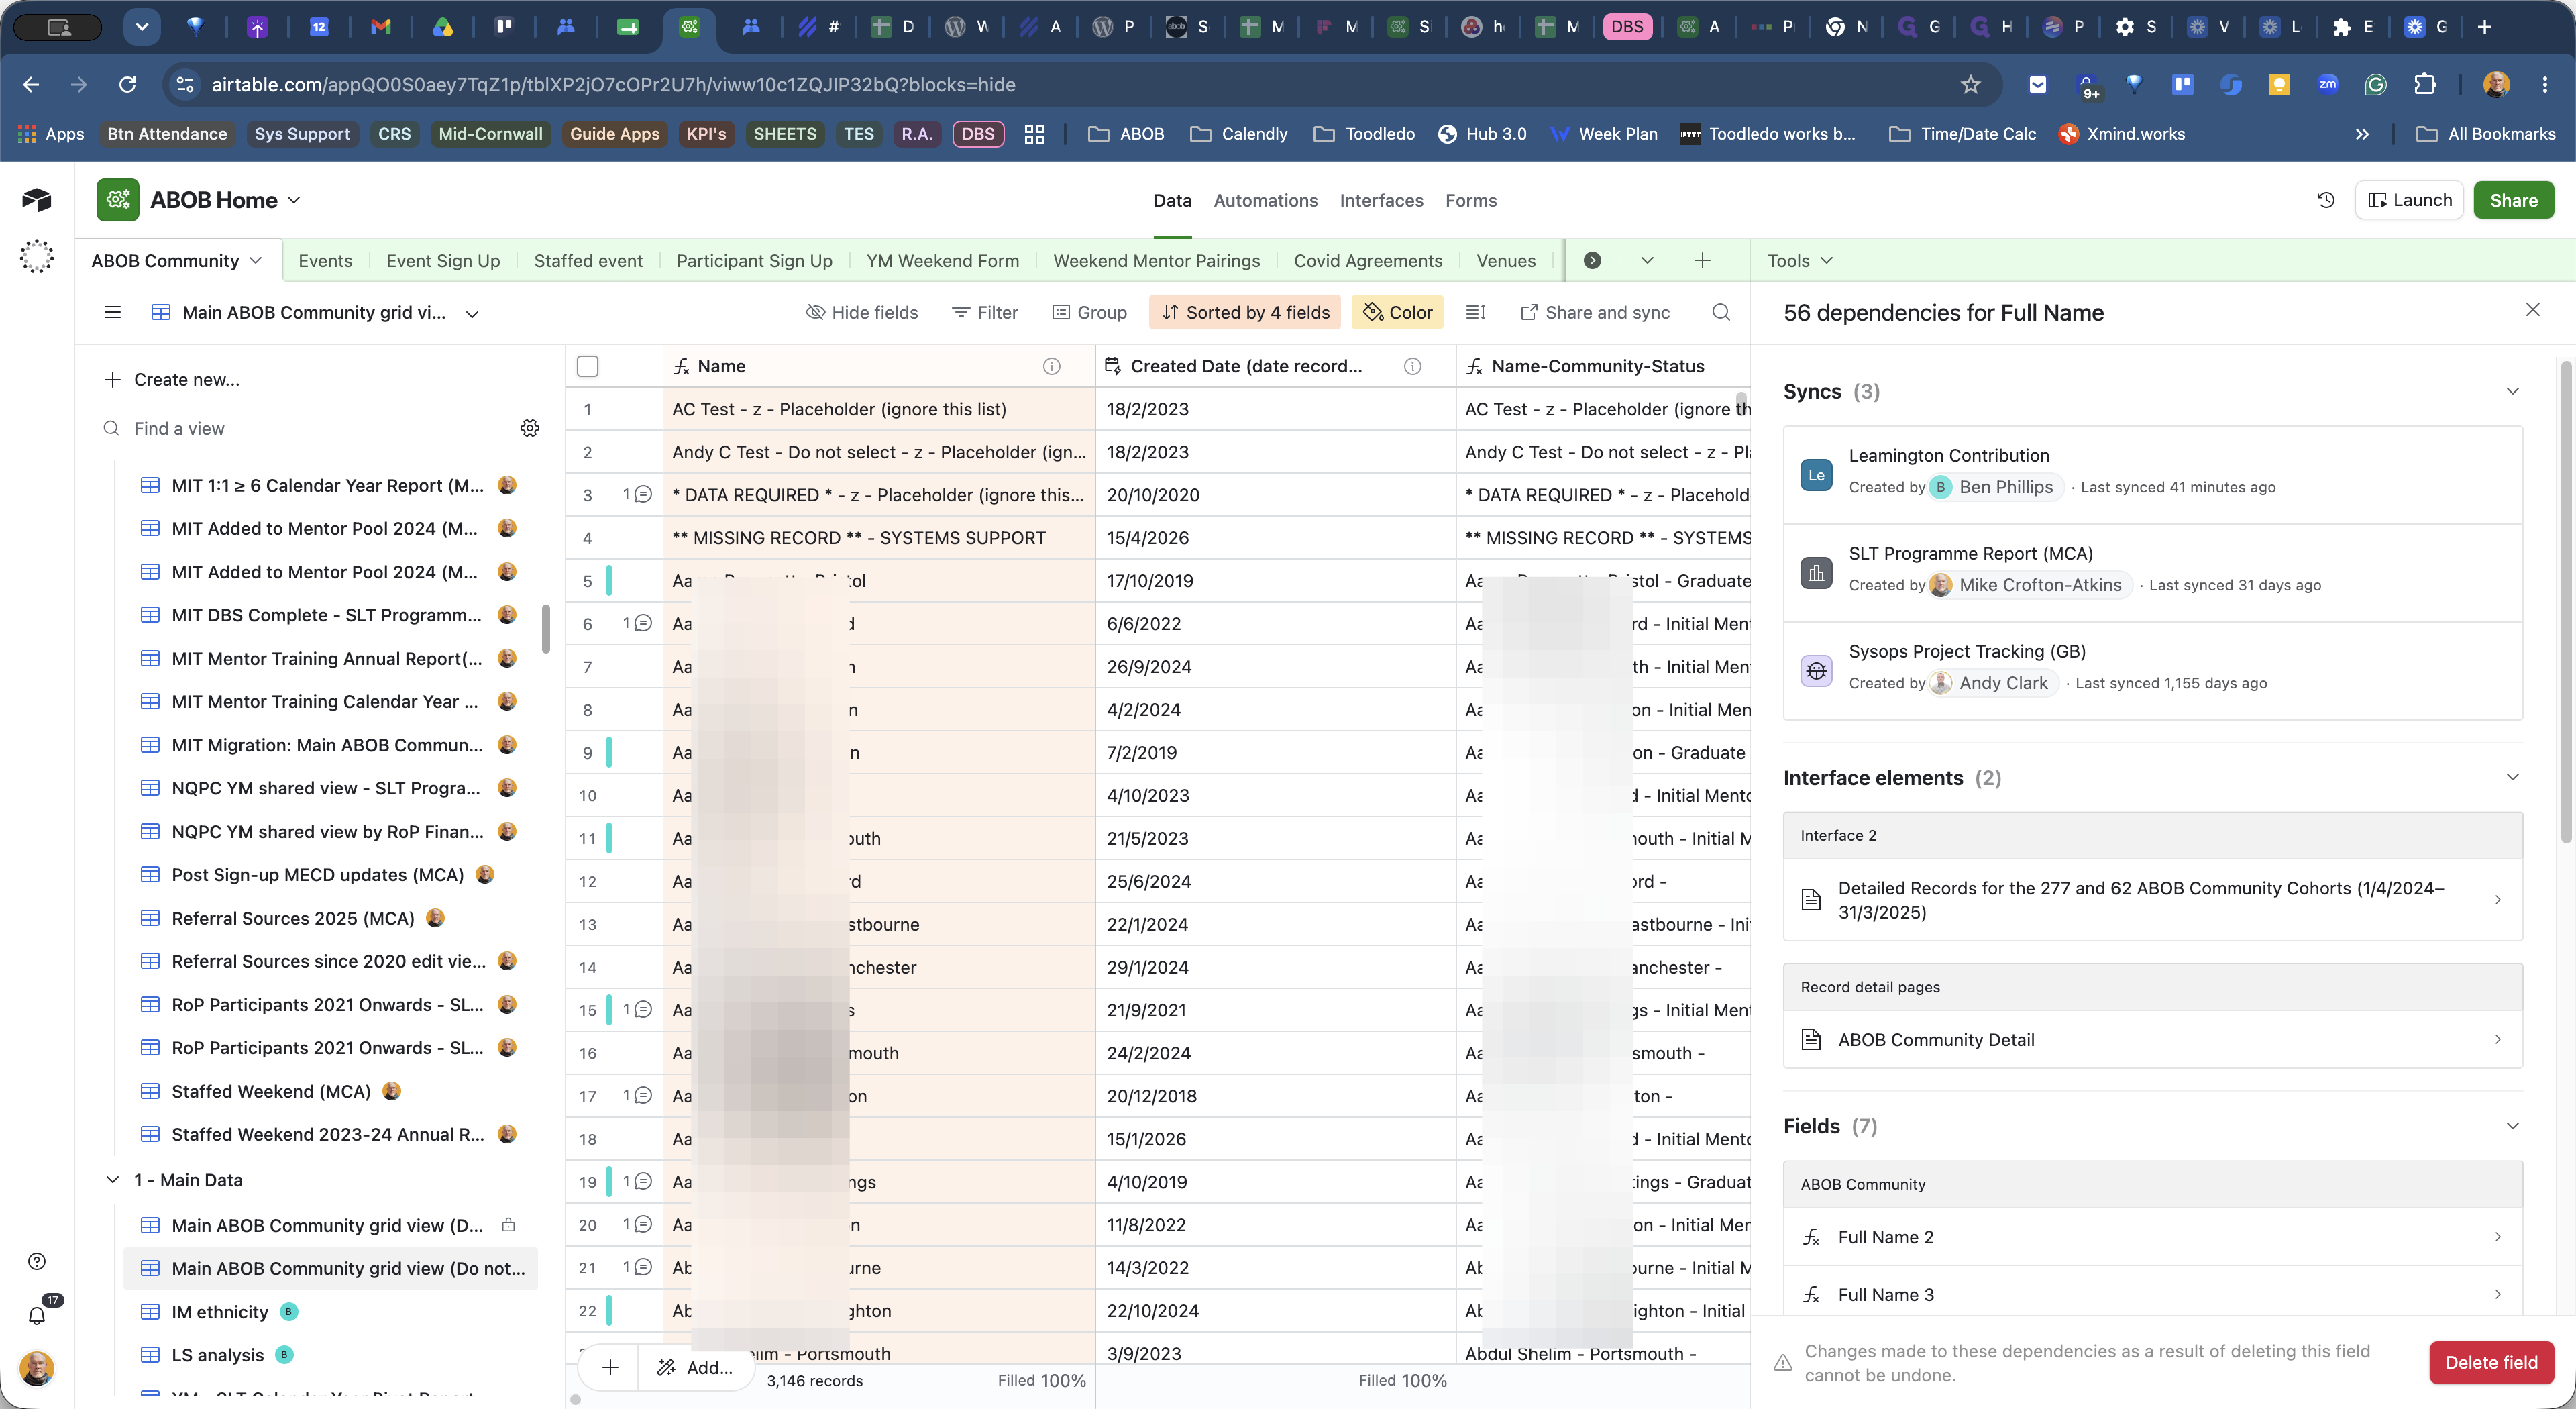
2. Check Percent Filled
Next, you need to find out how much data populates this field across all records.
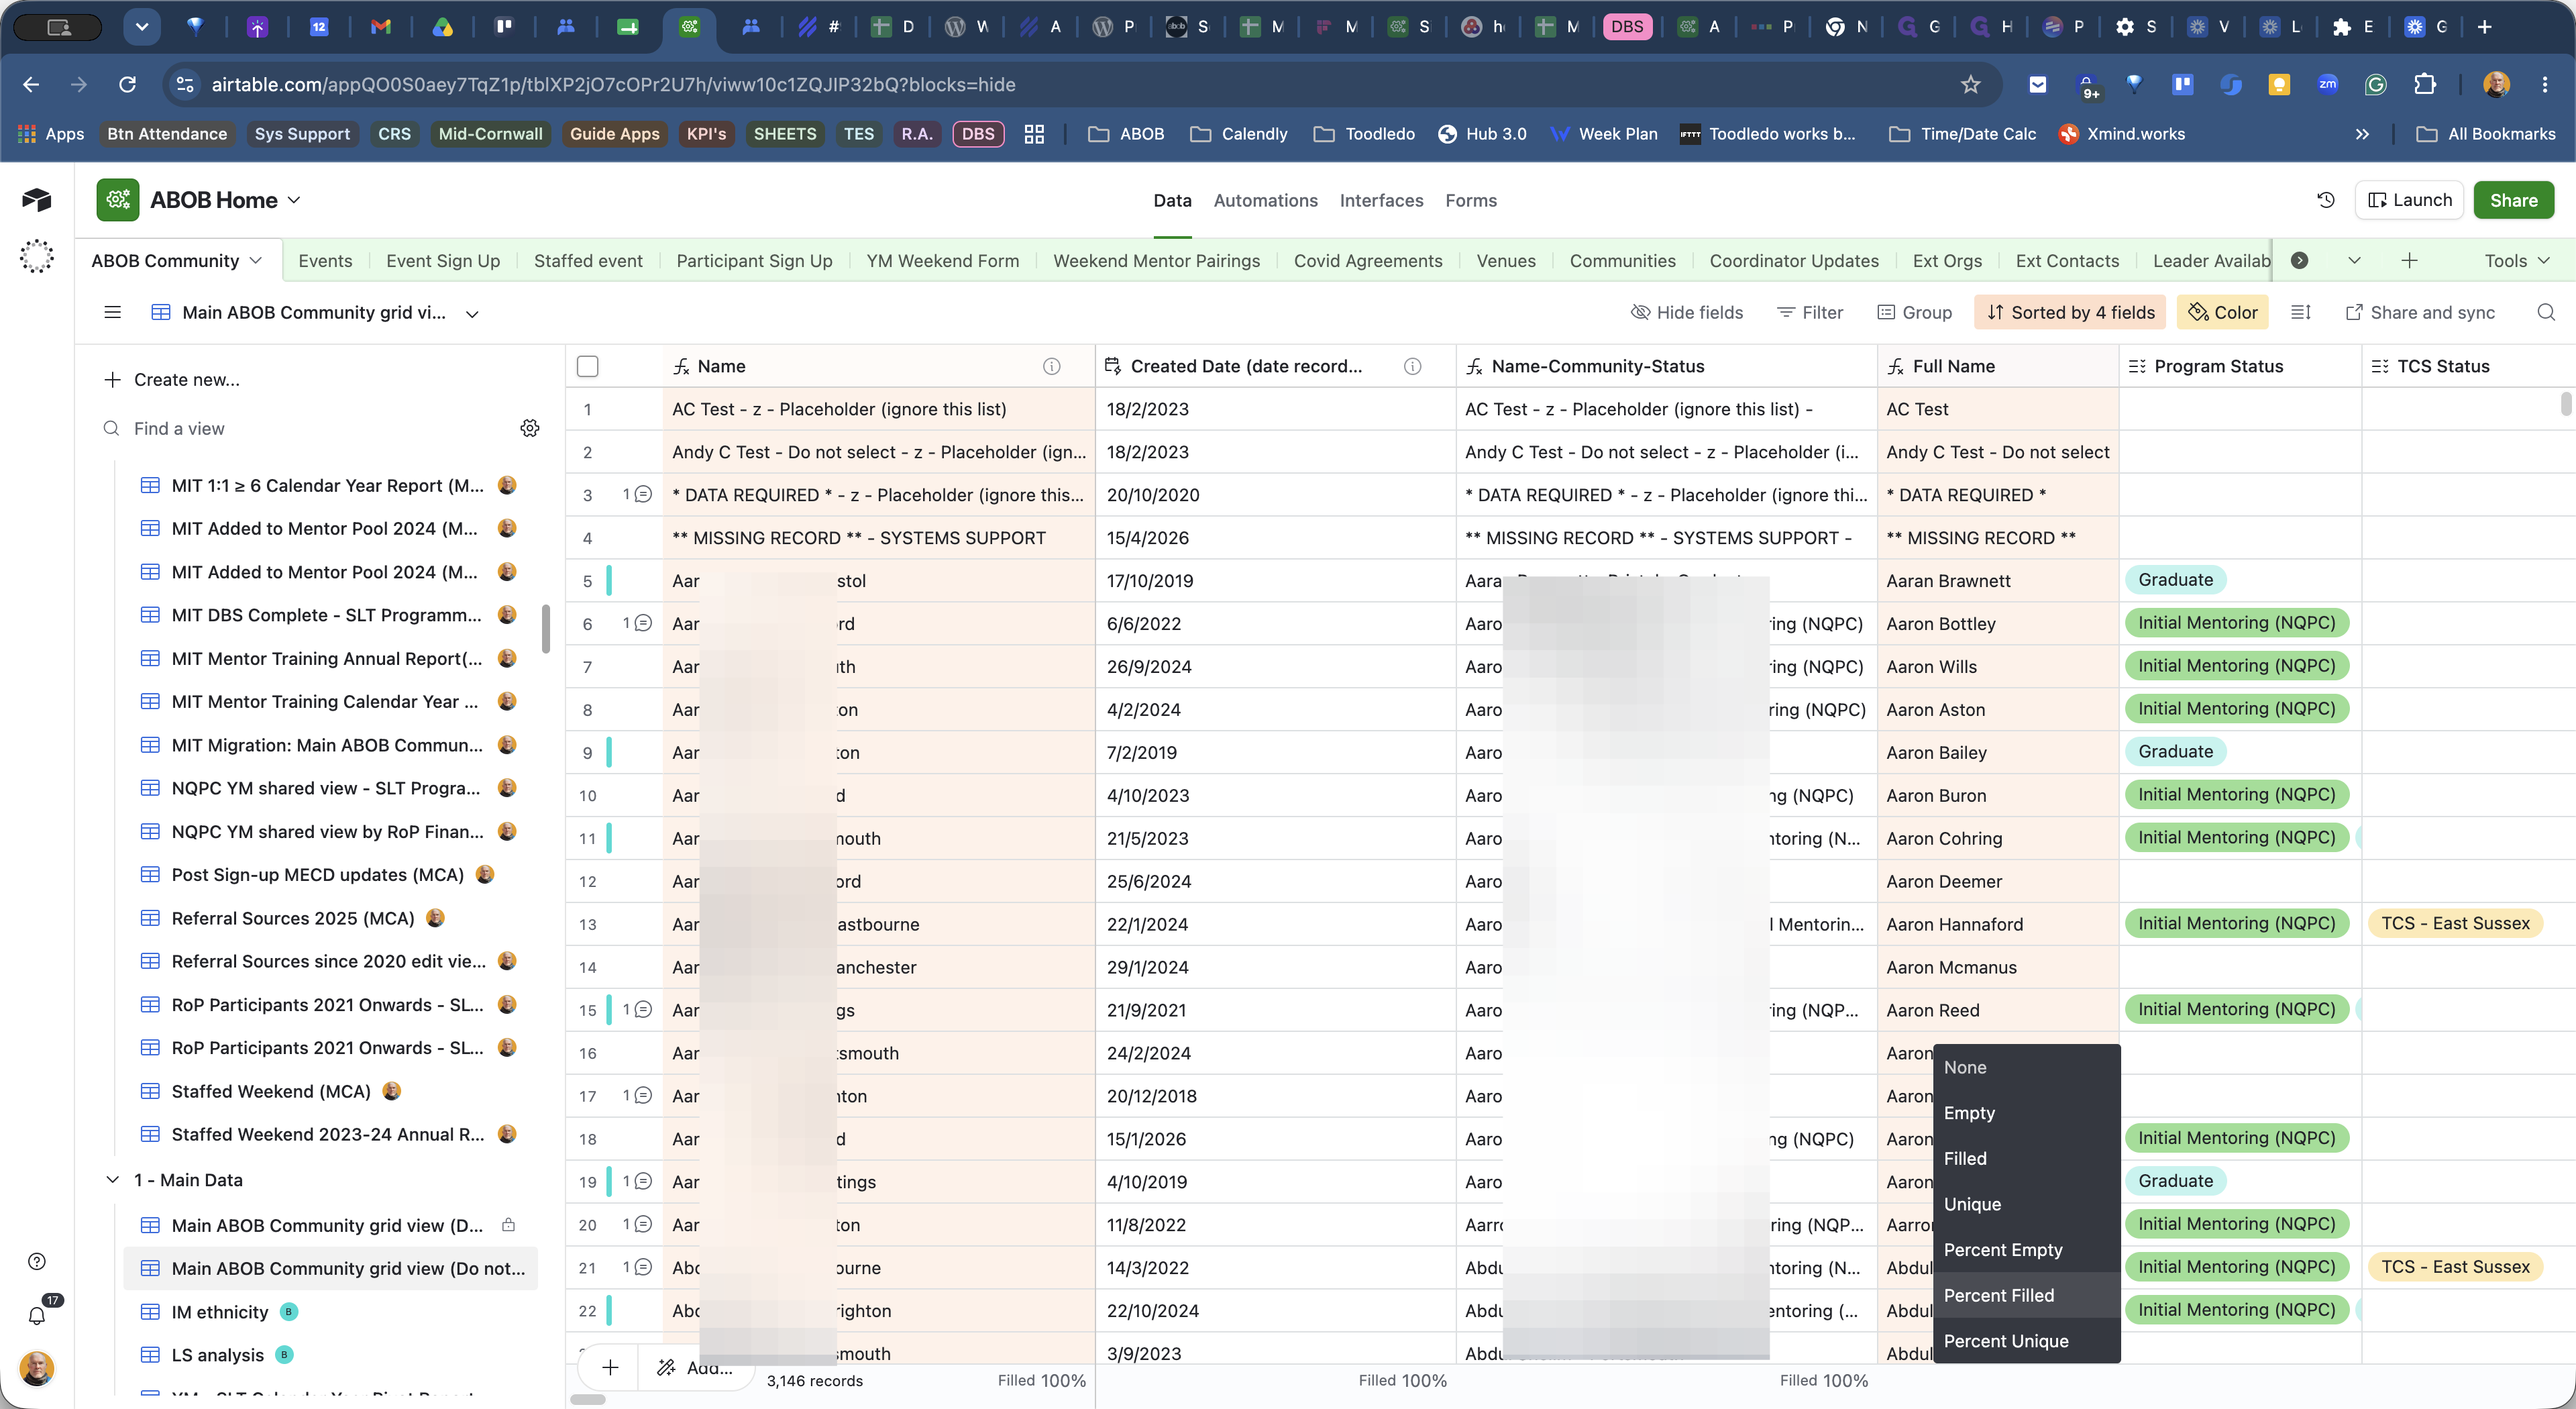
Note the percentage that appears. If you are evaluating a checkbox field, treat "Checked" as the equivalent of "Filled."
3. Record Data in the Spreadsheet
Return to your tracking spreadsheet to log the two metrics you just gathered.
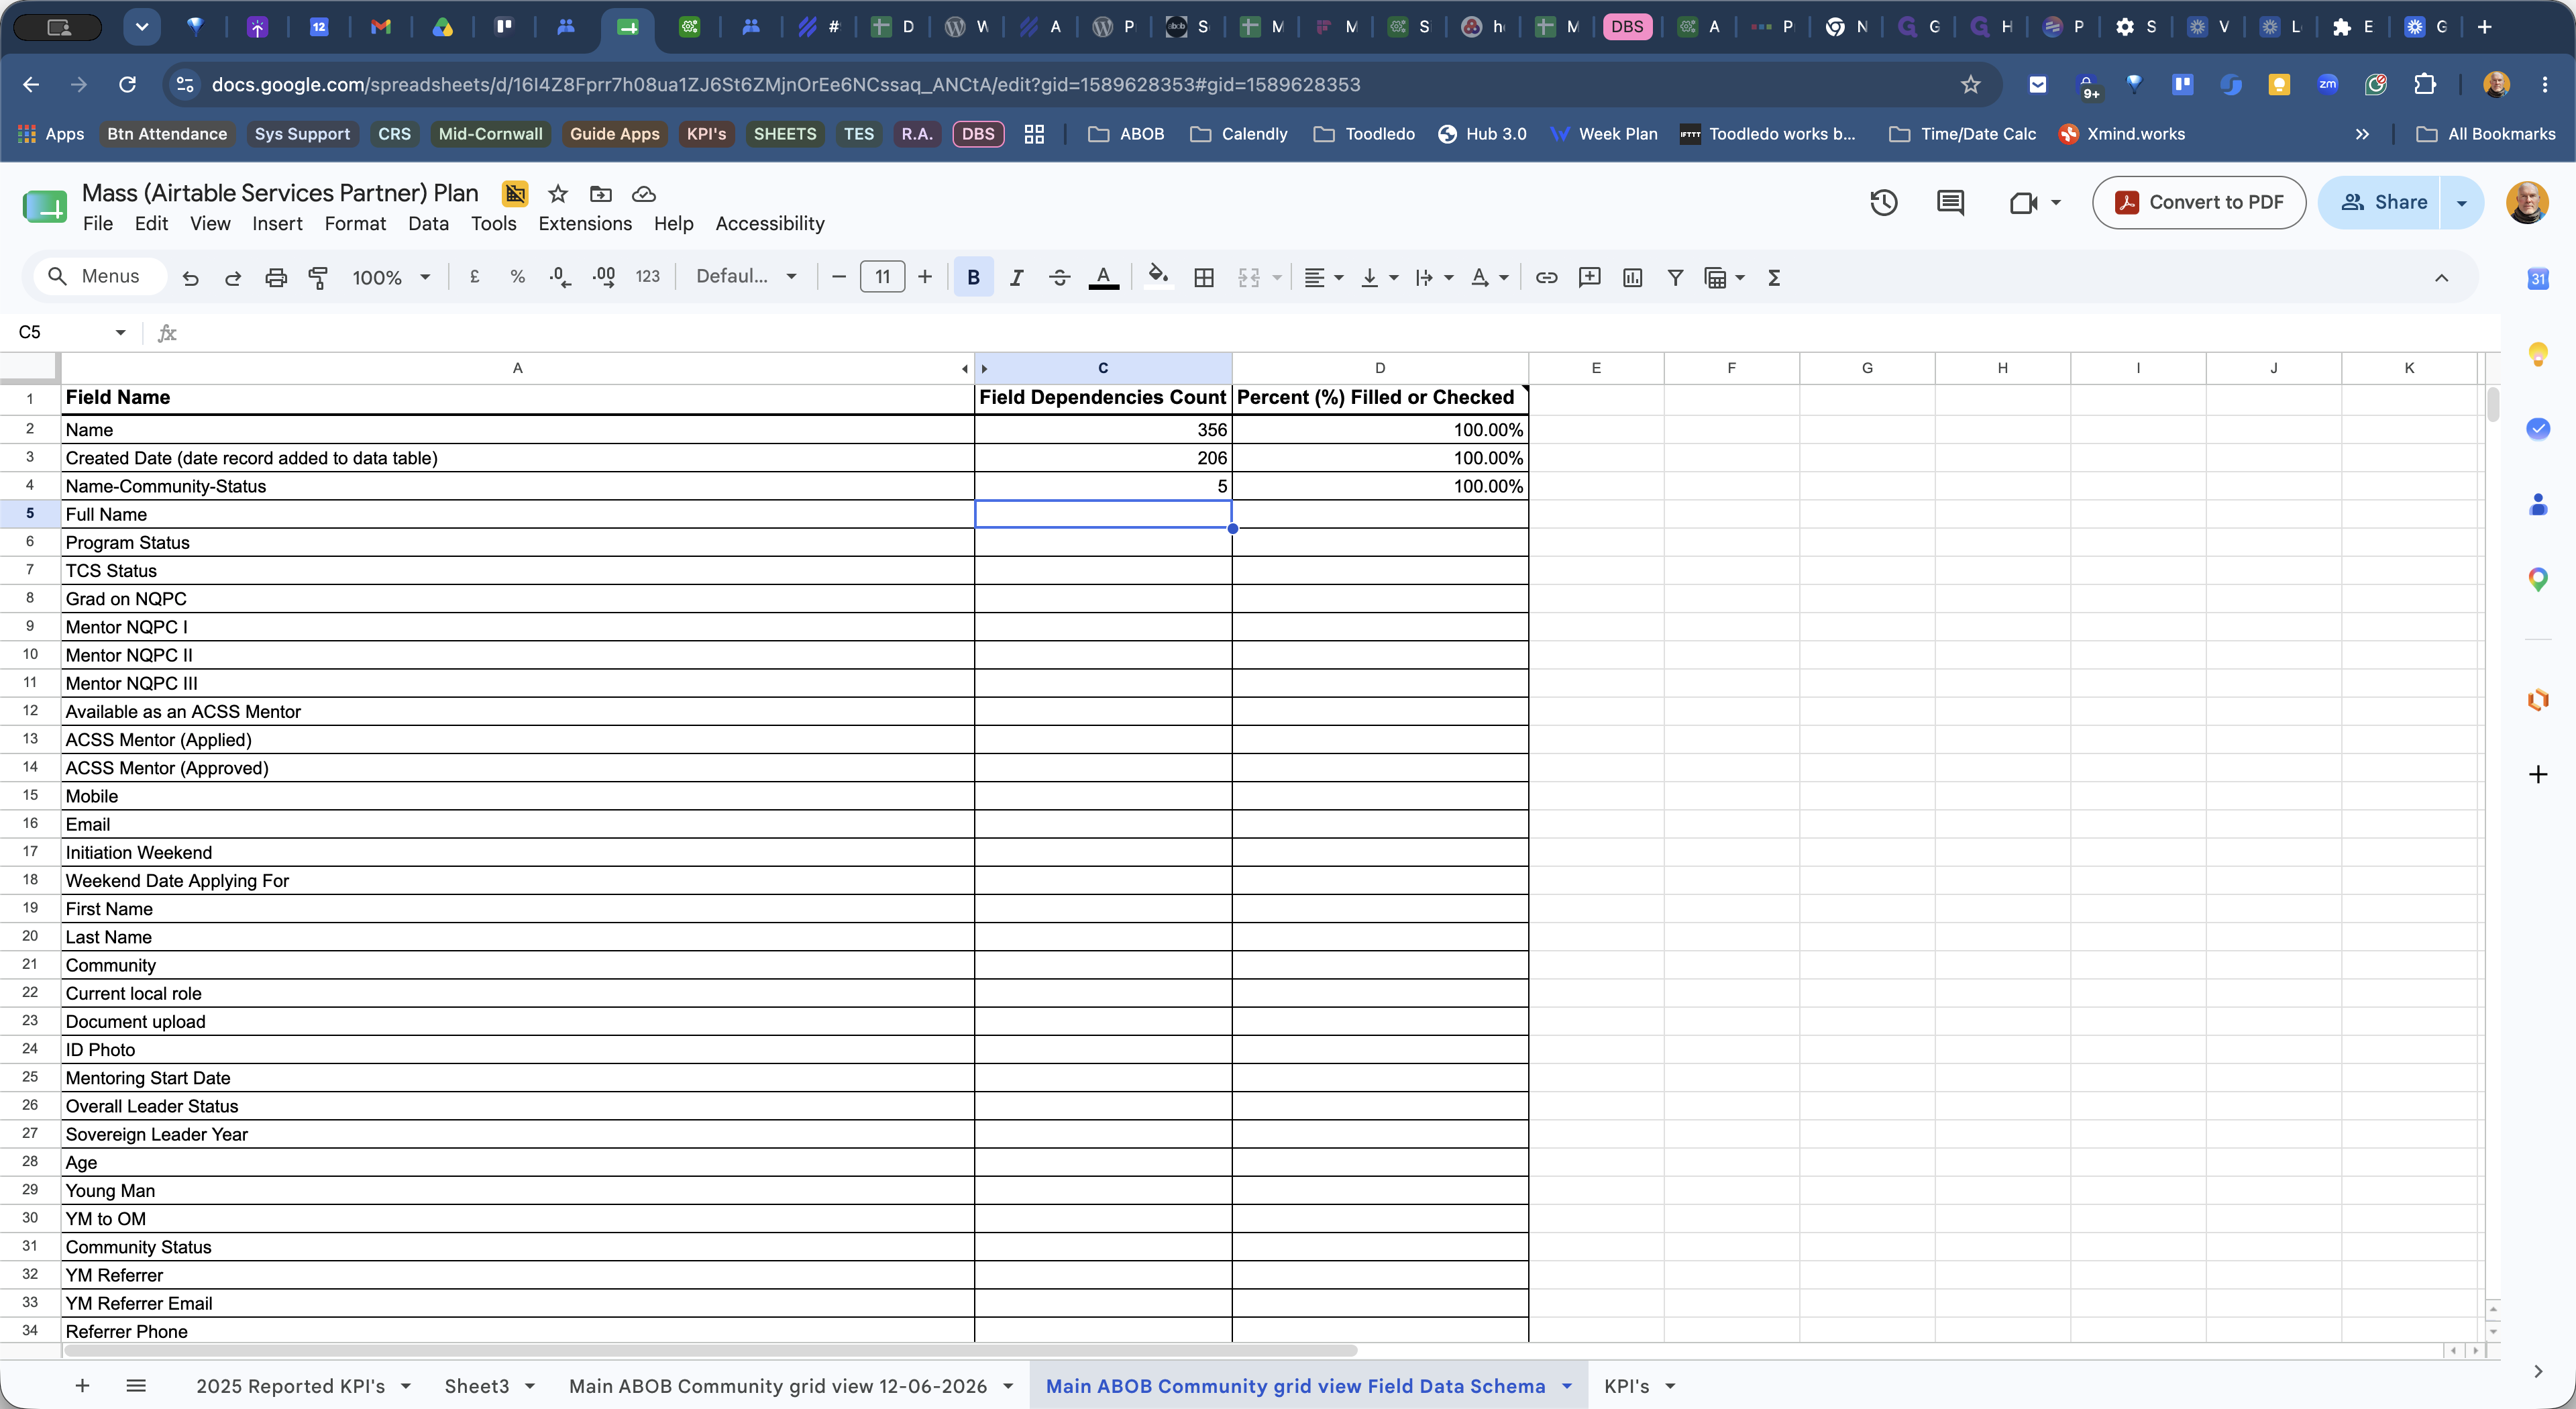
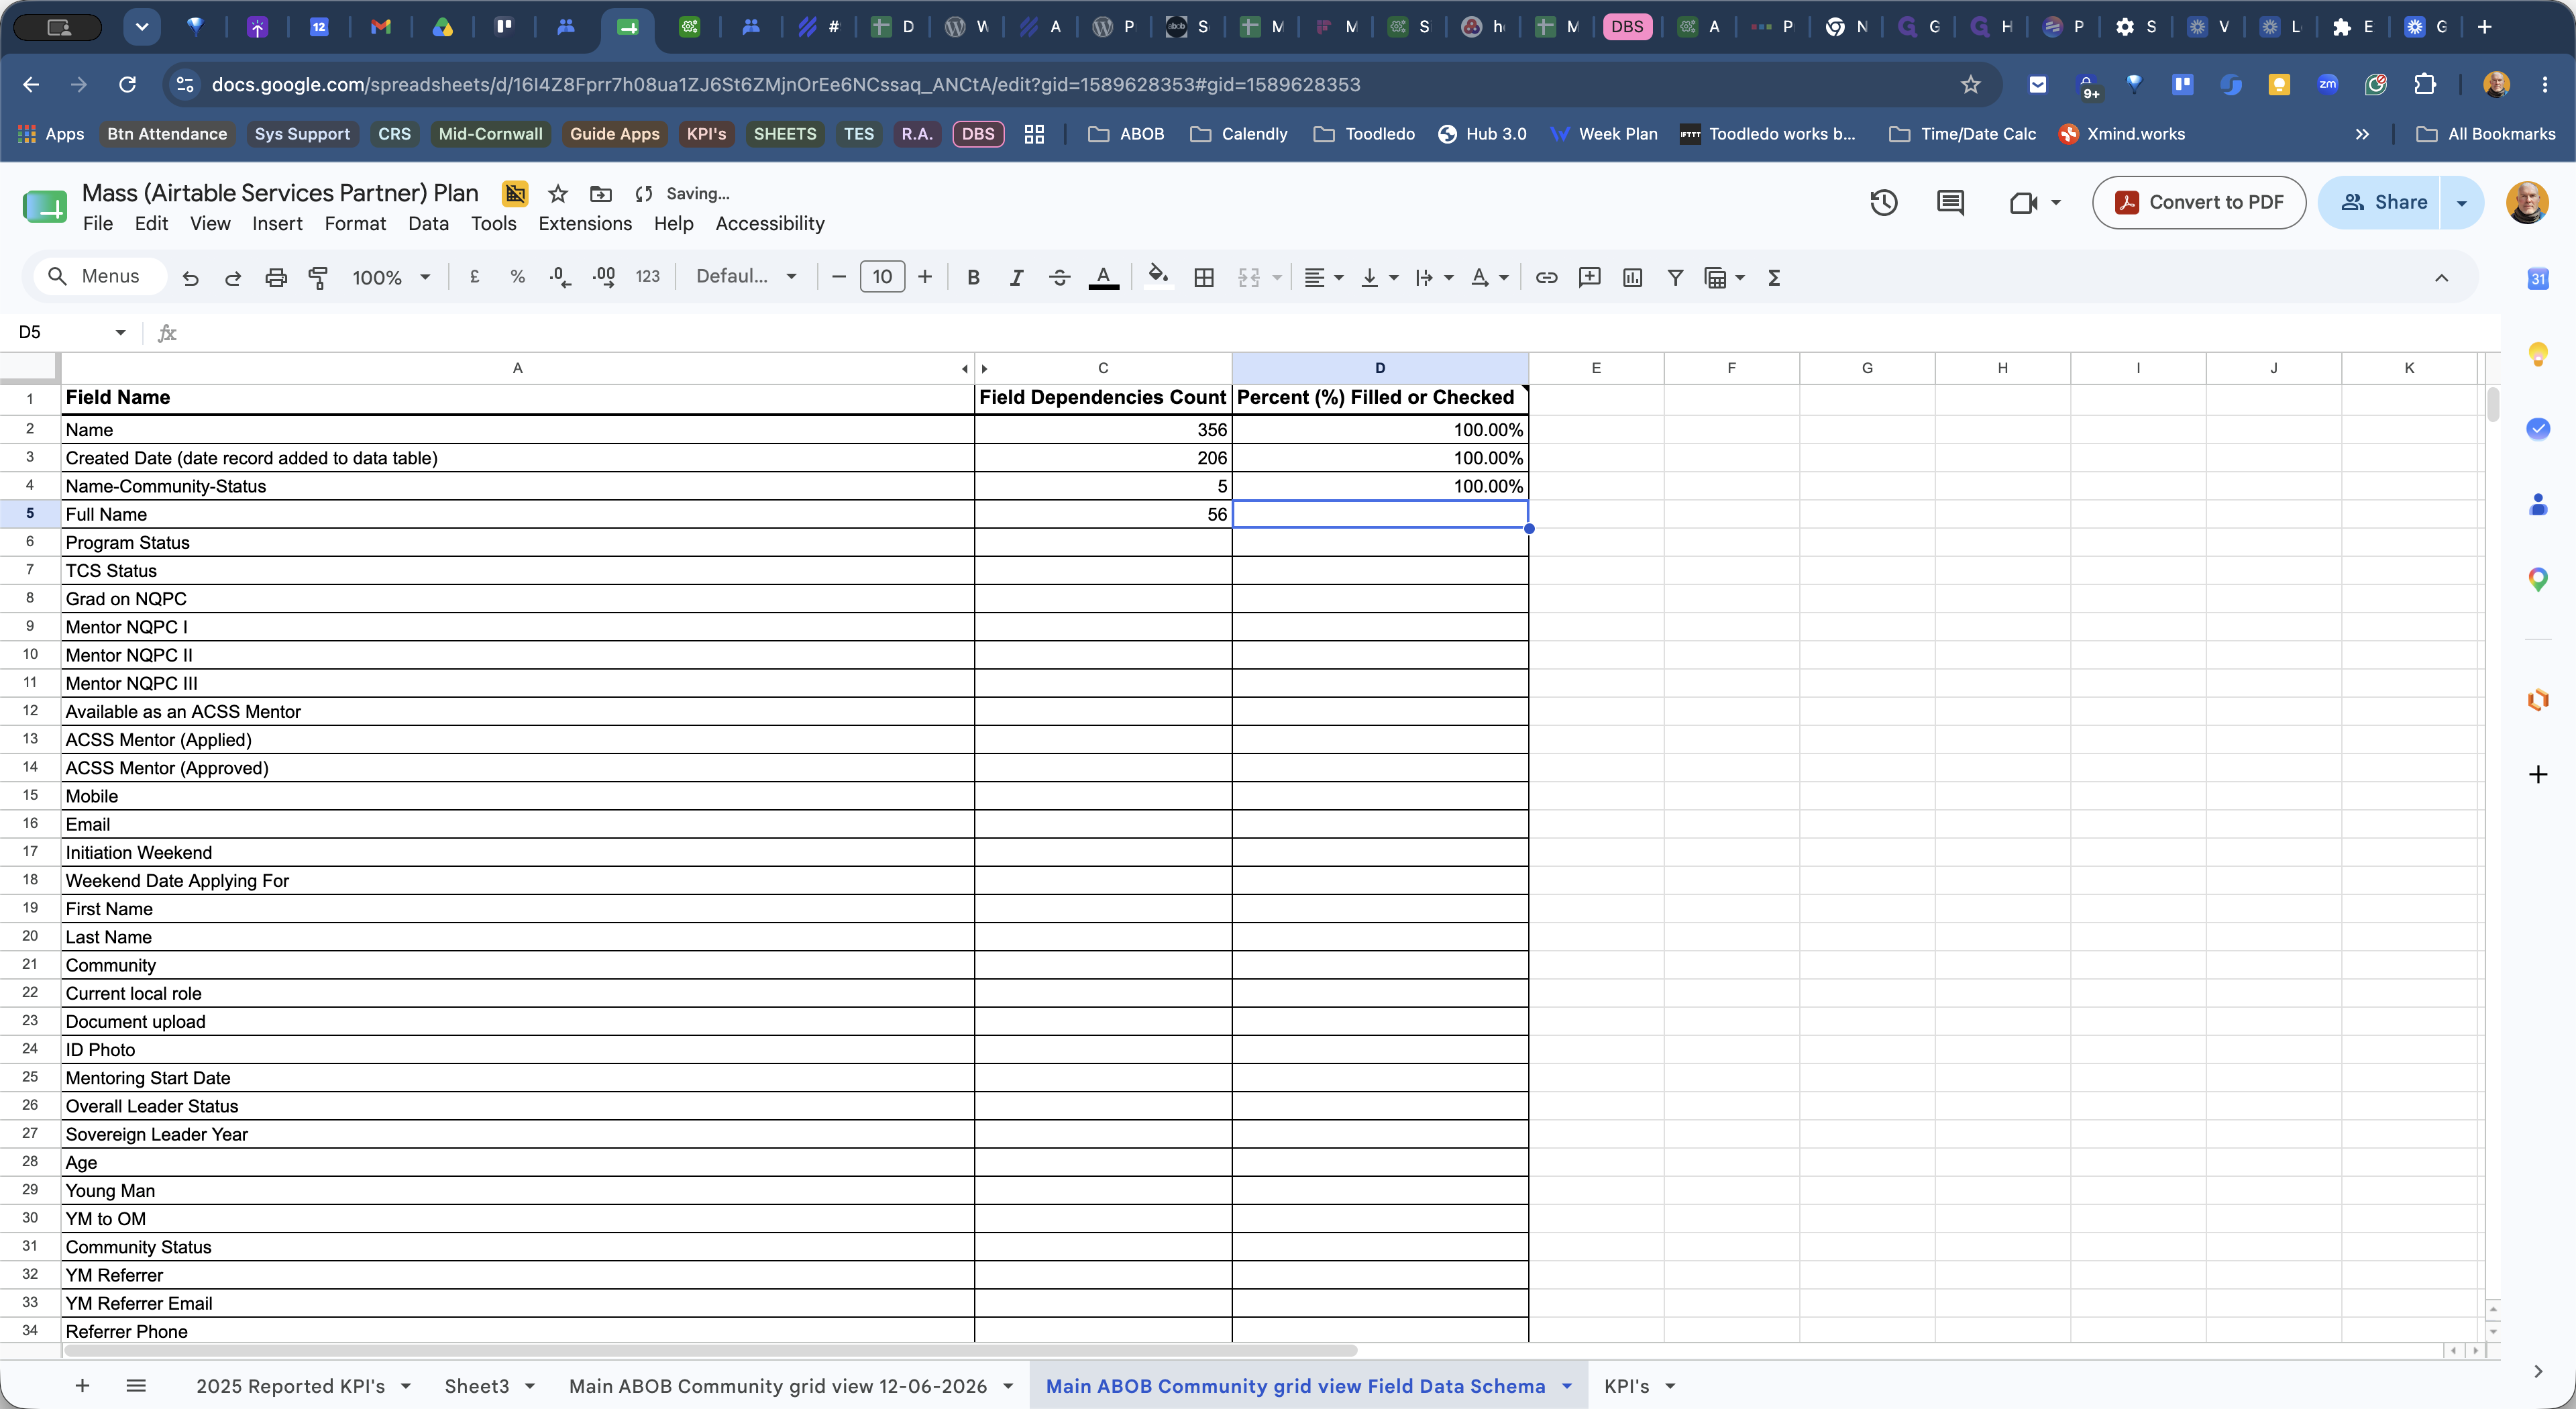
Repeat this exact process row by row, column by column, until every field in the spreadsheet has been documented.
Q: Which Airtable view should I use to gather this data?
A: You must strictly use the Main ABOB Community grid view (Do not change view) MASS copy view. Do not change views while recording the data.
Q: How do I handle checkbox fields when looking for a fill percentage?
A: For checkbox fields, the metric is referred to as "Checked" (or "Ticked"). Treat the checked percentage as the filled percentage.
Term | Definition |
|---|---|
Field Dependencies | Other elements in an Airtable base (like formulas, automations, or views) that rely on a specific field to function properly. |
Percent Filled | An Airtable summary metric indicating the proportion of records that contain data in a given field. |
Grid View | A standard, spreadsheet-like layout in Airtable where records are displayed as rows and fields as columns. |