(1) Superset Dashboard Guide for Marketing and Brand
In this guide, we'll learn how to navigate and utilize a comprehensive dashboard designed for marketing and brand teams. This dashboard contains multiple tabs and filters to help you analyze various engagement metrics. We'll explore how to customize time ranges, filter data by tags, and view detailed engagement statistics by device, platform, and country. Additionally, we'll cover how to access and interpret data related to push notifications, original posts, tags, and videos. This guide aims to help you make the most of the available data for informed decision-making.
Let's get started
This dashboard displays the information requested by the marketing and brand teams. There are multiple tabs at the top, which we will review one by one. On the left side, there are filters.

By default, the time filter is set to show the last month. However, you can change this to any time period you prefer.
A tags filter also applies to some tabs, such as the tags tab.
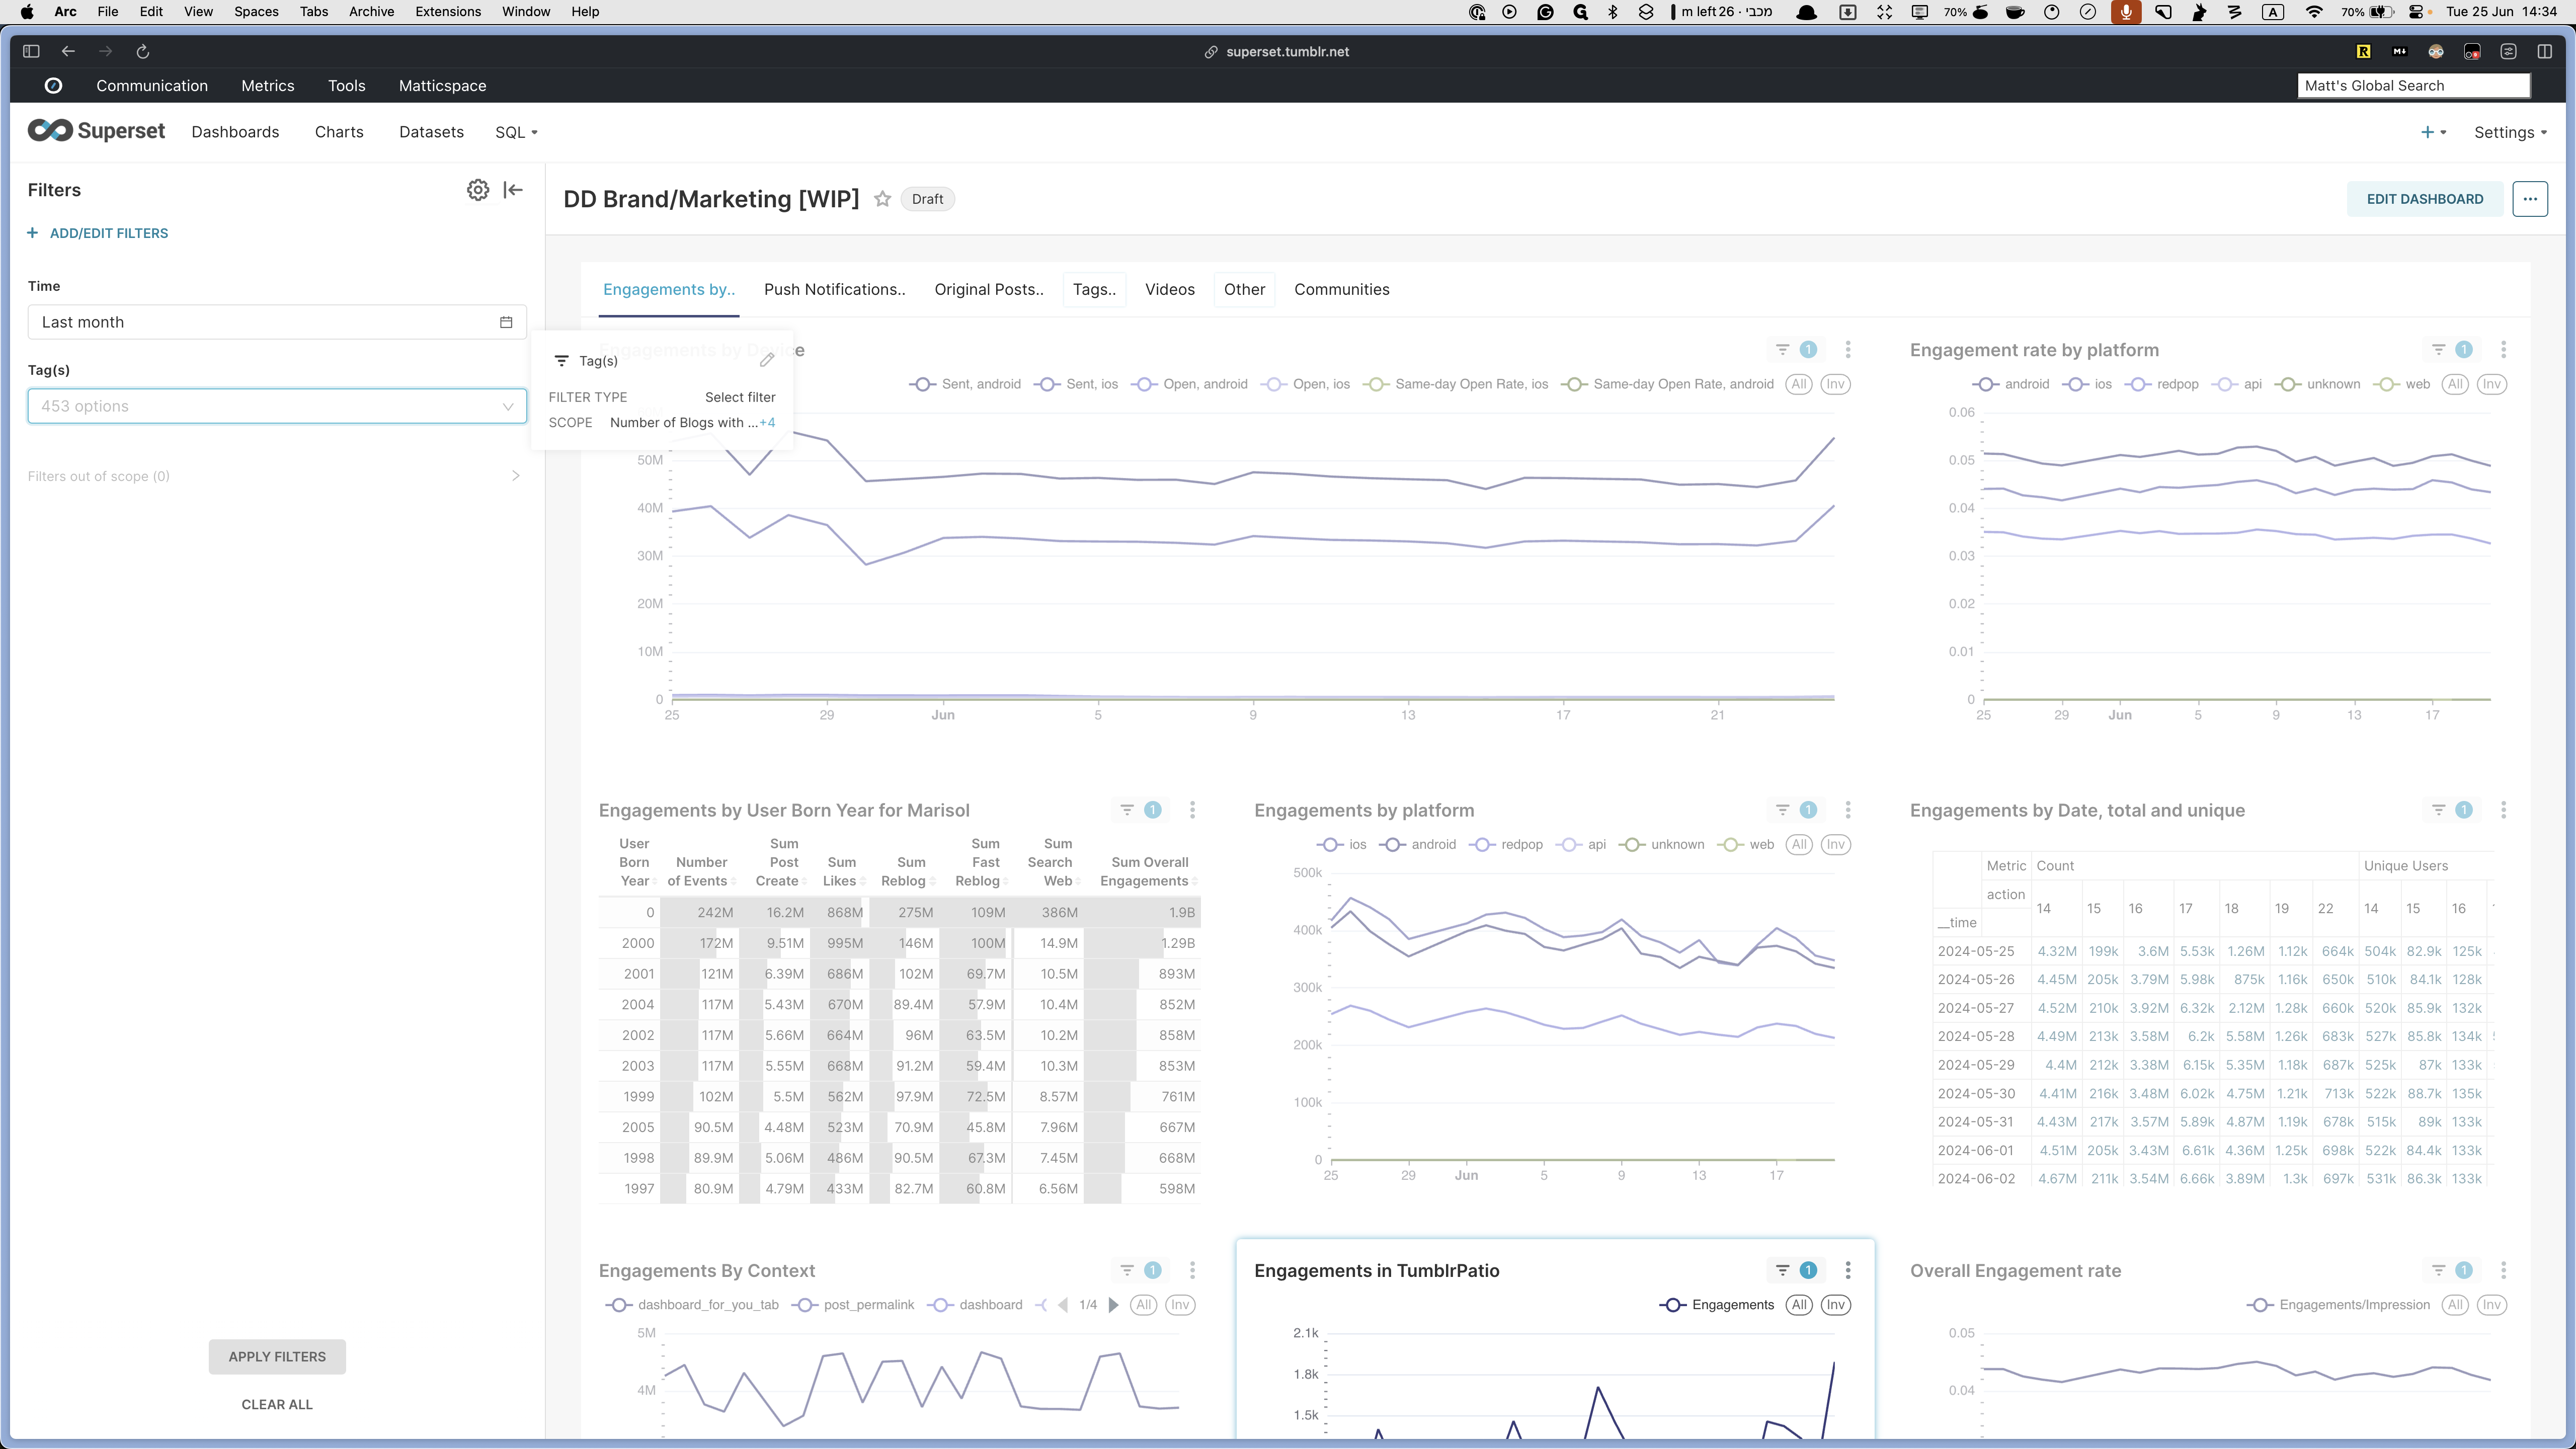
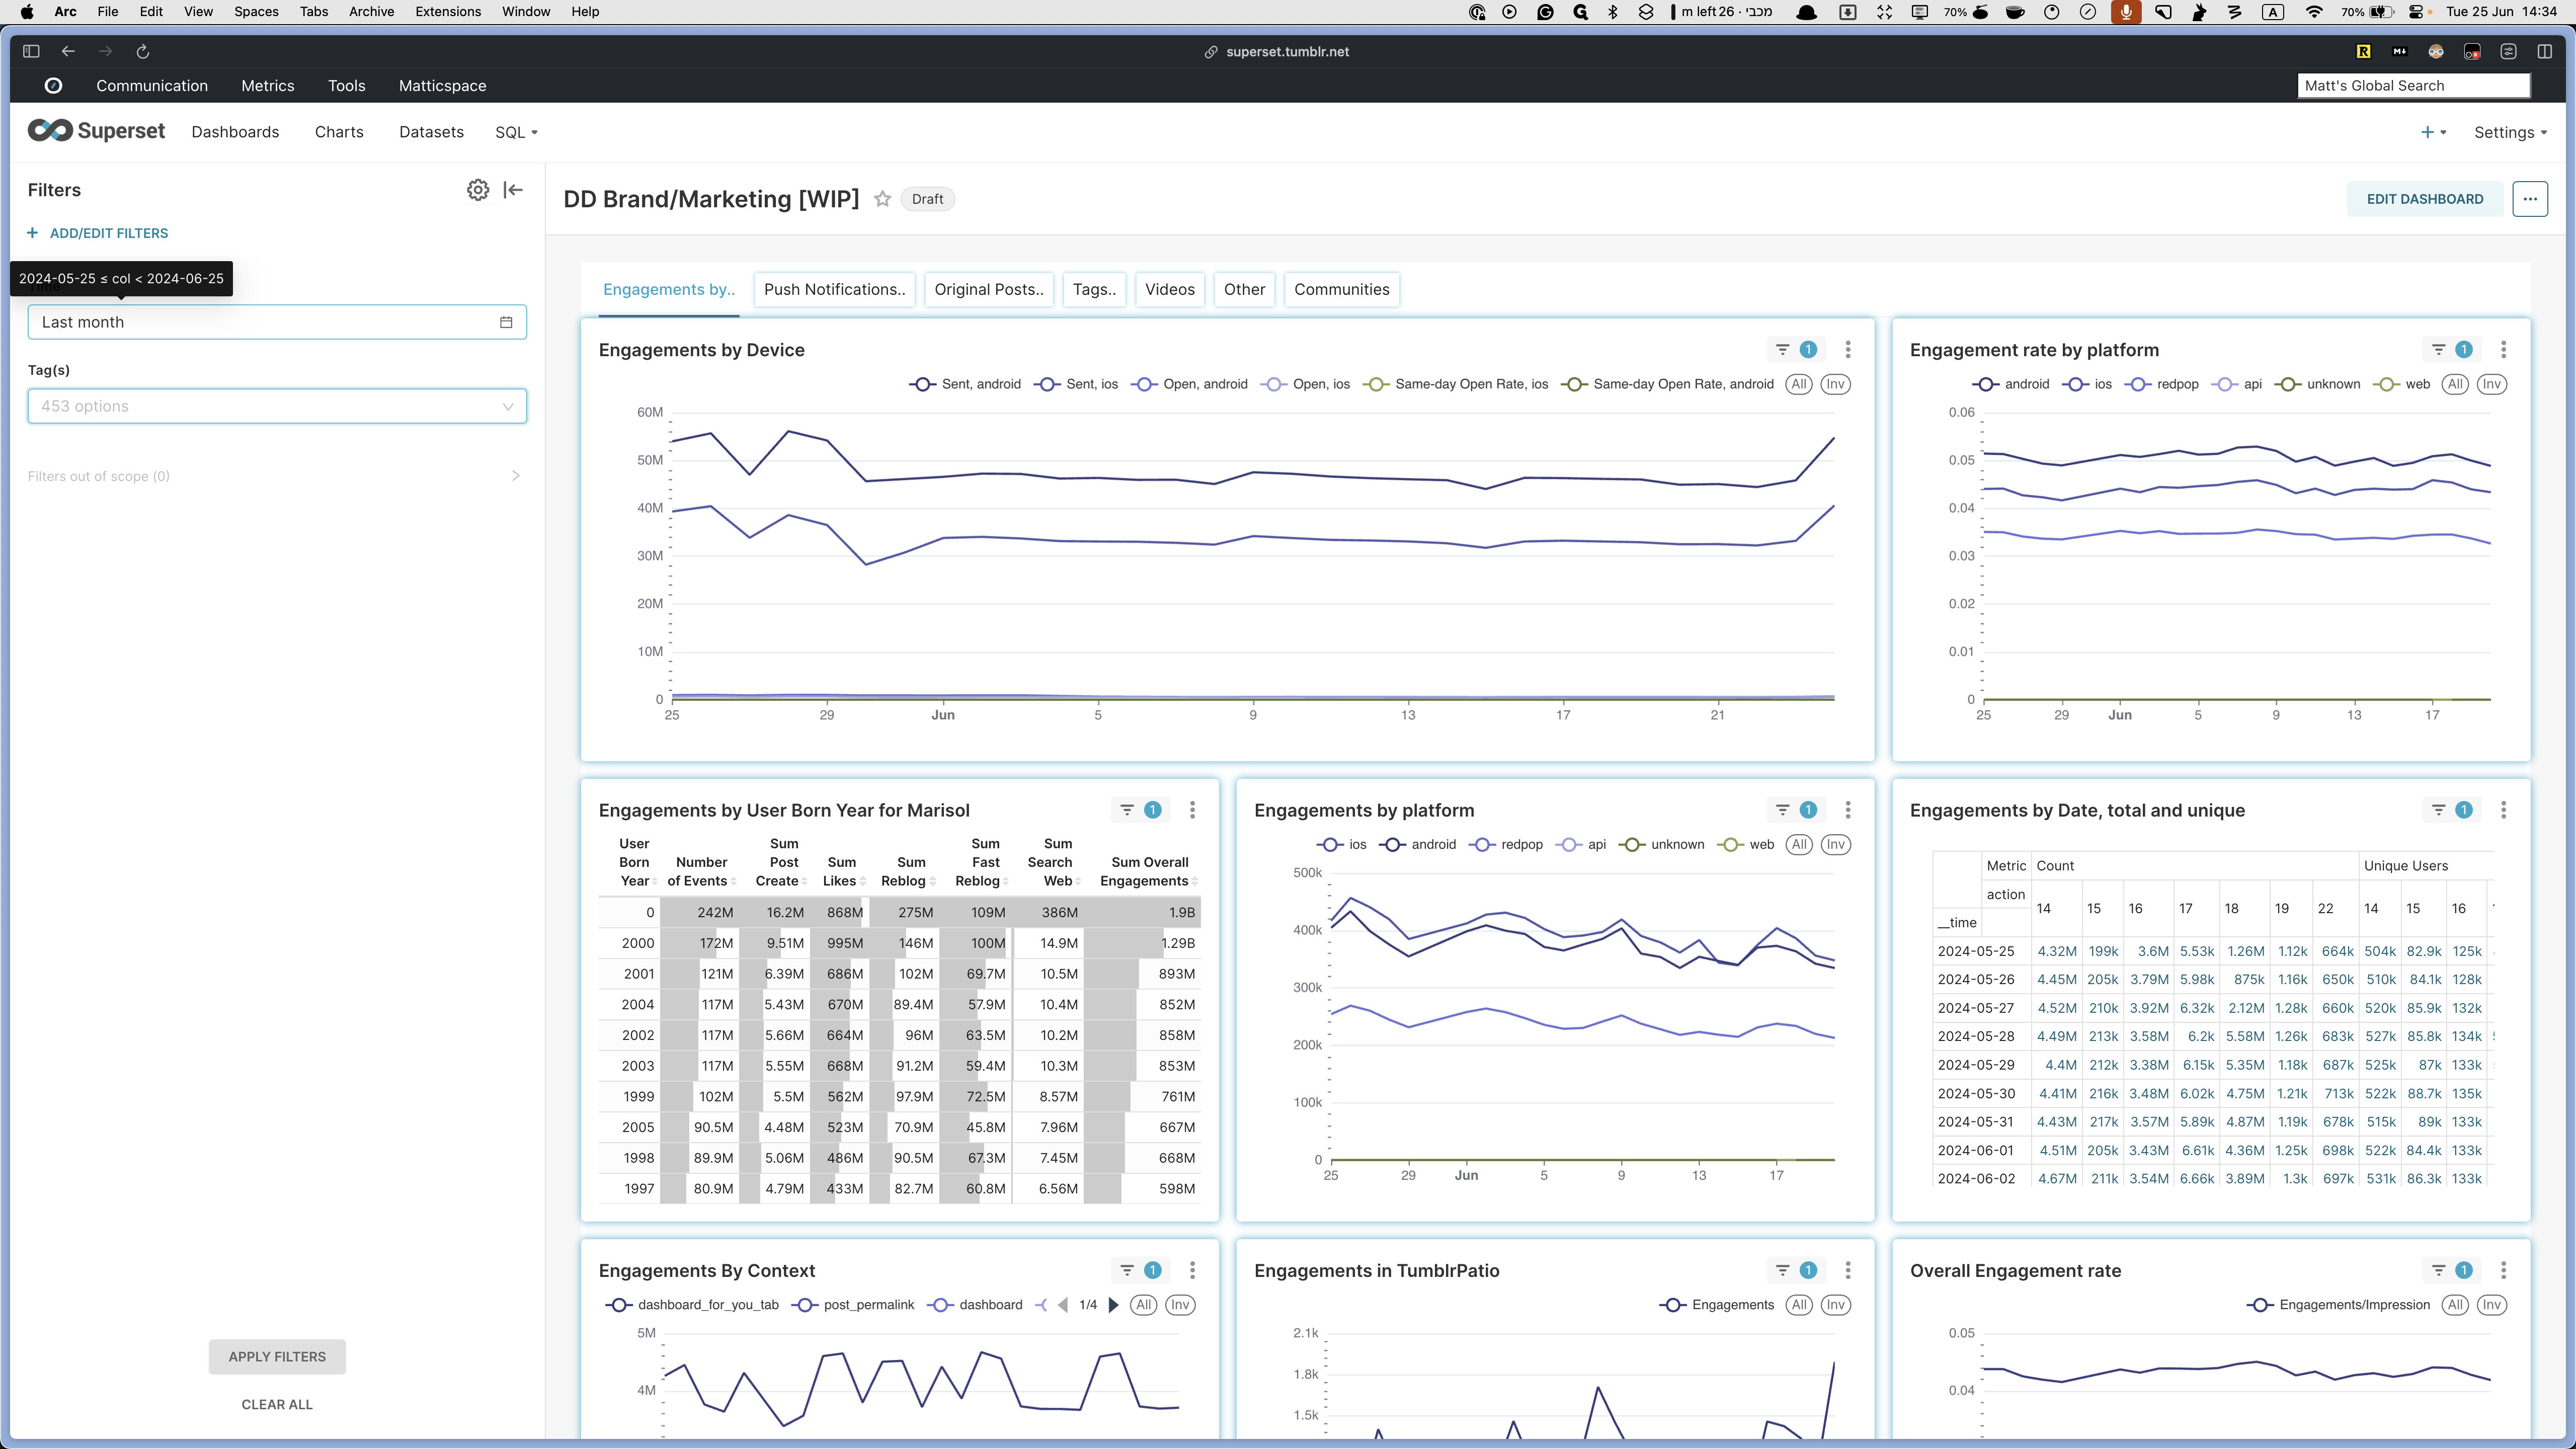
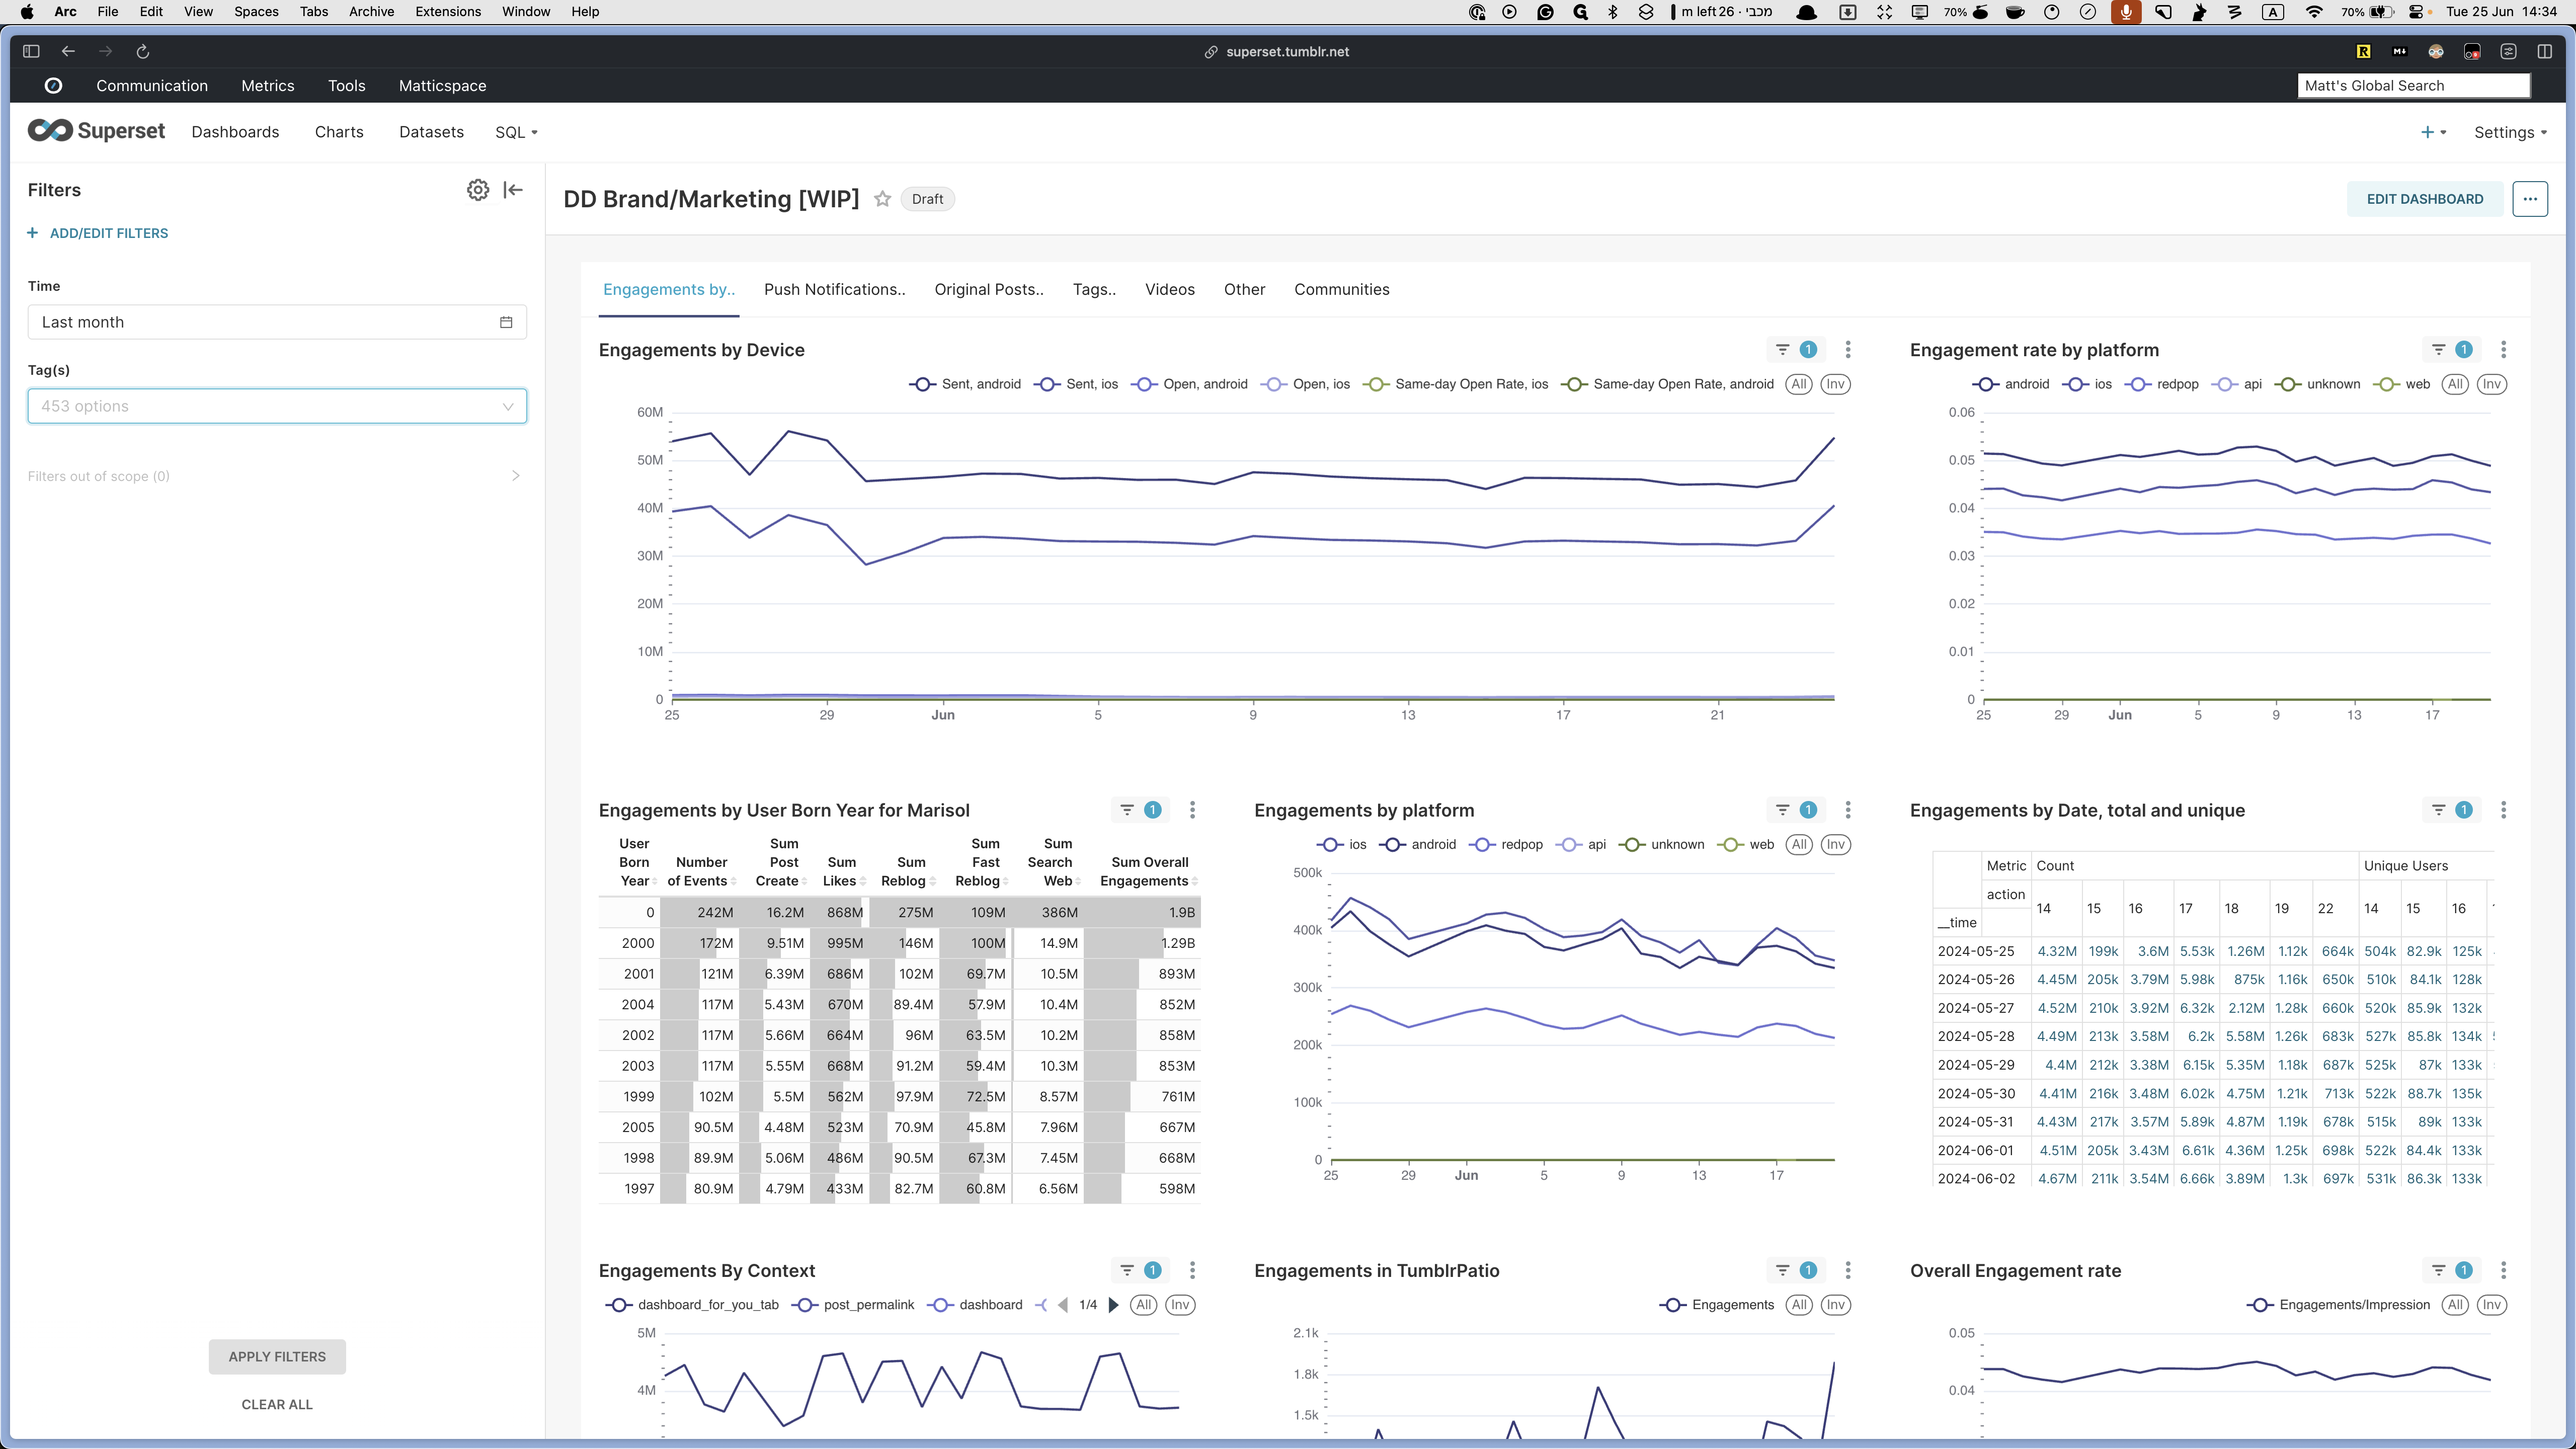
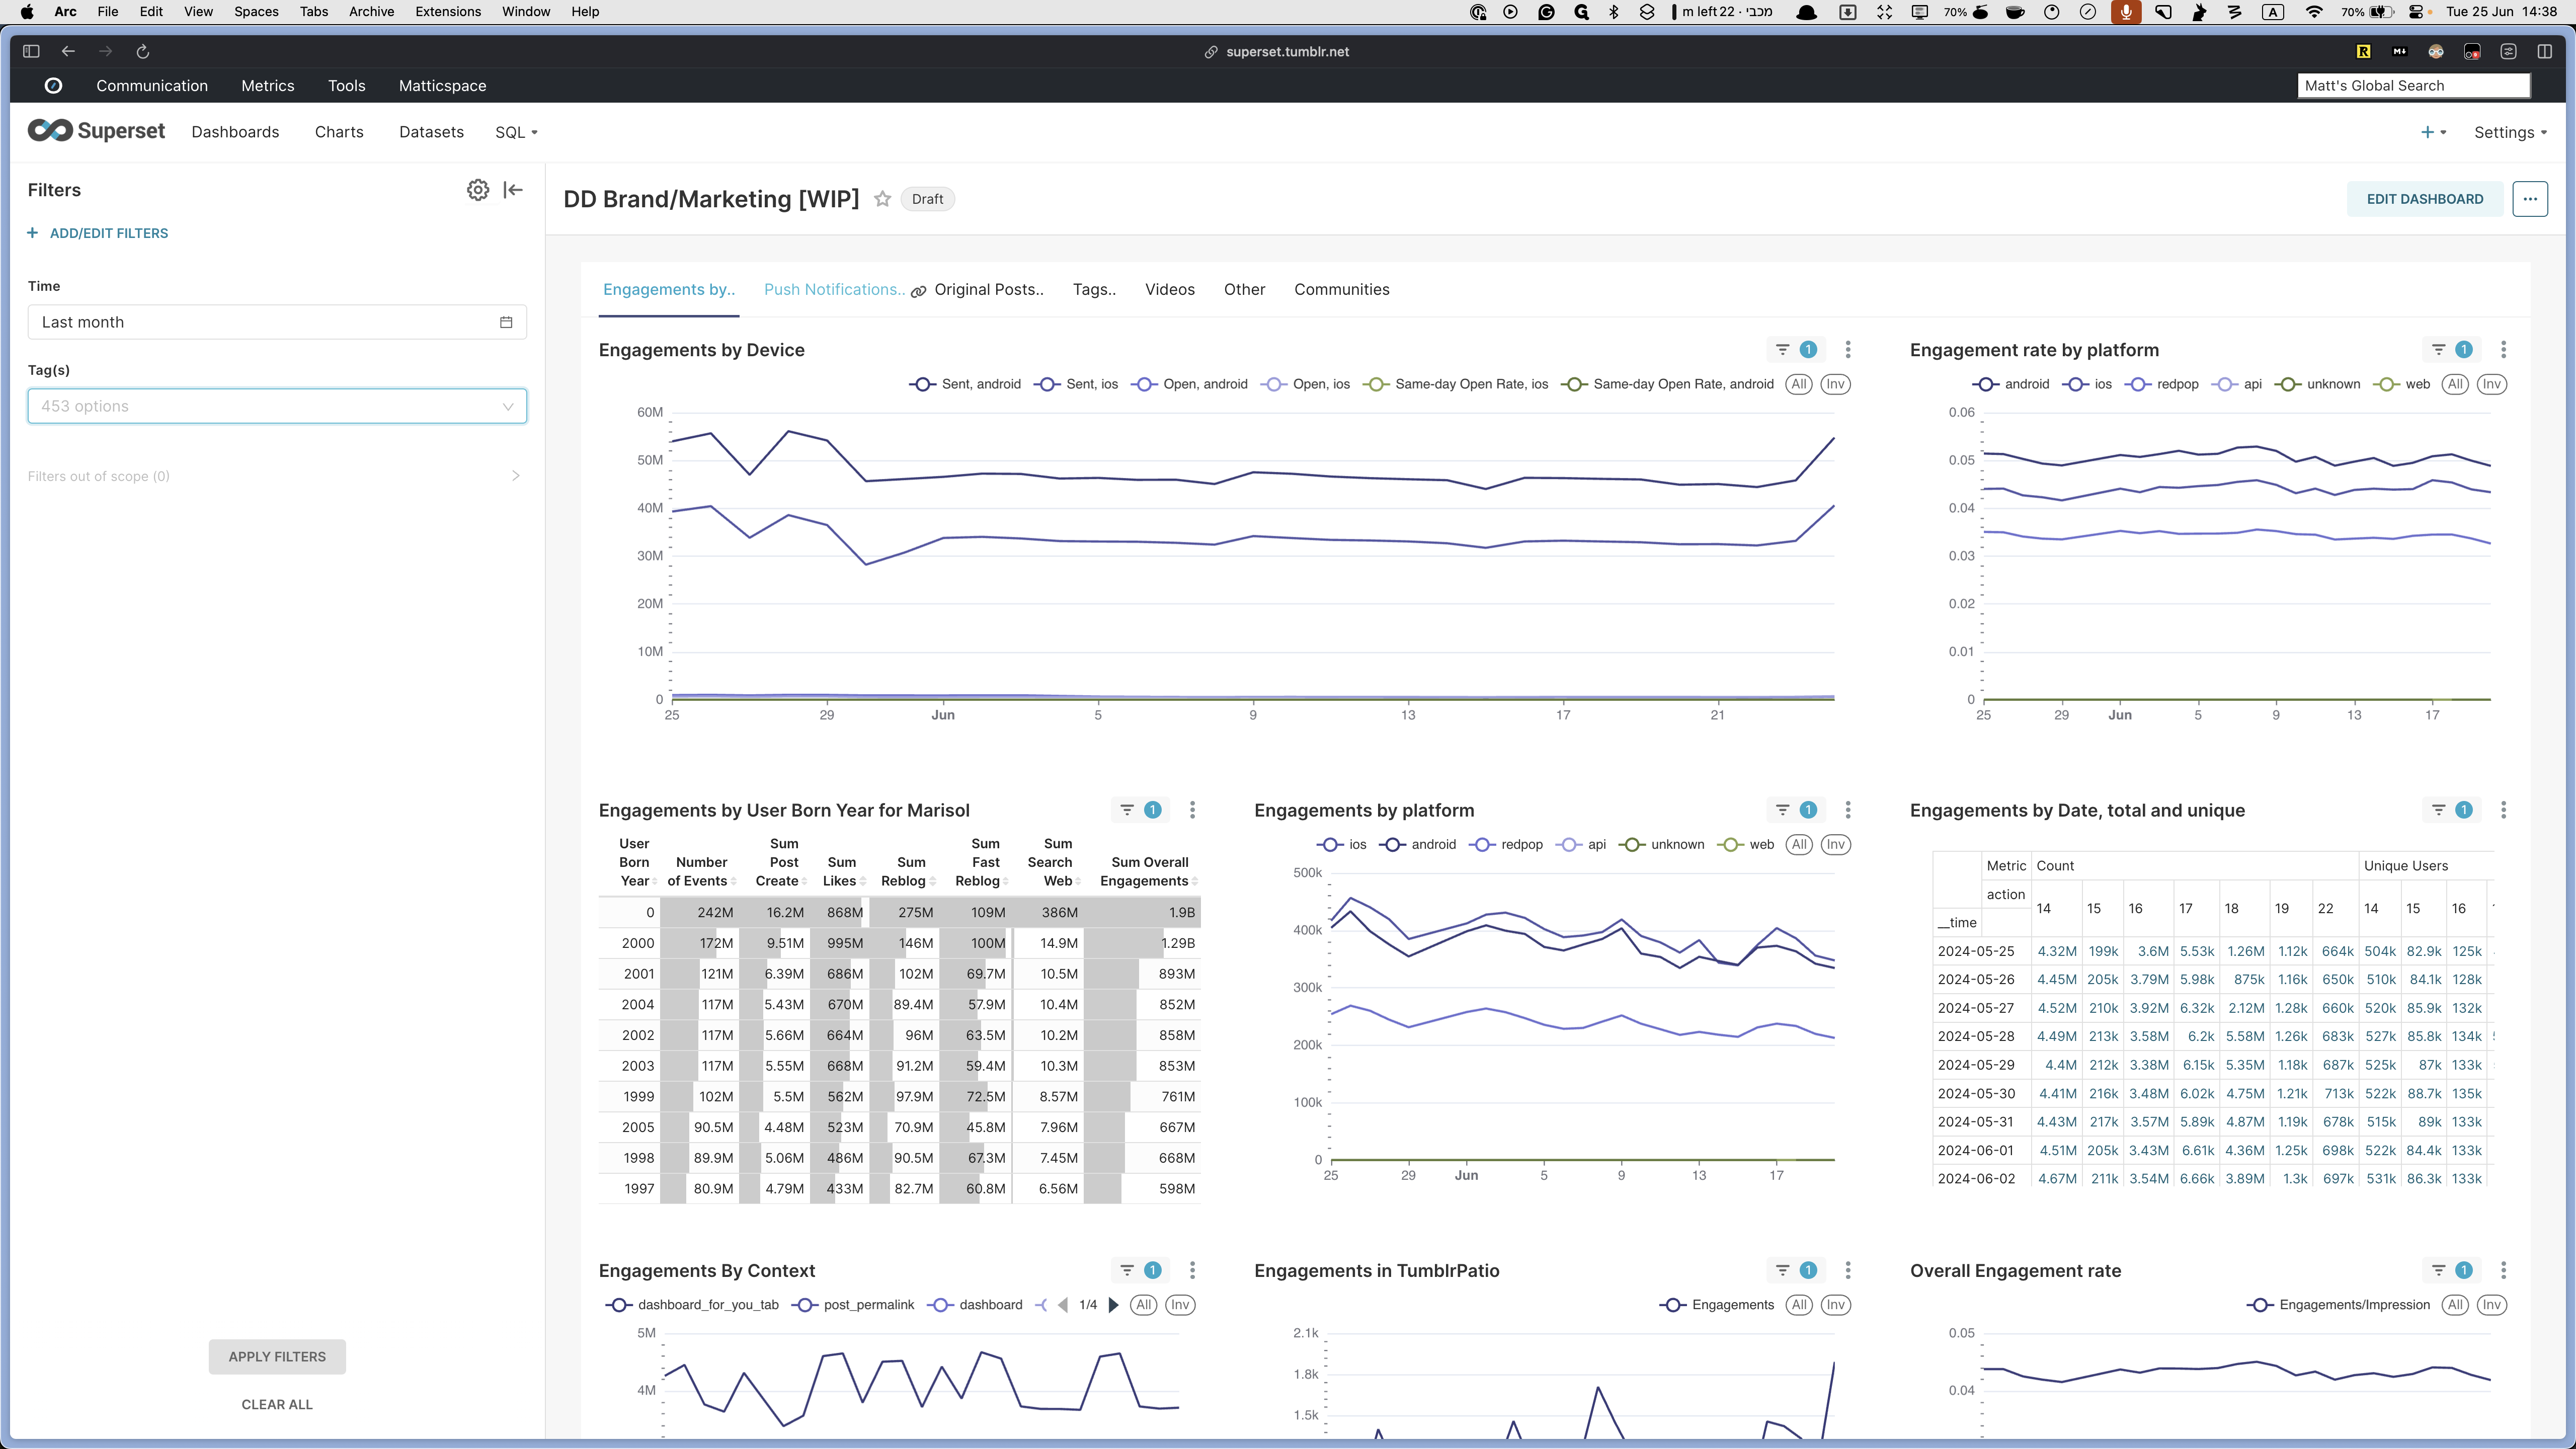
Starting with the engagements tab, you can see all the engagement data available.

At the top, we see engagements by device and engagement rate by platform. There's also data by user birth year, engagements by platform, and engagements by date, both total and unique.


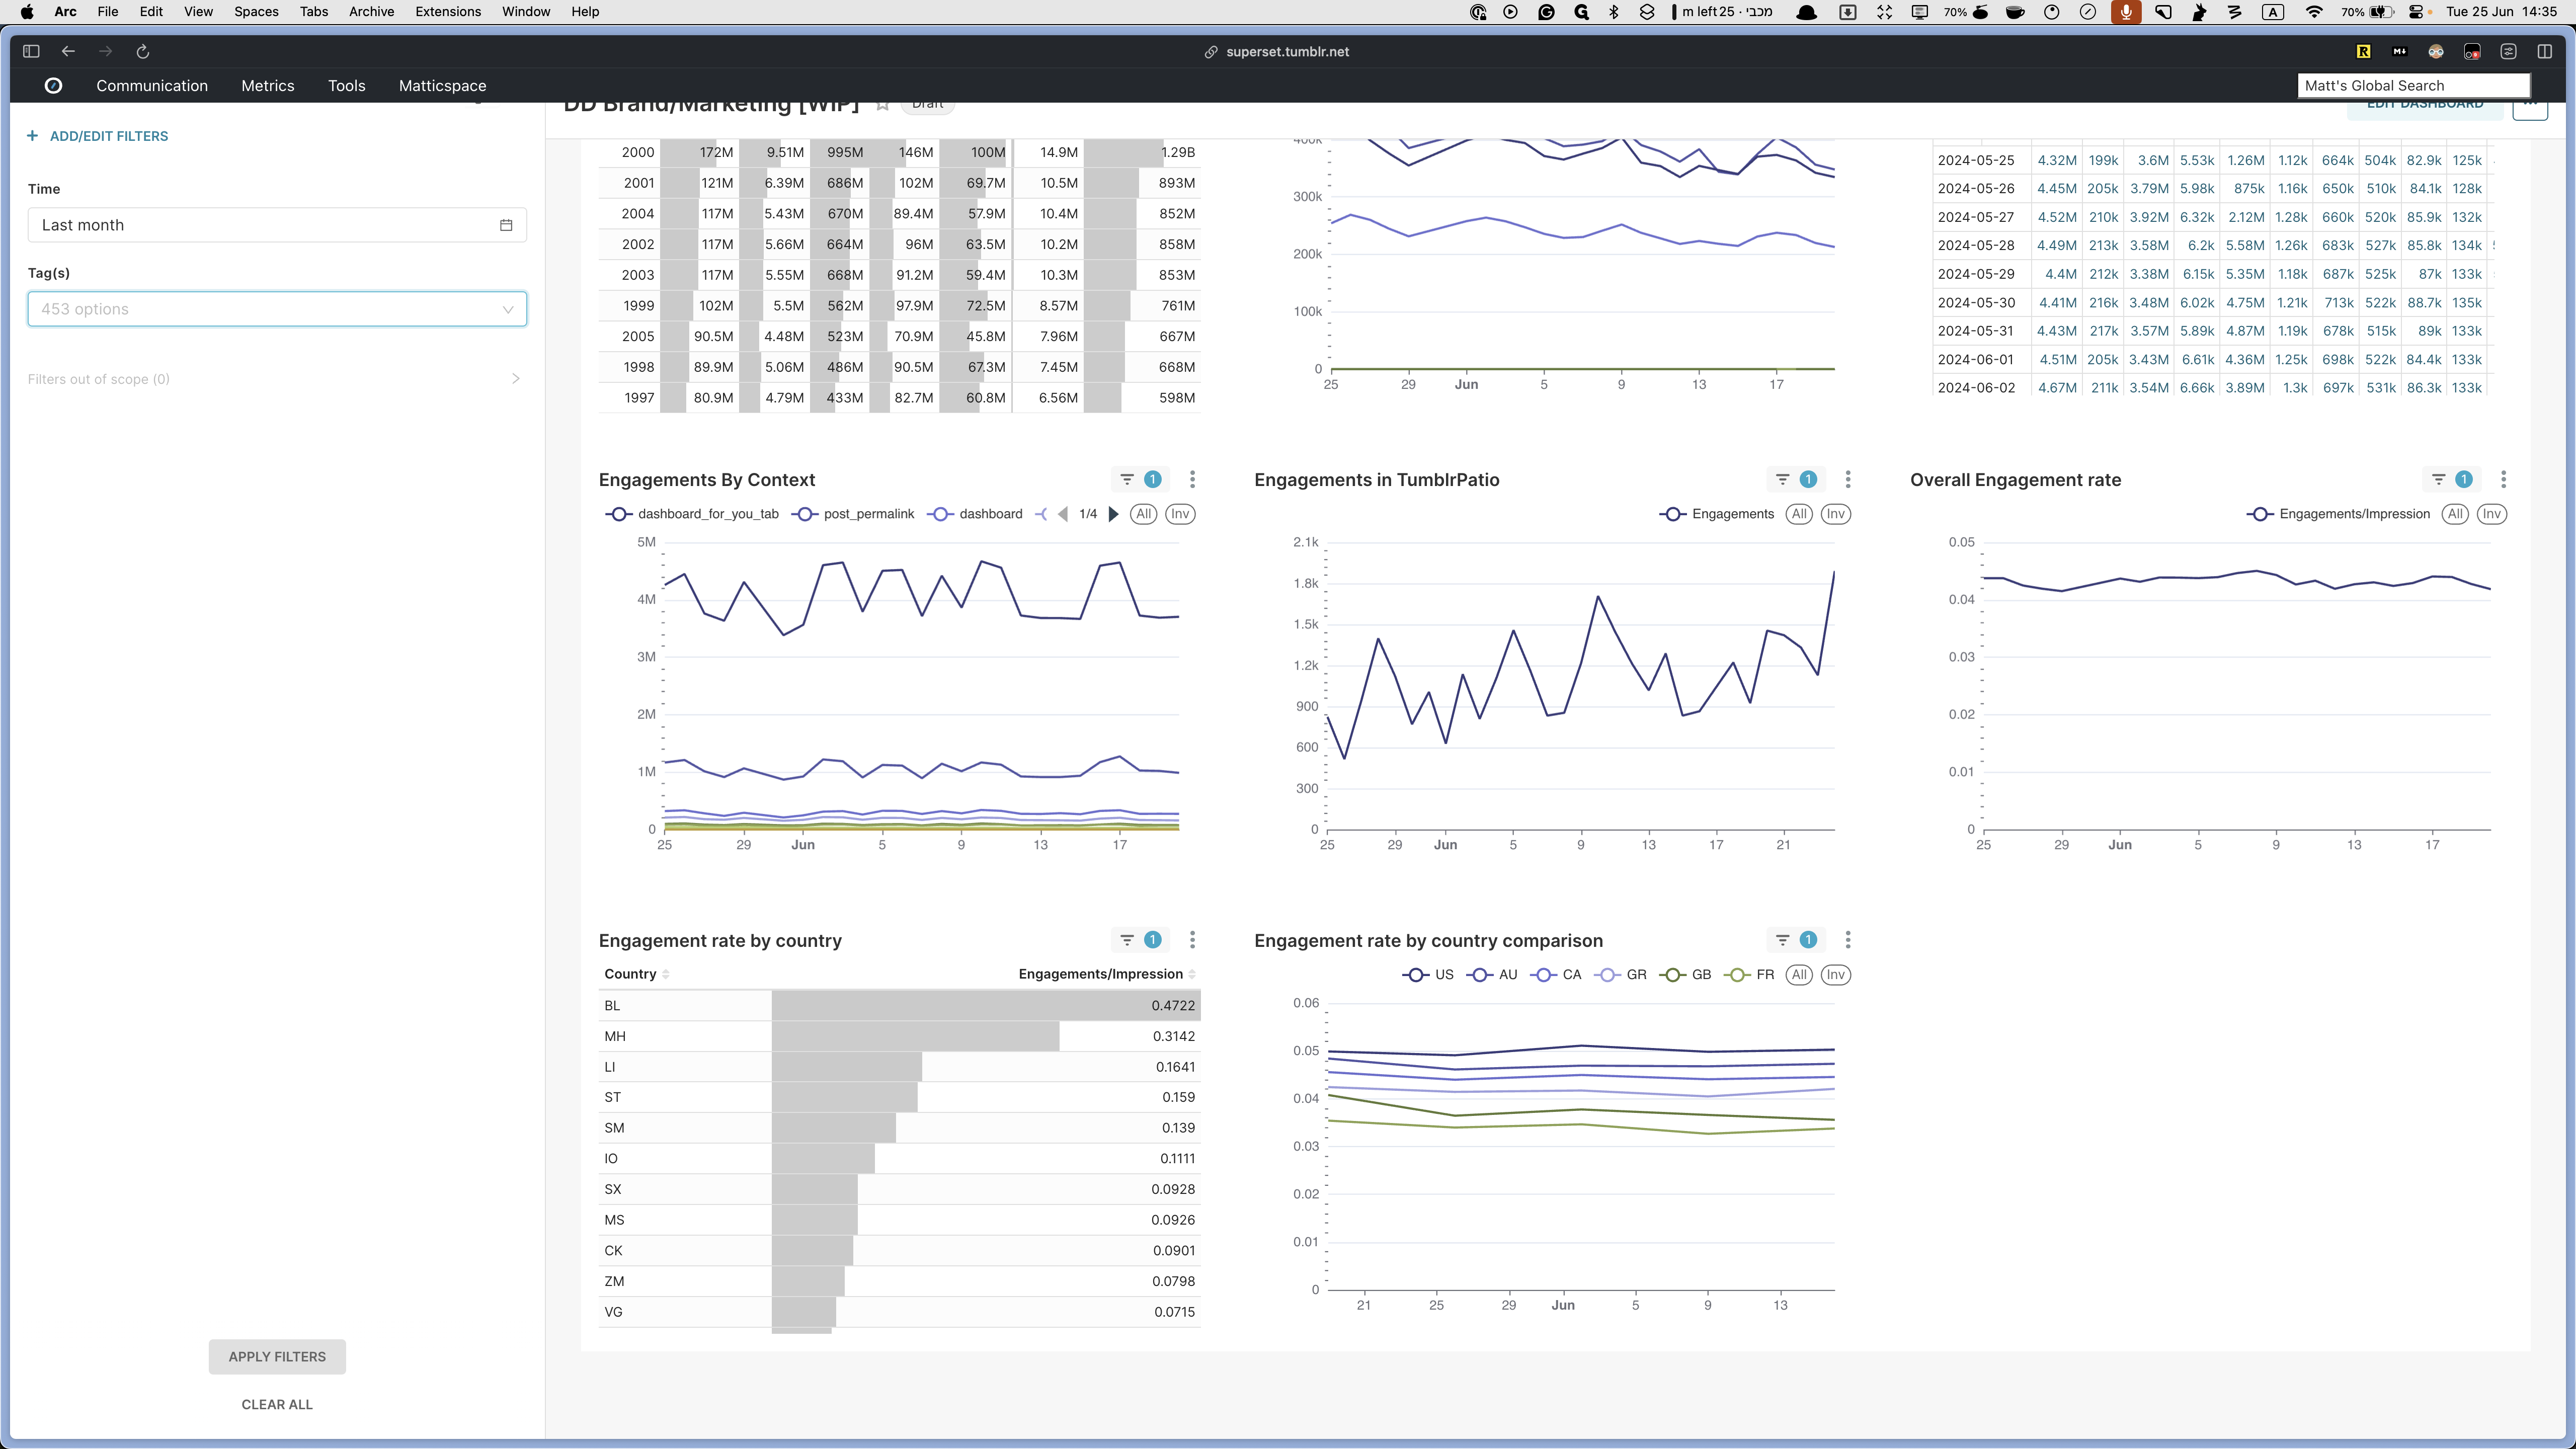
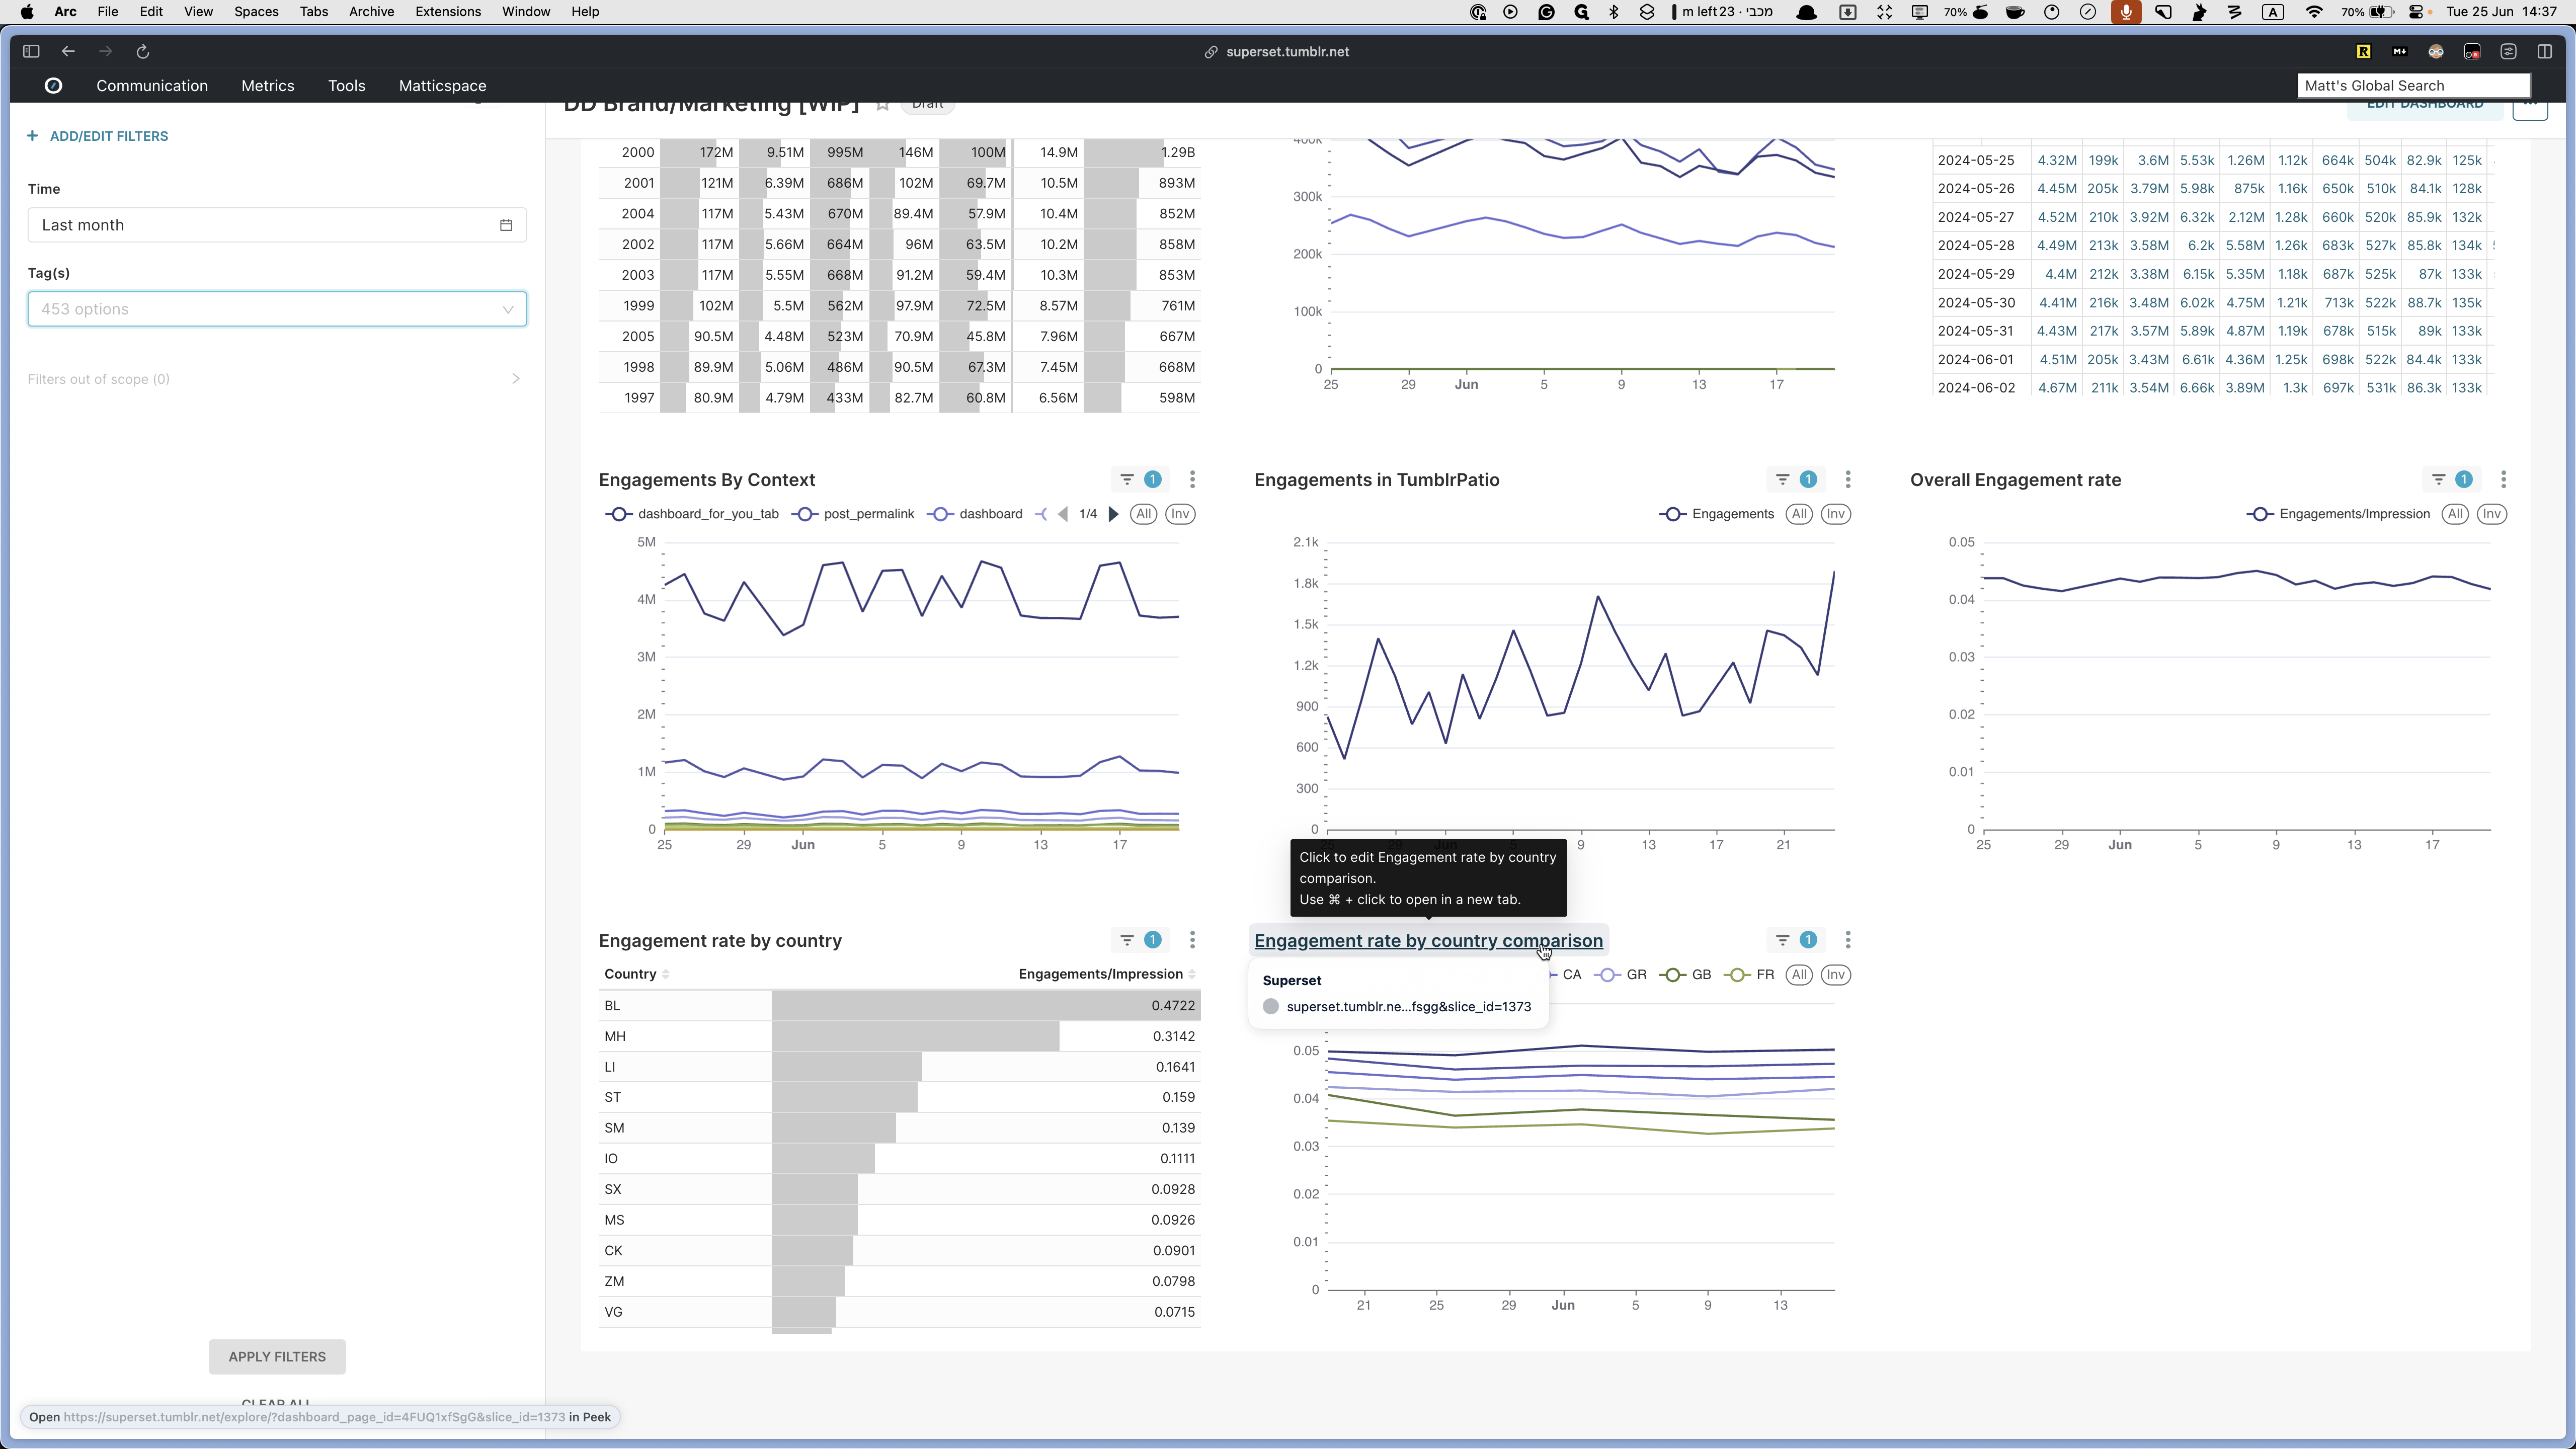
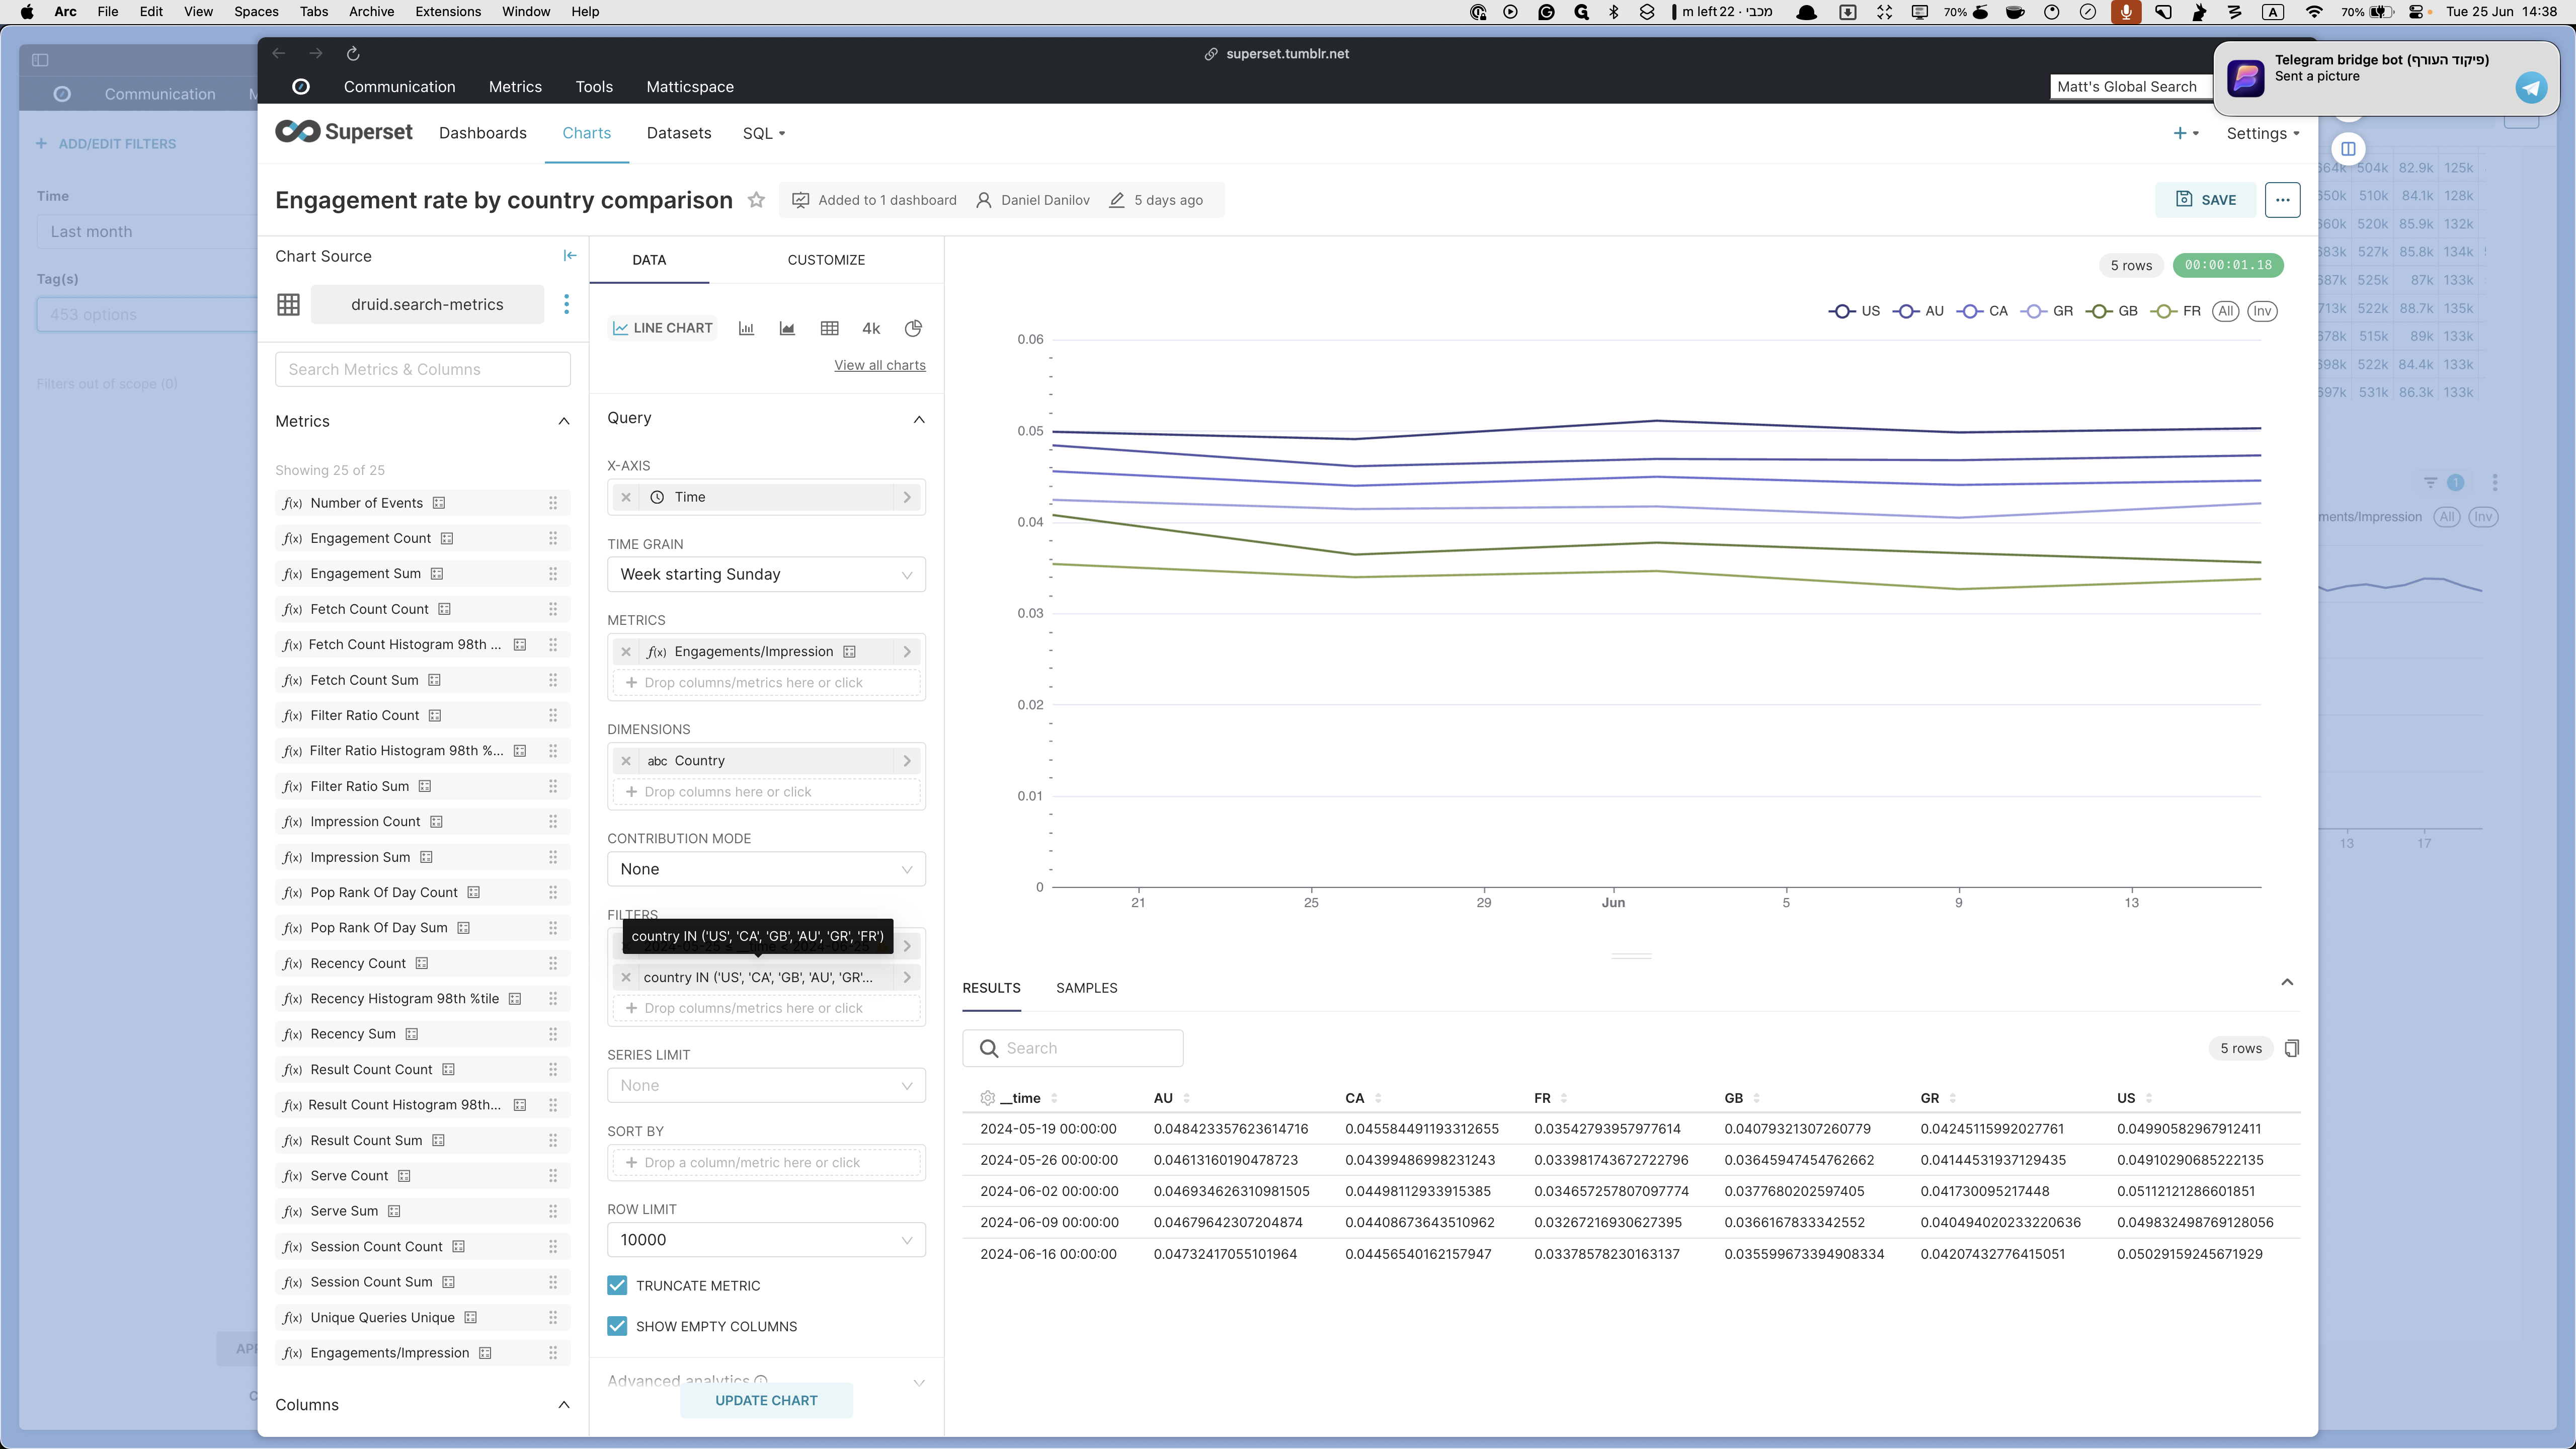
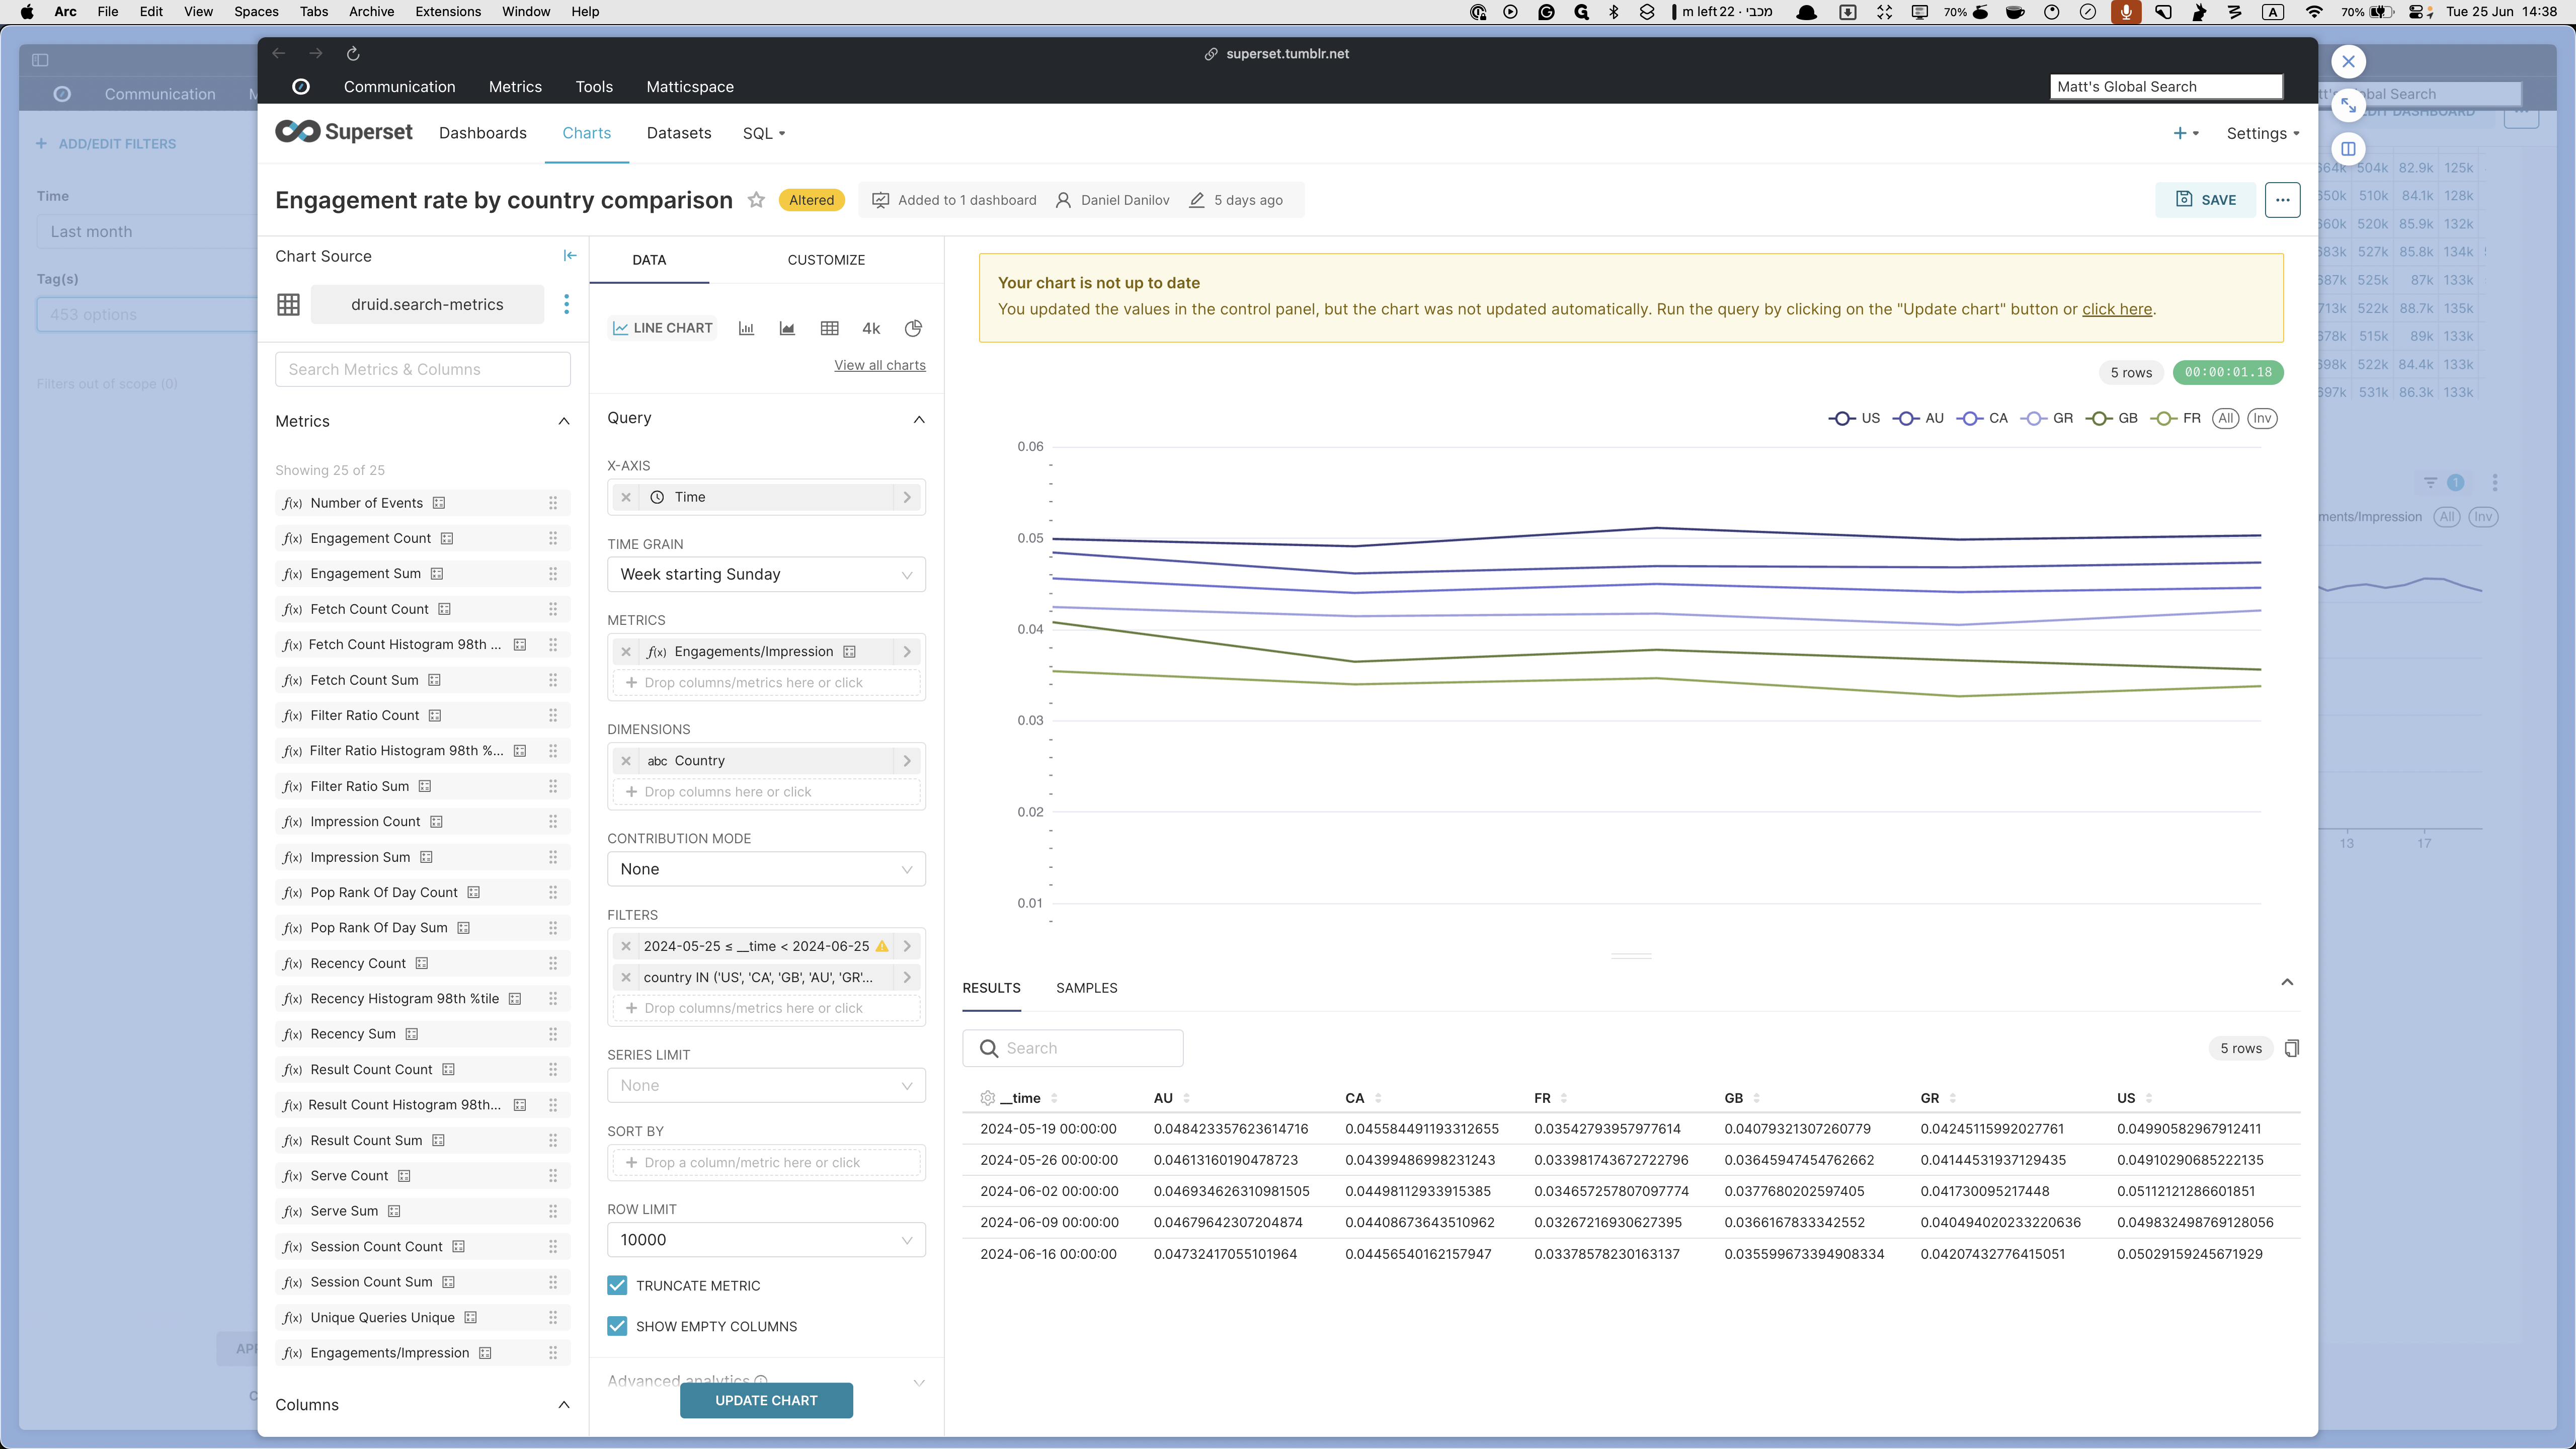
If you scroll down to the bottom, you'll see engagements by context, engagements in Tumblr pay show, overall engagement rate, engagement rate by country, and a comparison of engagement rates by country in a line graph. We will later see how you can customize this.


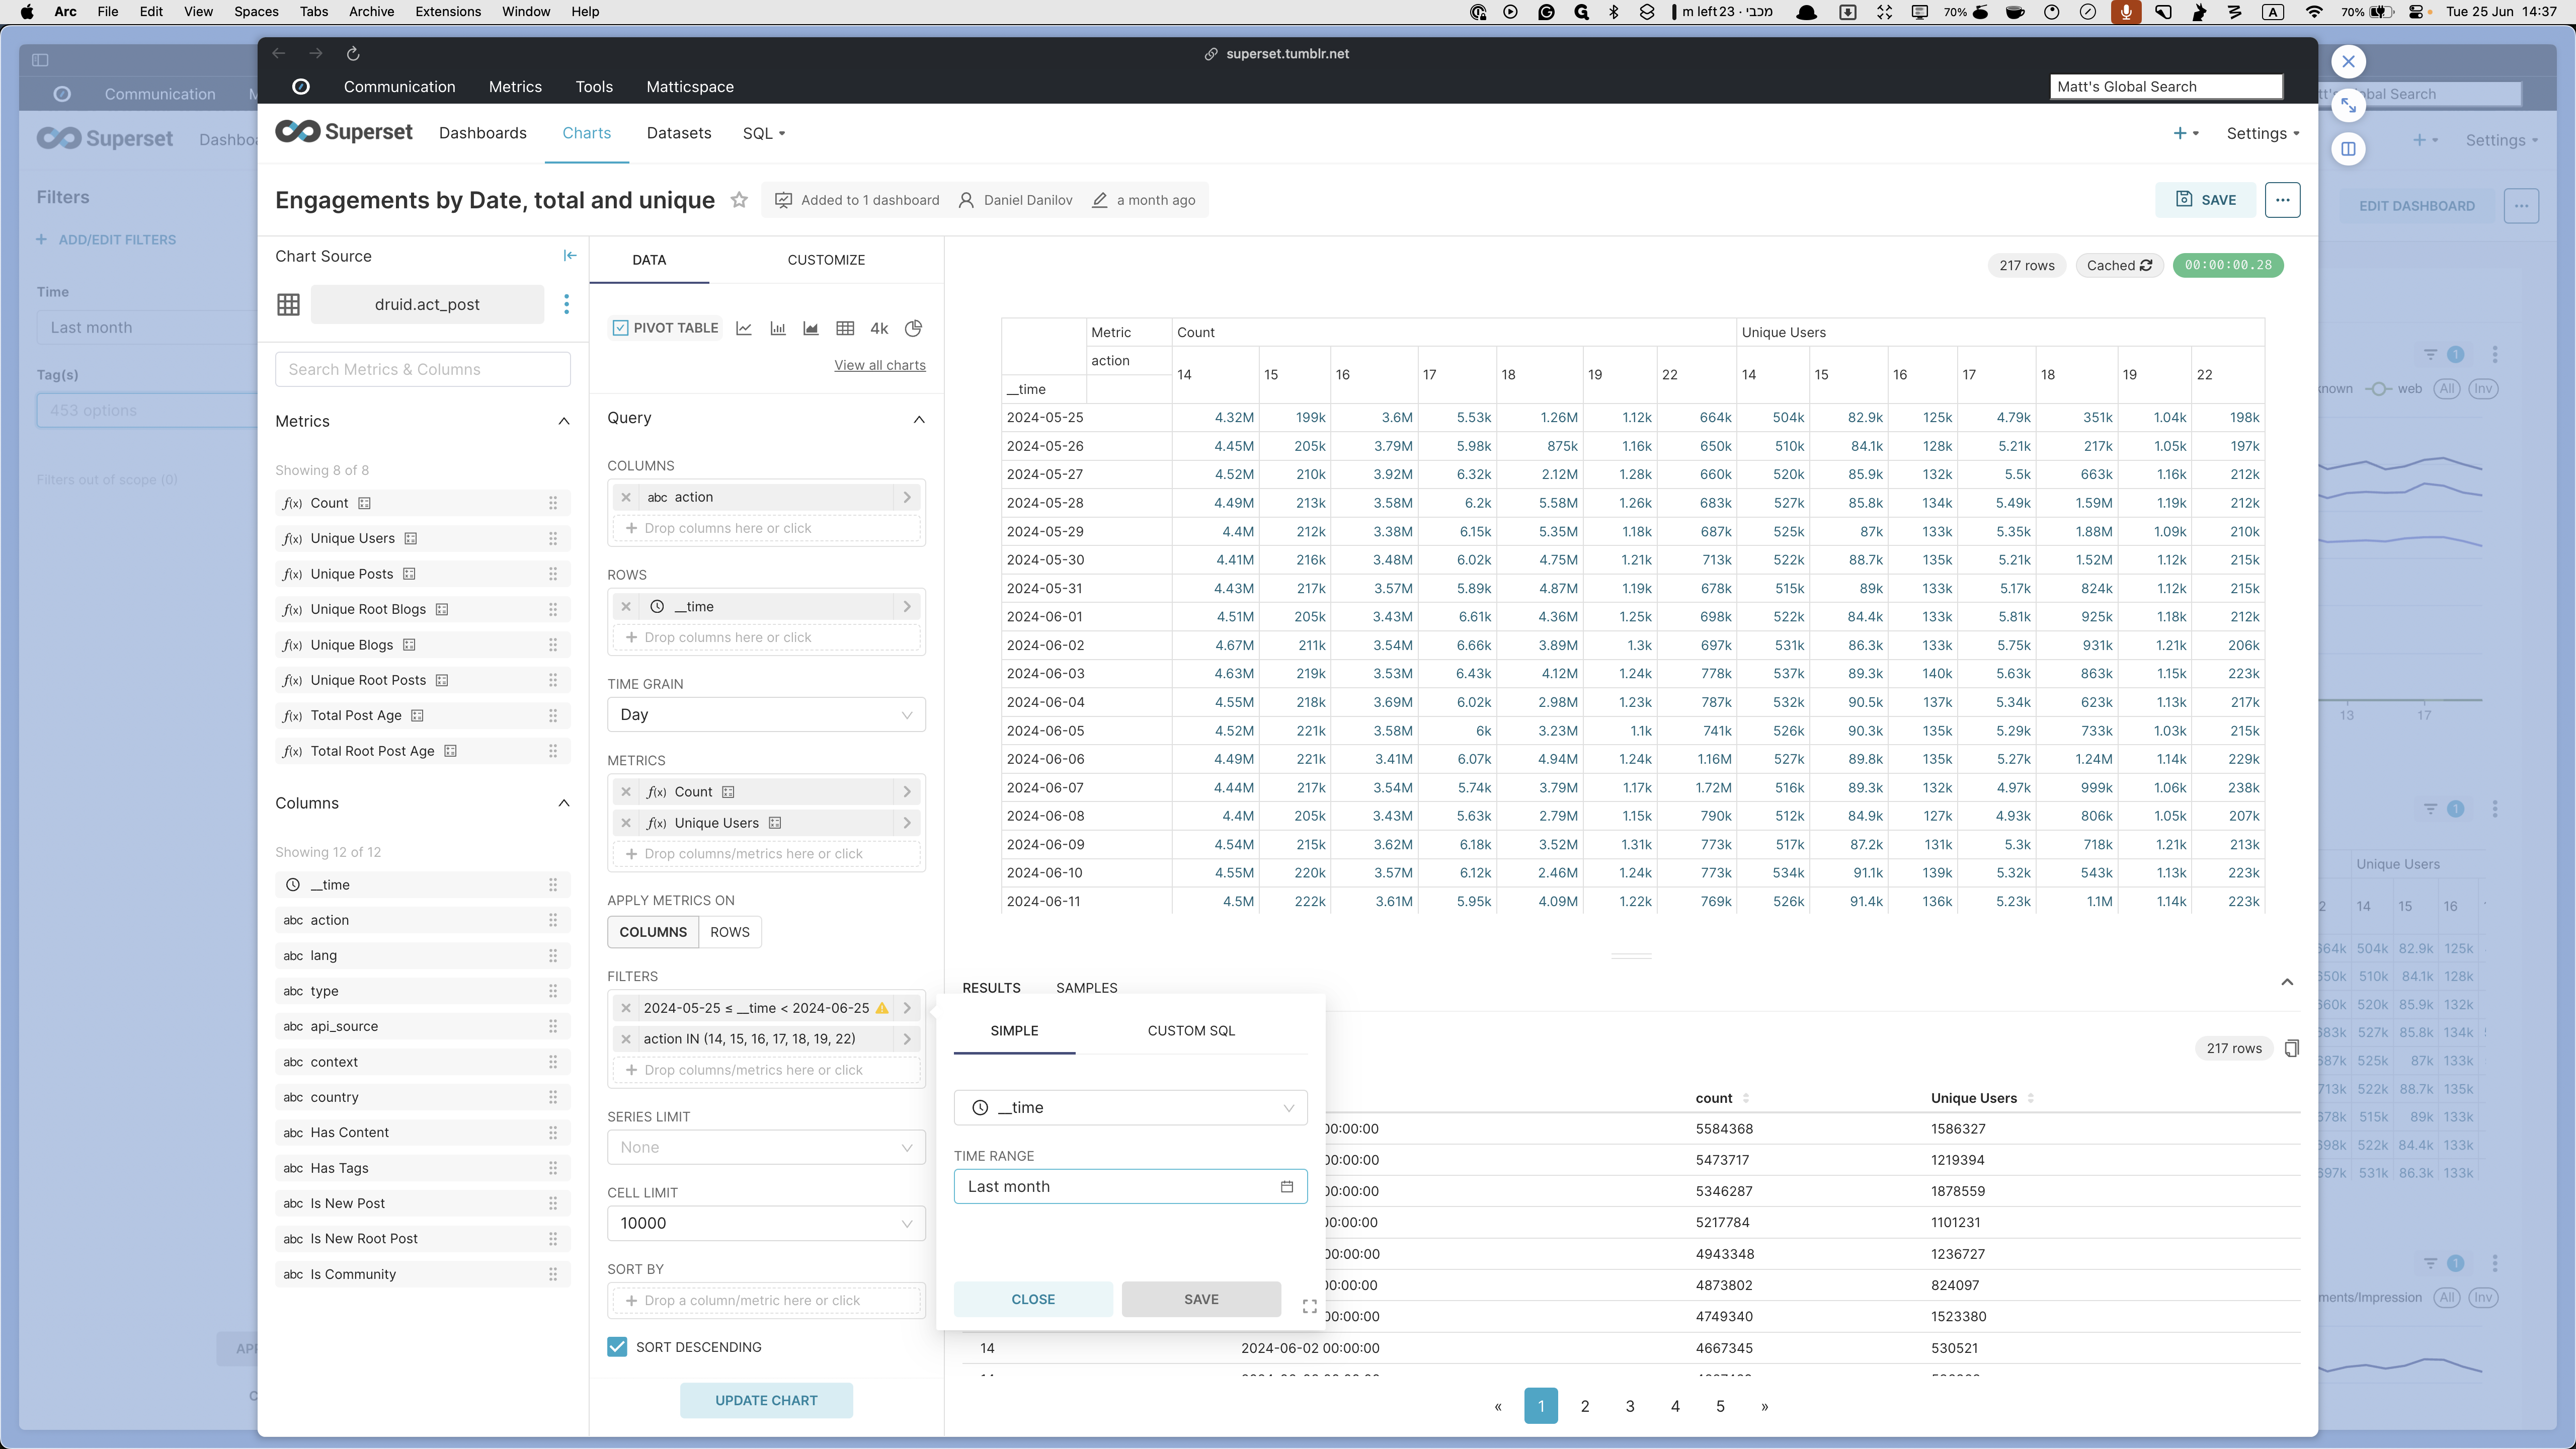
You can access any of these charts by clicking on the title. For example, I'm going to open the "Engagements by Date, Total, and Unique" chart.
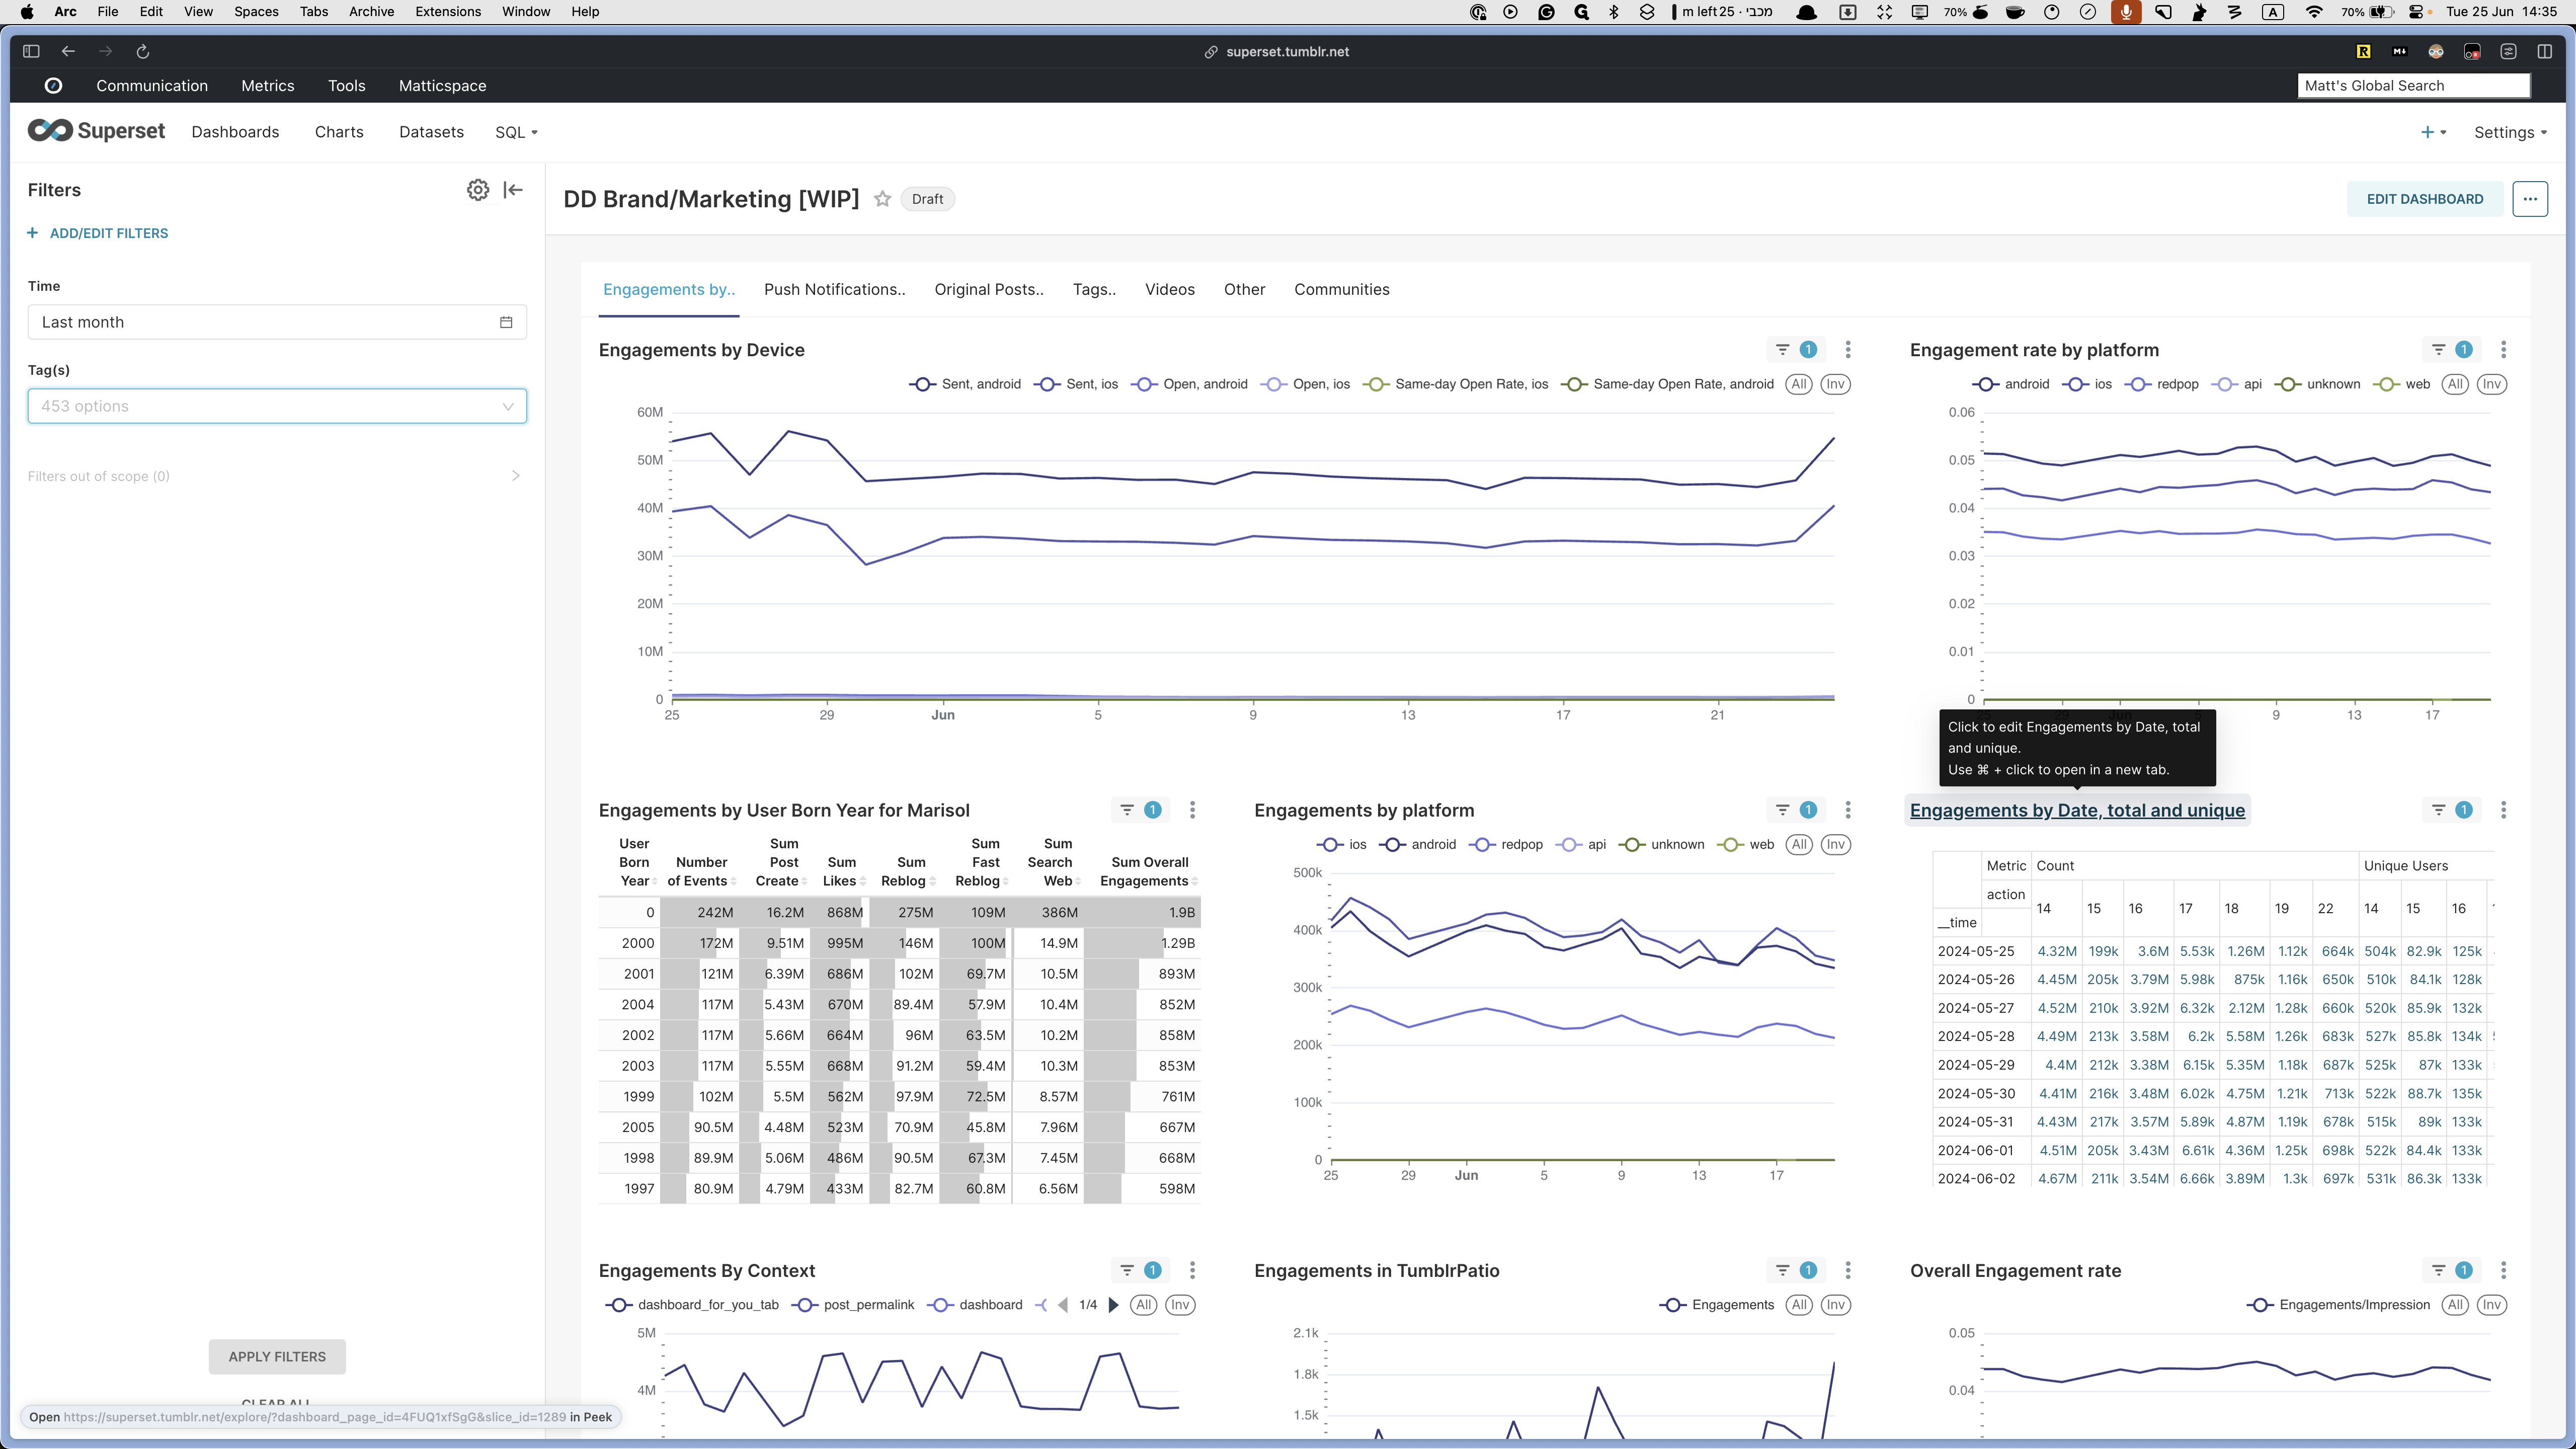
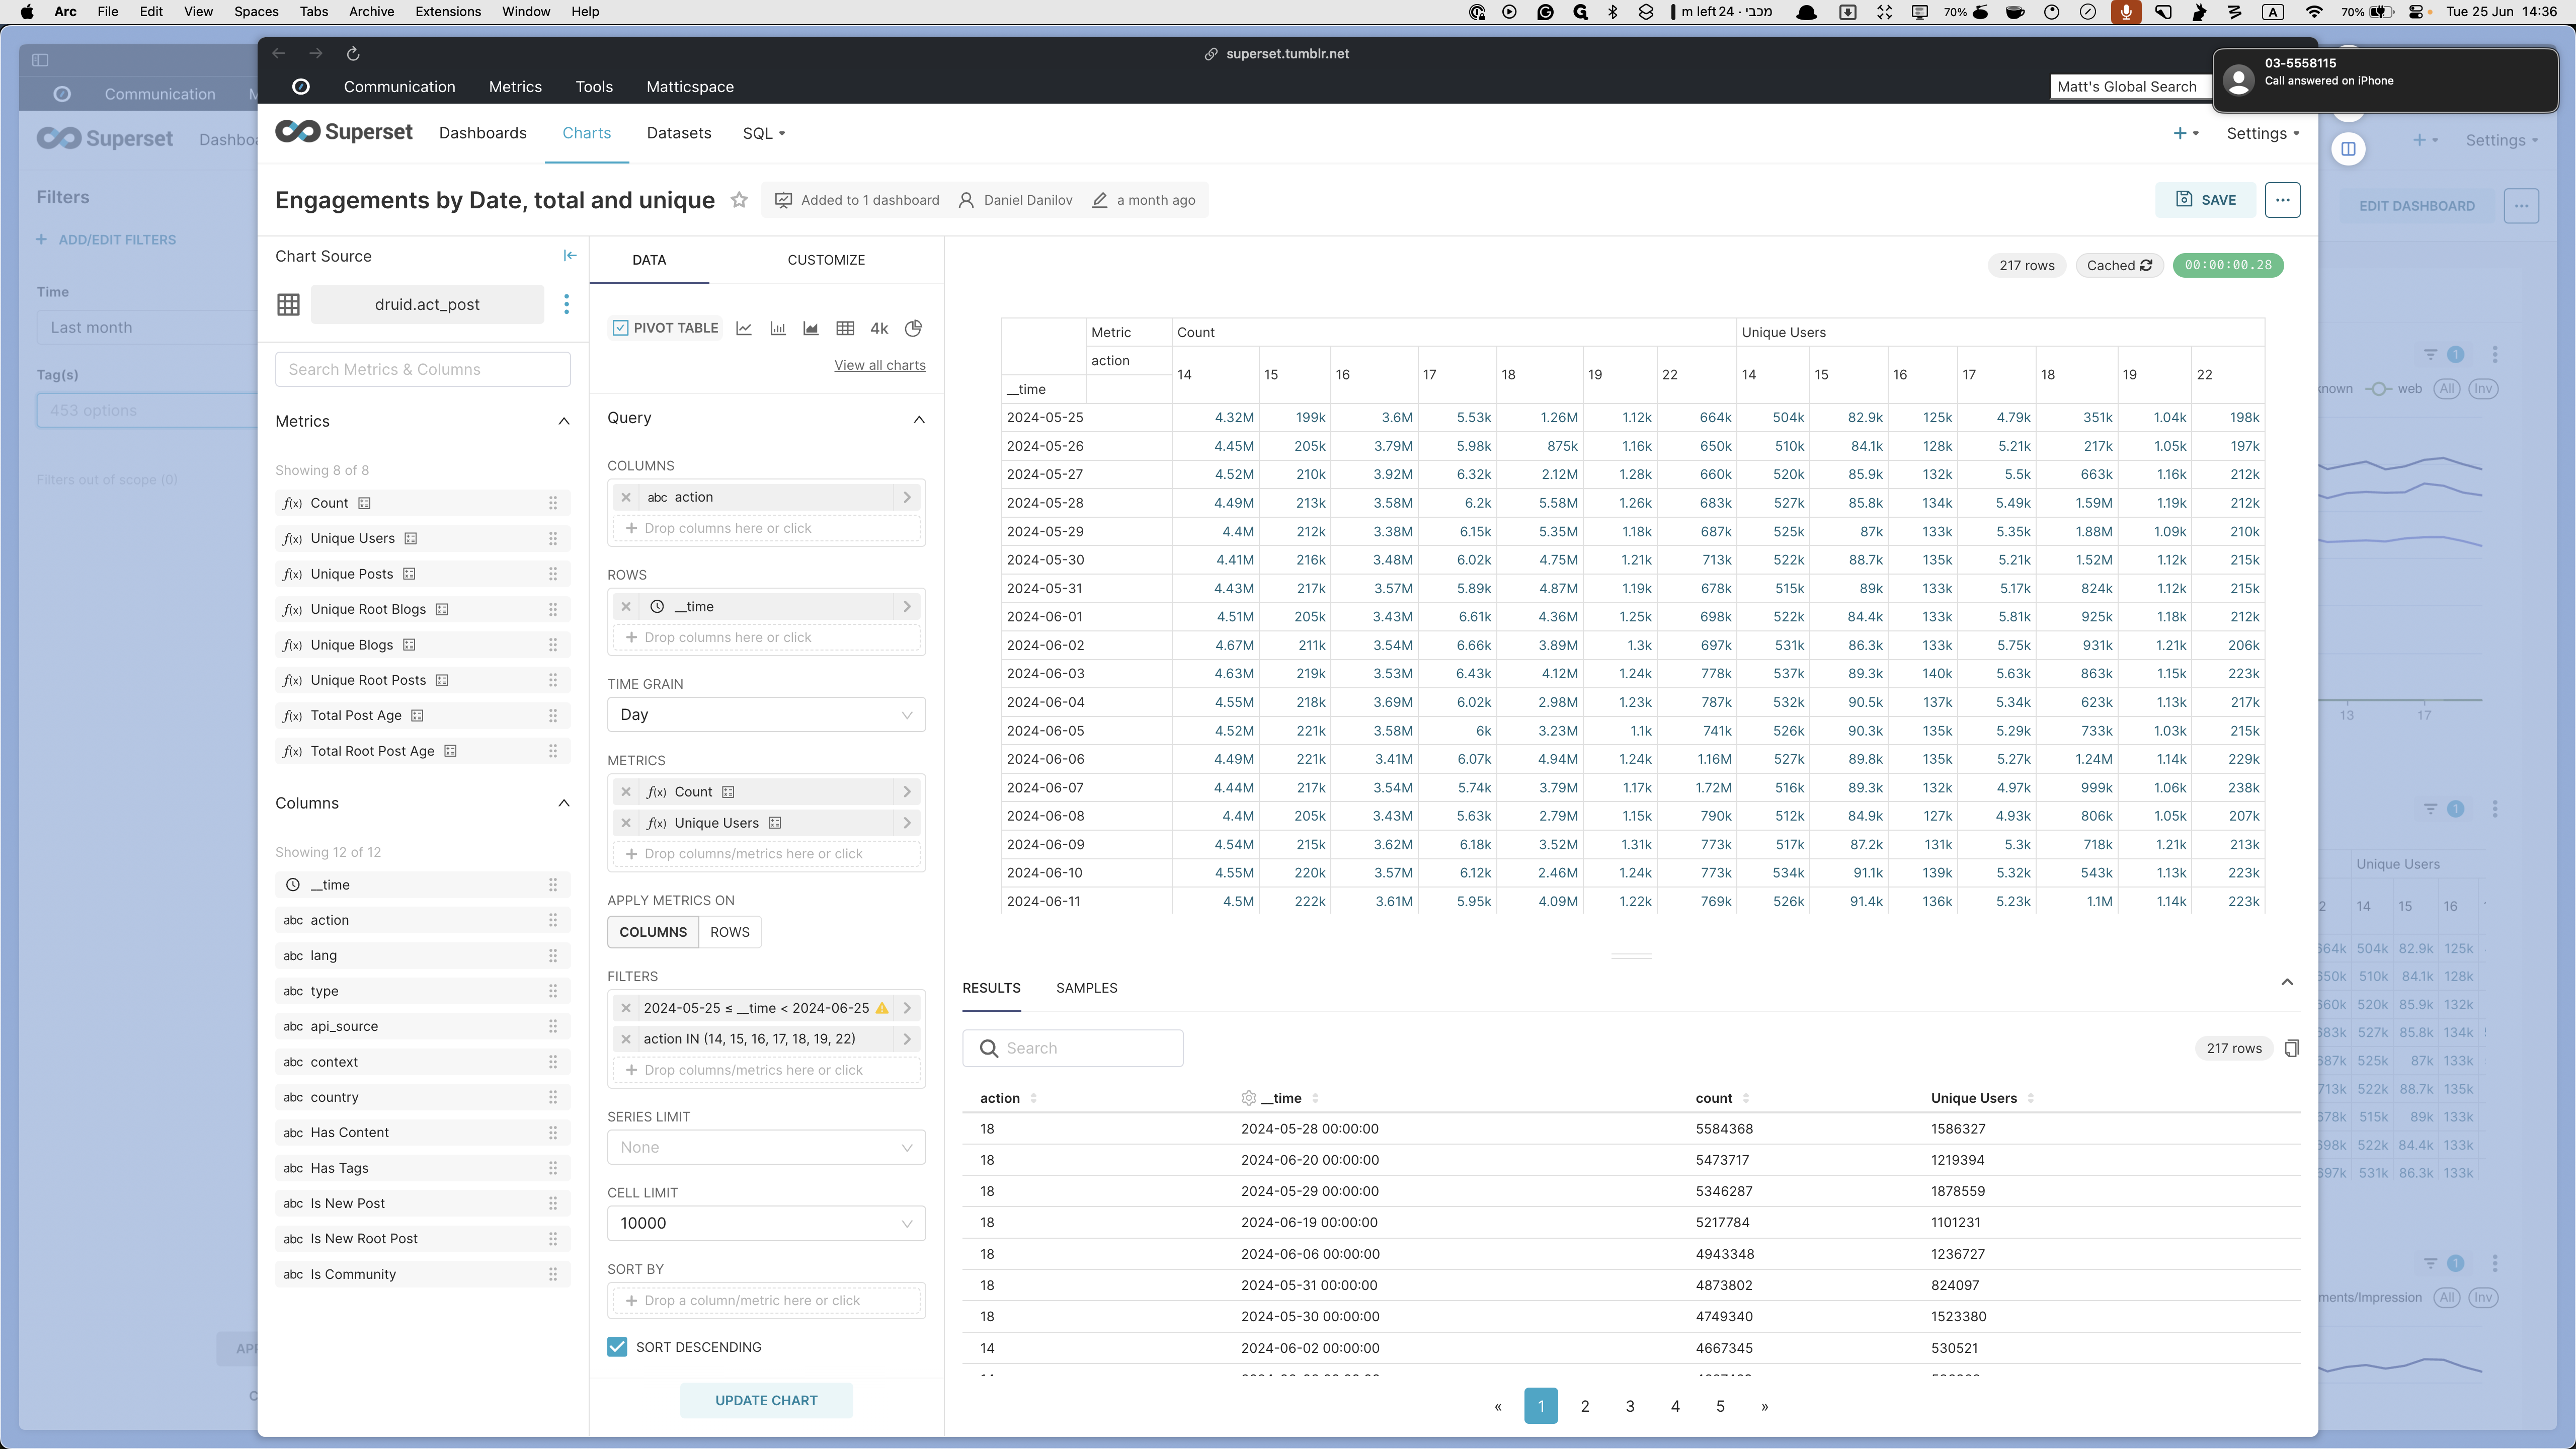
Here, you will see all the results from the table view, including all filters and existing data. In this chart, you will see the count and unique users for each action taken within the last month.
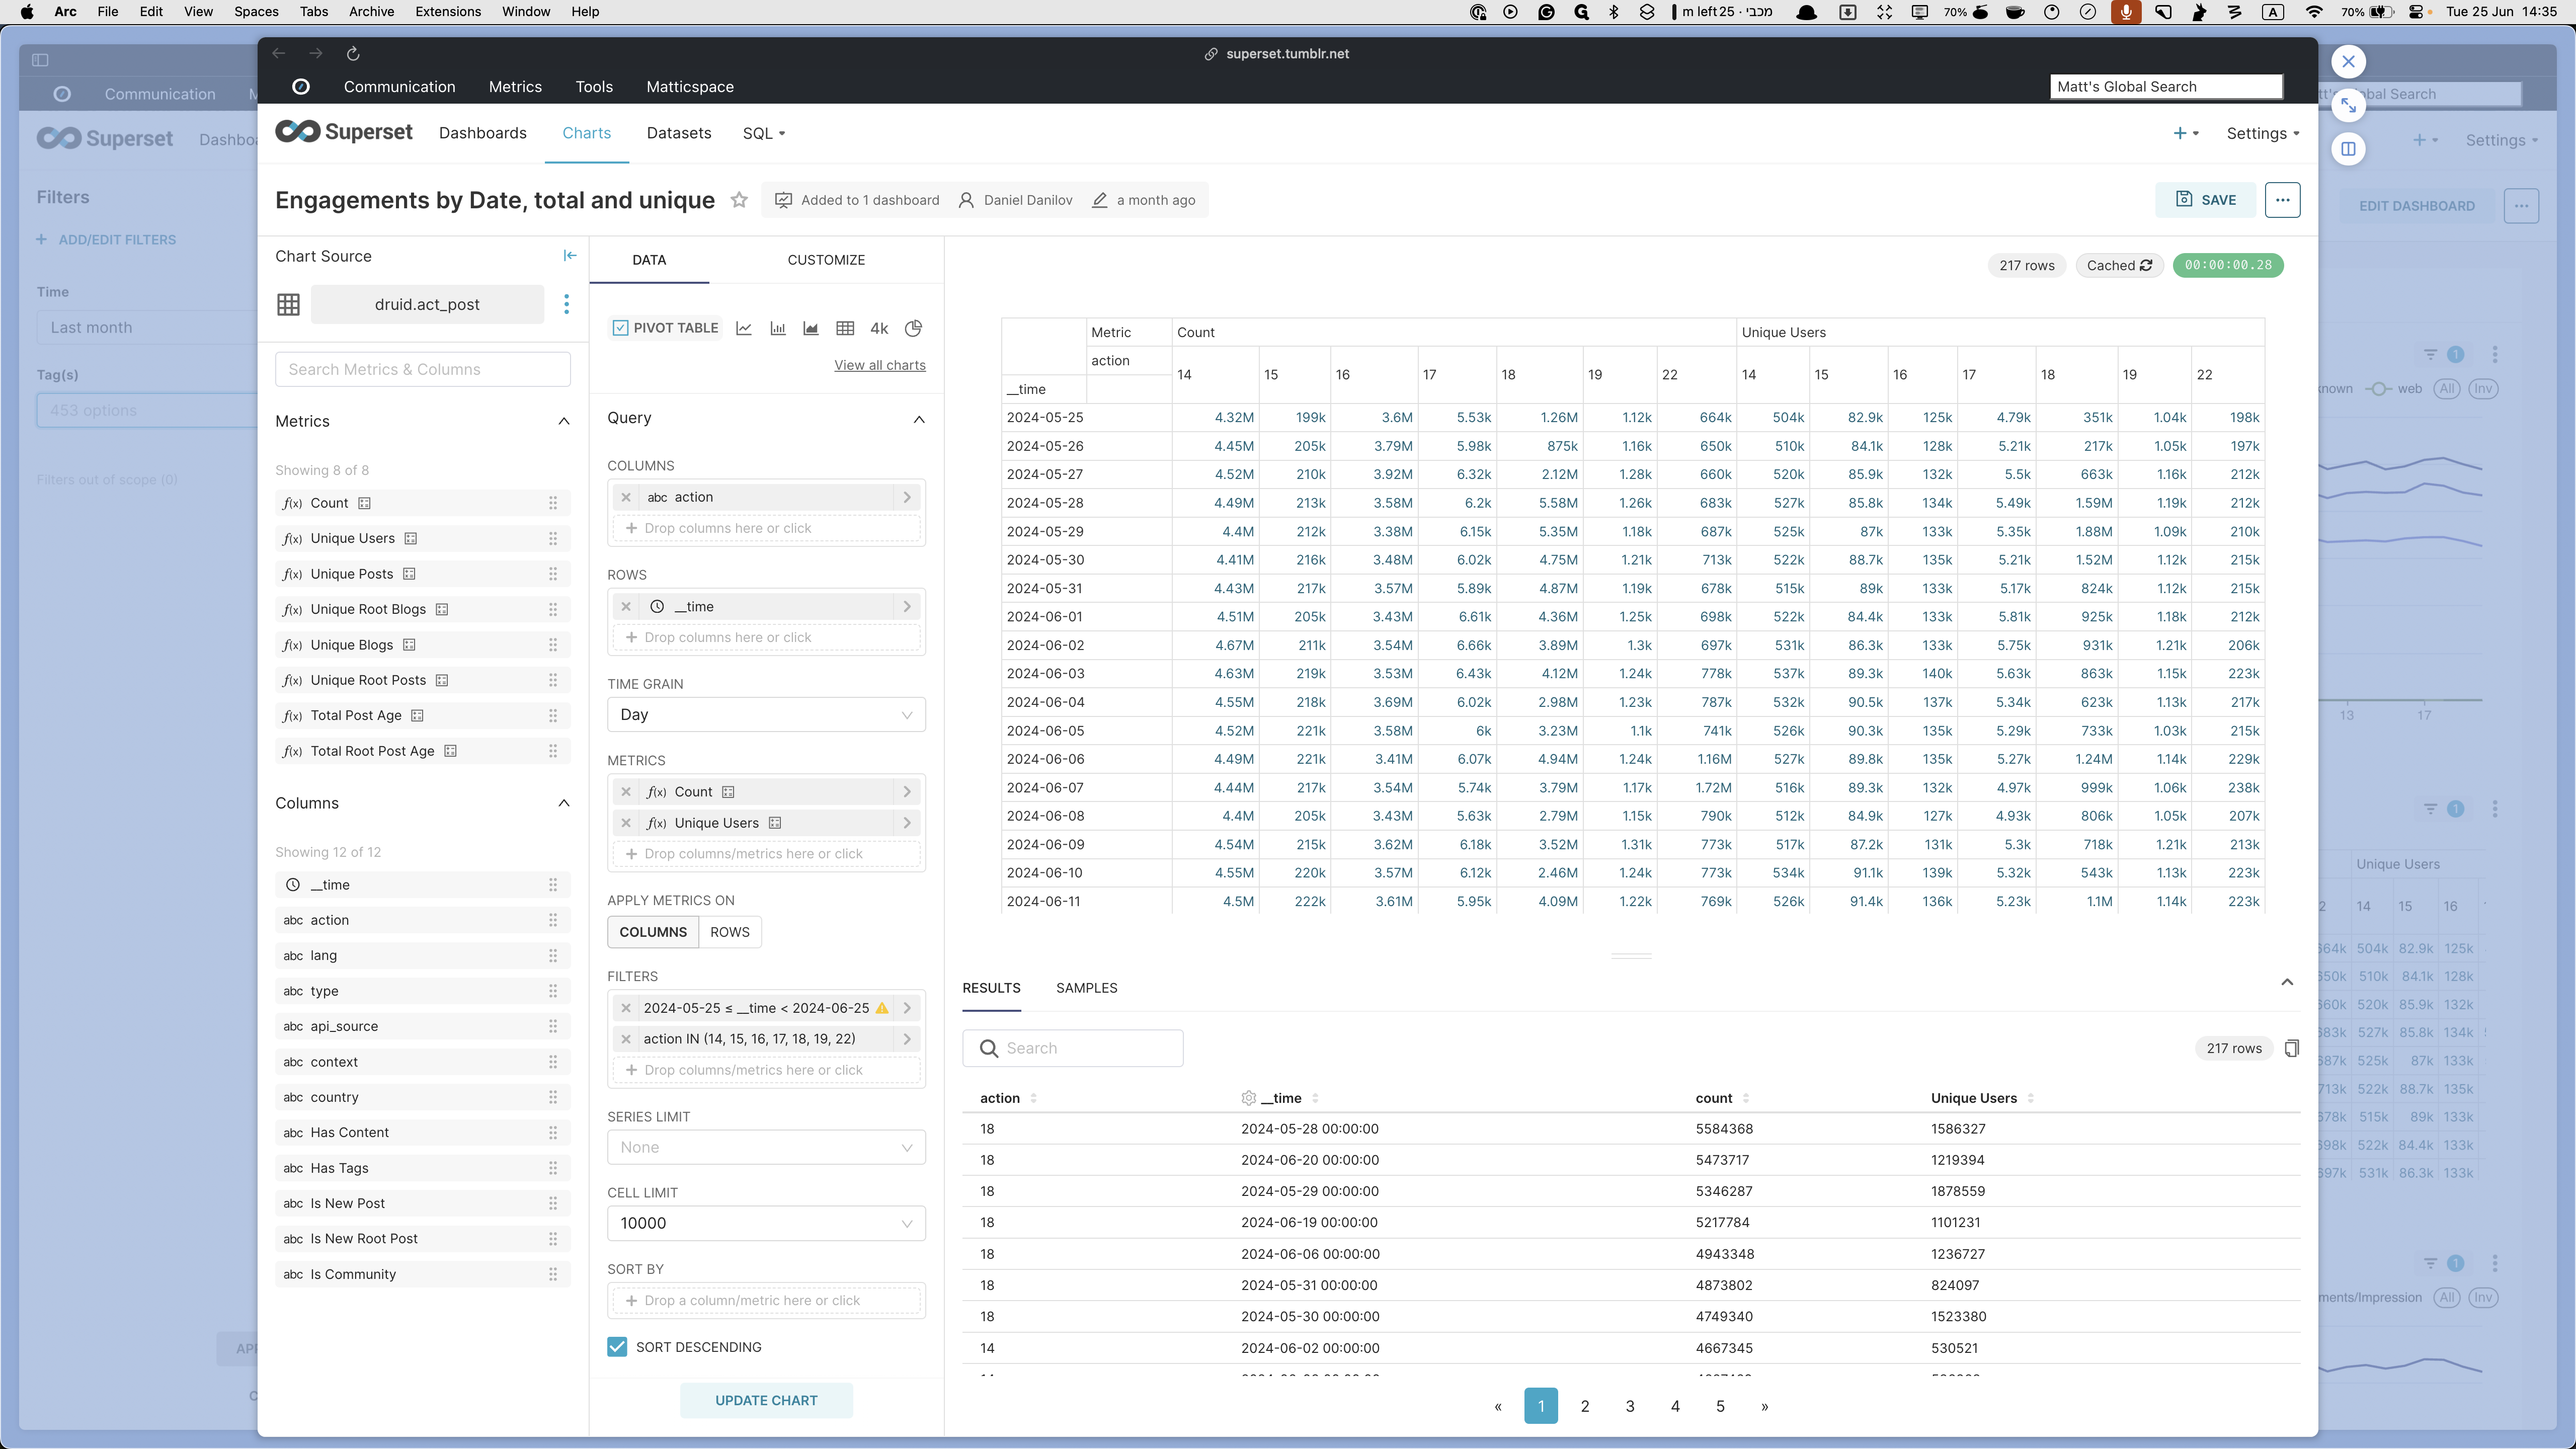
The actions are as follows: 14 is reblogging, 15 is replying to a post, 16 is editing a post, 17 is pinning a post, 18 is deleting a post, 19 is unpinning a post, 22 is creating a new post.
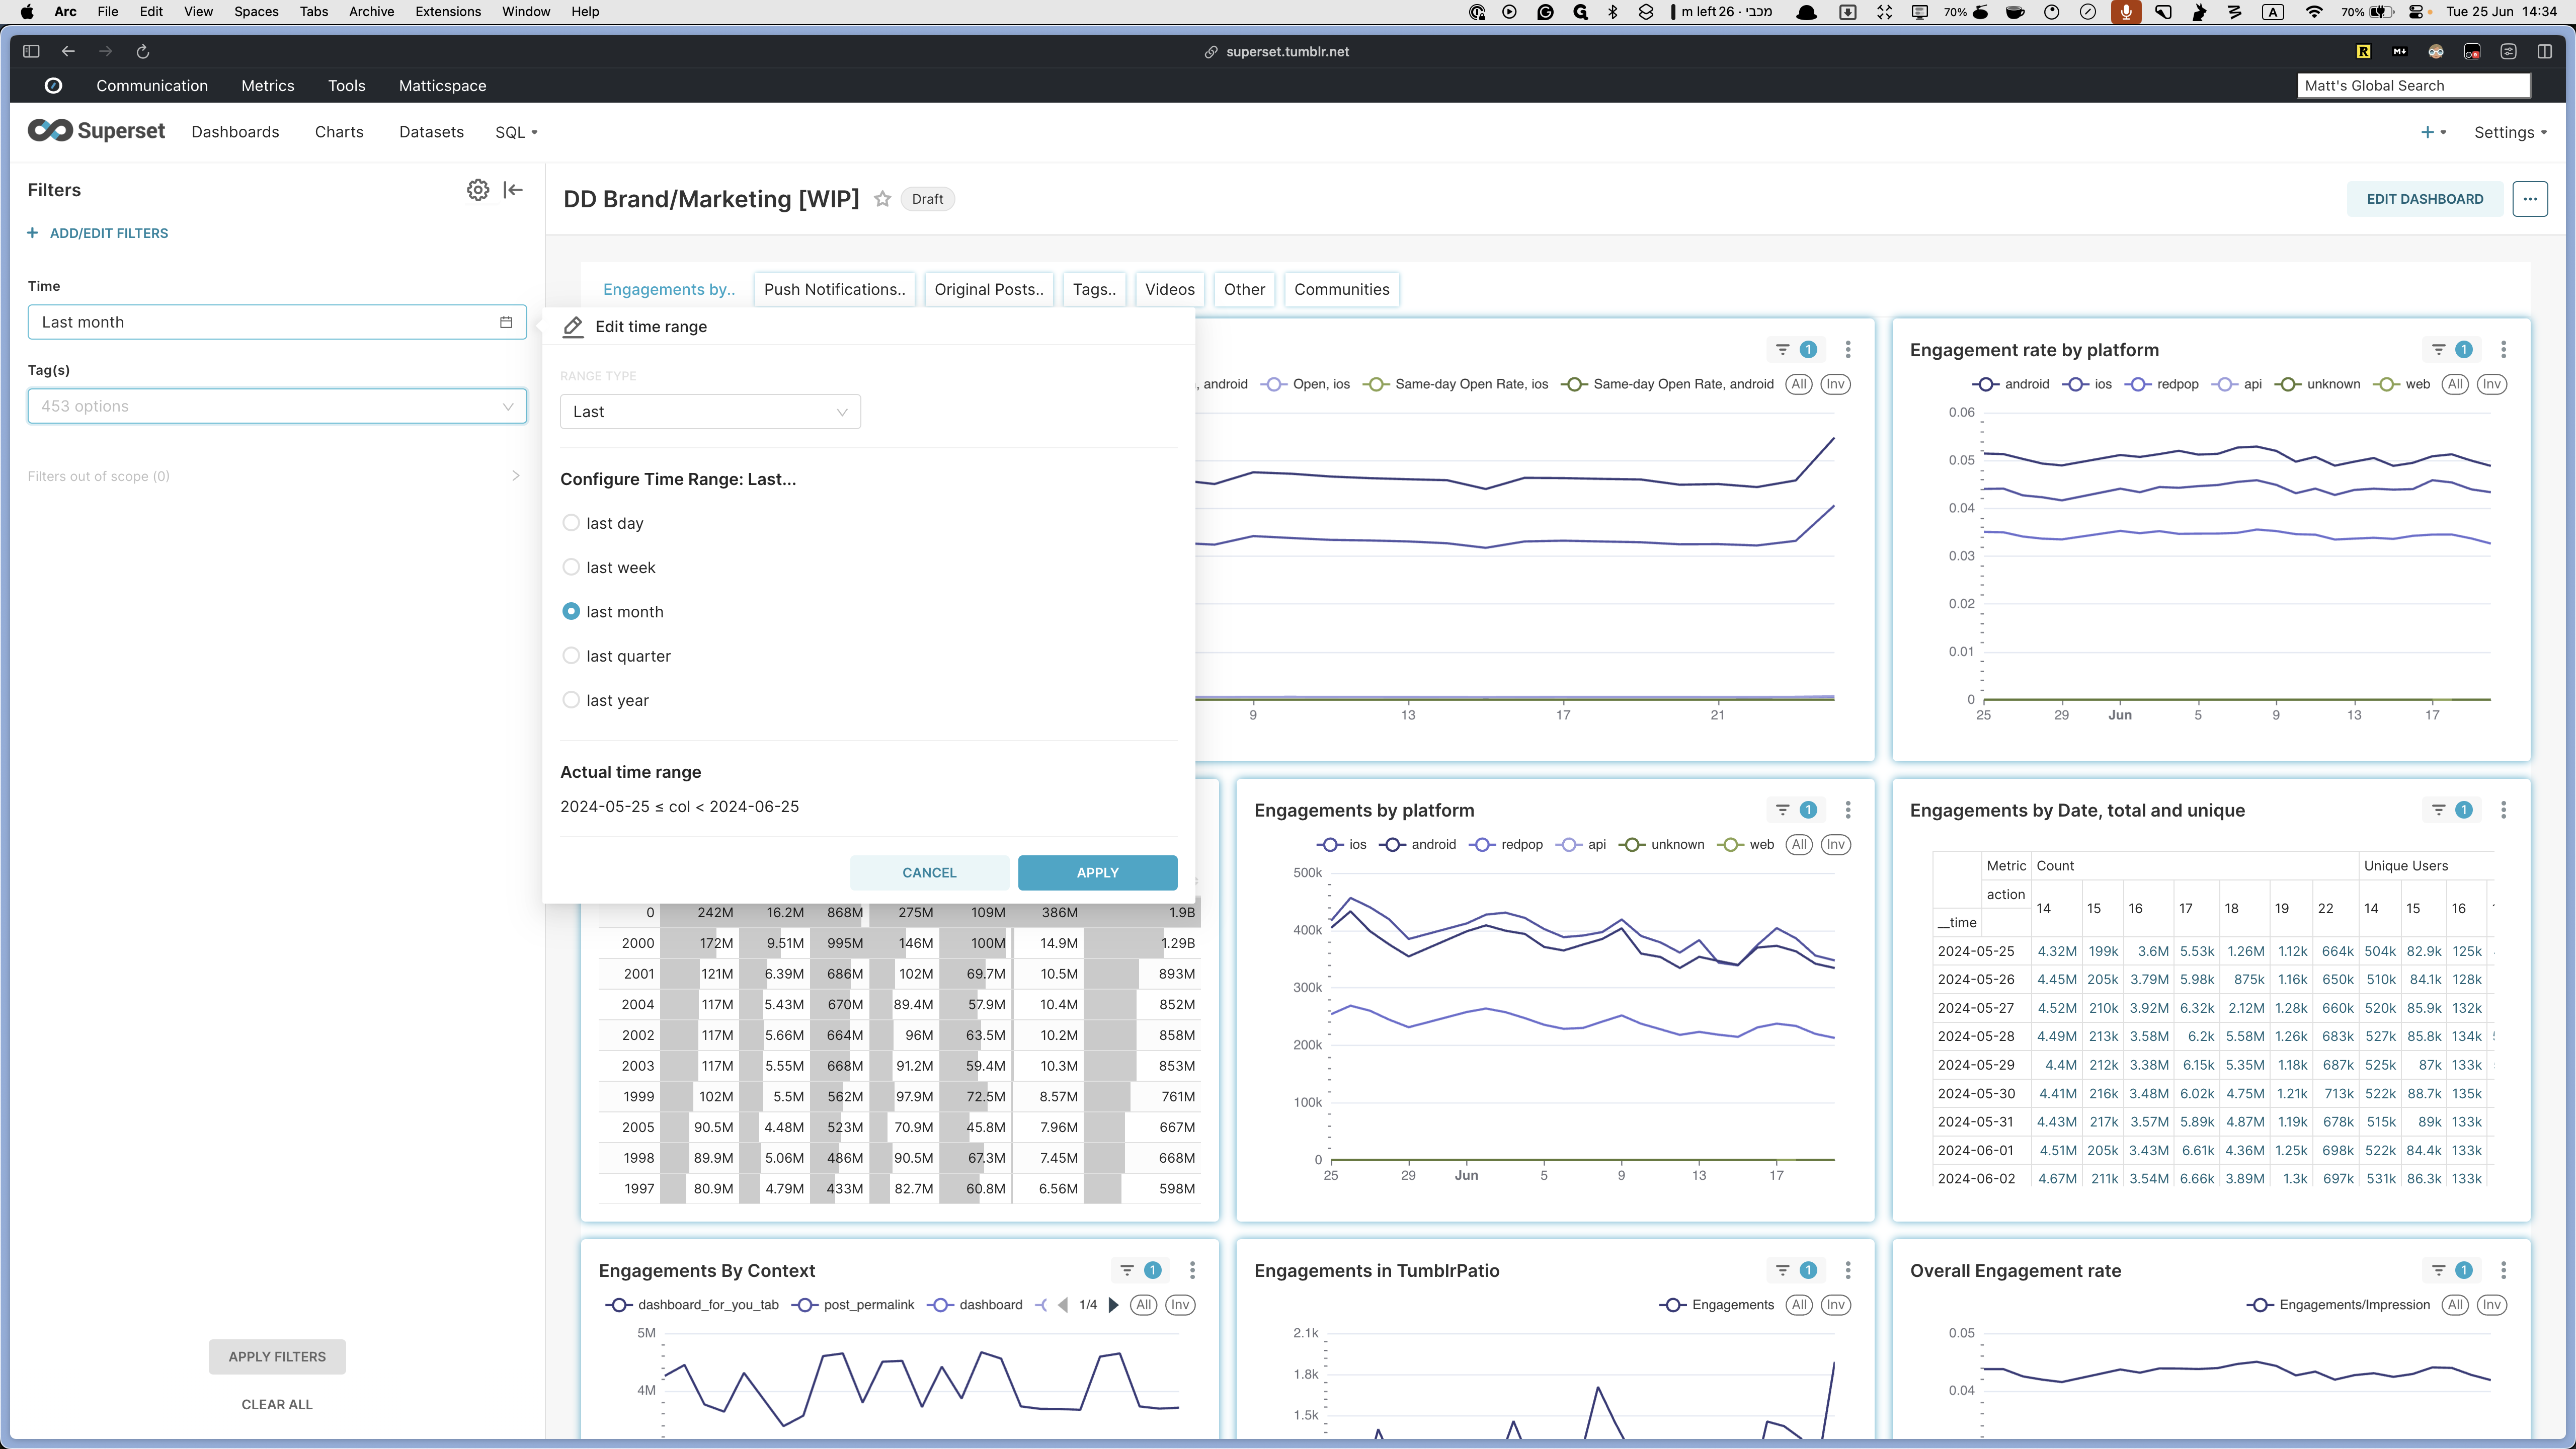
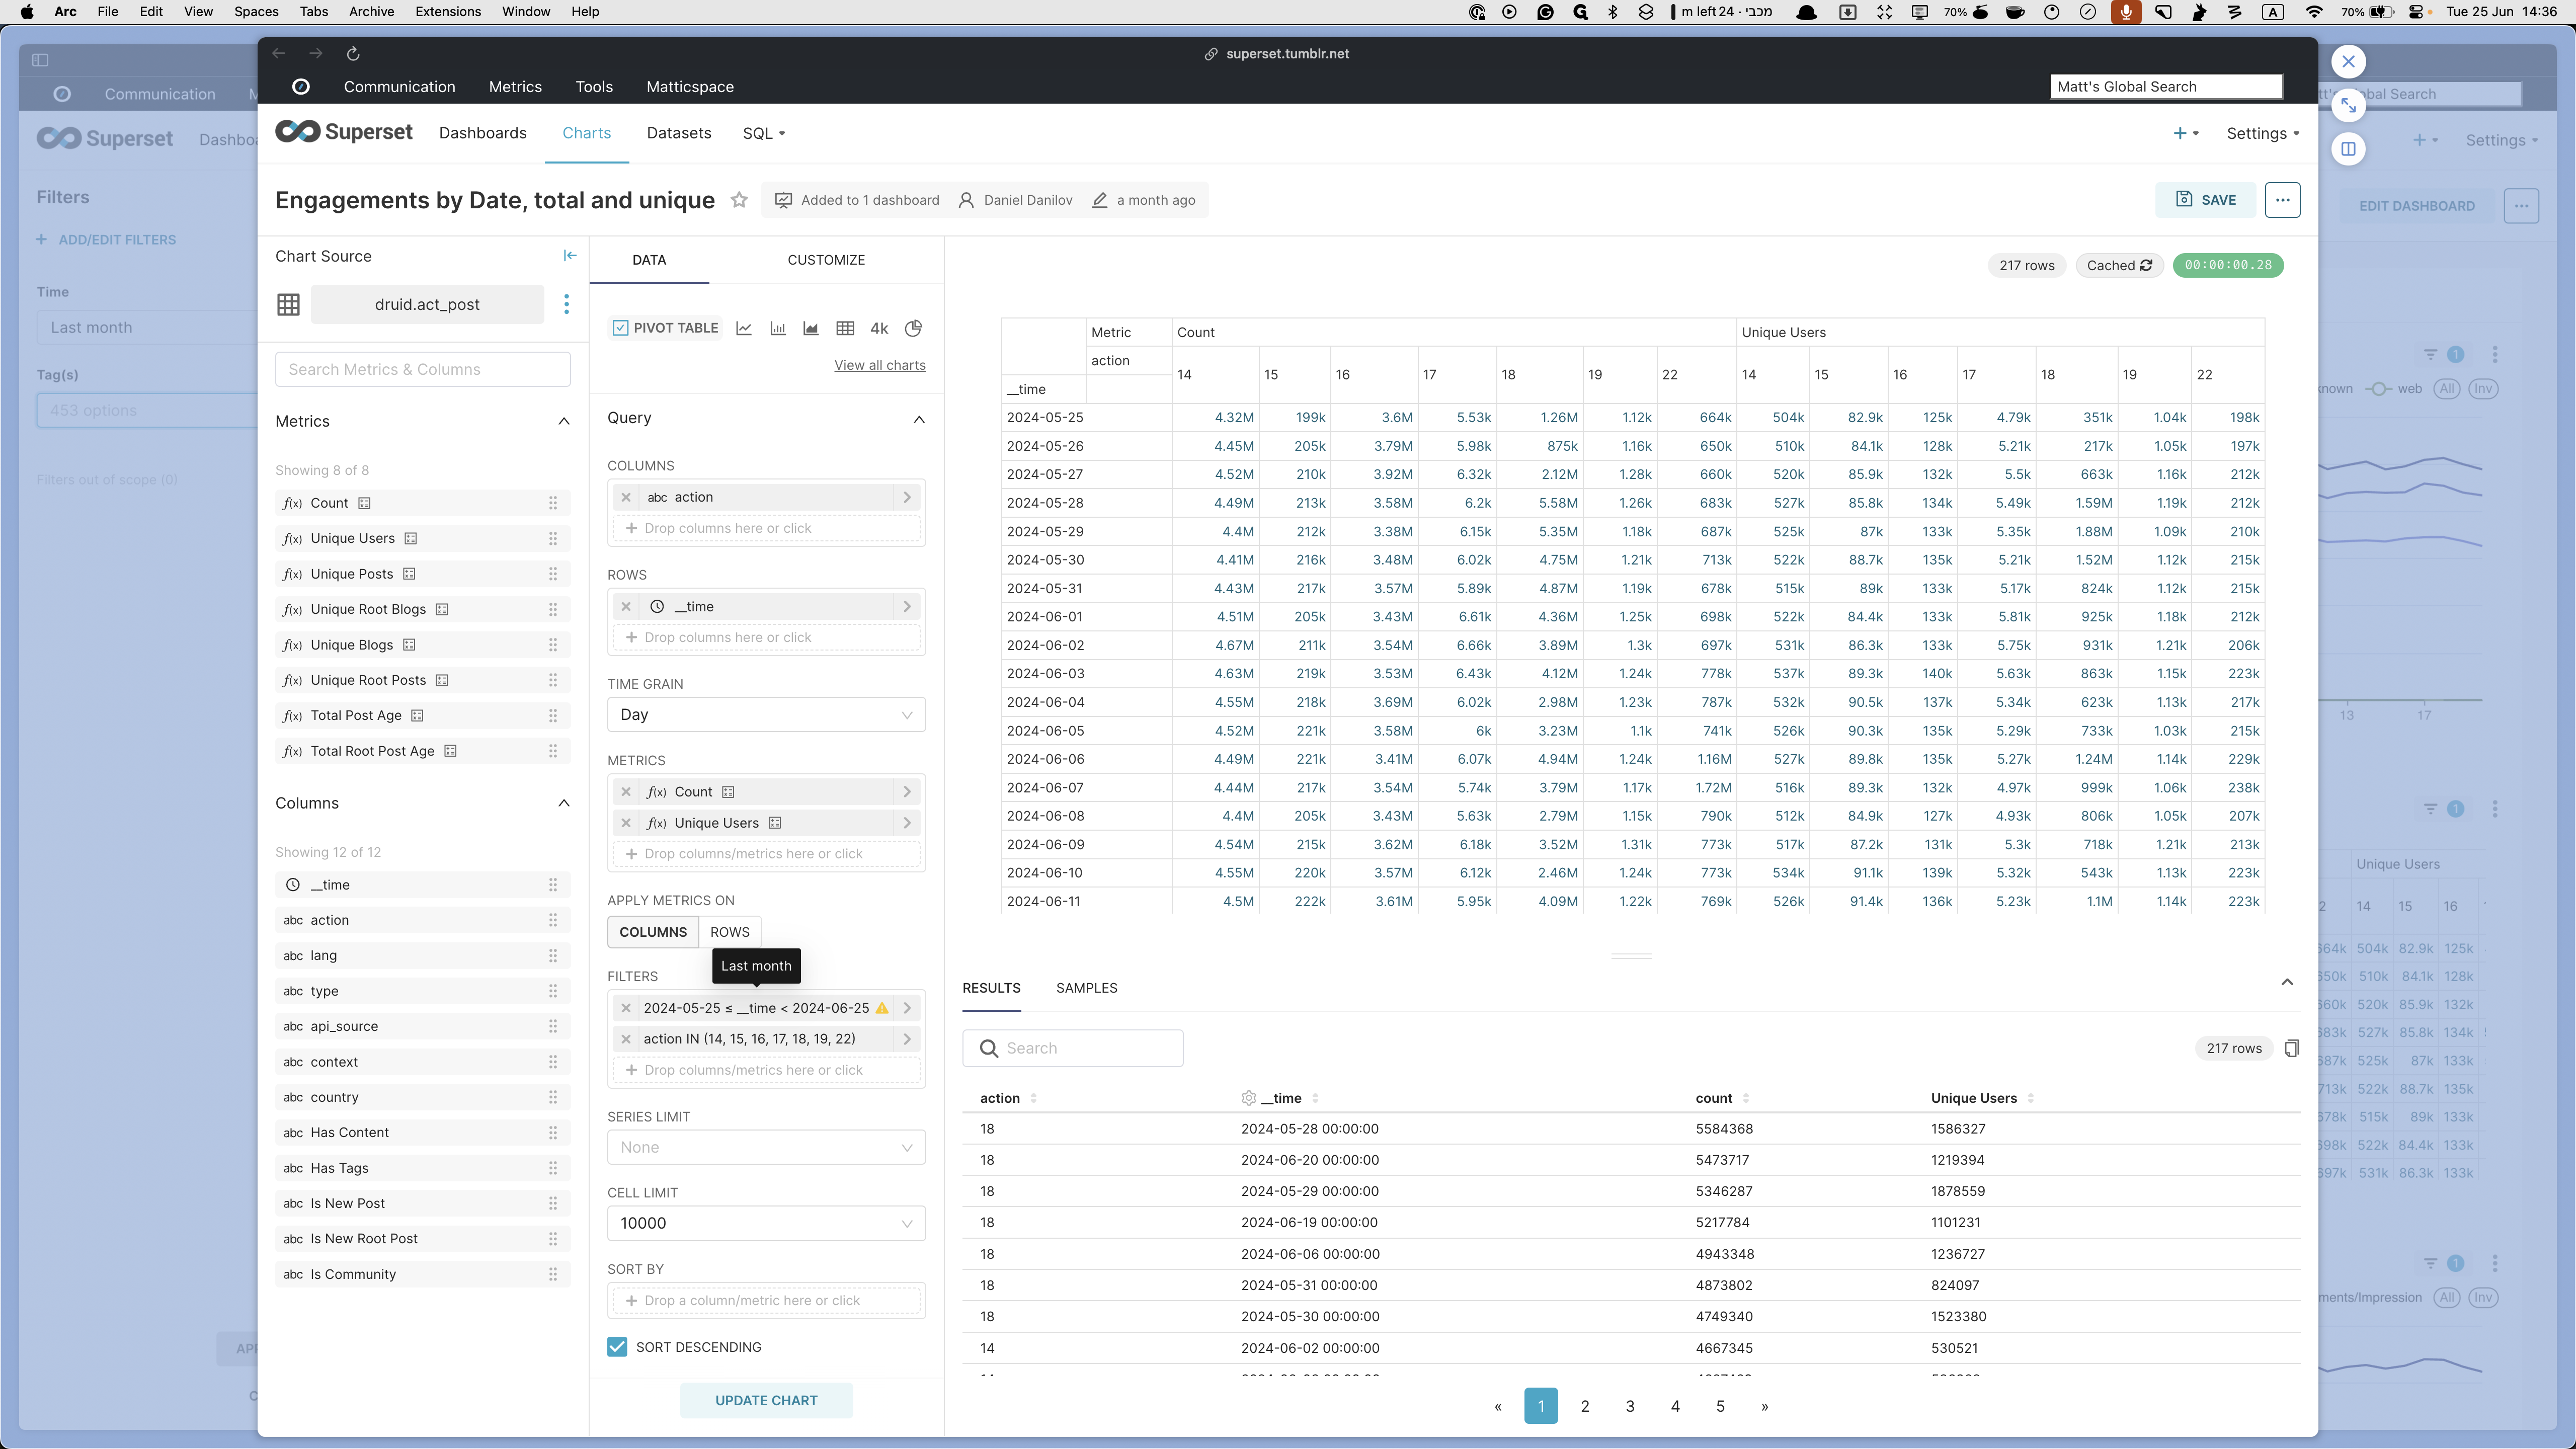
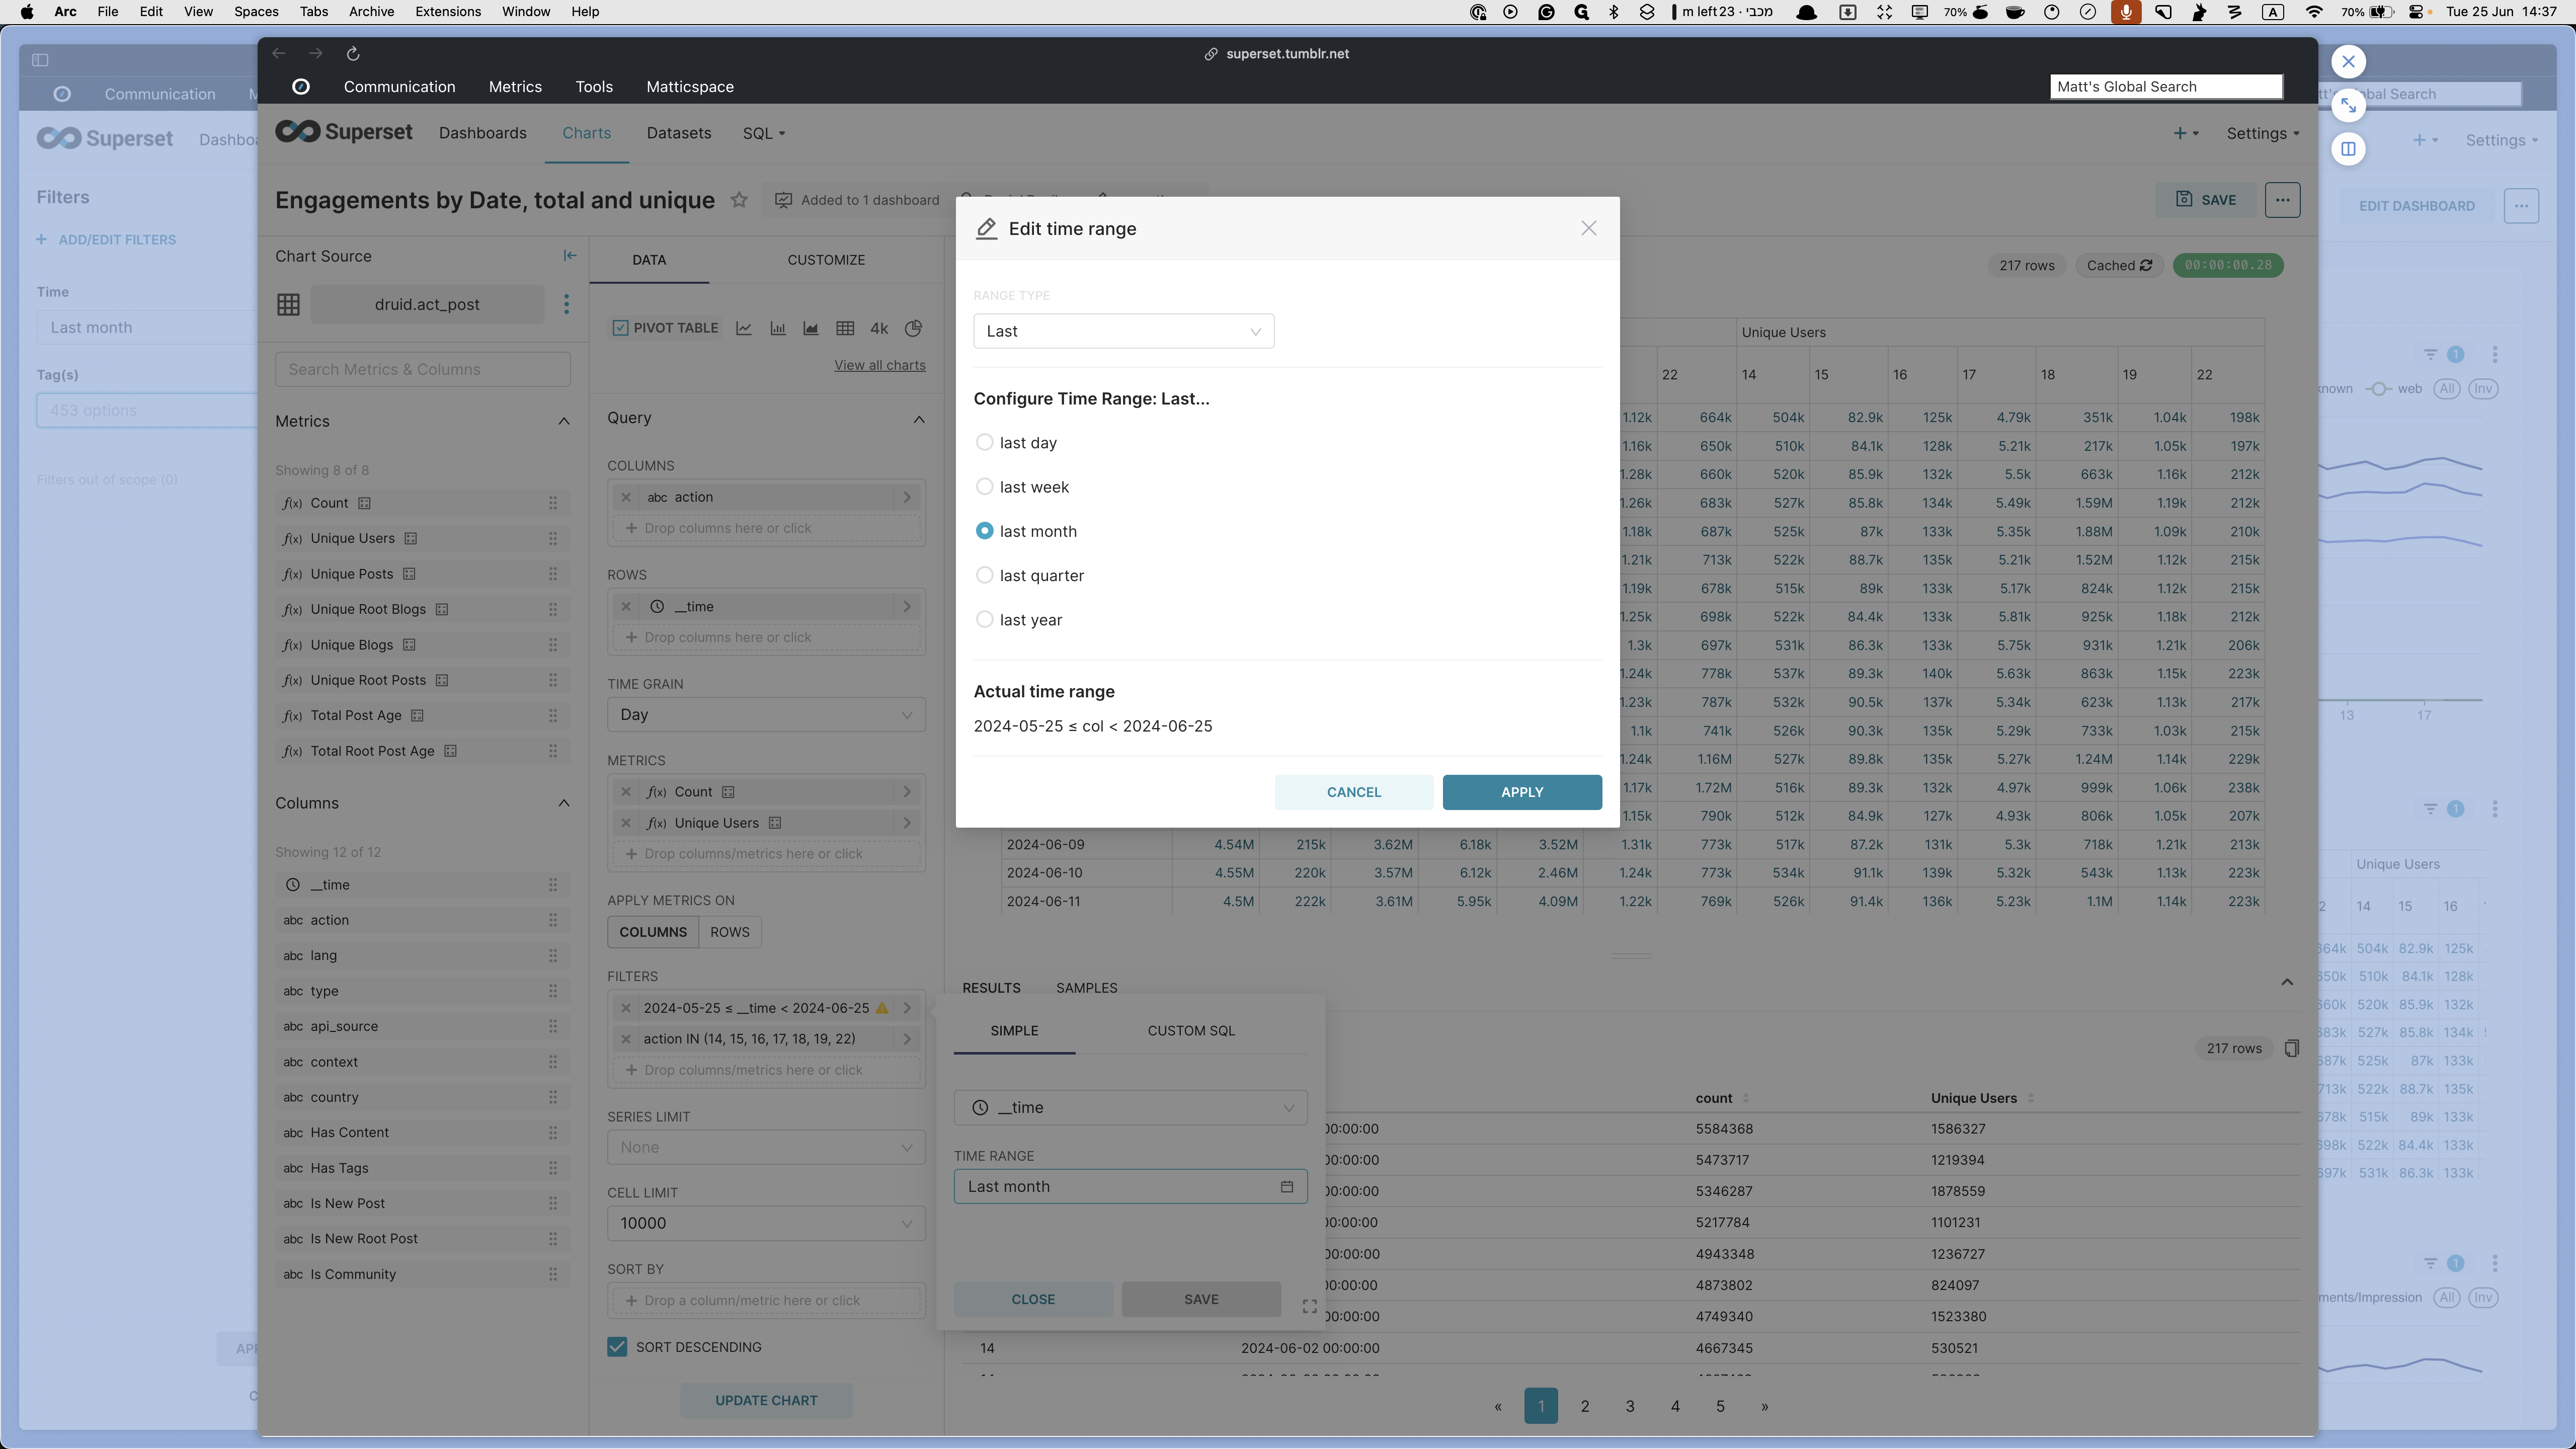
Here, you will see a total breakdown of each action for each day. If necessary, you can customize the time range by going into filters, clicking on the time, and adjusting it as needed.
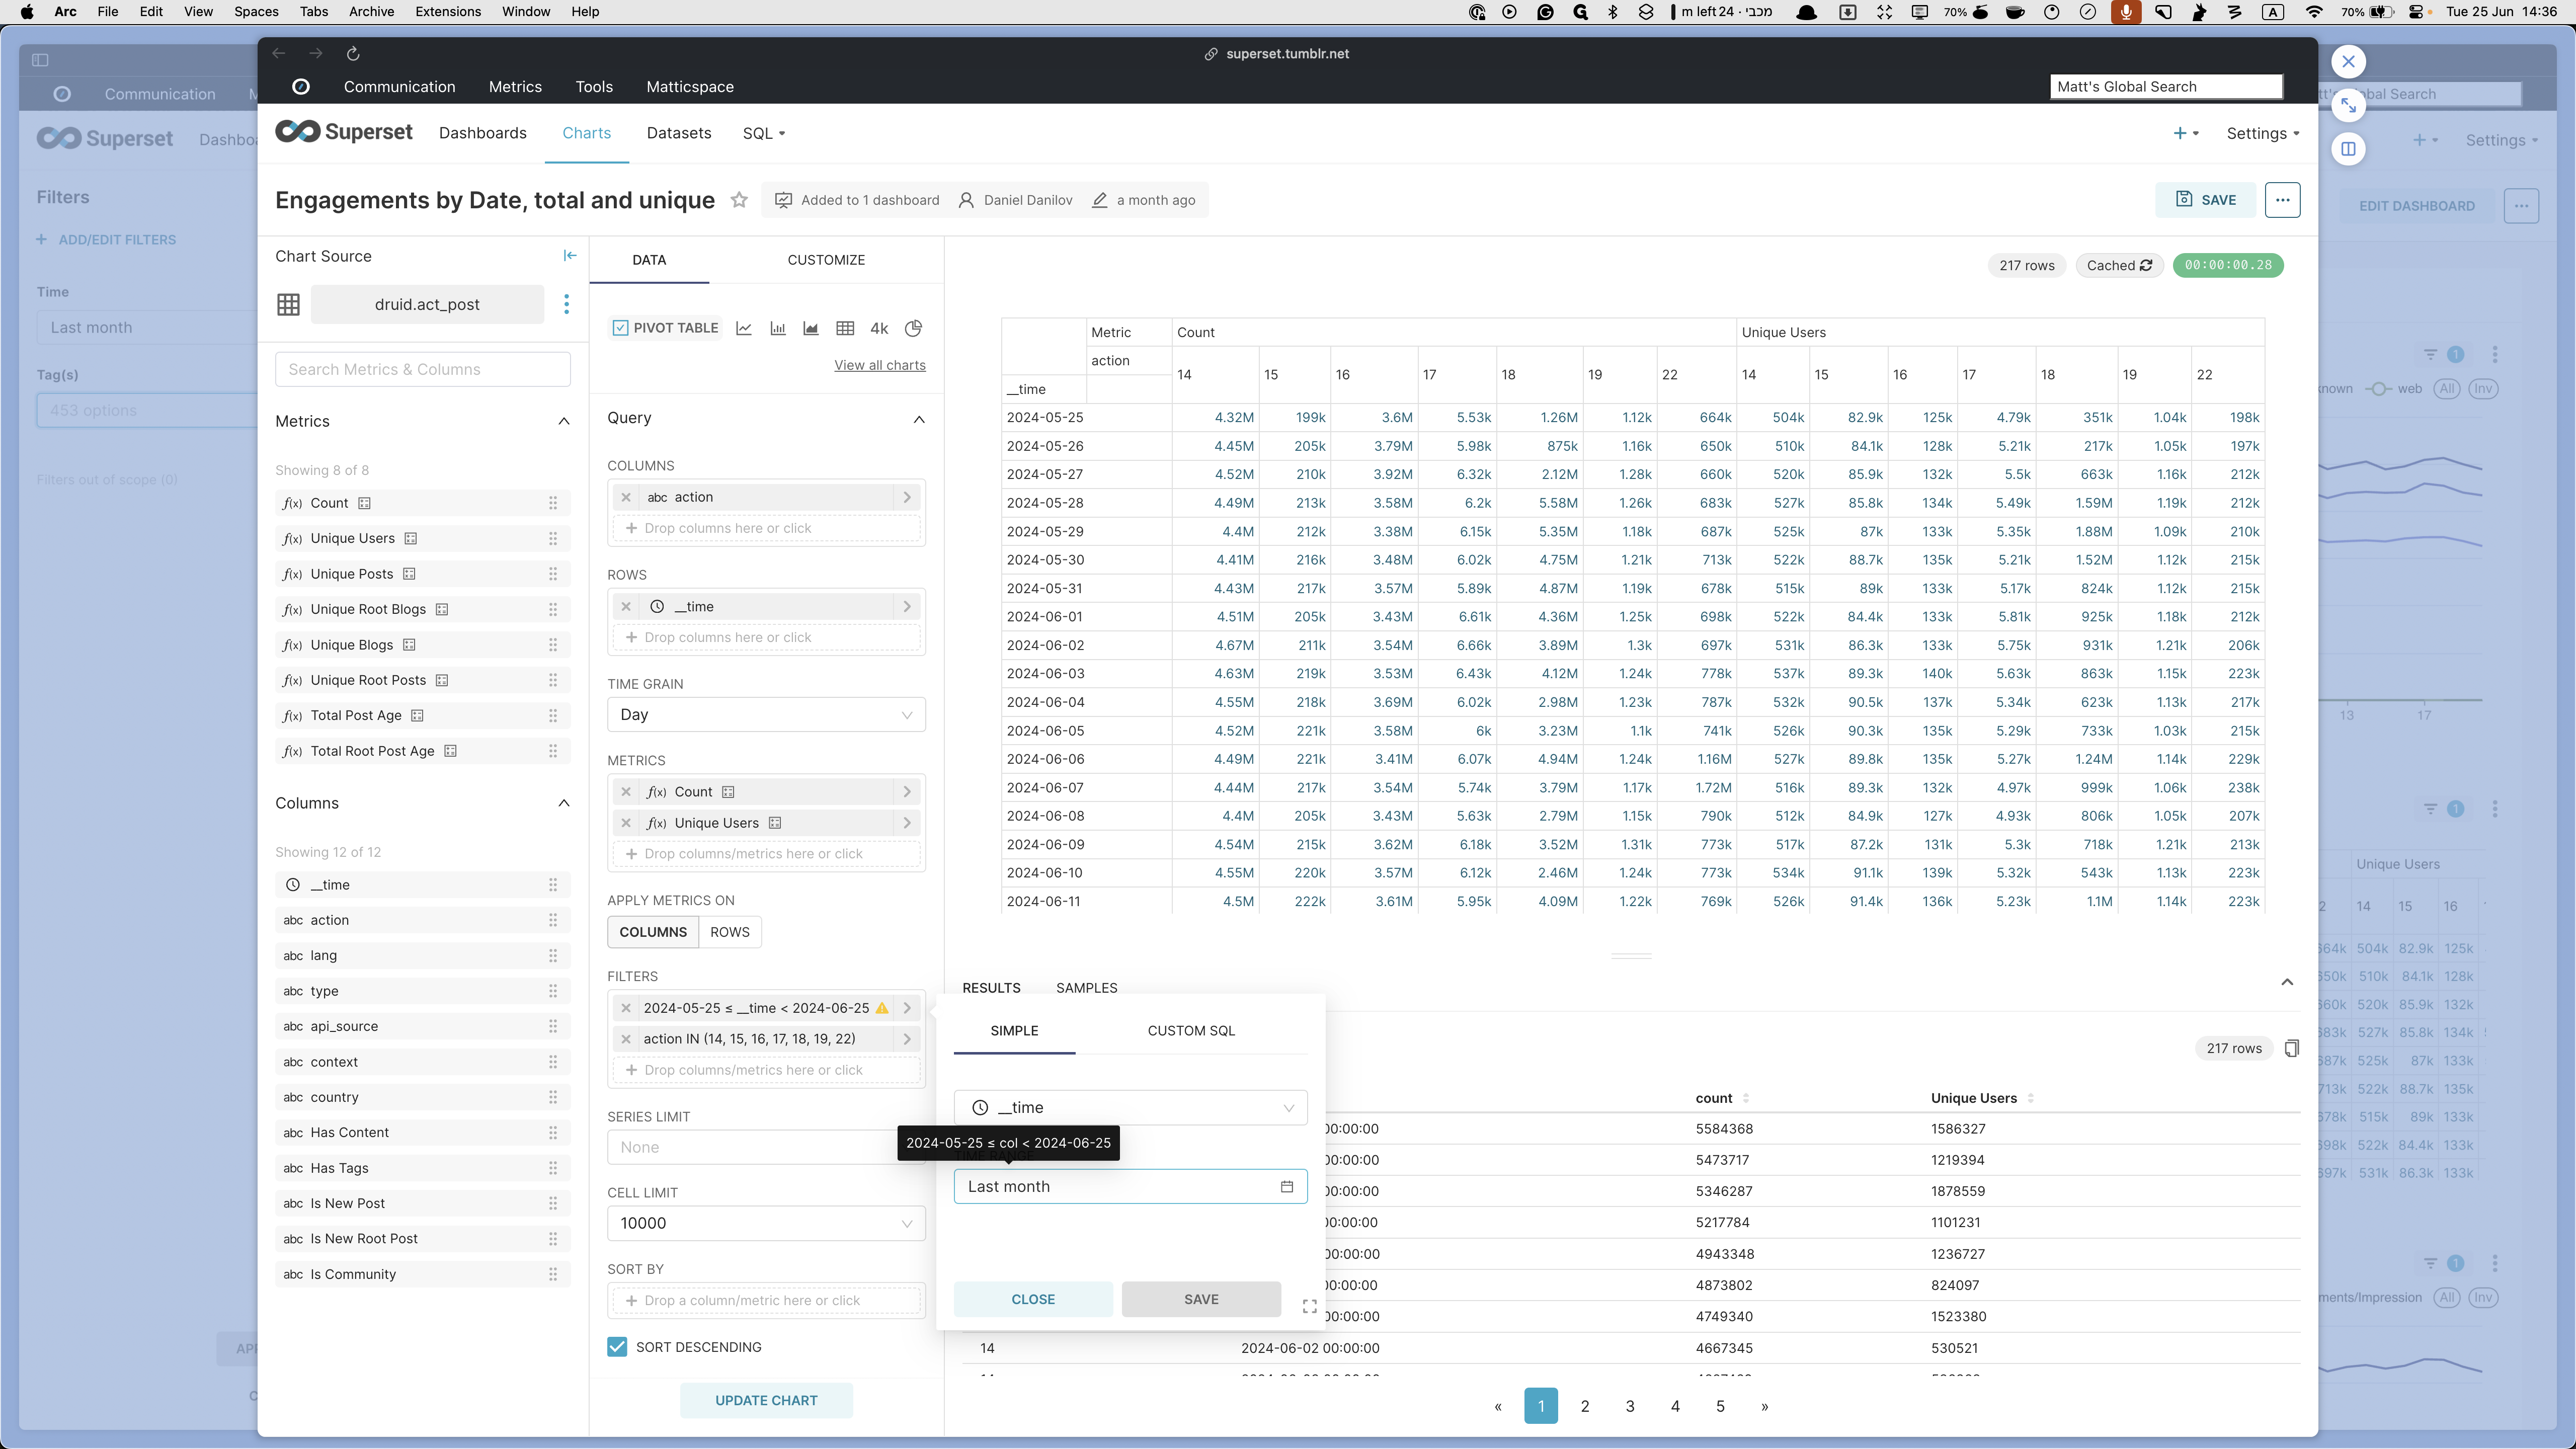
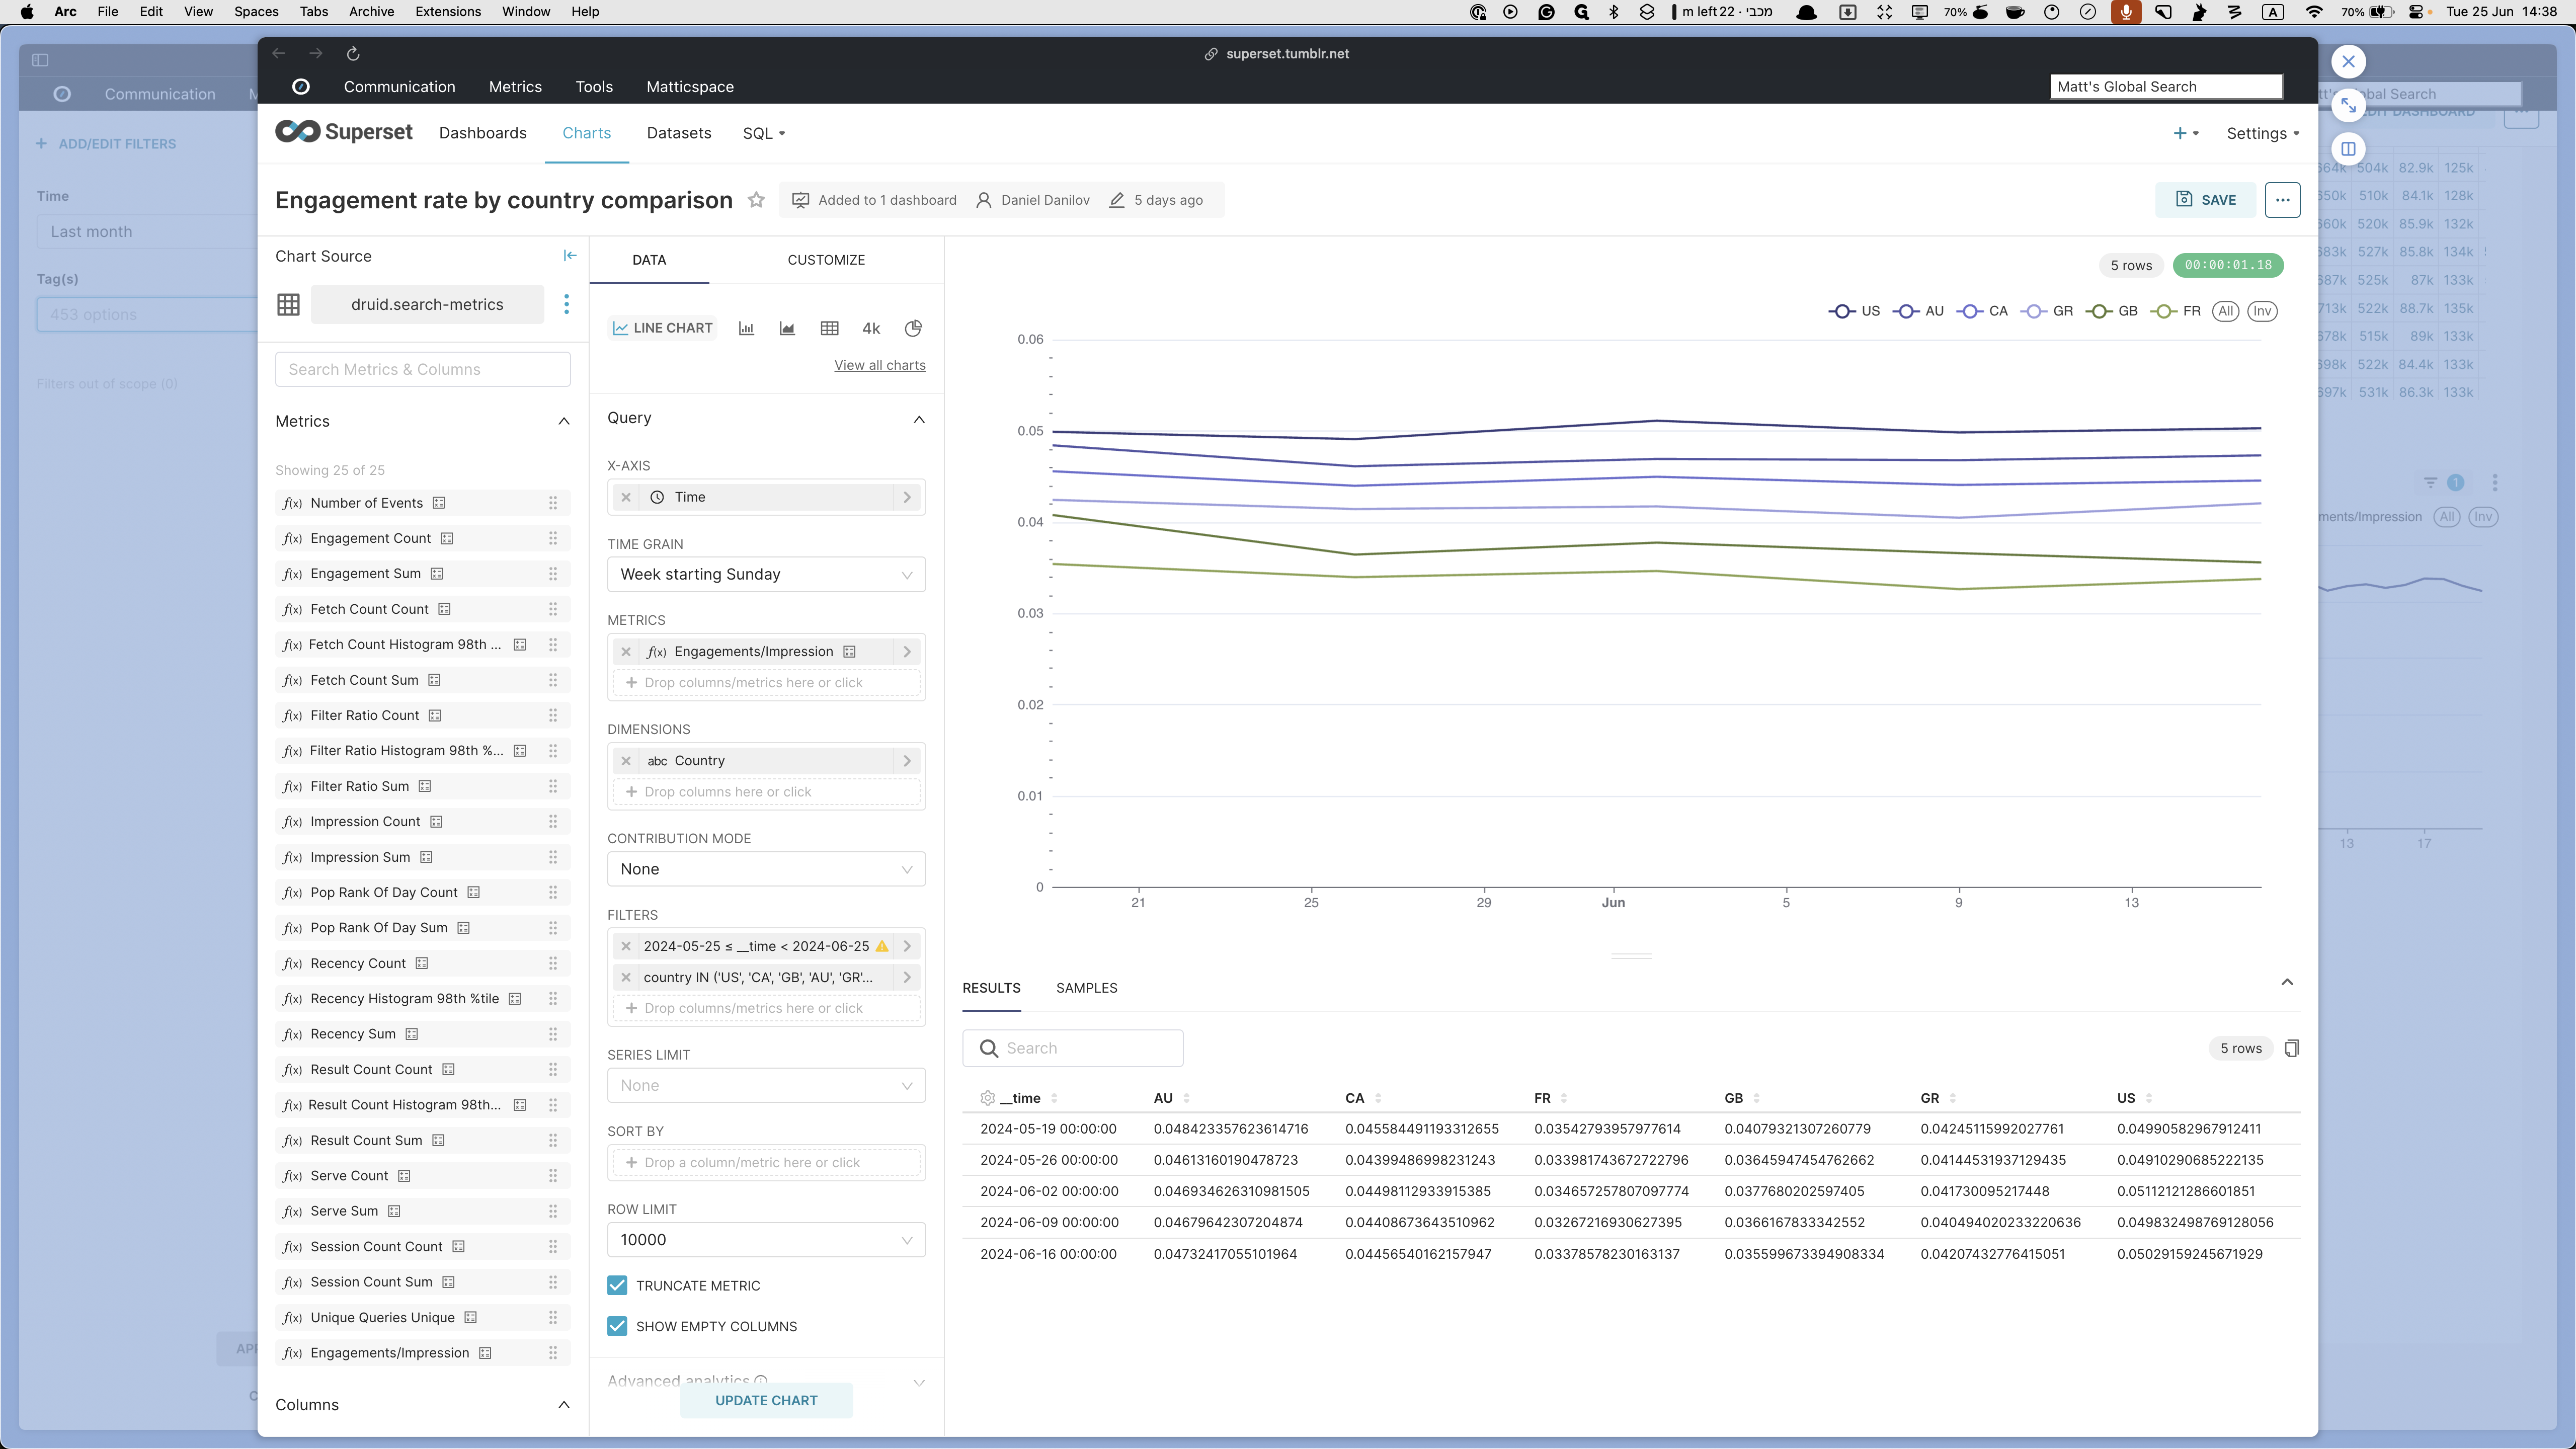
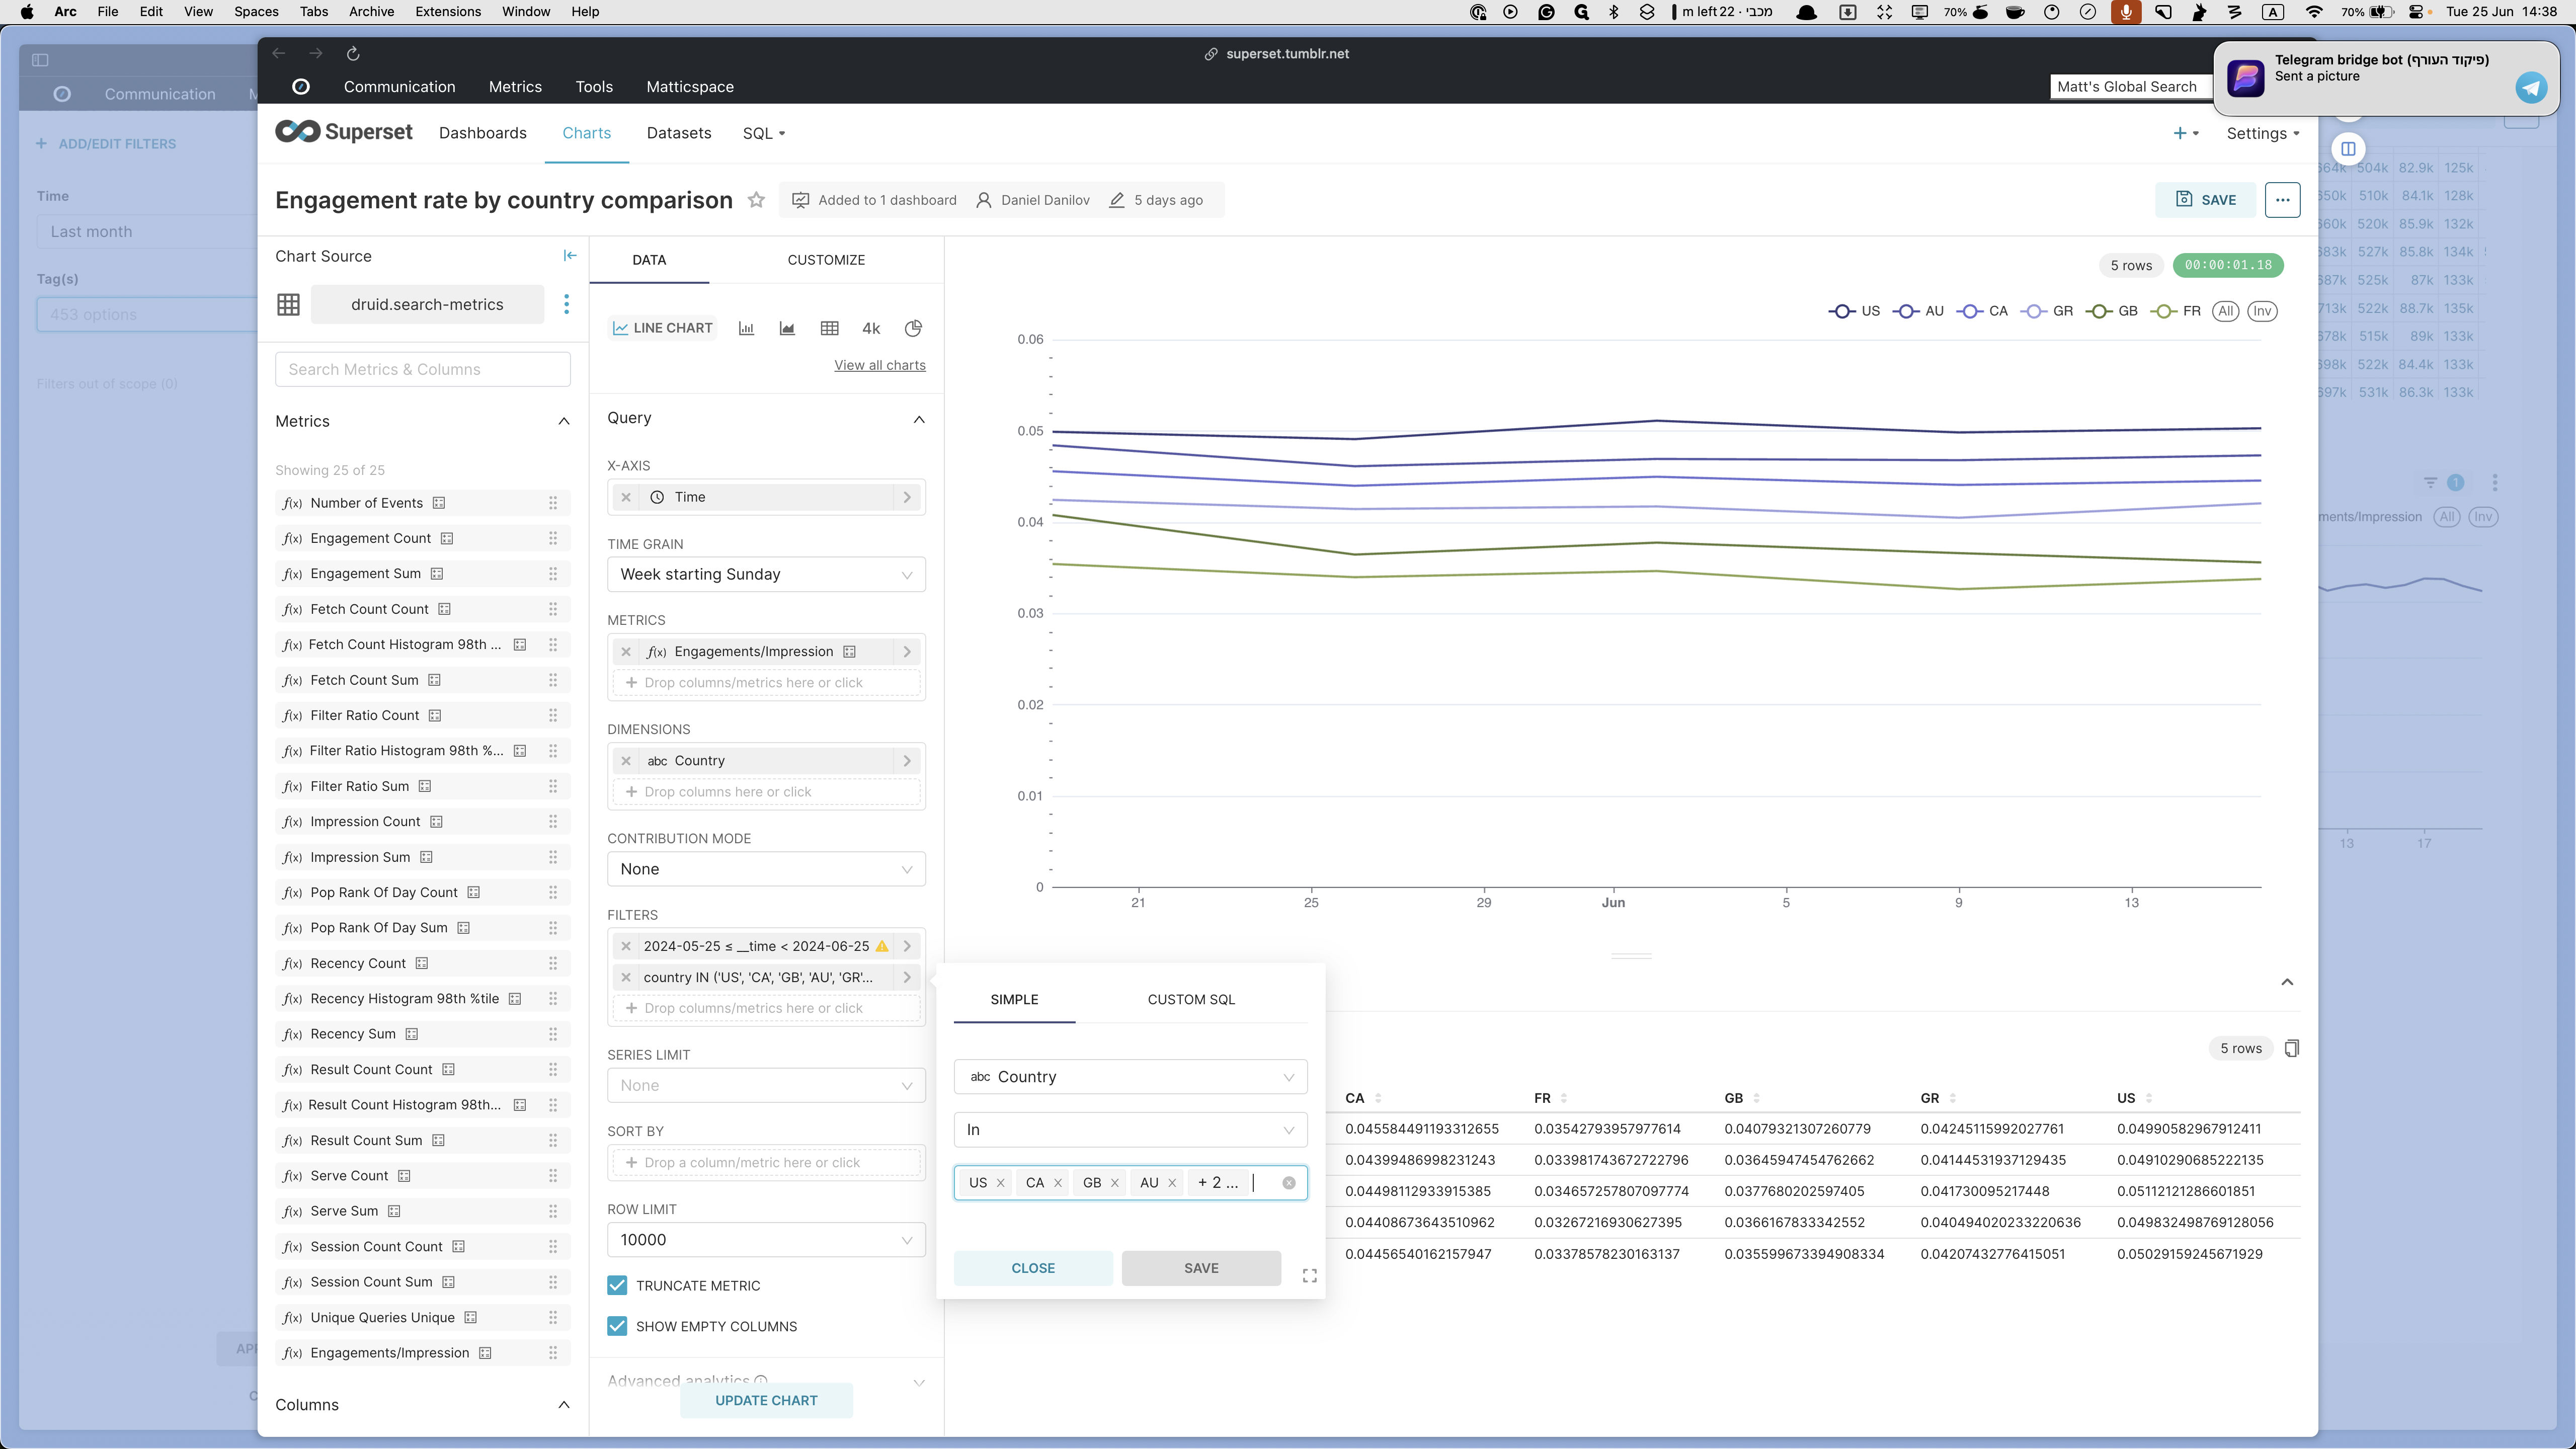
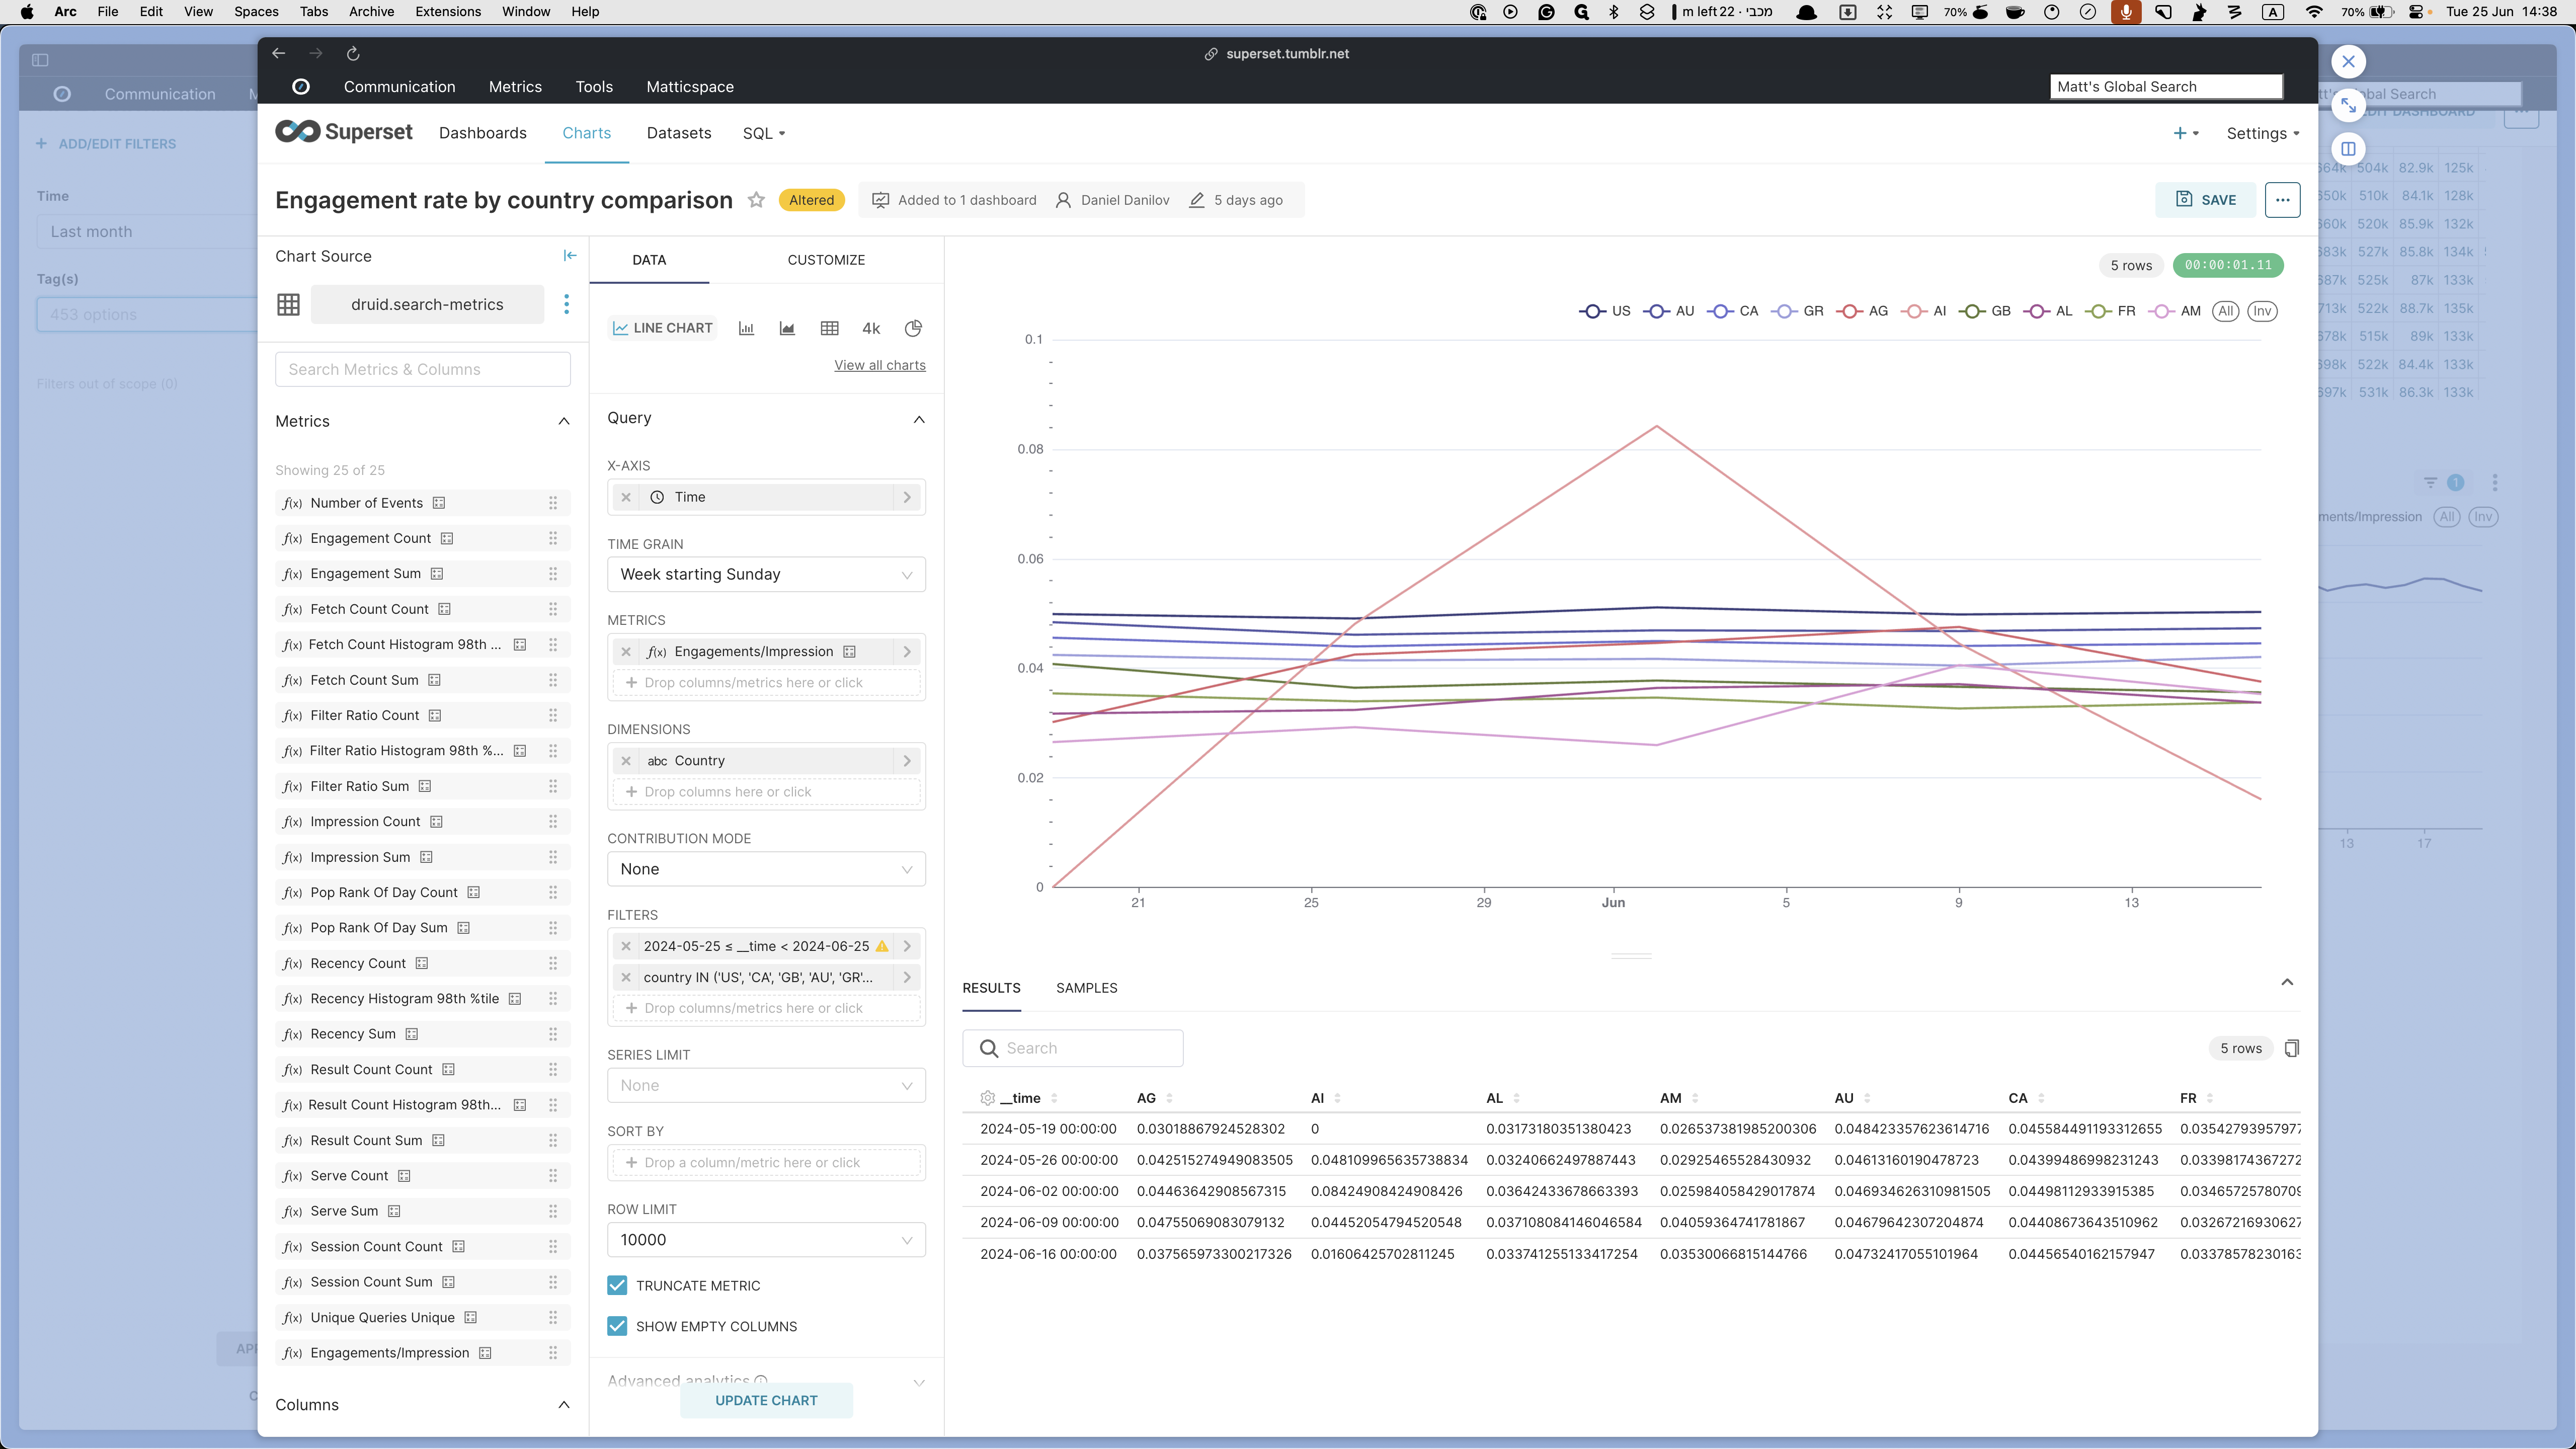
Once you've selected the desired time range, click "Apply" and "Update Chart" to refresh the data. For another example, let's compare engagement rates by country. Click on this option to choose the countries you want to view. Go to the filters, select "Country," and add the countries of interest. Select a few, click "Save," and then "Update Chart." The new engagement rates for each country will appear in the line view at the top and in the results at the bottom. These results can be exported or copied if needed.
Here, too, you can open up any individual chart for additional control. Let's open one up as an example.
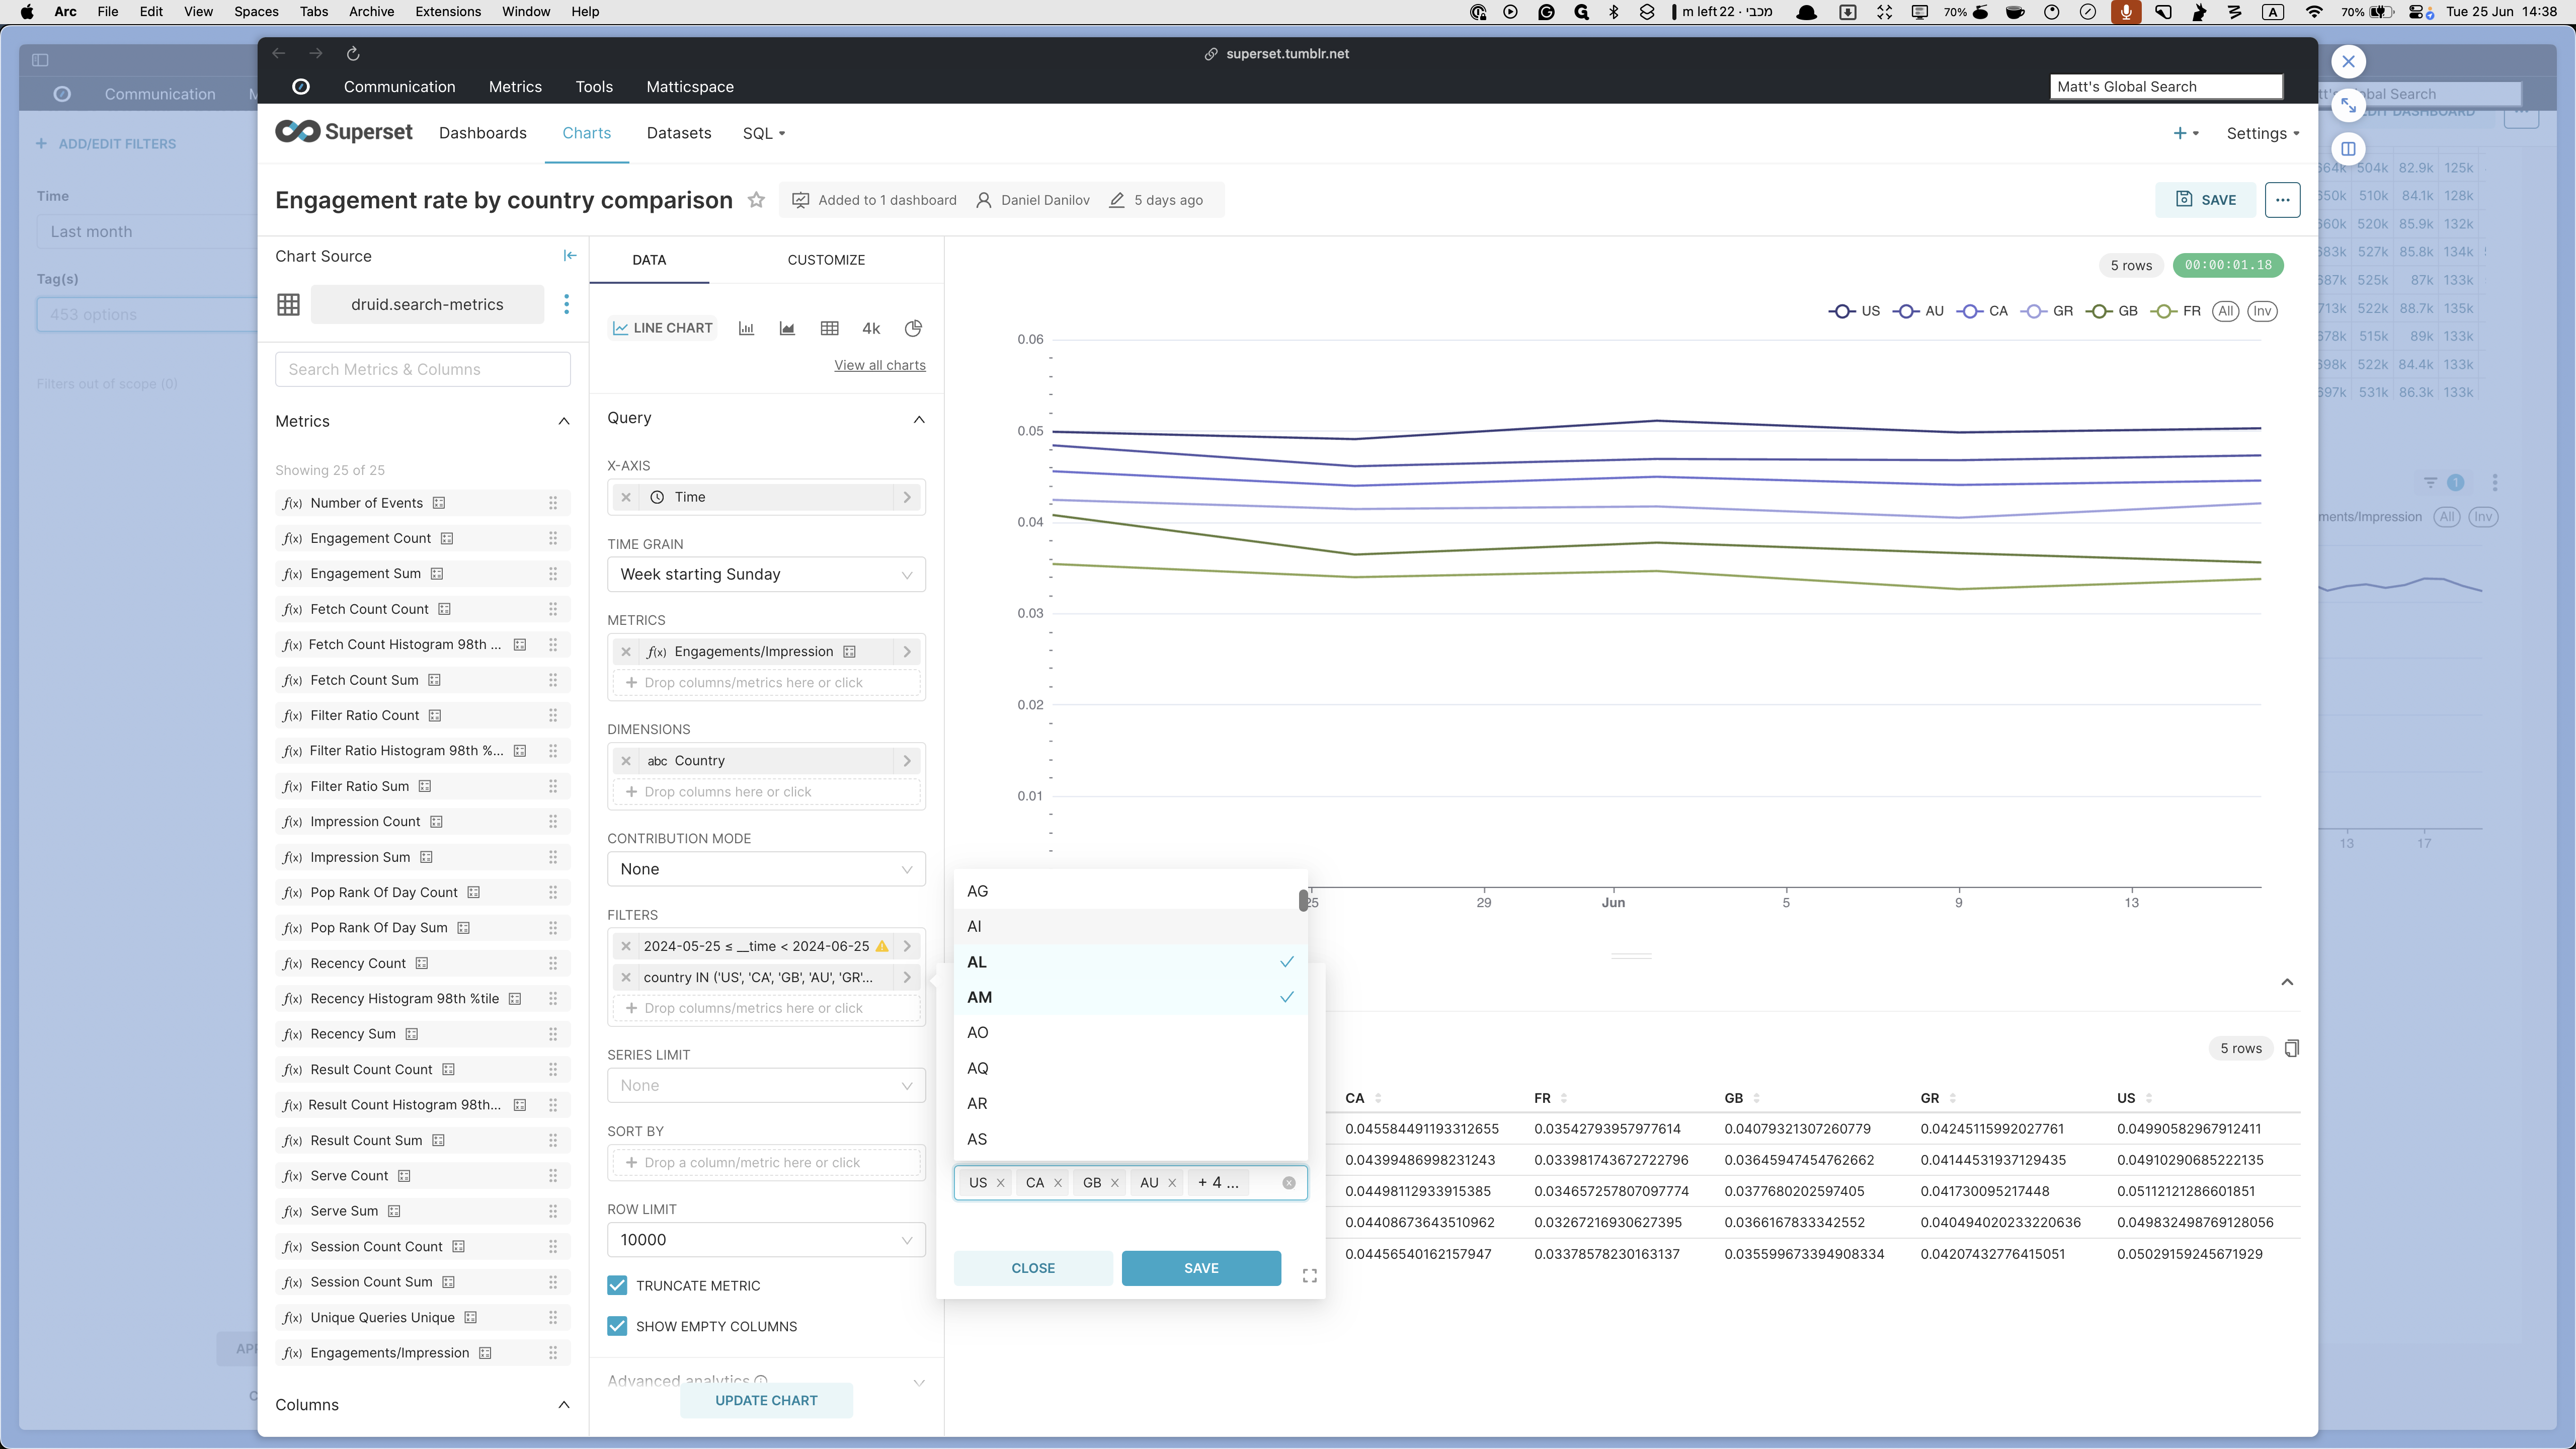
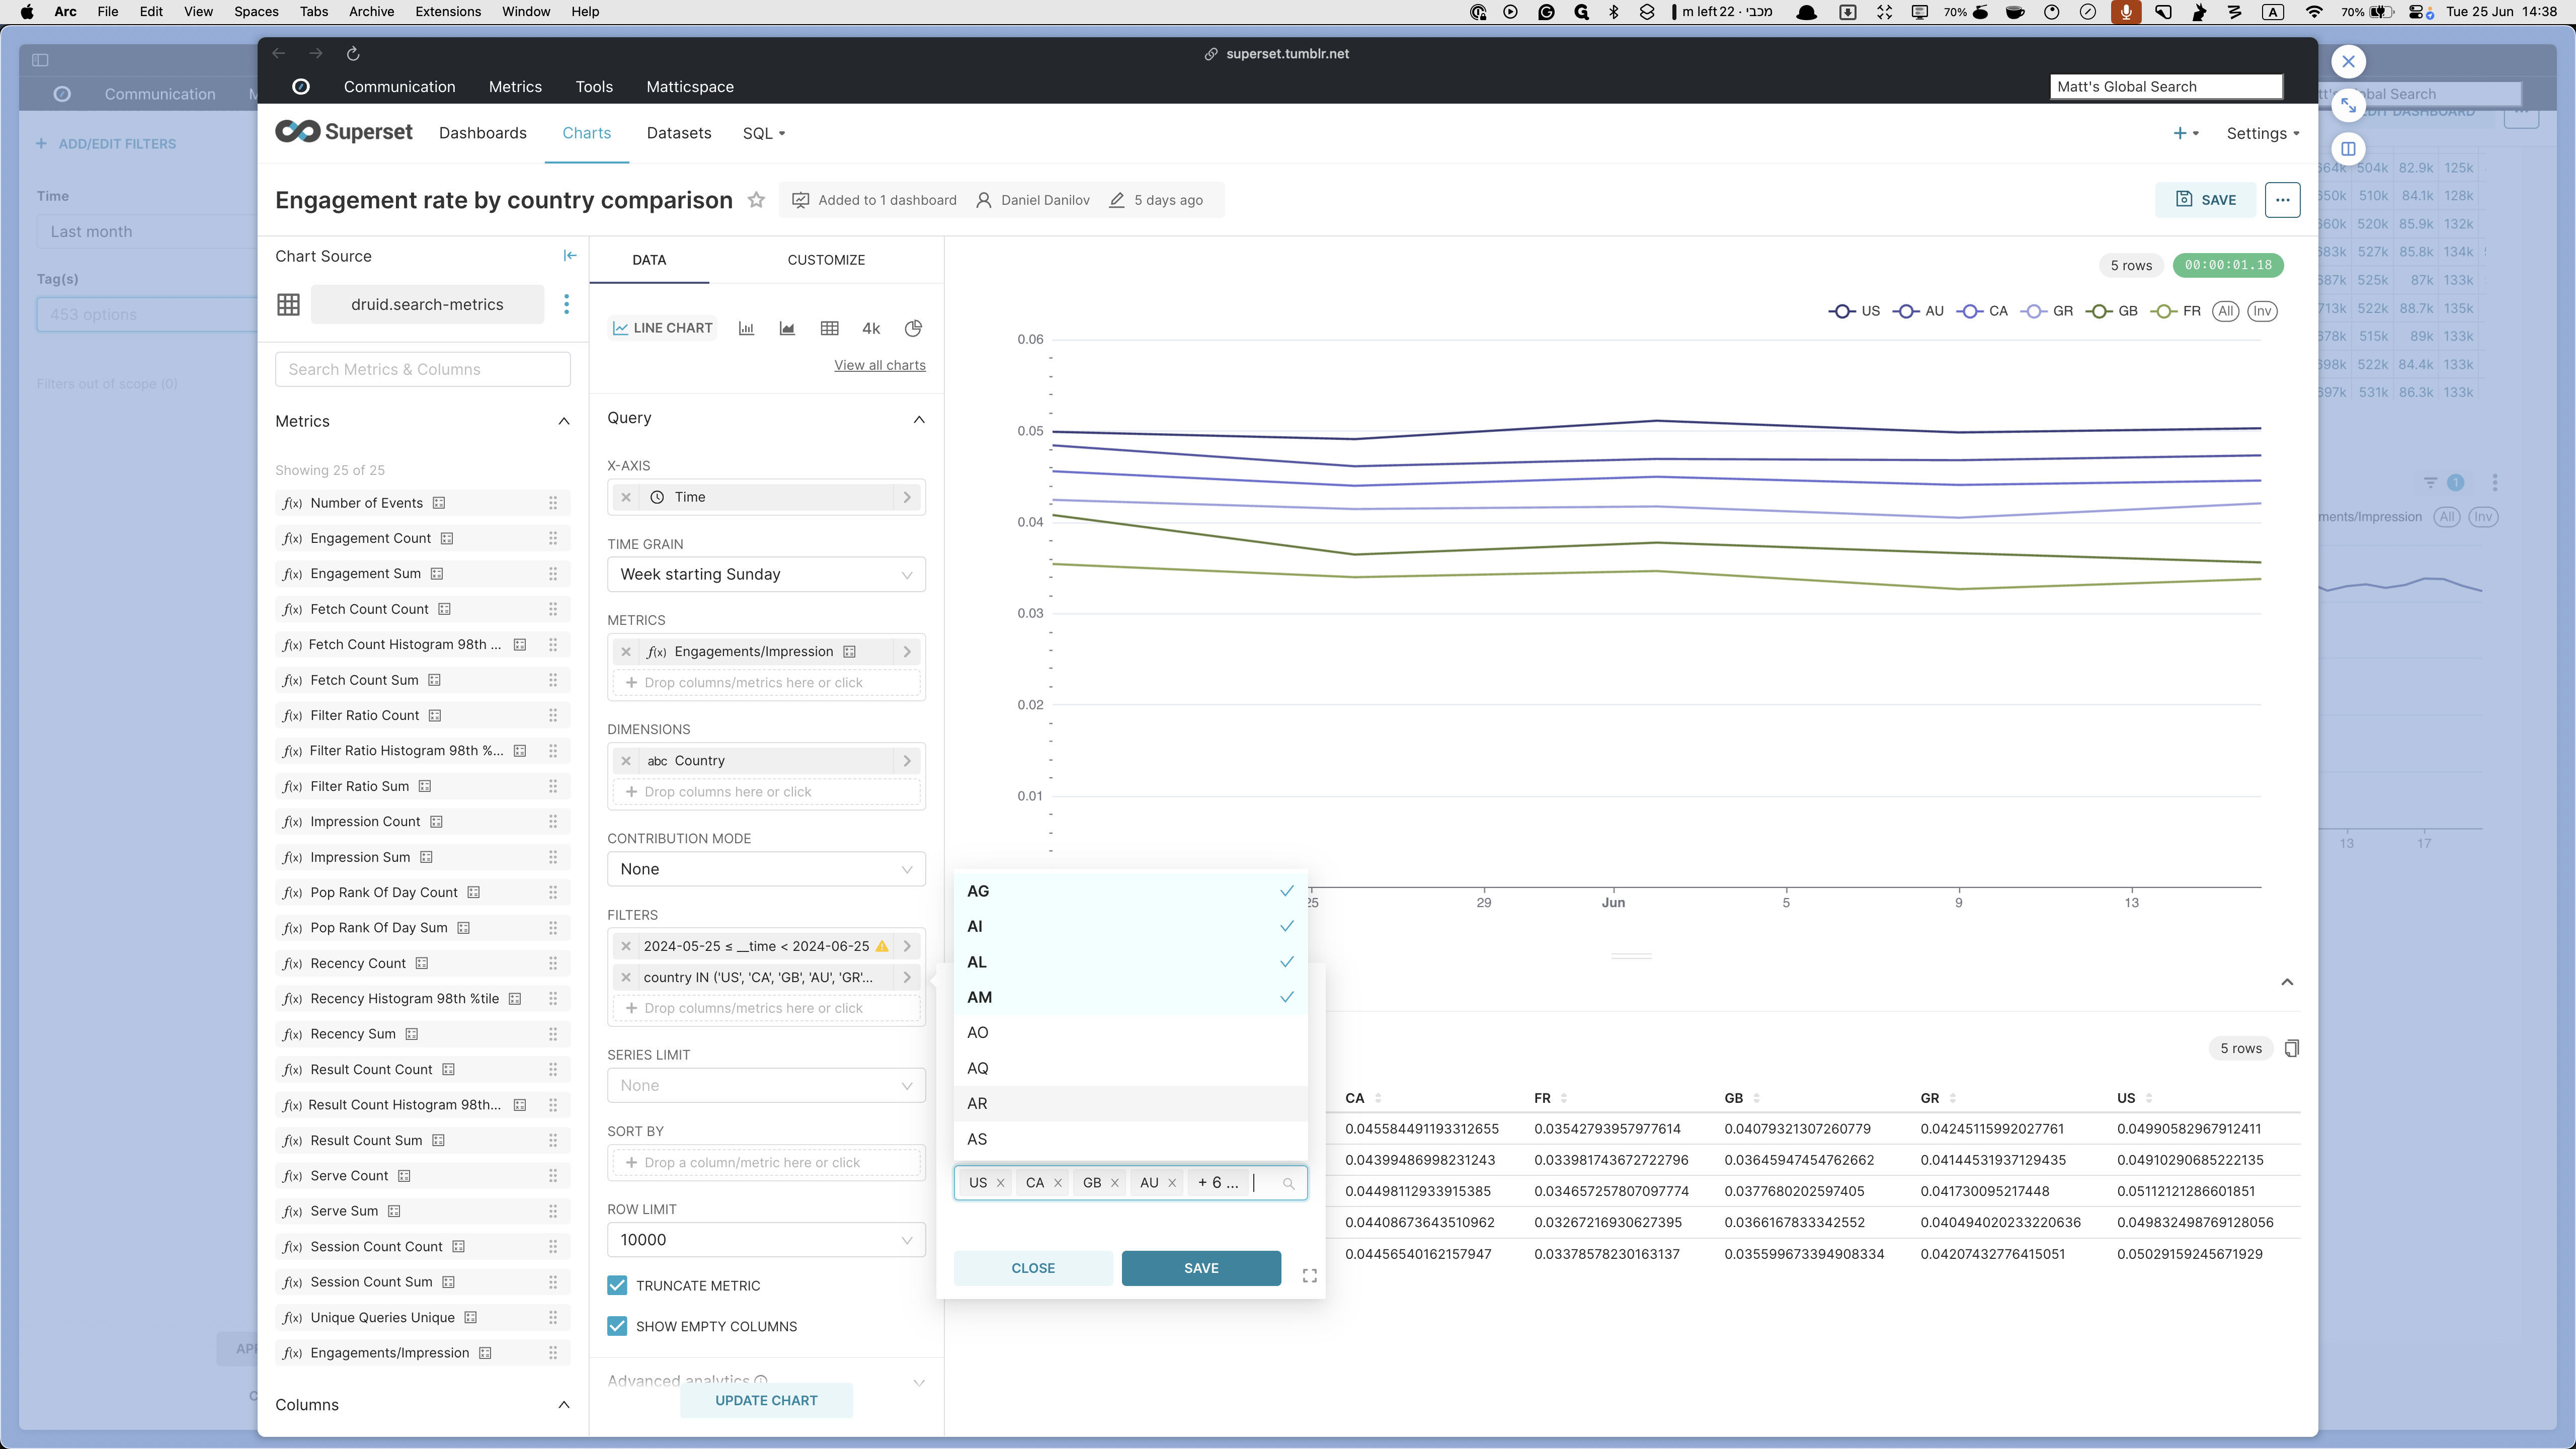
Let's say you want to compare some additional countries, or remove the ones currently selected. You can do that in the FILTERS section.
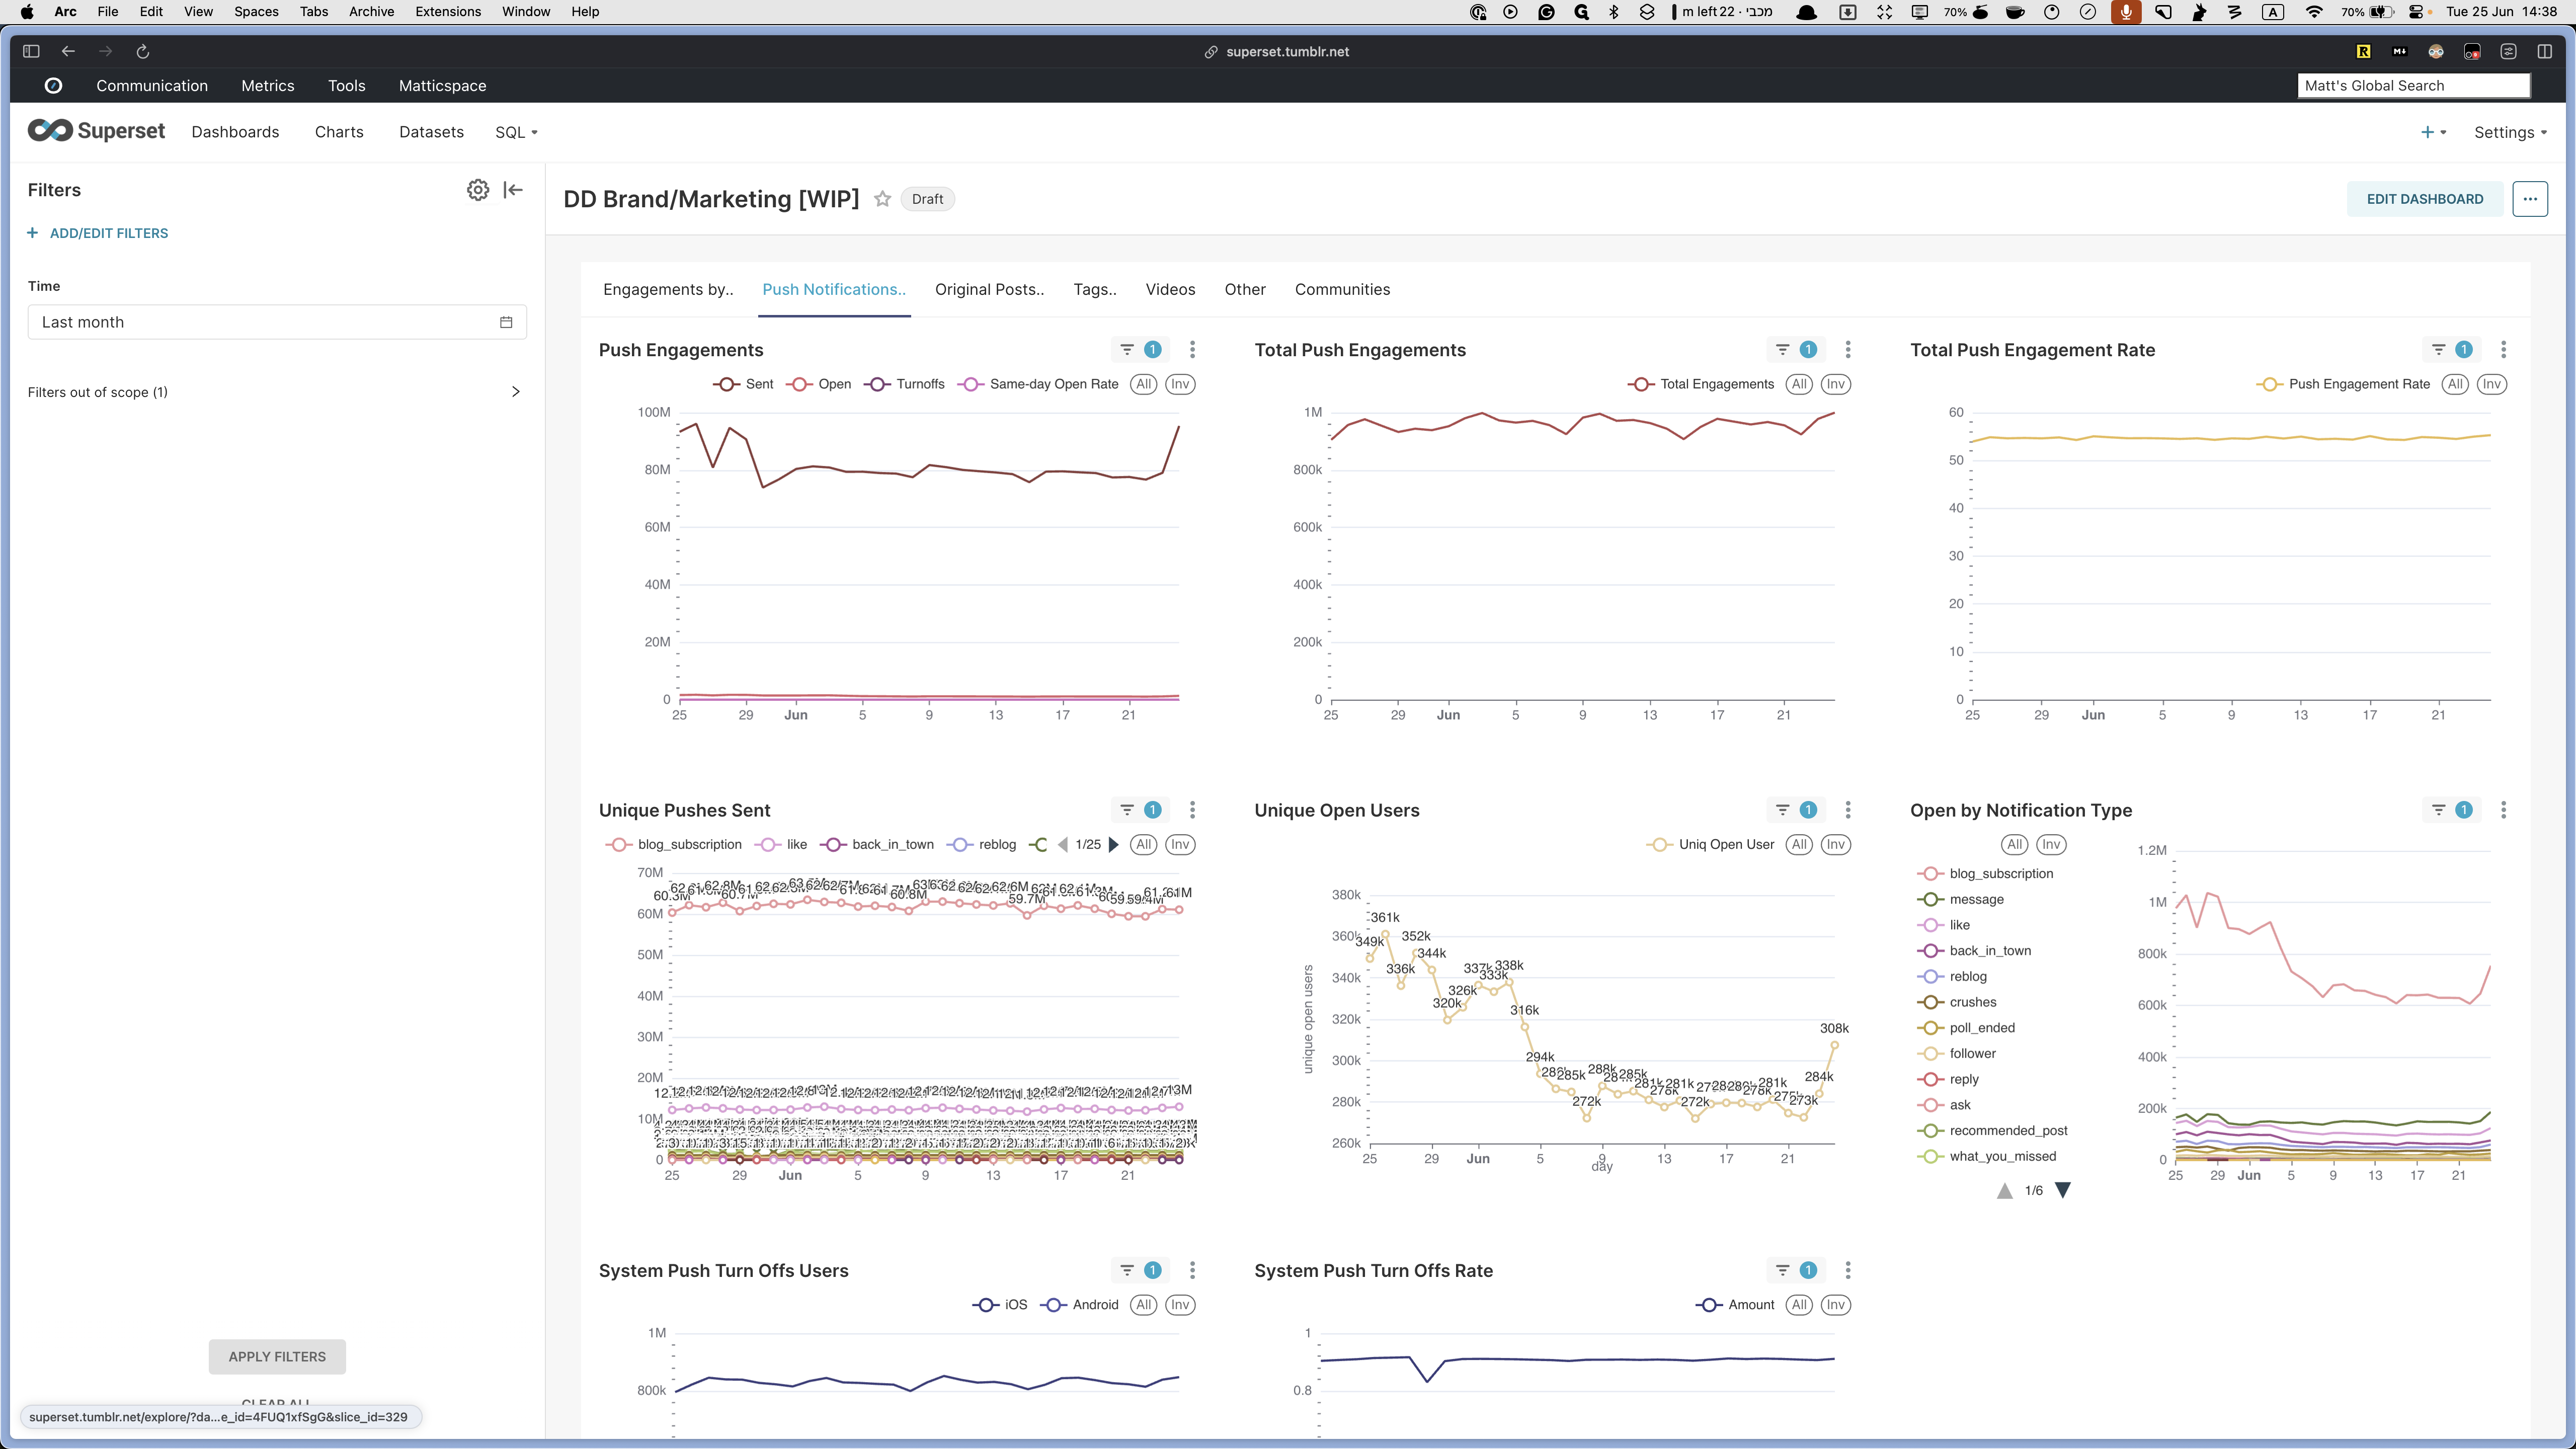
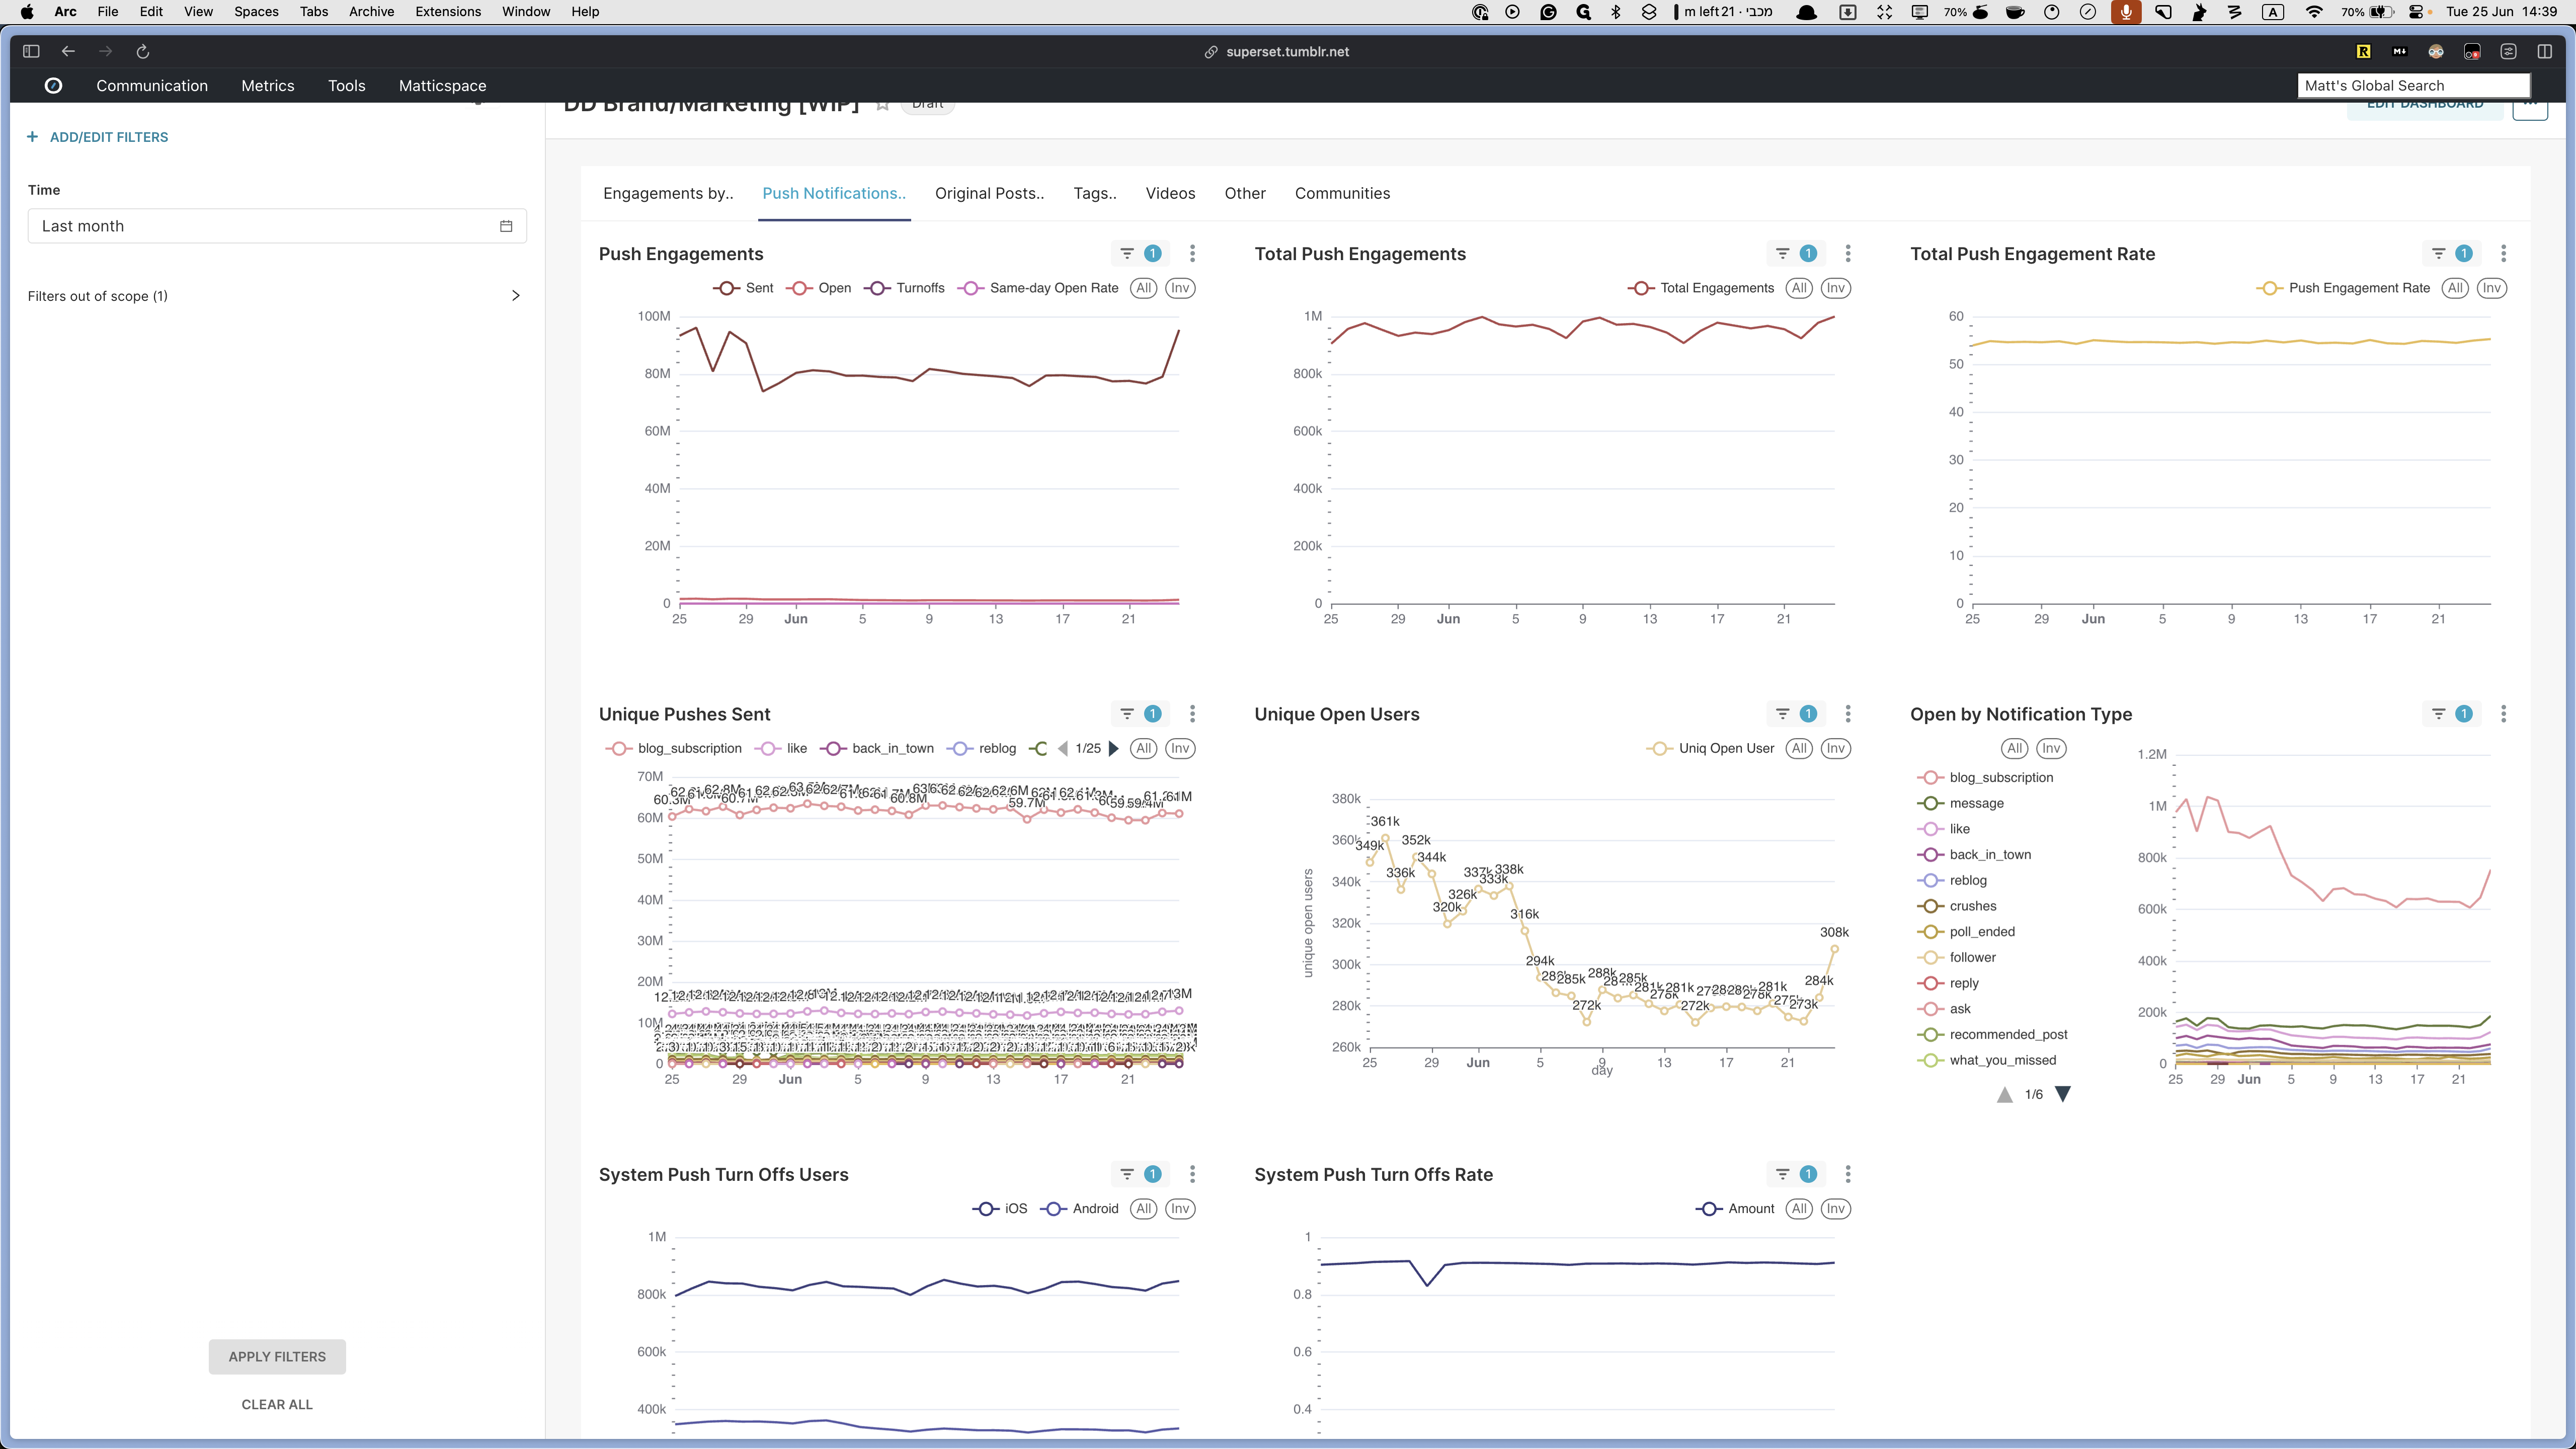
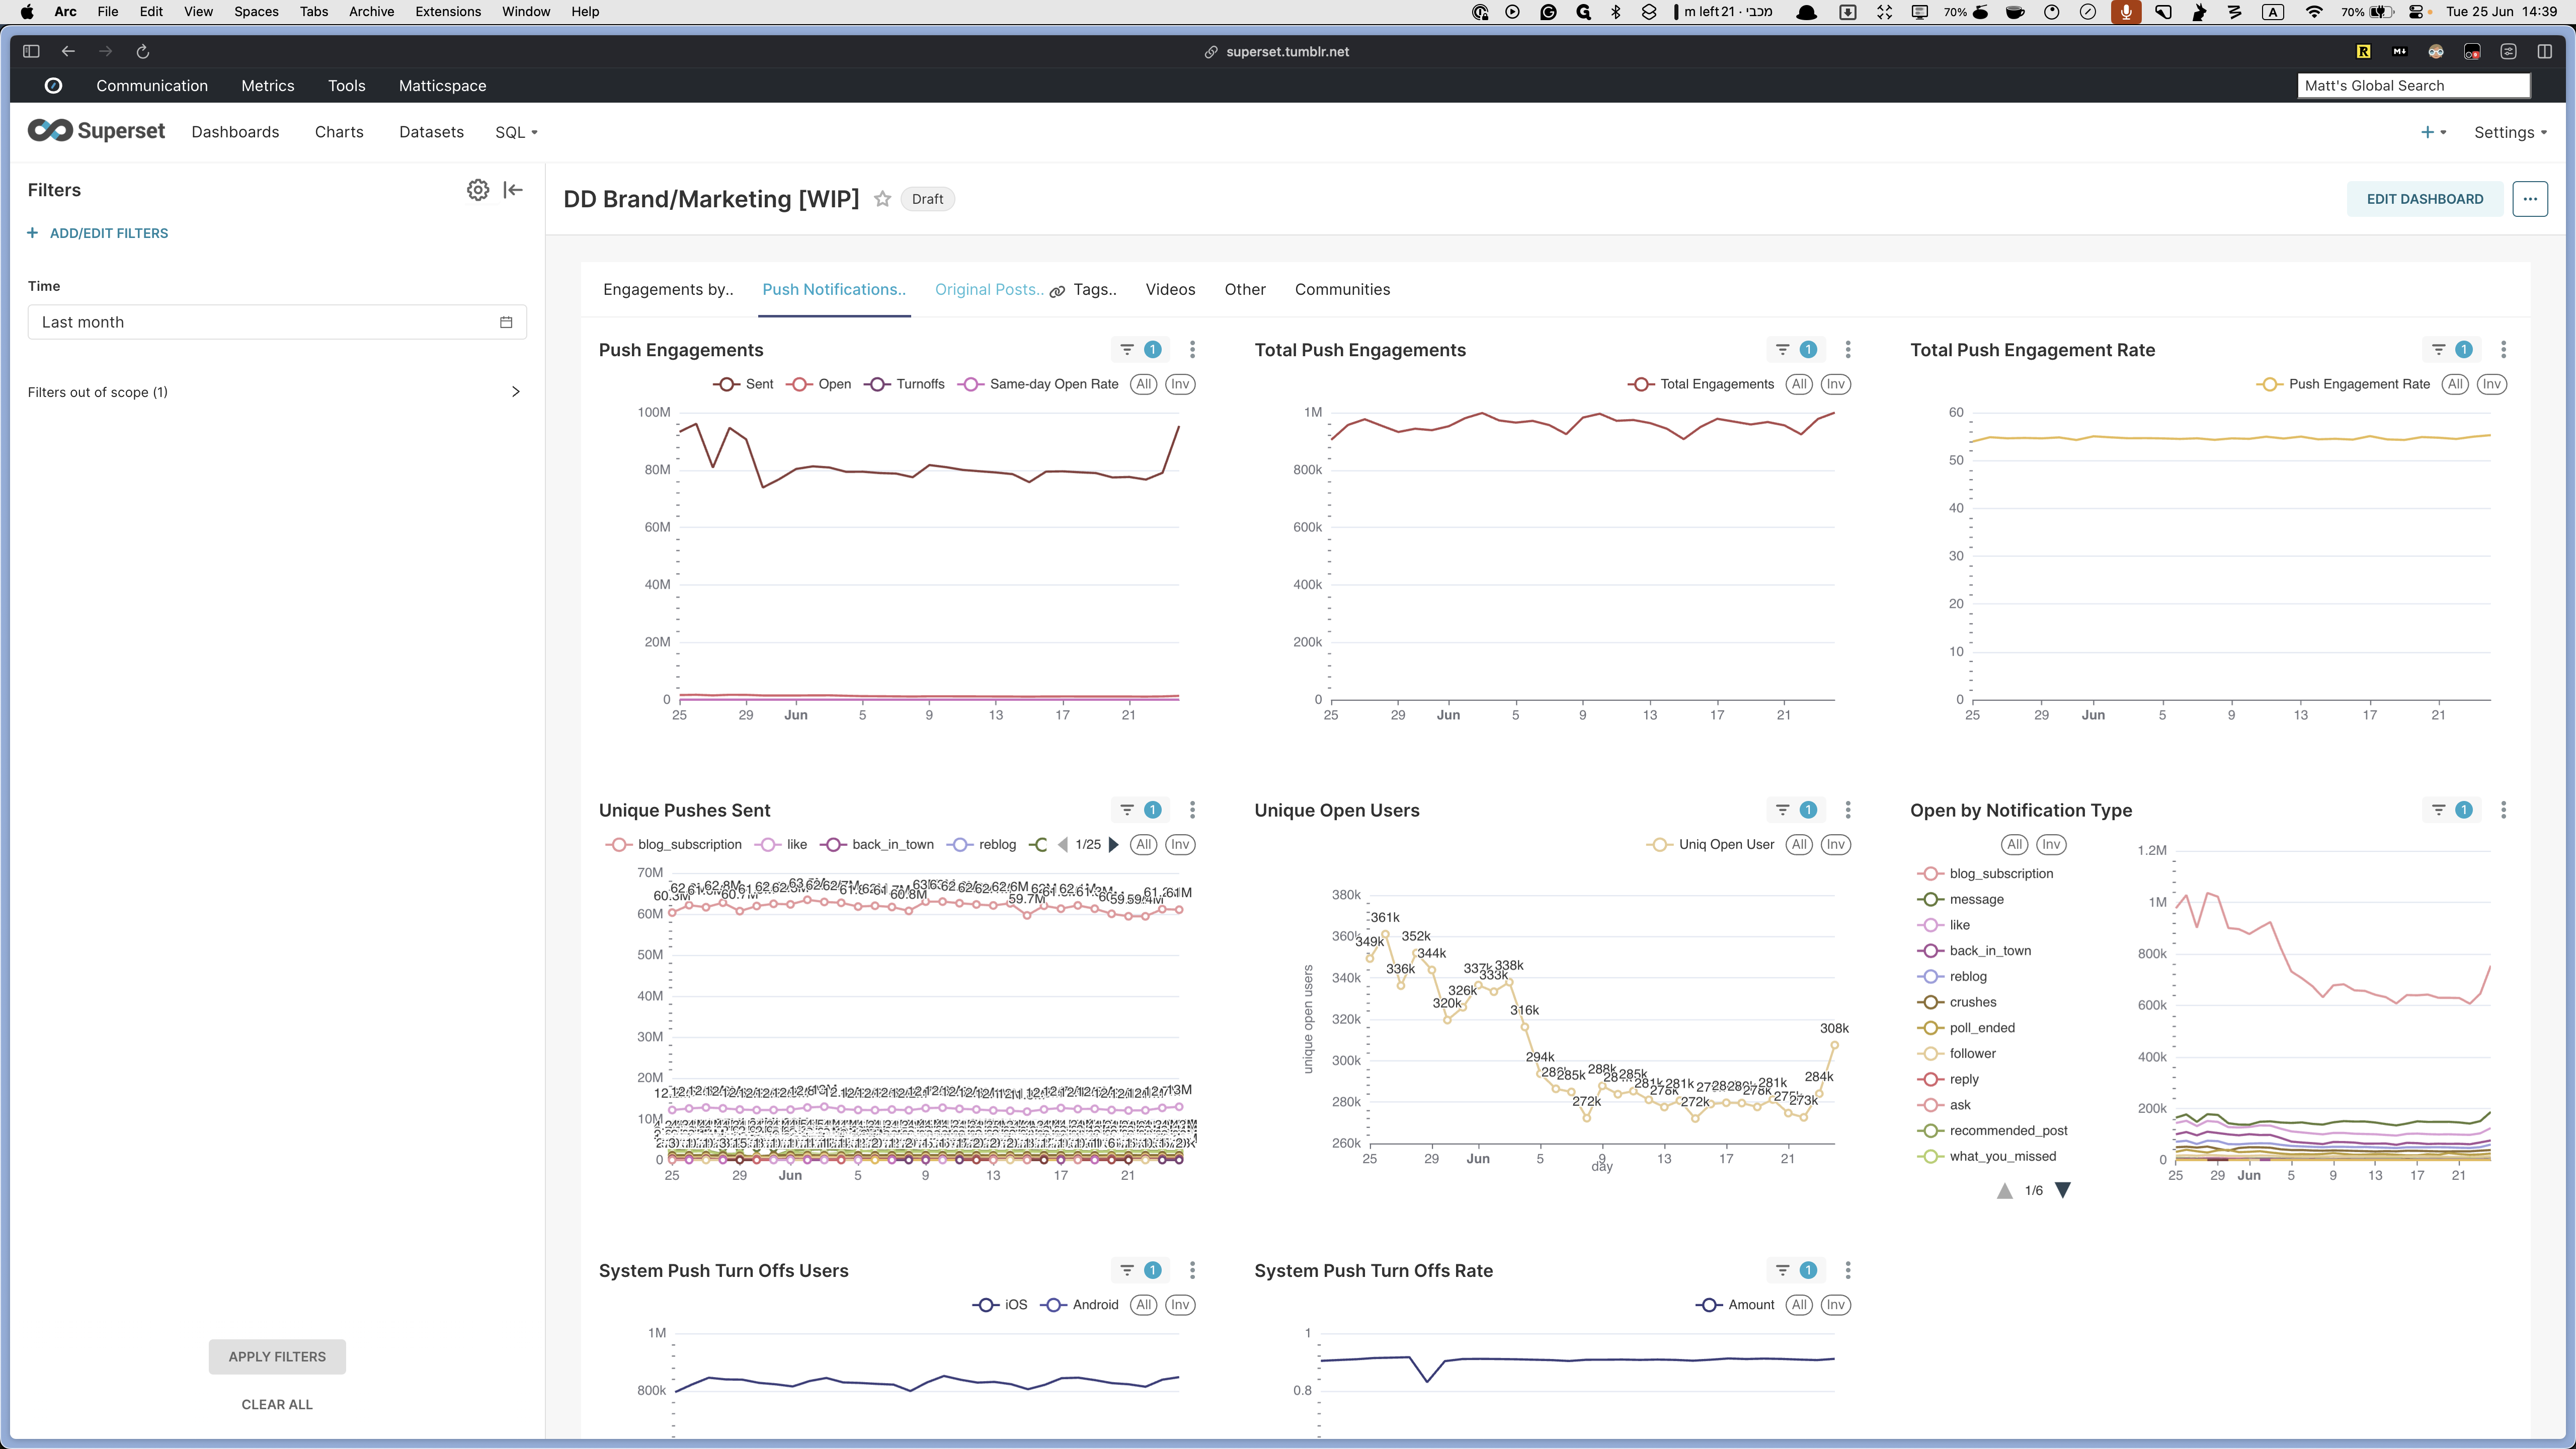
Next, we have the push notifications tab.
Here you will find all the push related data that you might need.
(There's also a separate dedicated dashboard that has even more data in this dedicated Notifications Dashboard.)
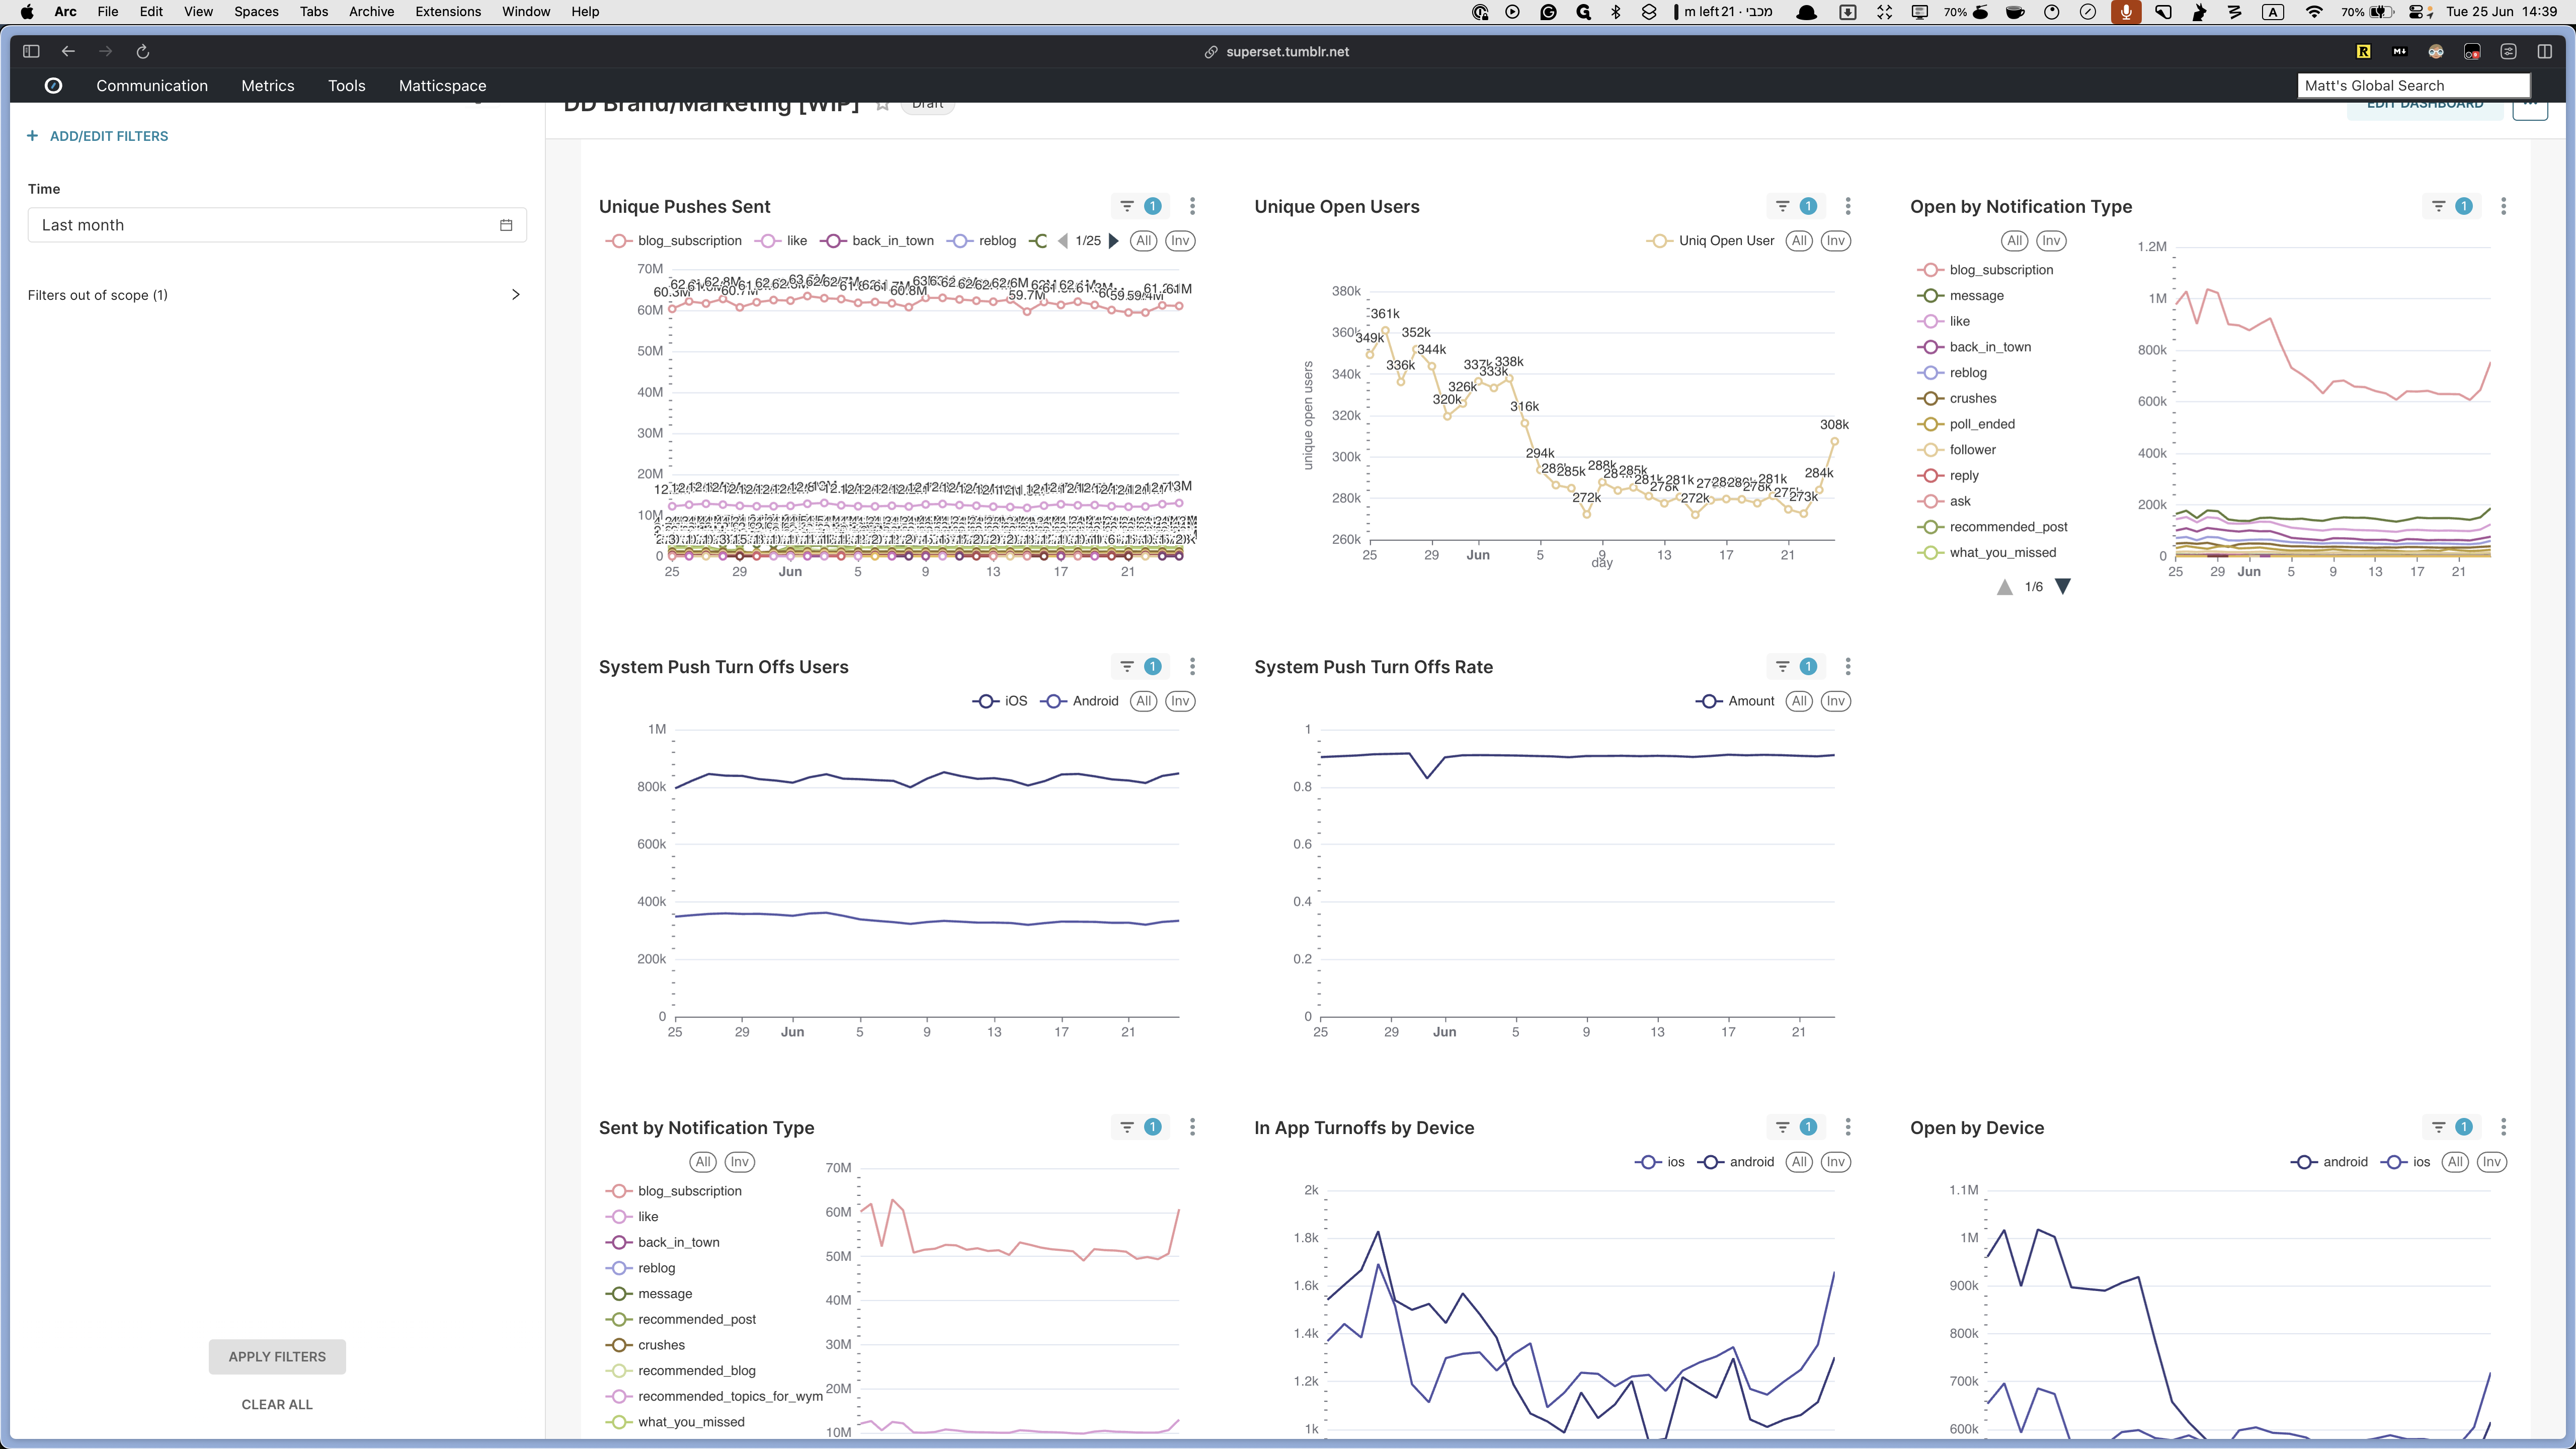
You can see the total push engagements across all groups, the engagement rate, and the number of unique pushes sent. It also shows how many unique users opened notifications and the opens by notification type. There are different notification types, including system push turnoffs, which indicate how many times people turned off notifications in the settings, and the turnoff rate. Additionally, it shows how many notifications were sent by type, in-app turnoffs by device (iOS and Android), and how many were opened by device.
These are self-explanatory. If you have any questions, let us know, and we'll provide more details.


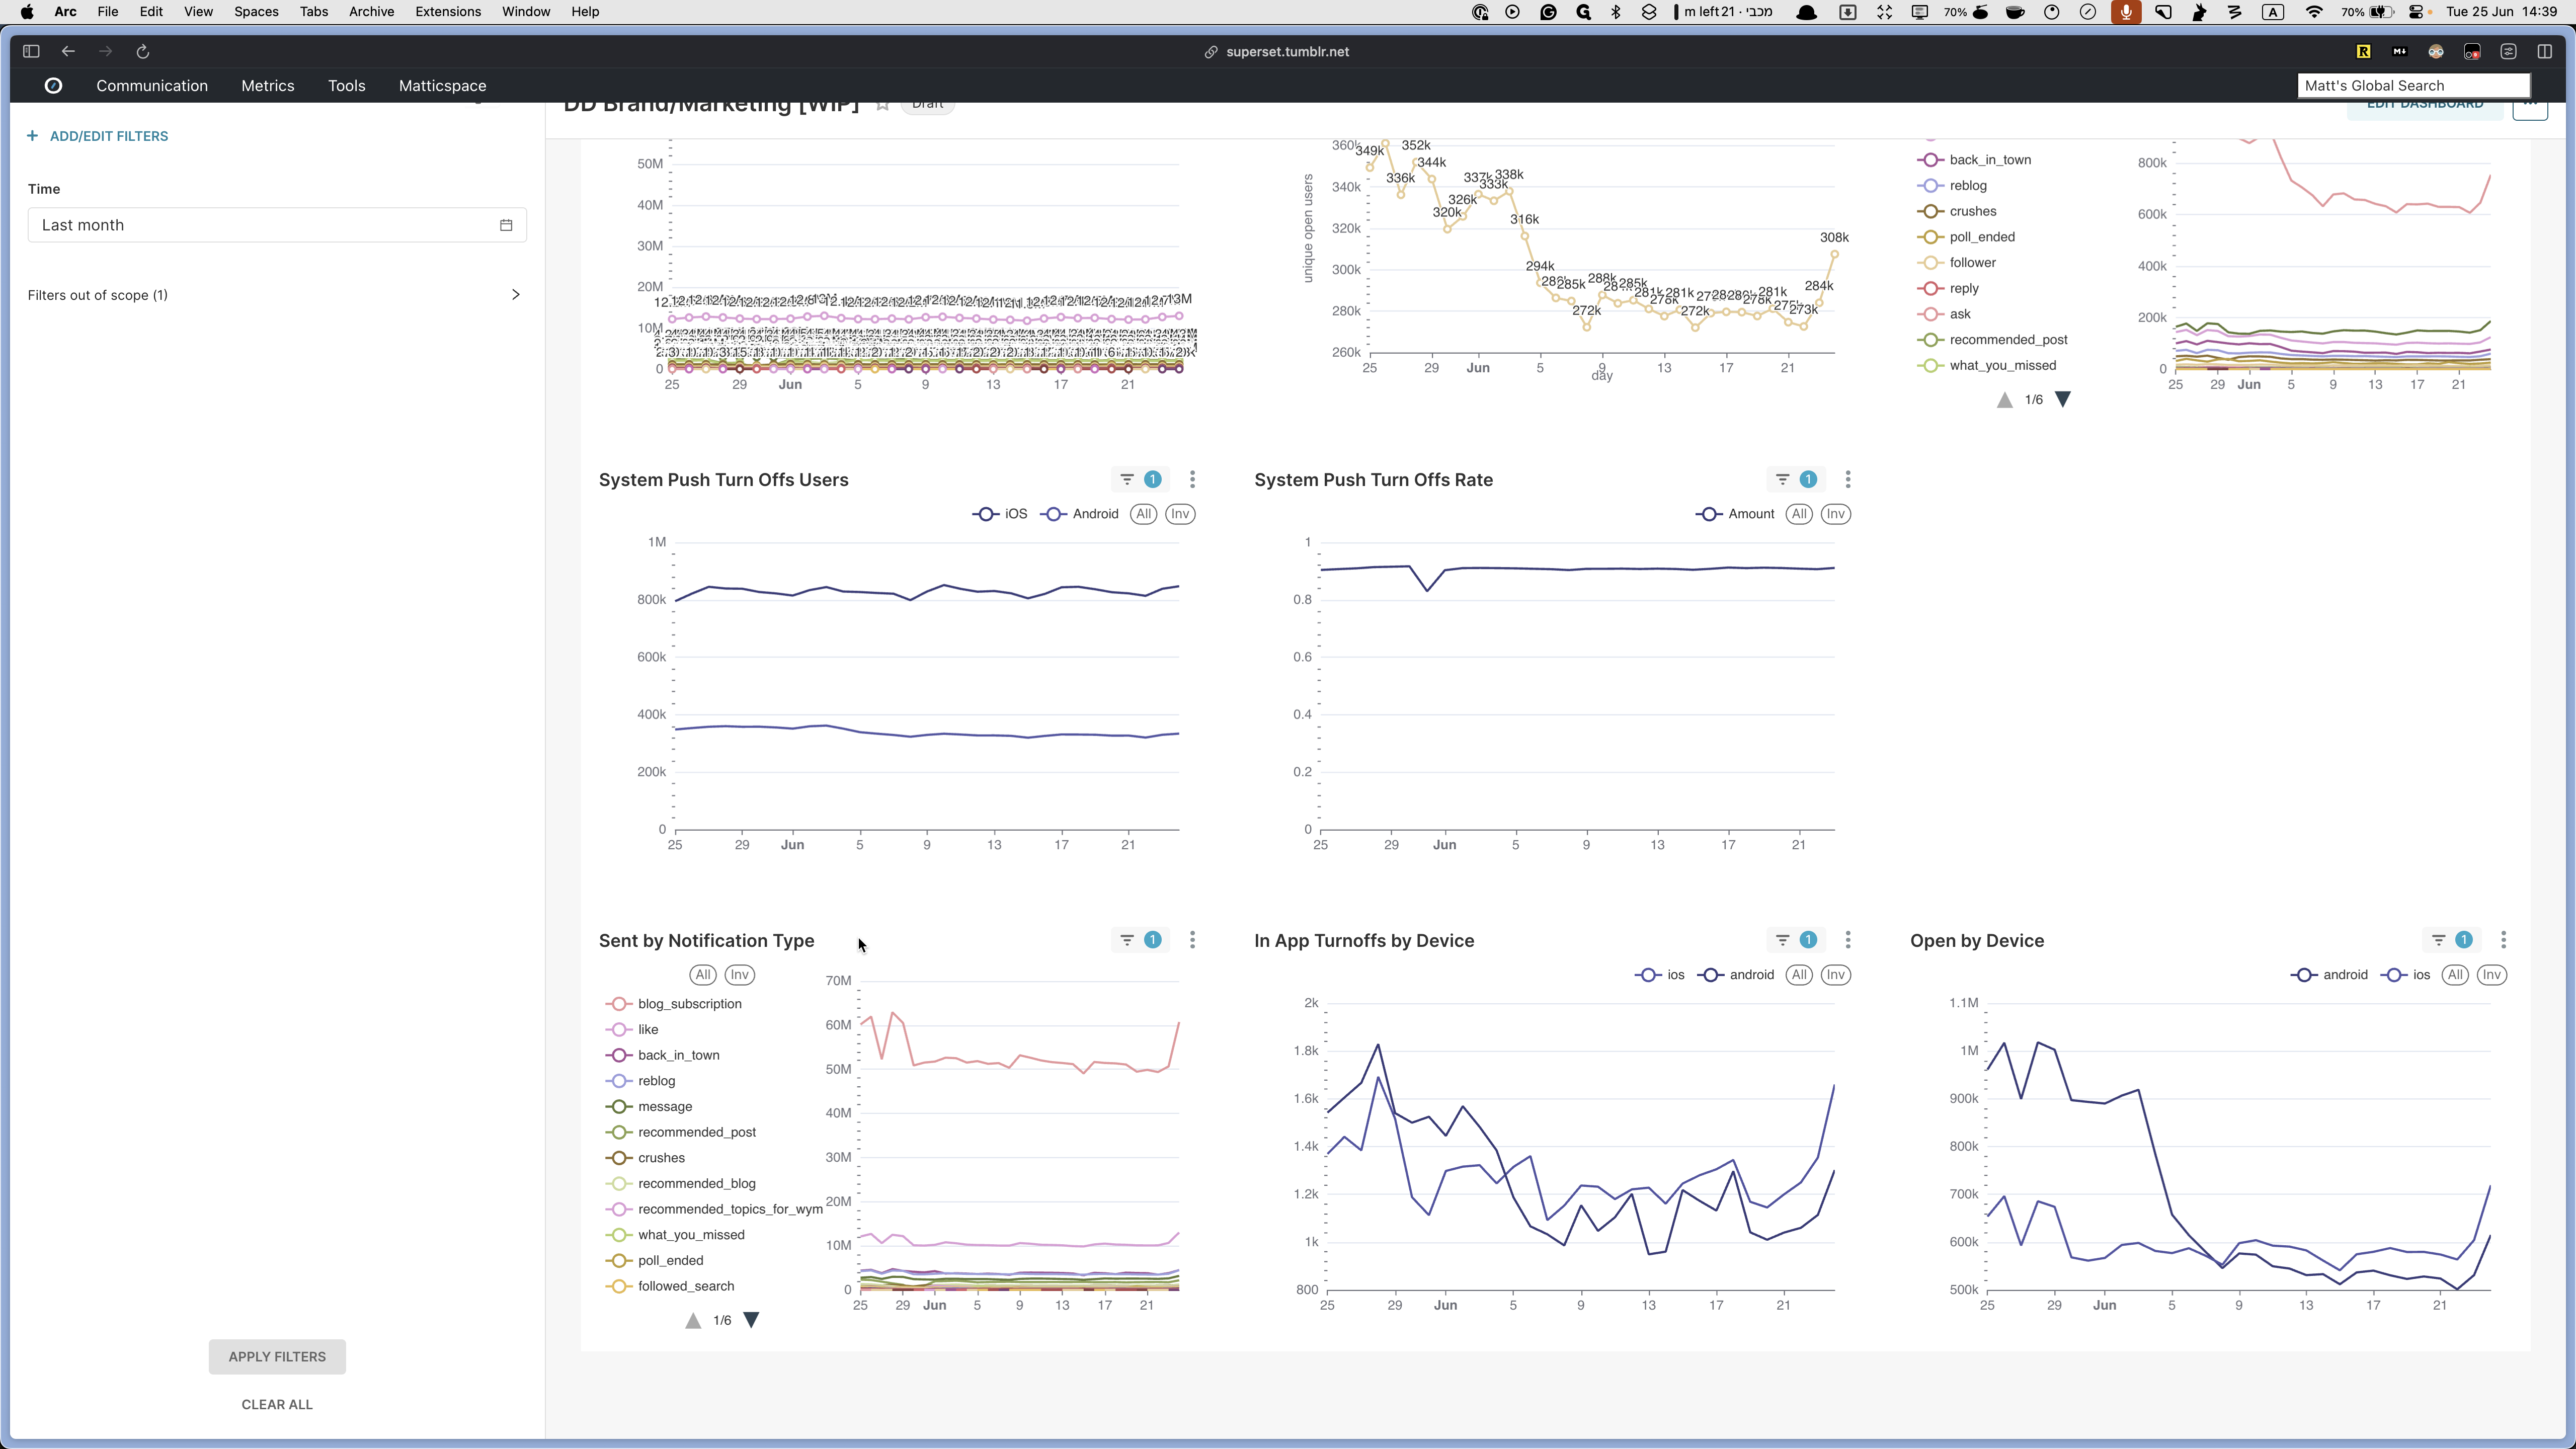

As before, you can explore each section for more details.
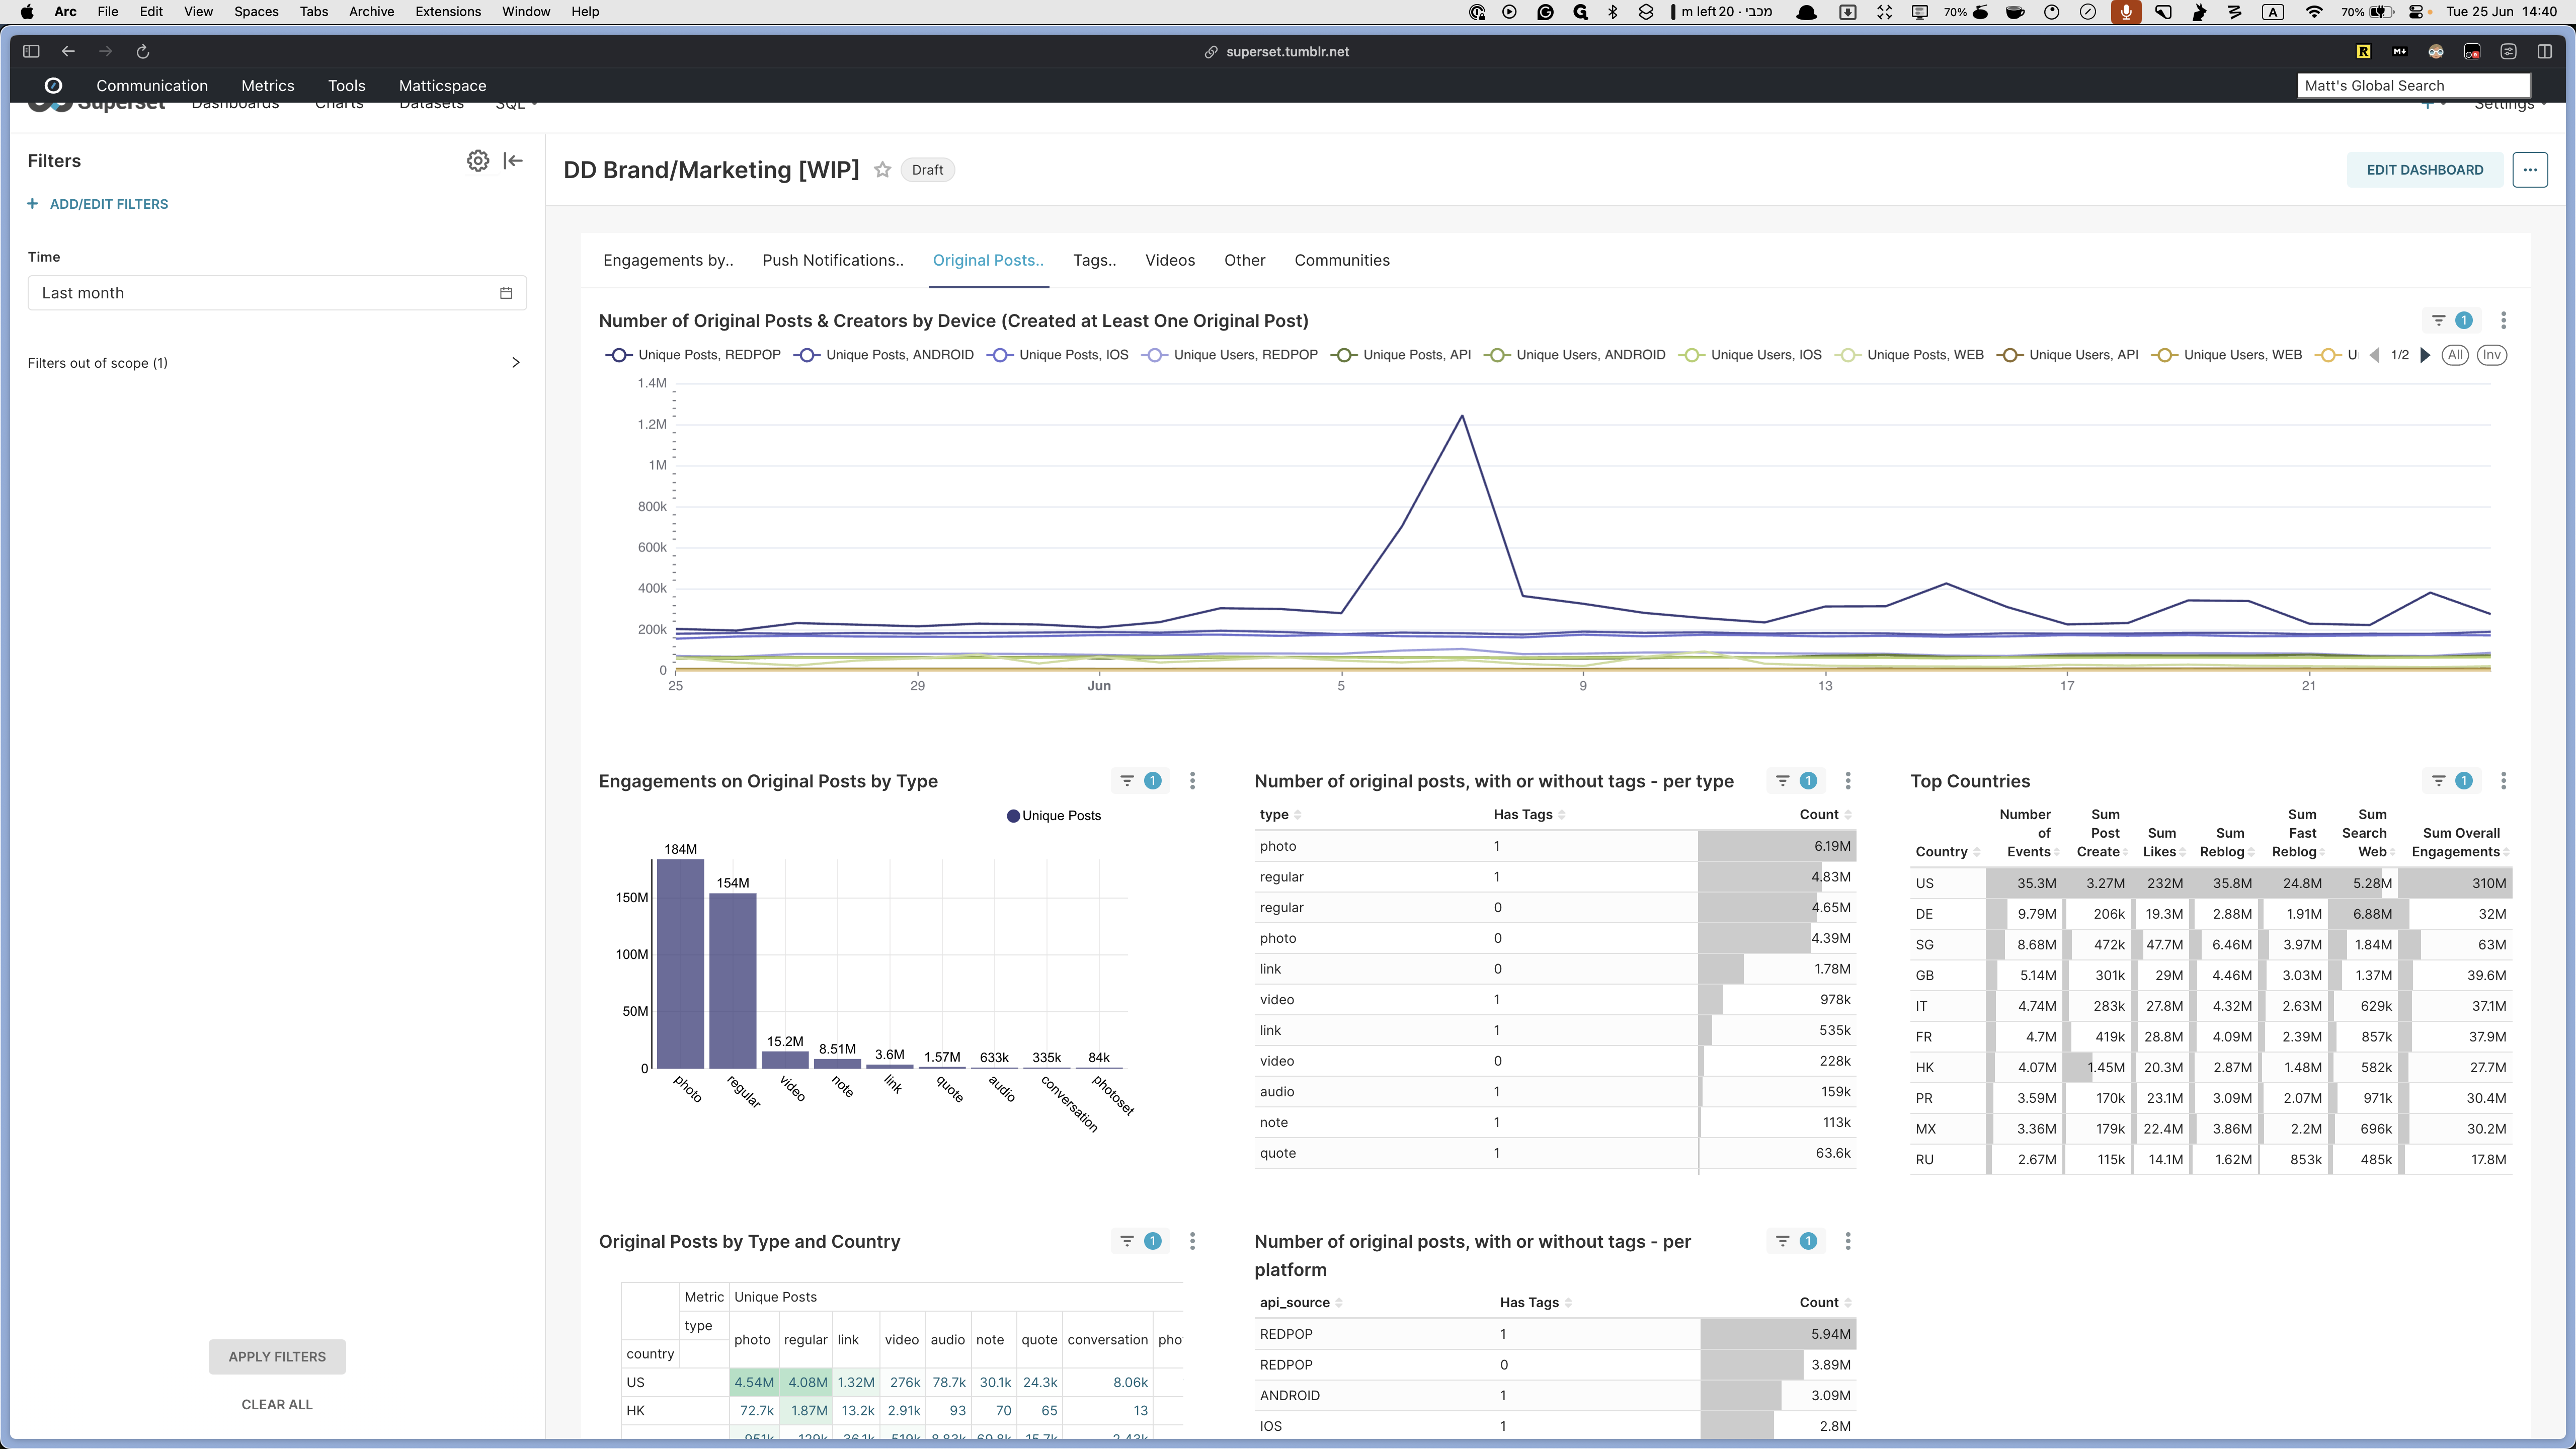
Original Posts Tab
In this section, you can find information such as:
Original posts and creators by device
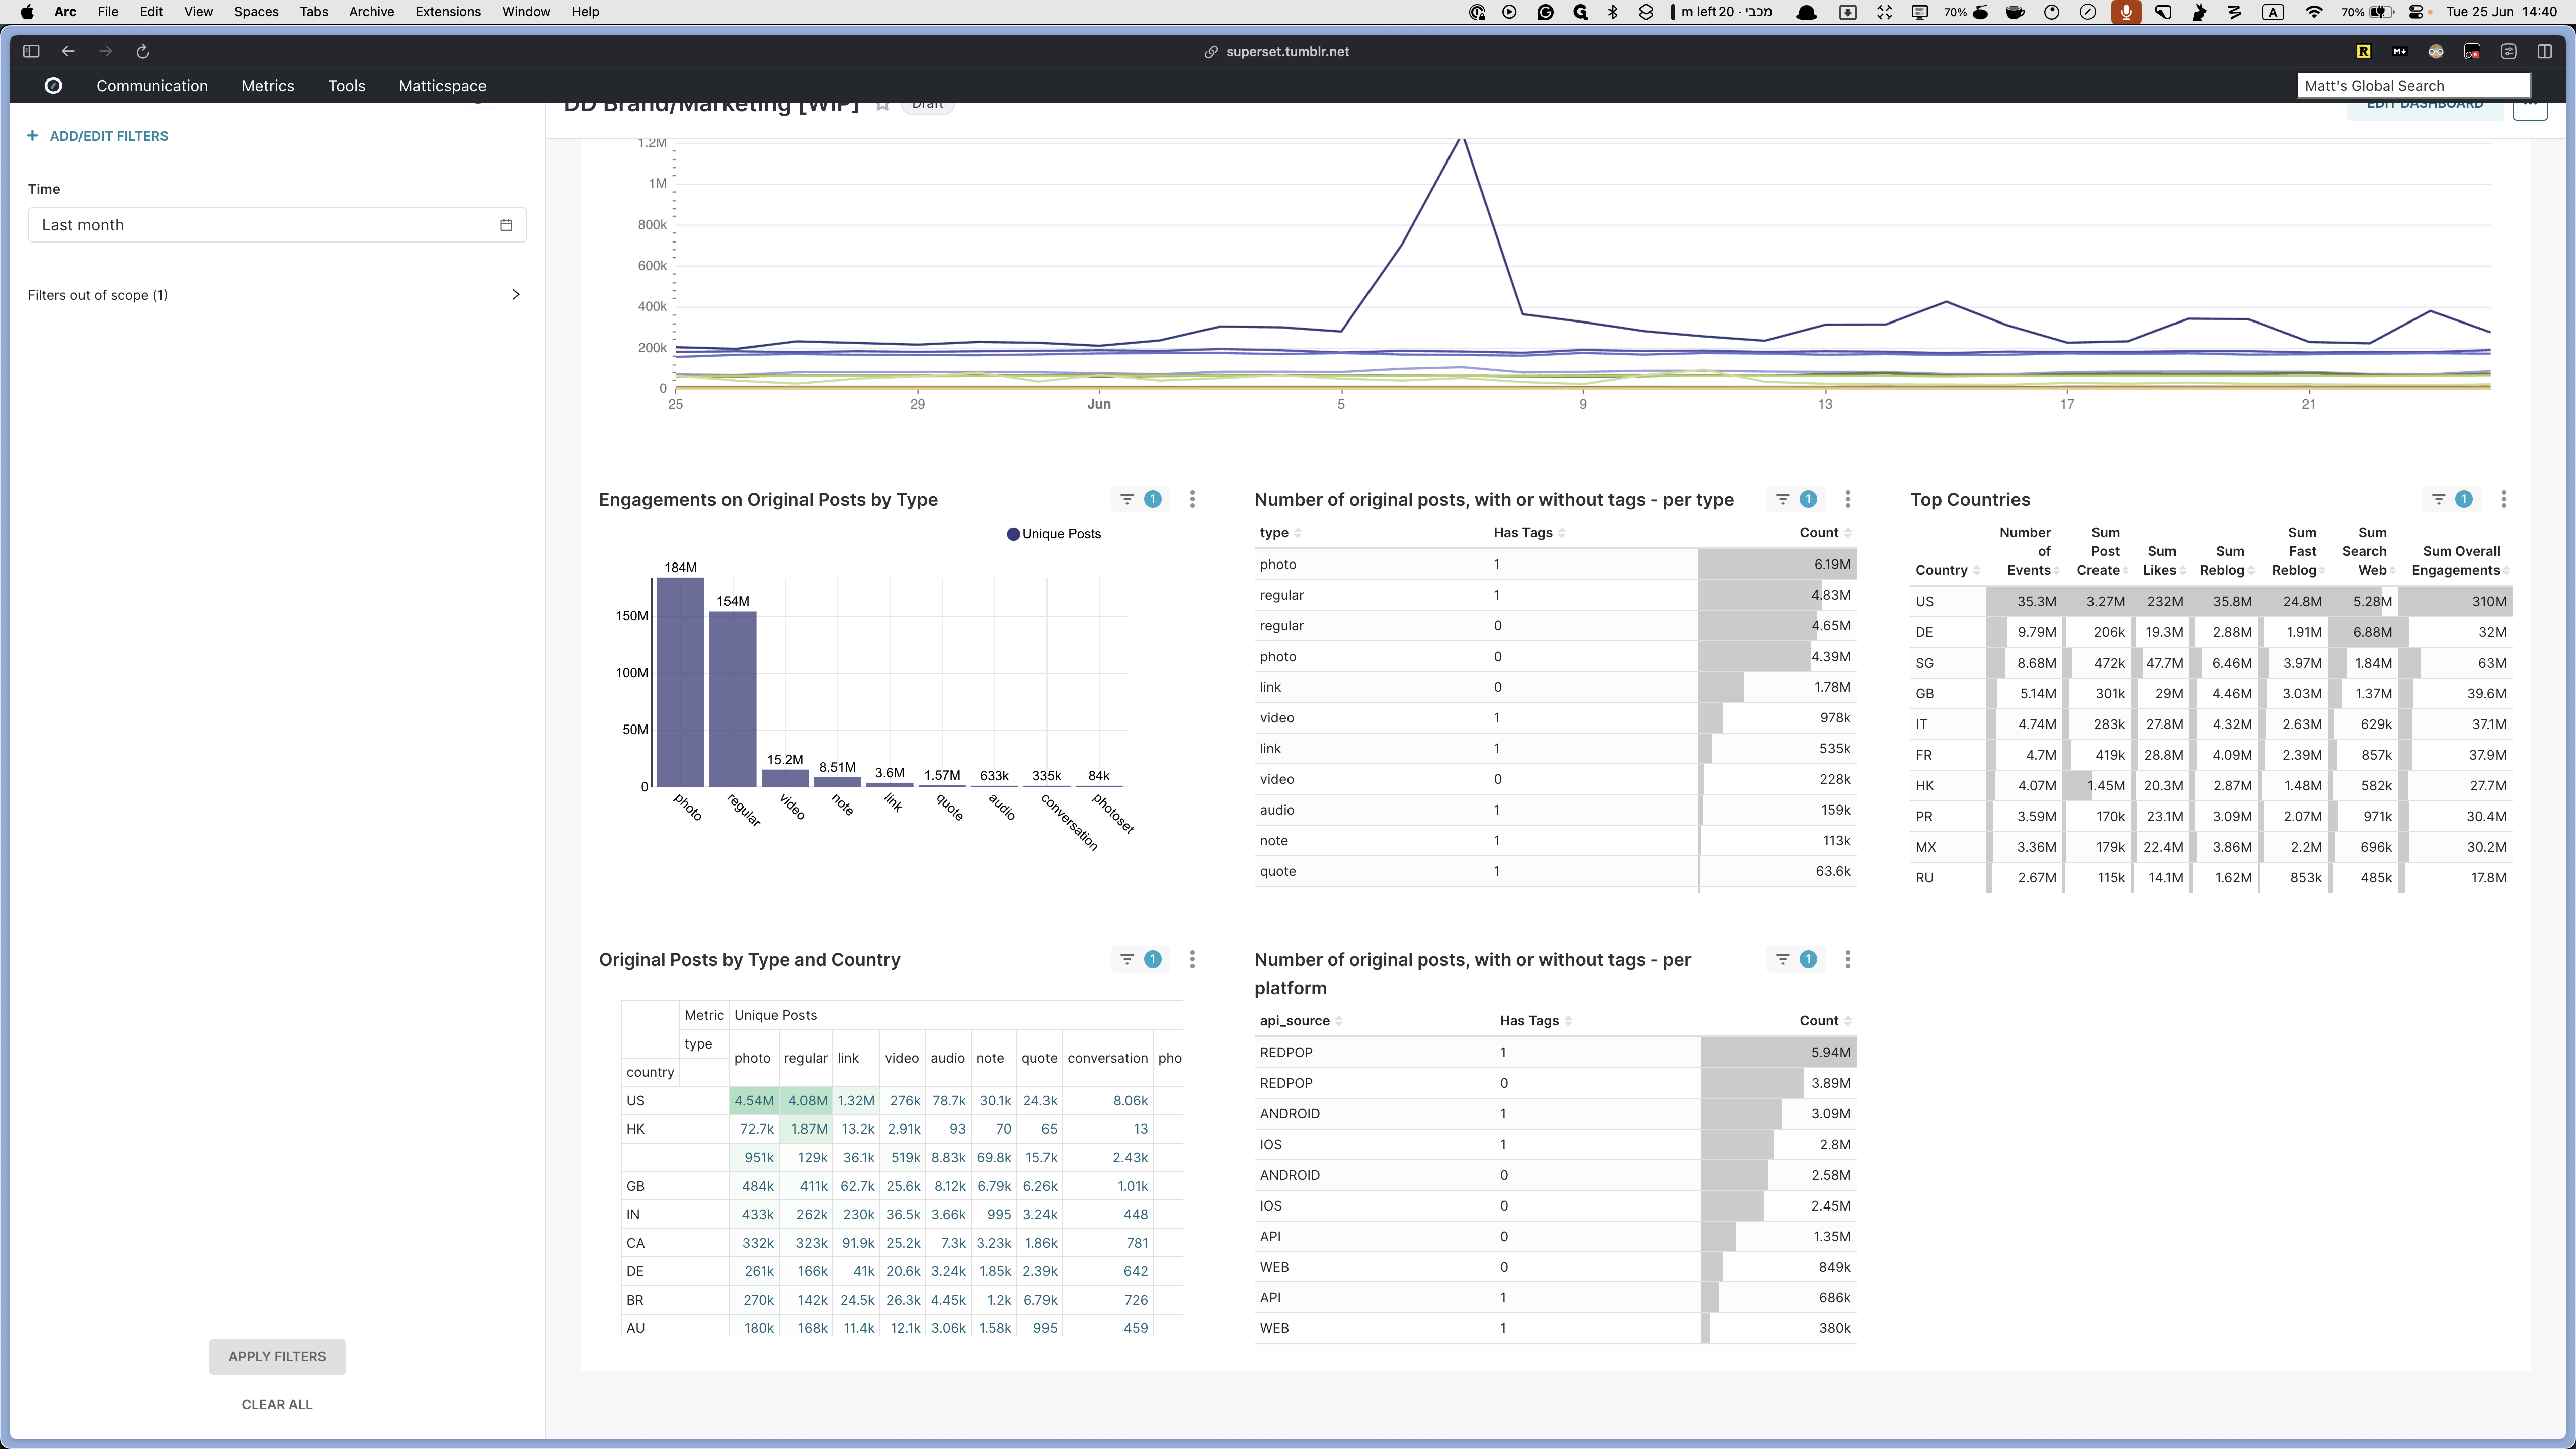
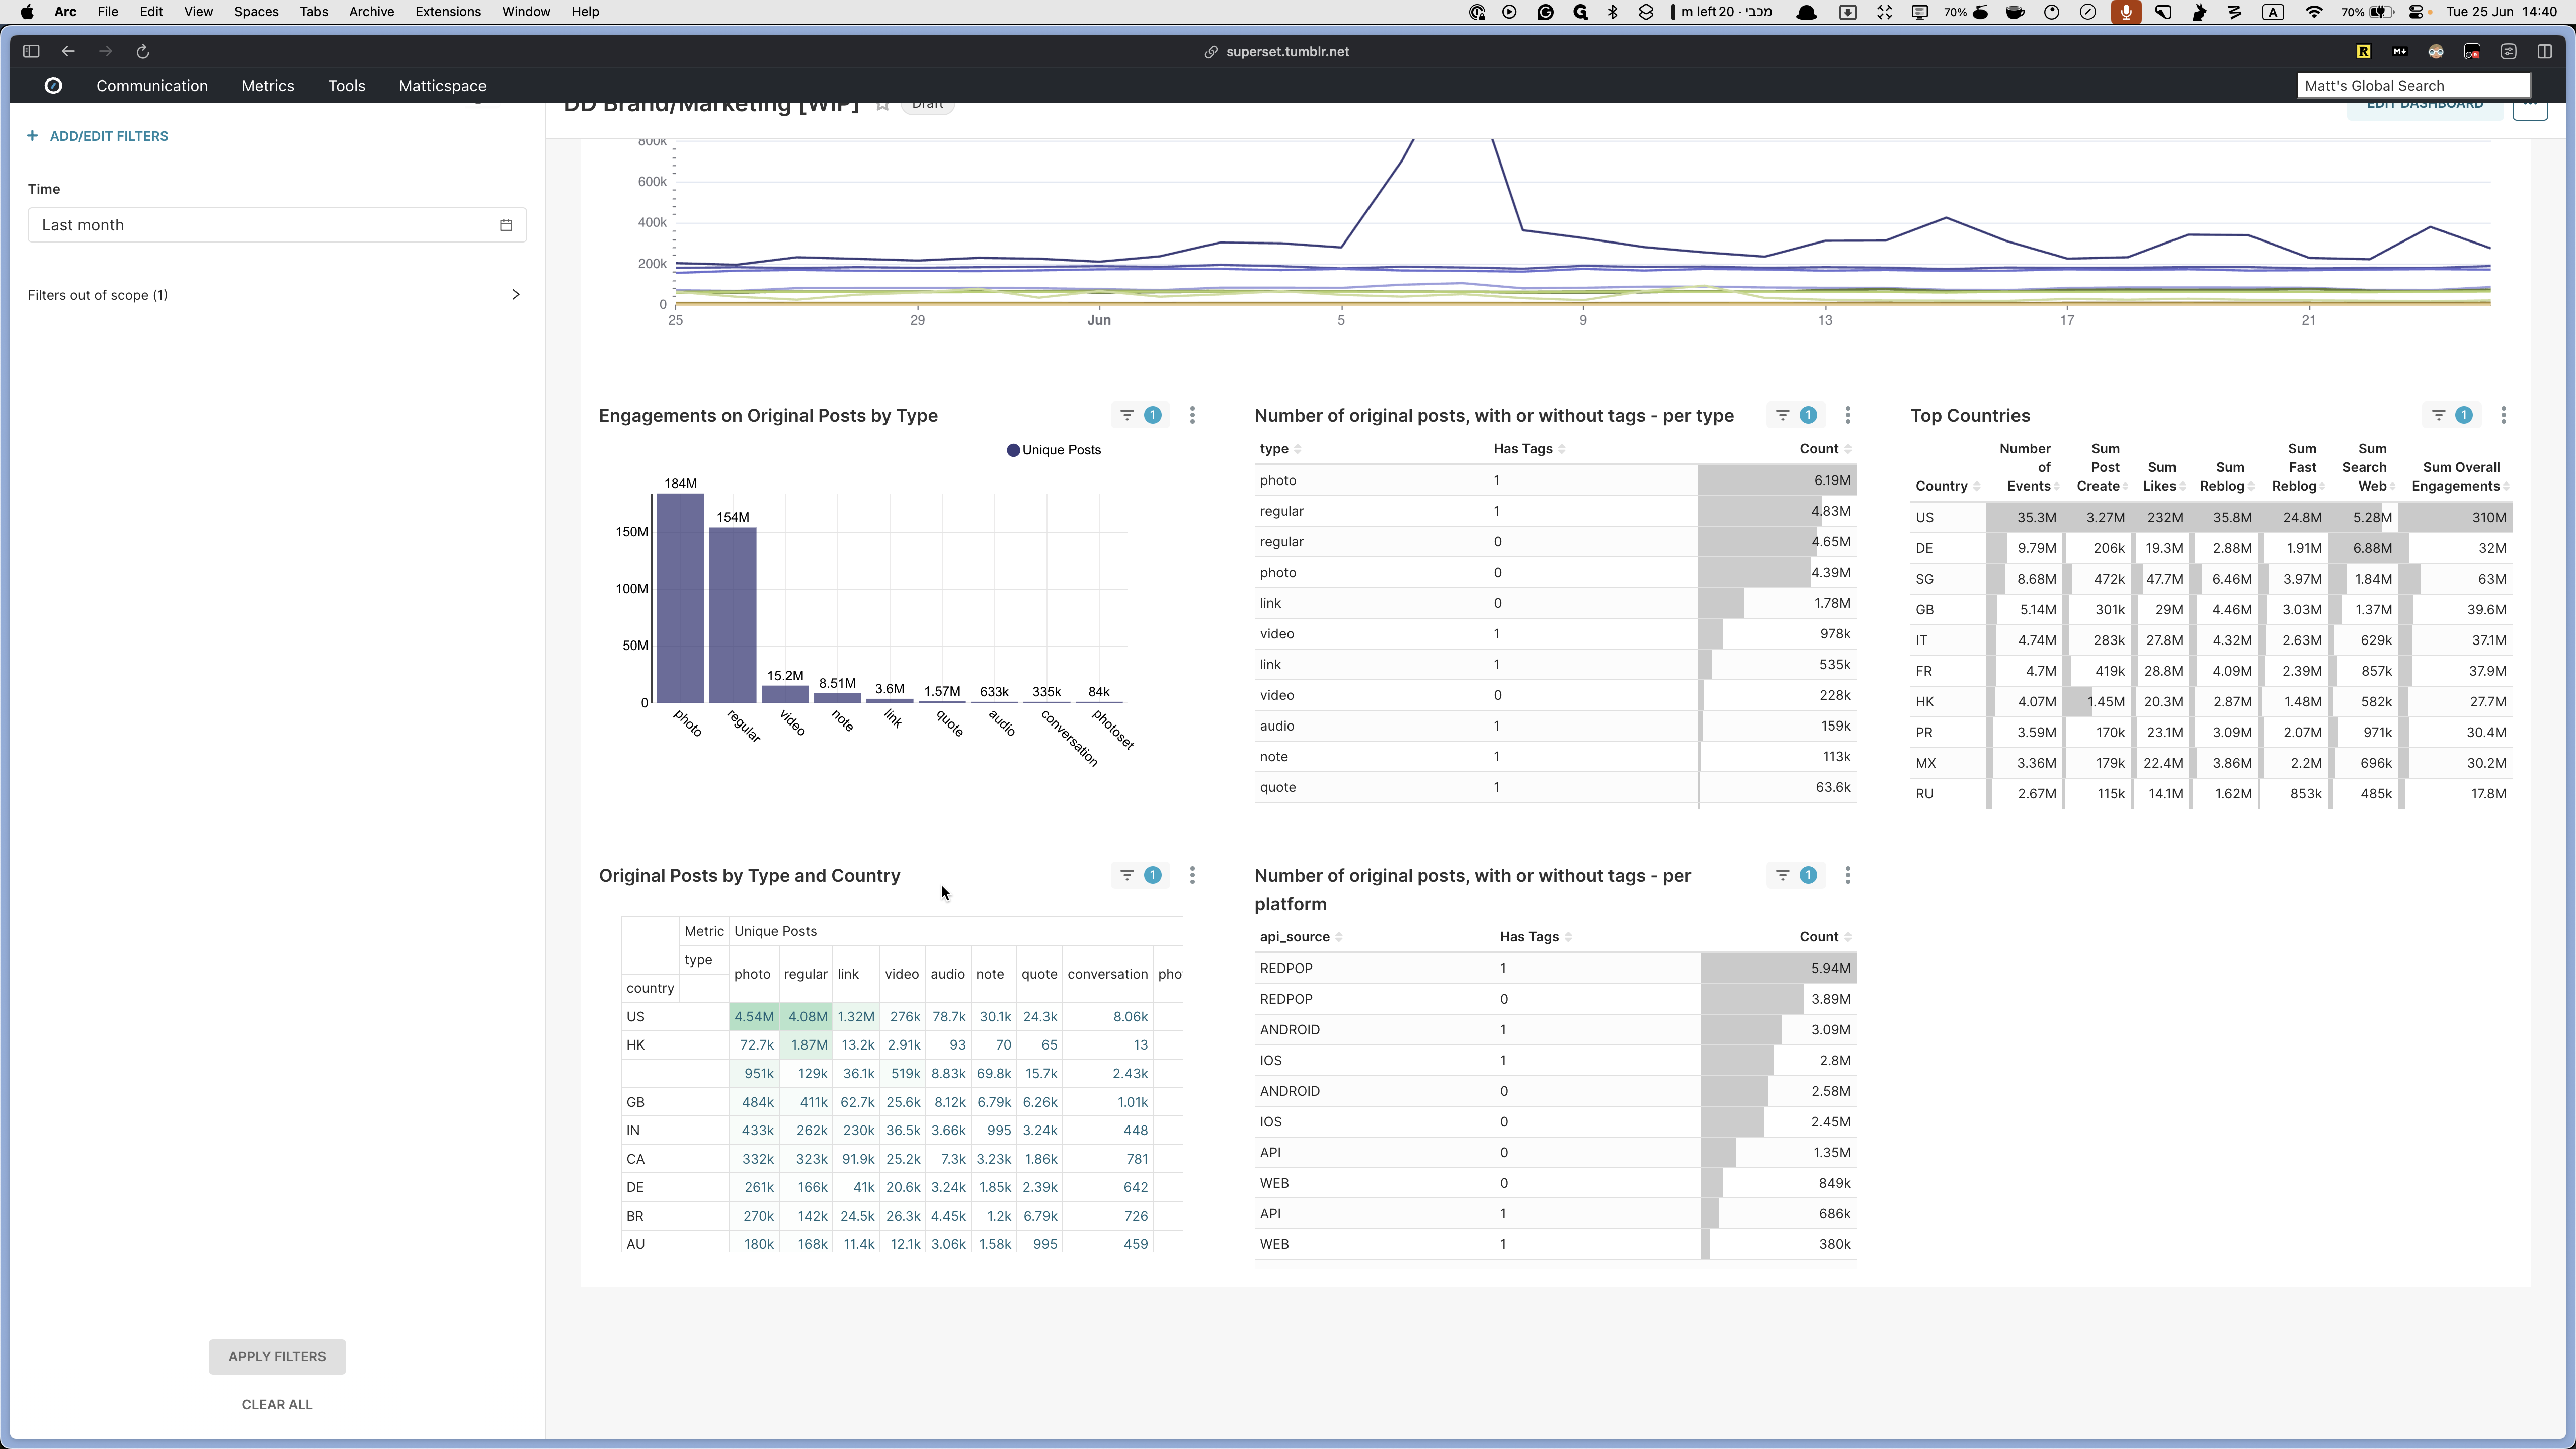
Engagements on original posts by type
Number of original posts with or without tags per type
Number of original posts with or without tags per platform
Top countries and the number of posts they've created
Total number of likes, reblogs, and other related metrics
Original posts by type and country in a table format.


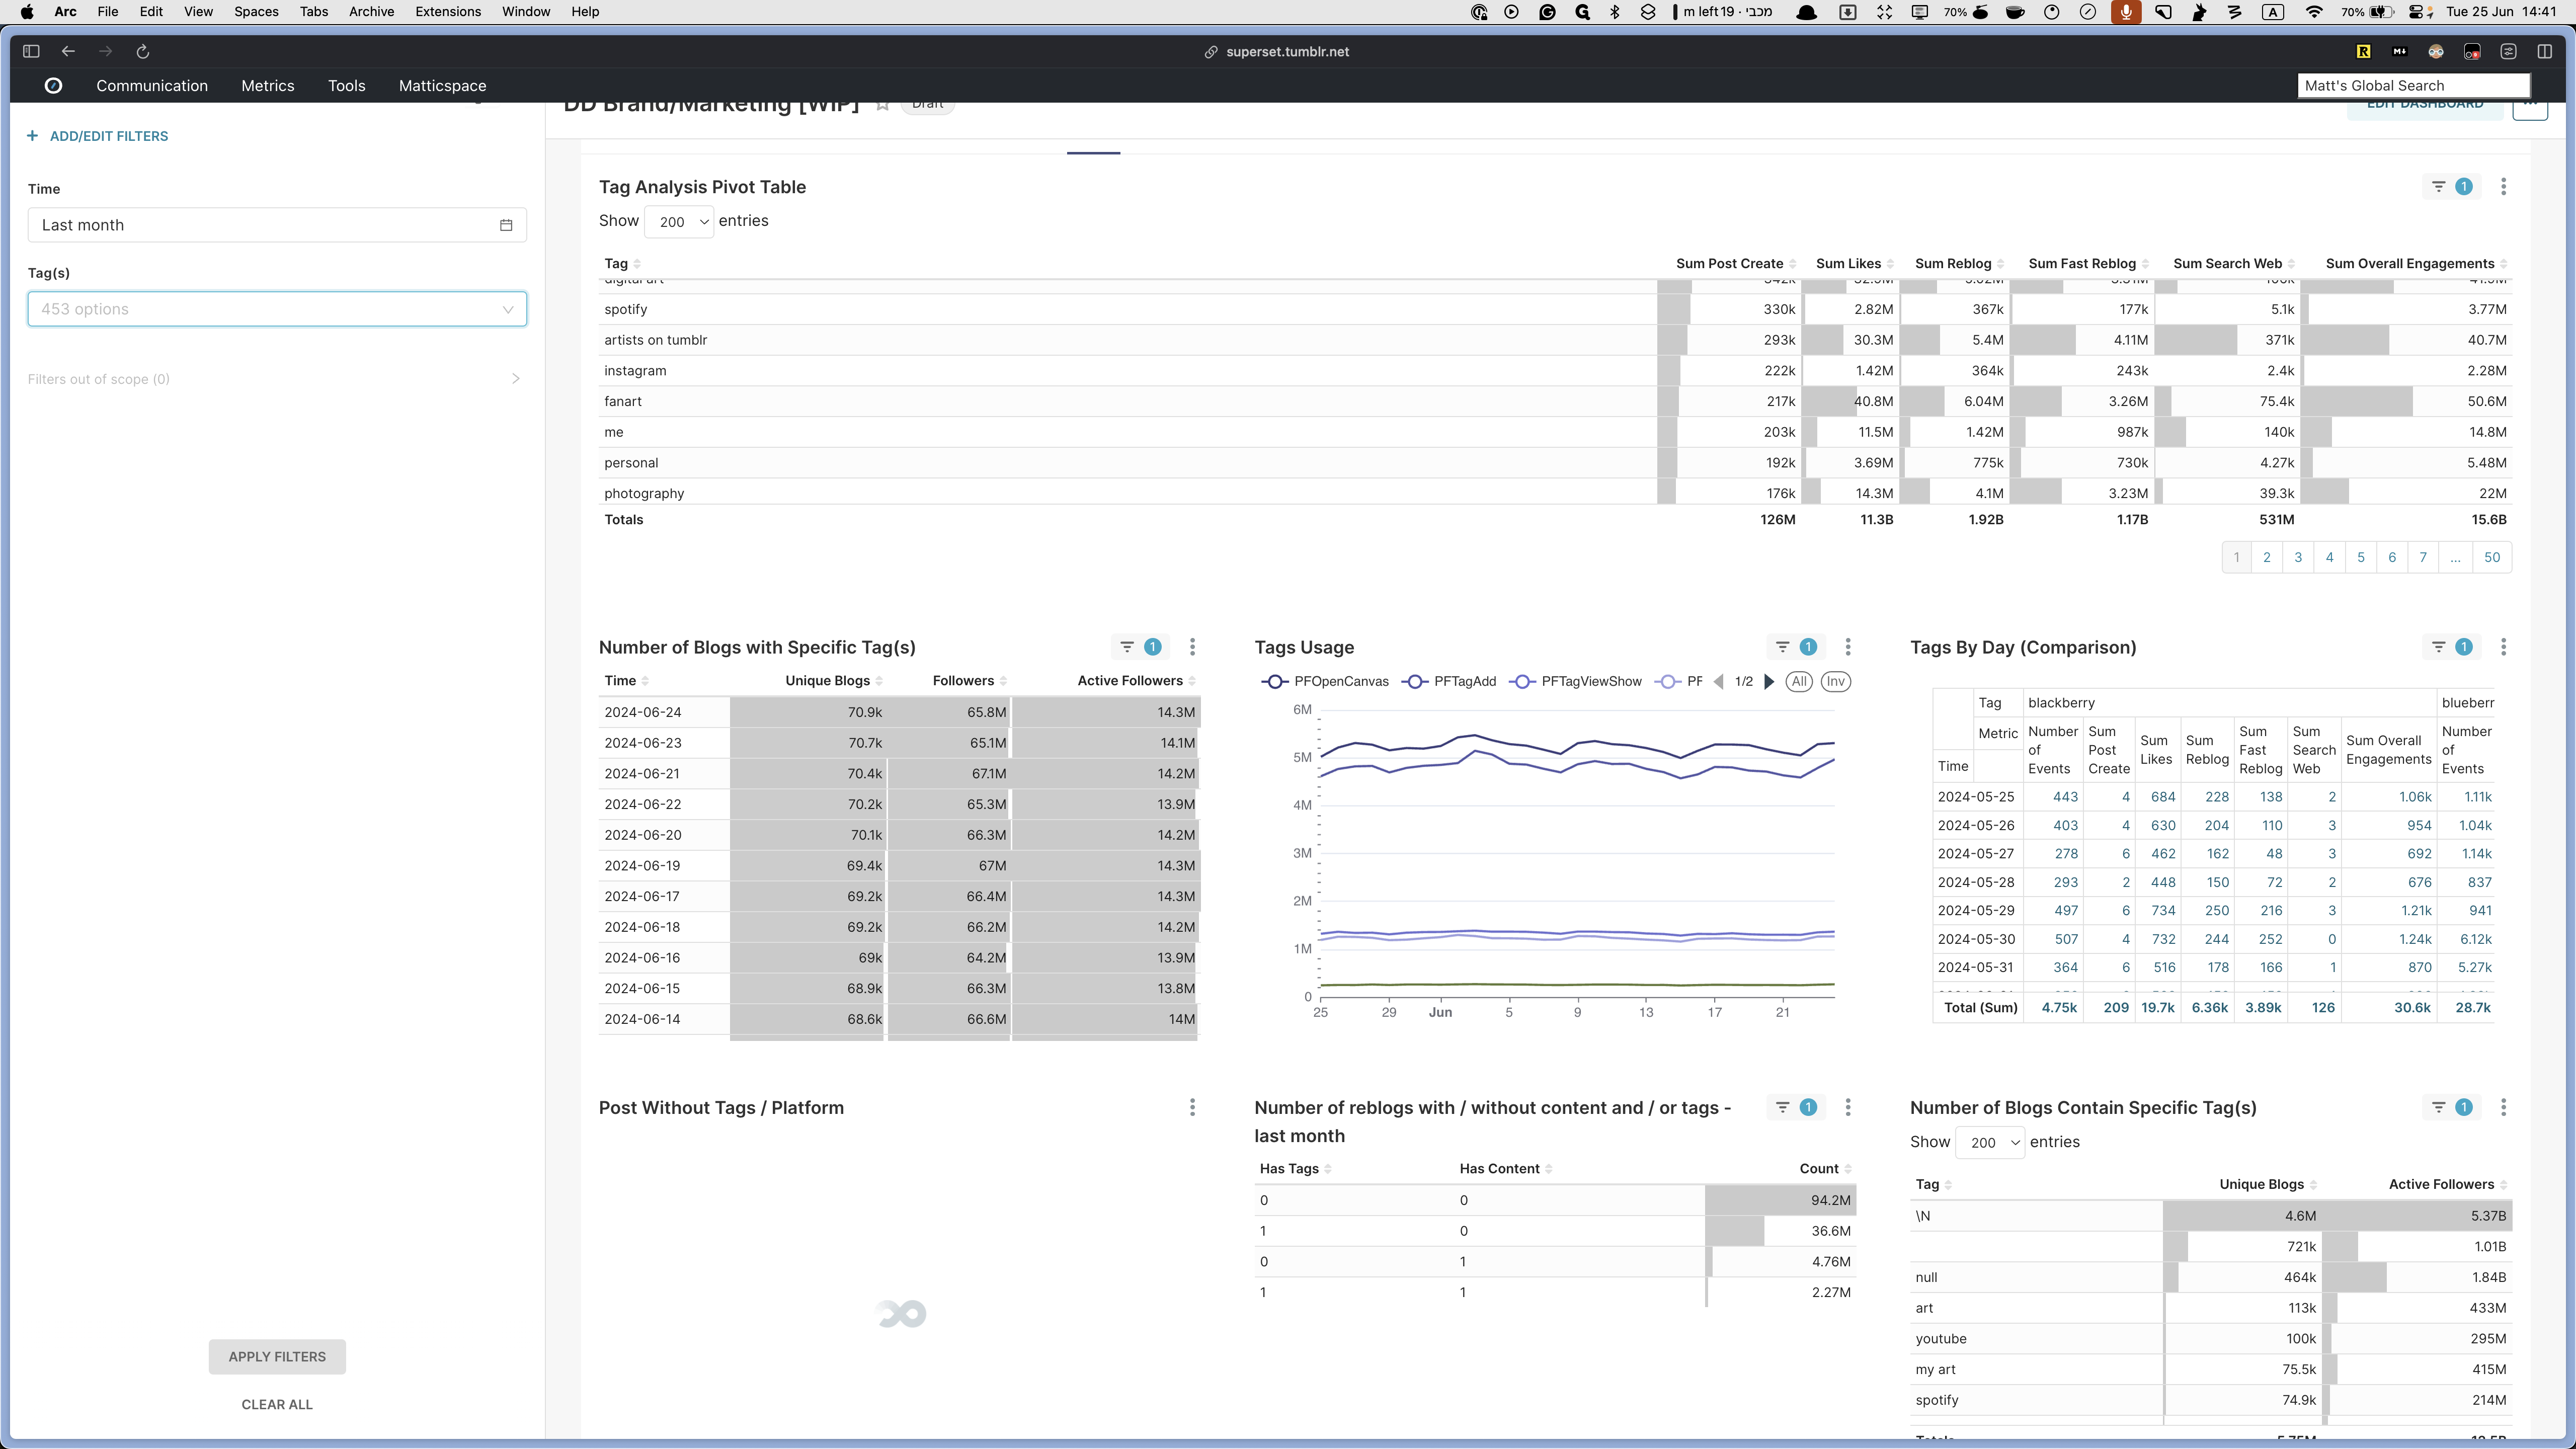
Tags Tab
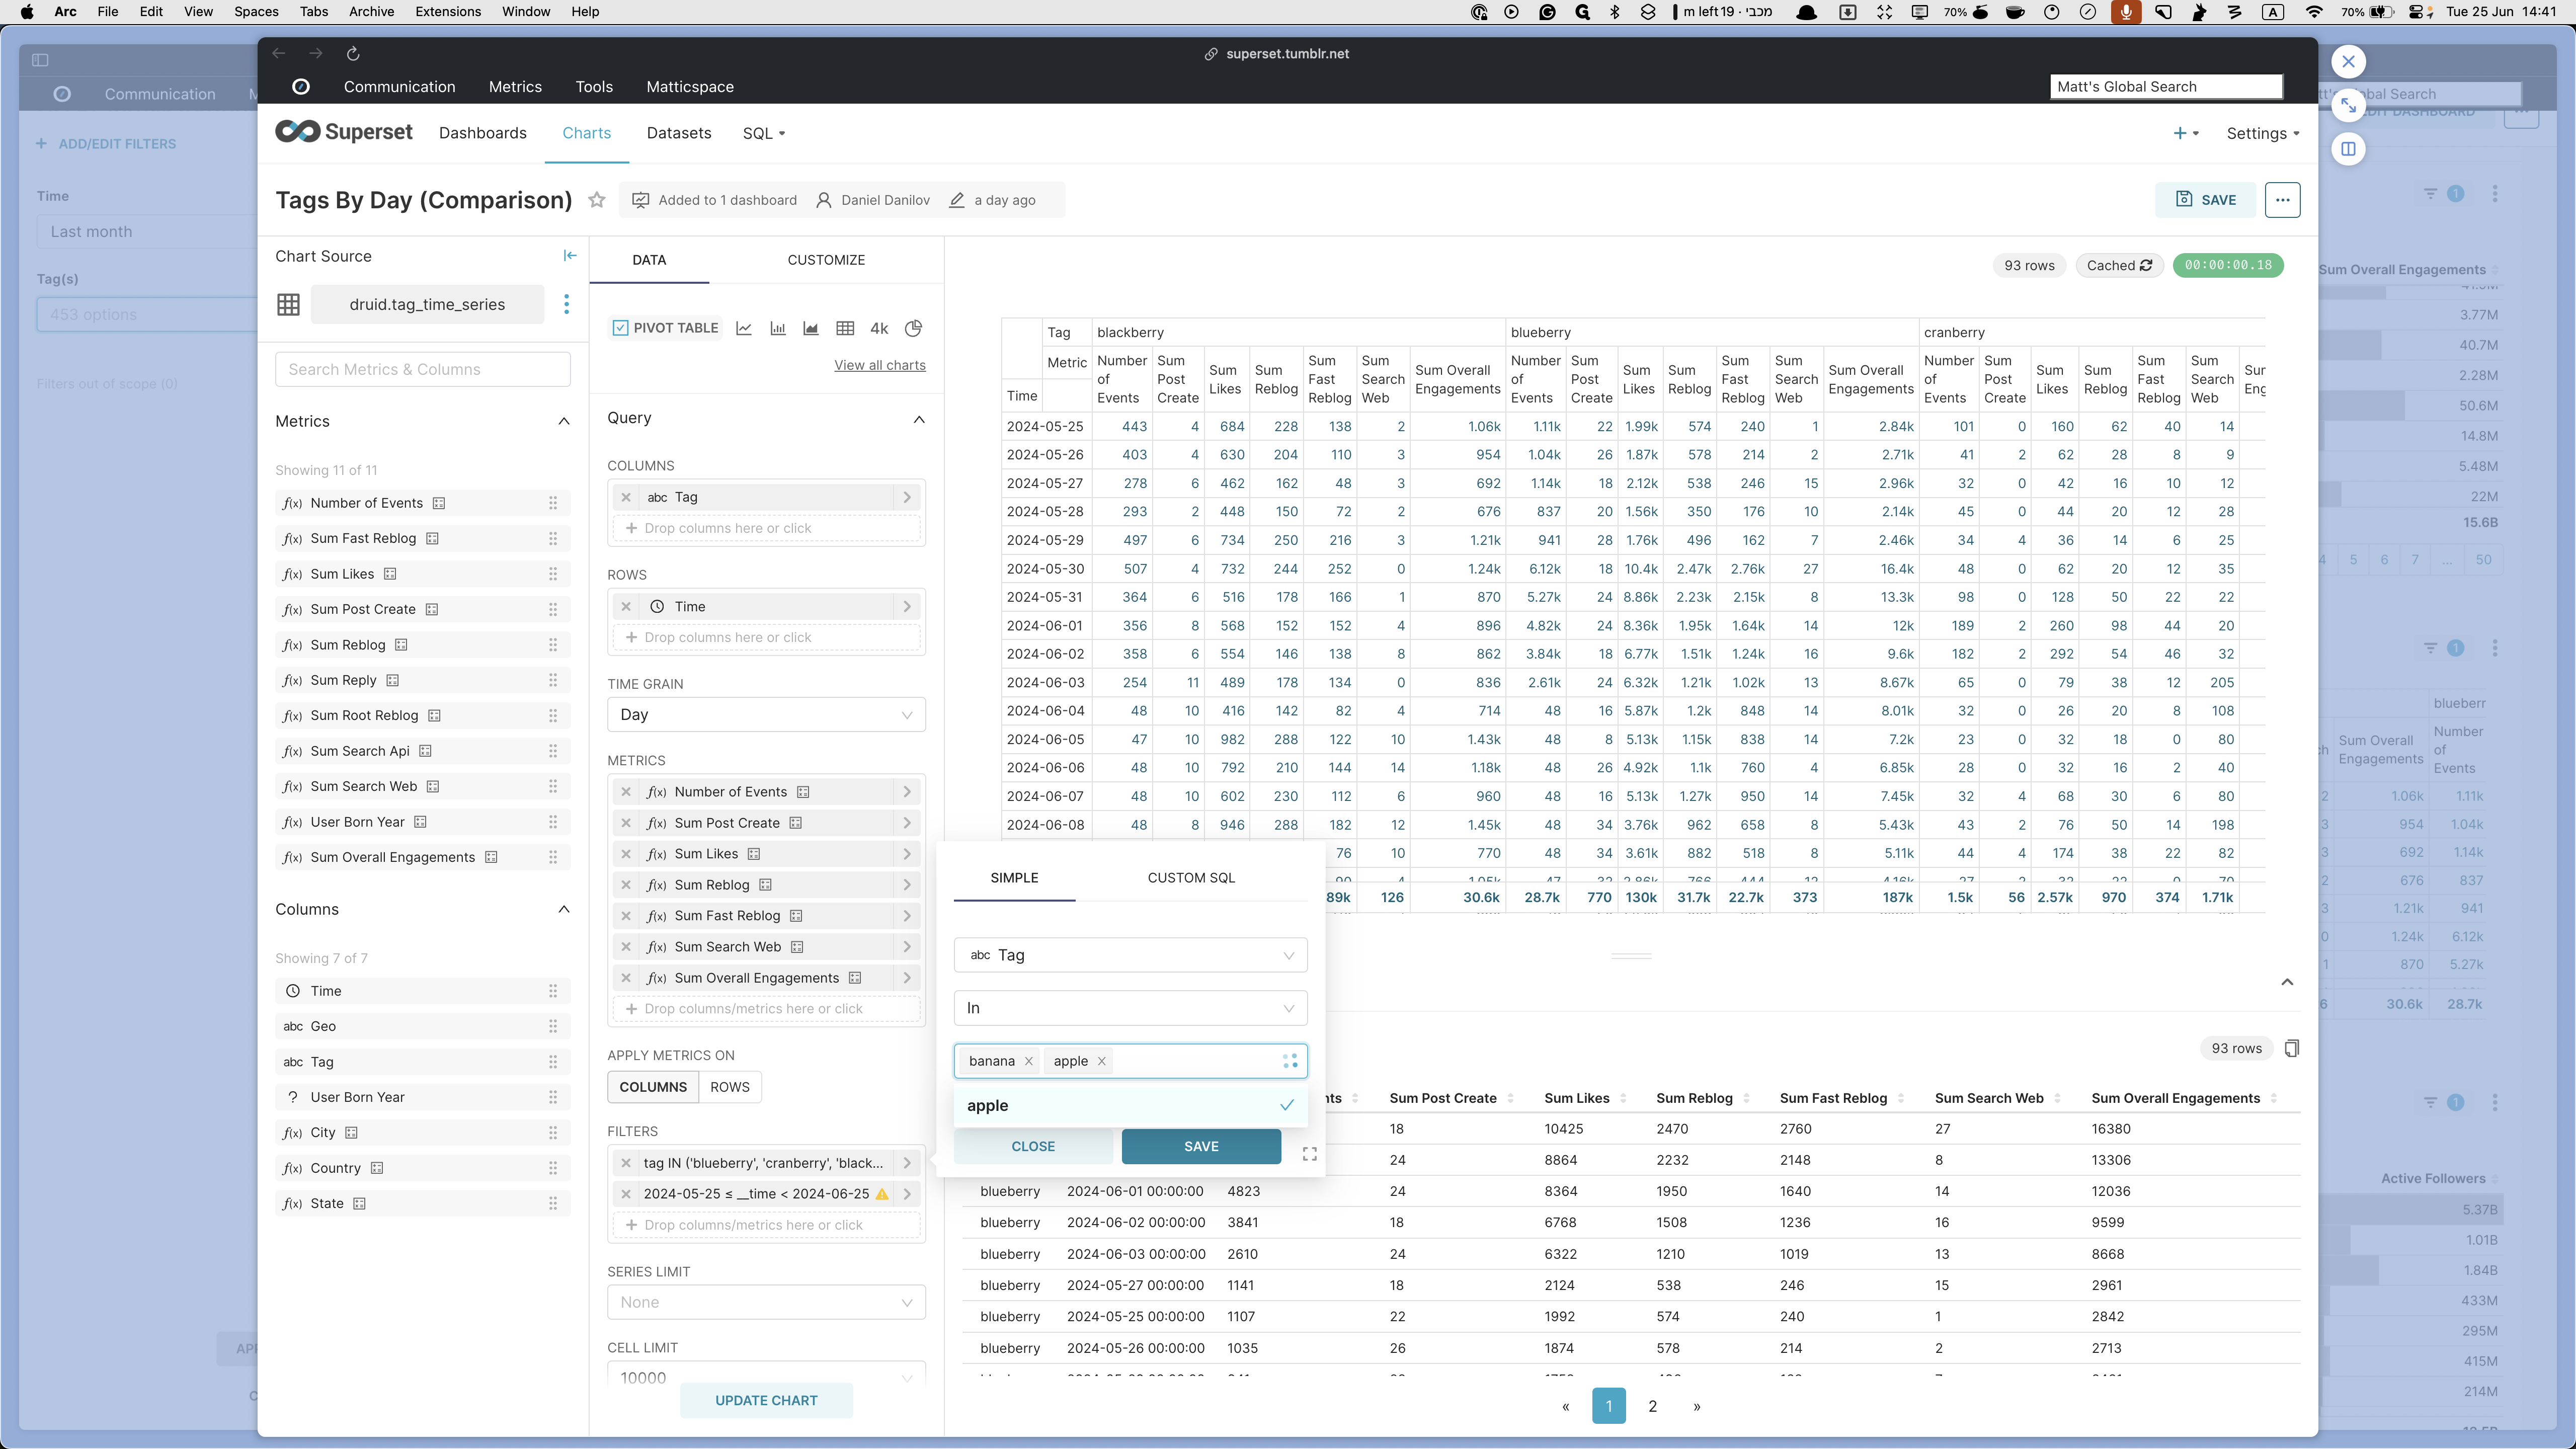
The next tab is the Tags tab, which shows information about tags. This is the tag analysis pivot table and it summarizes some of the data.
(There is a separate Tag Analysis dashboard that goes into more detail, and this post explains how to use it.)
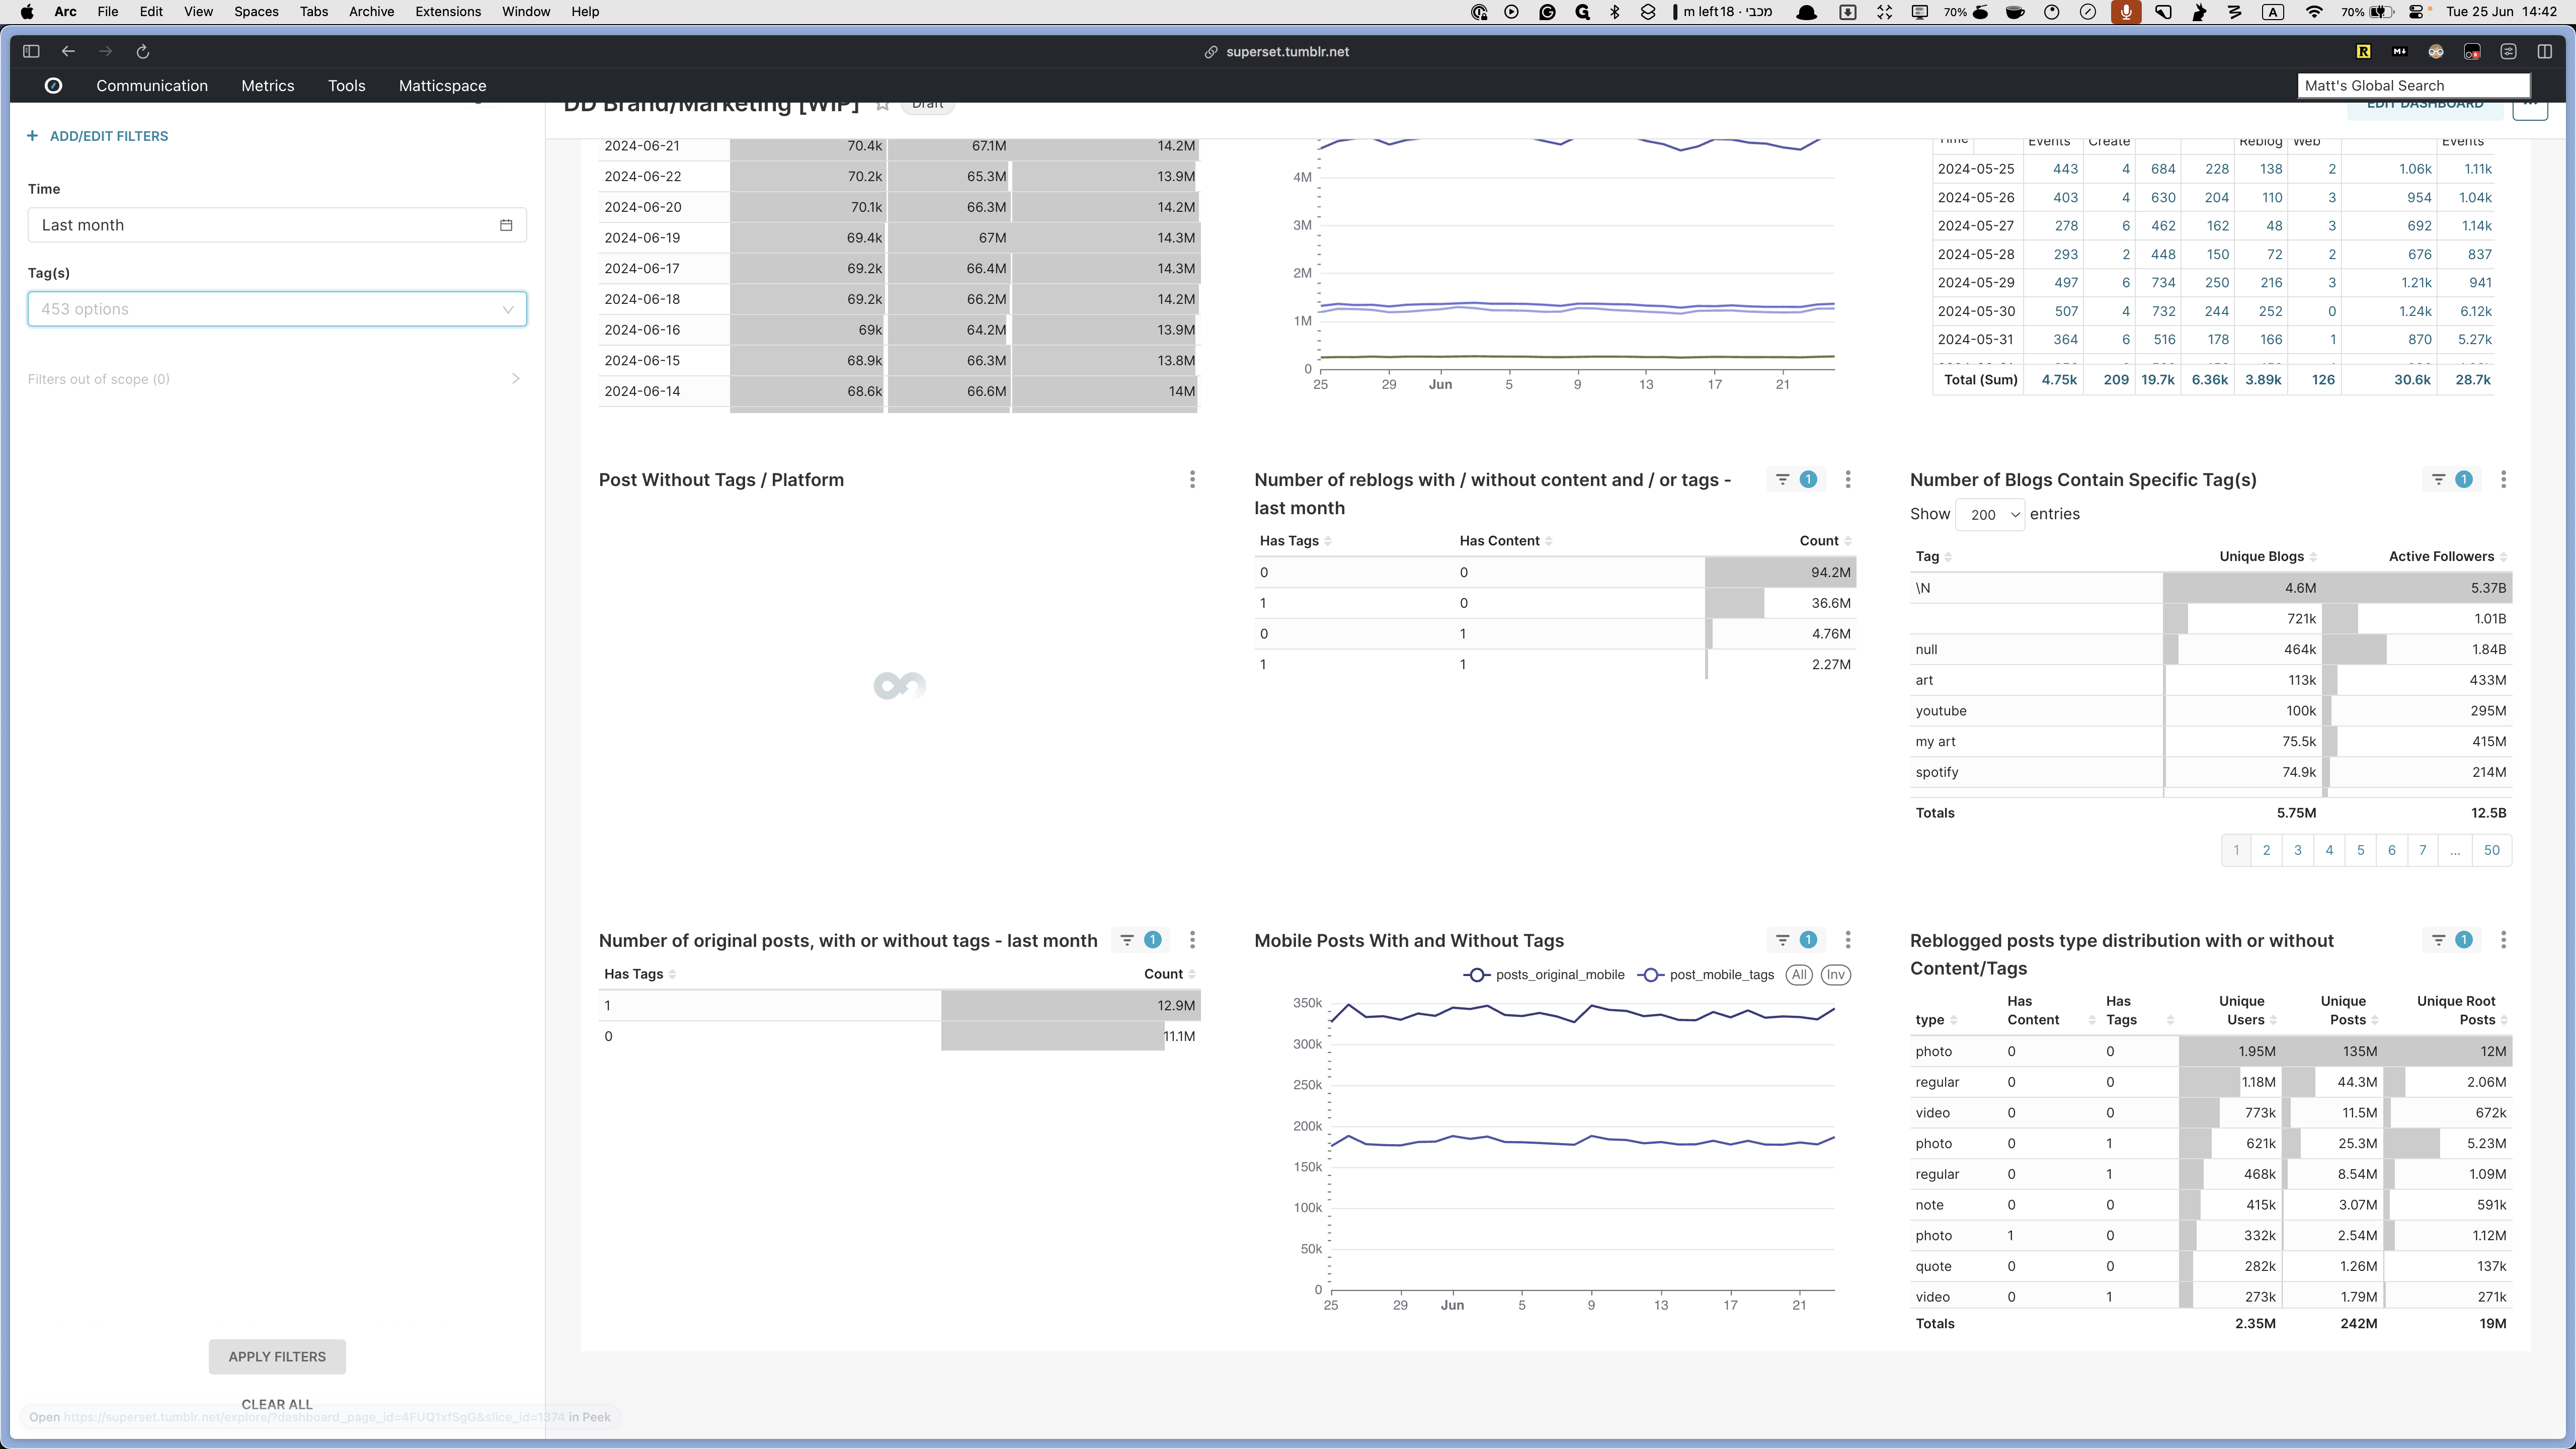
In this tab, you can see the number of blogs with specific types, their followers, active followers, tag usage in various areas, and tags by day comparison. The totals will be broken down per day for the last month. Additionally, you can see the number of reblogs with or without tags, and mobile posts with and without tags at the bottom. You can also view the distribution of reblog posts by type. Essentially, there is a detailed breakdown of posts, whether they have tags or not.
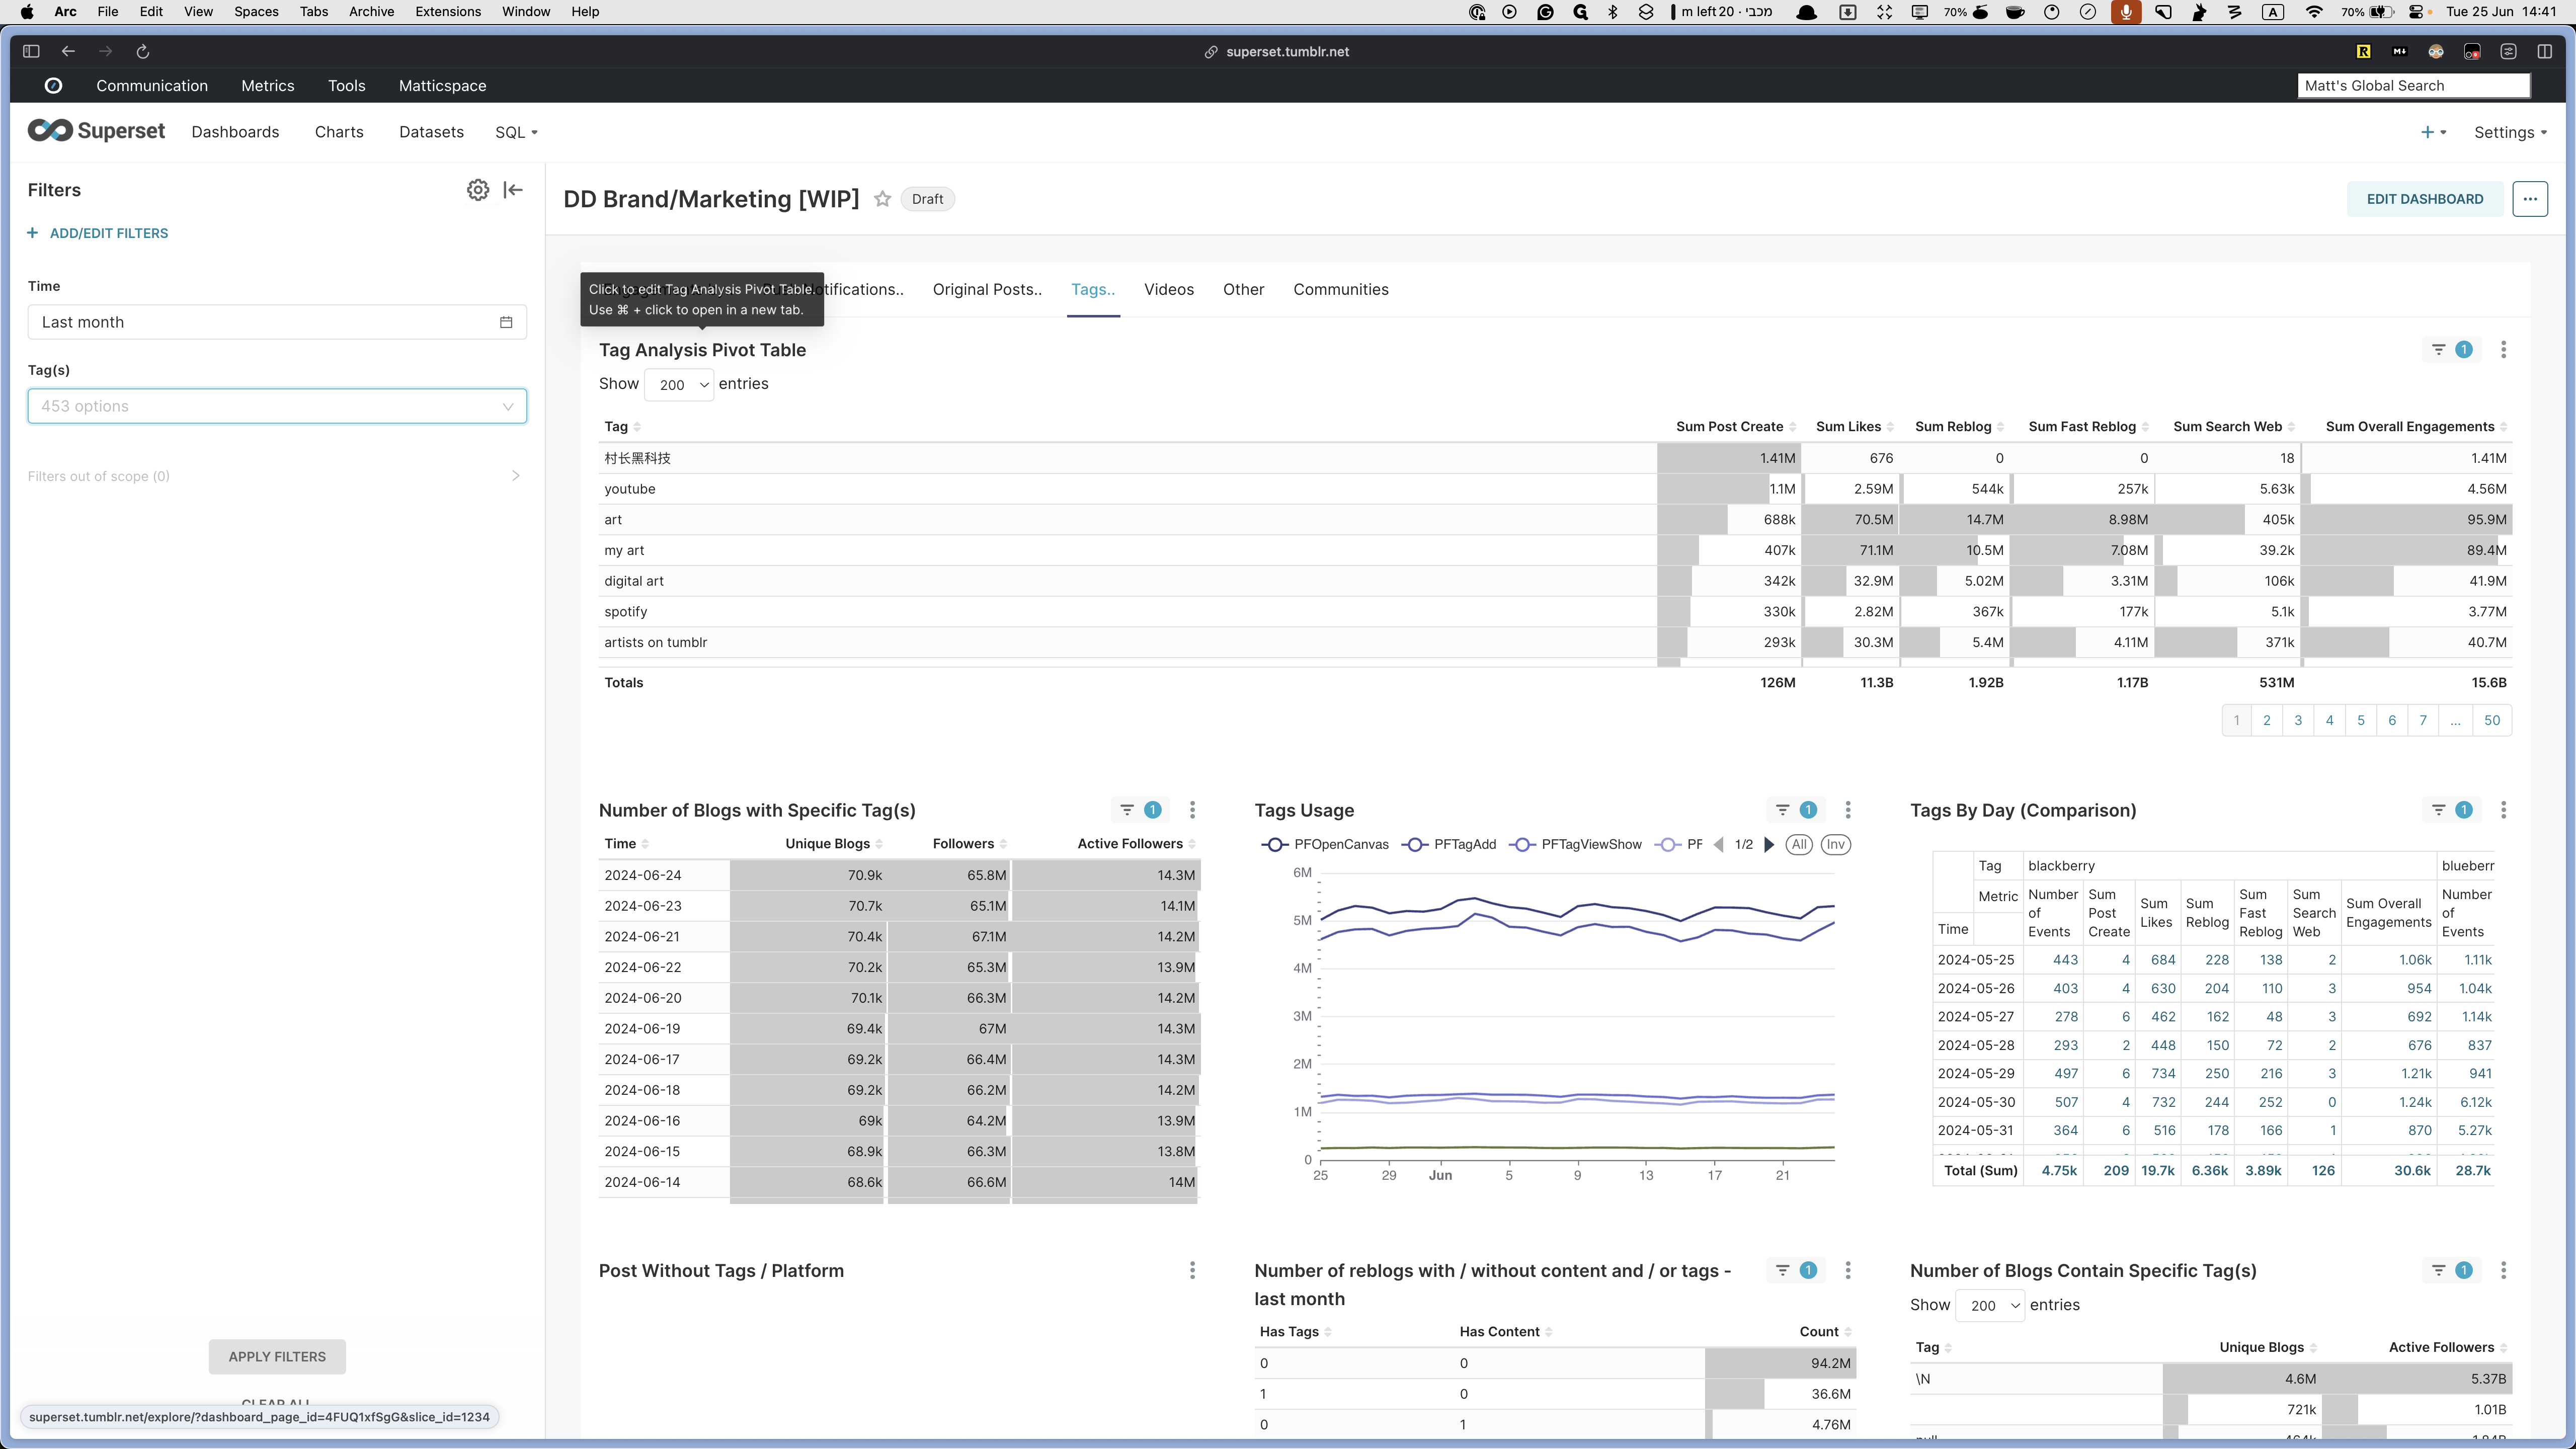

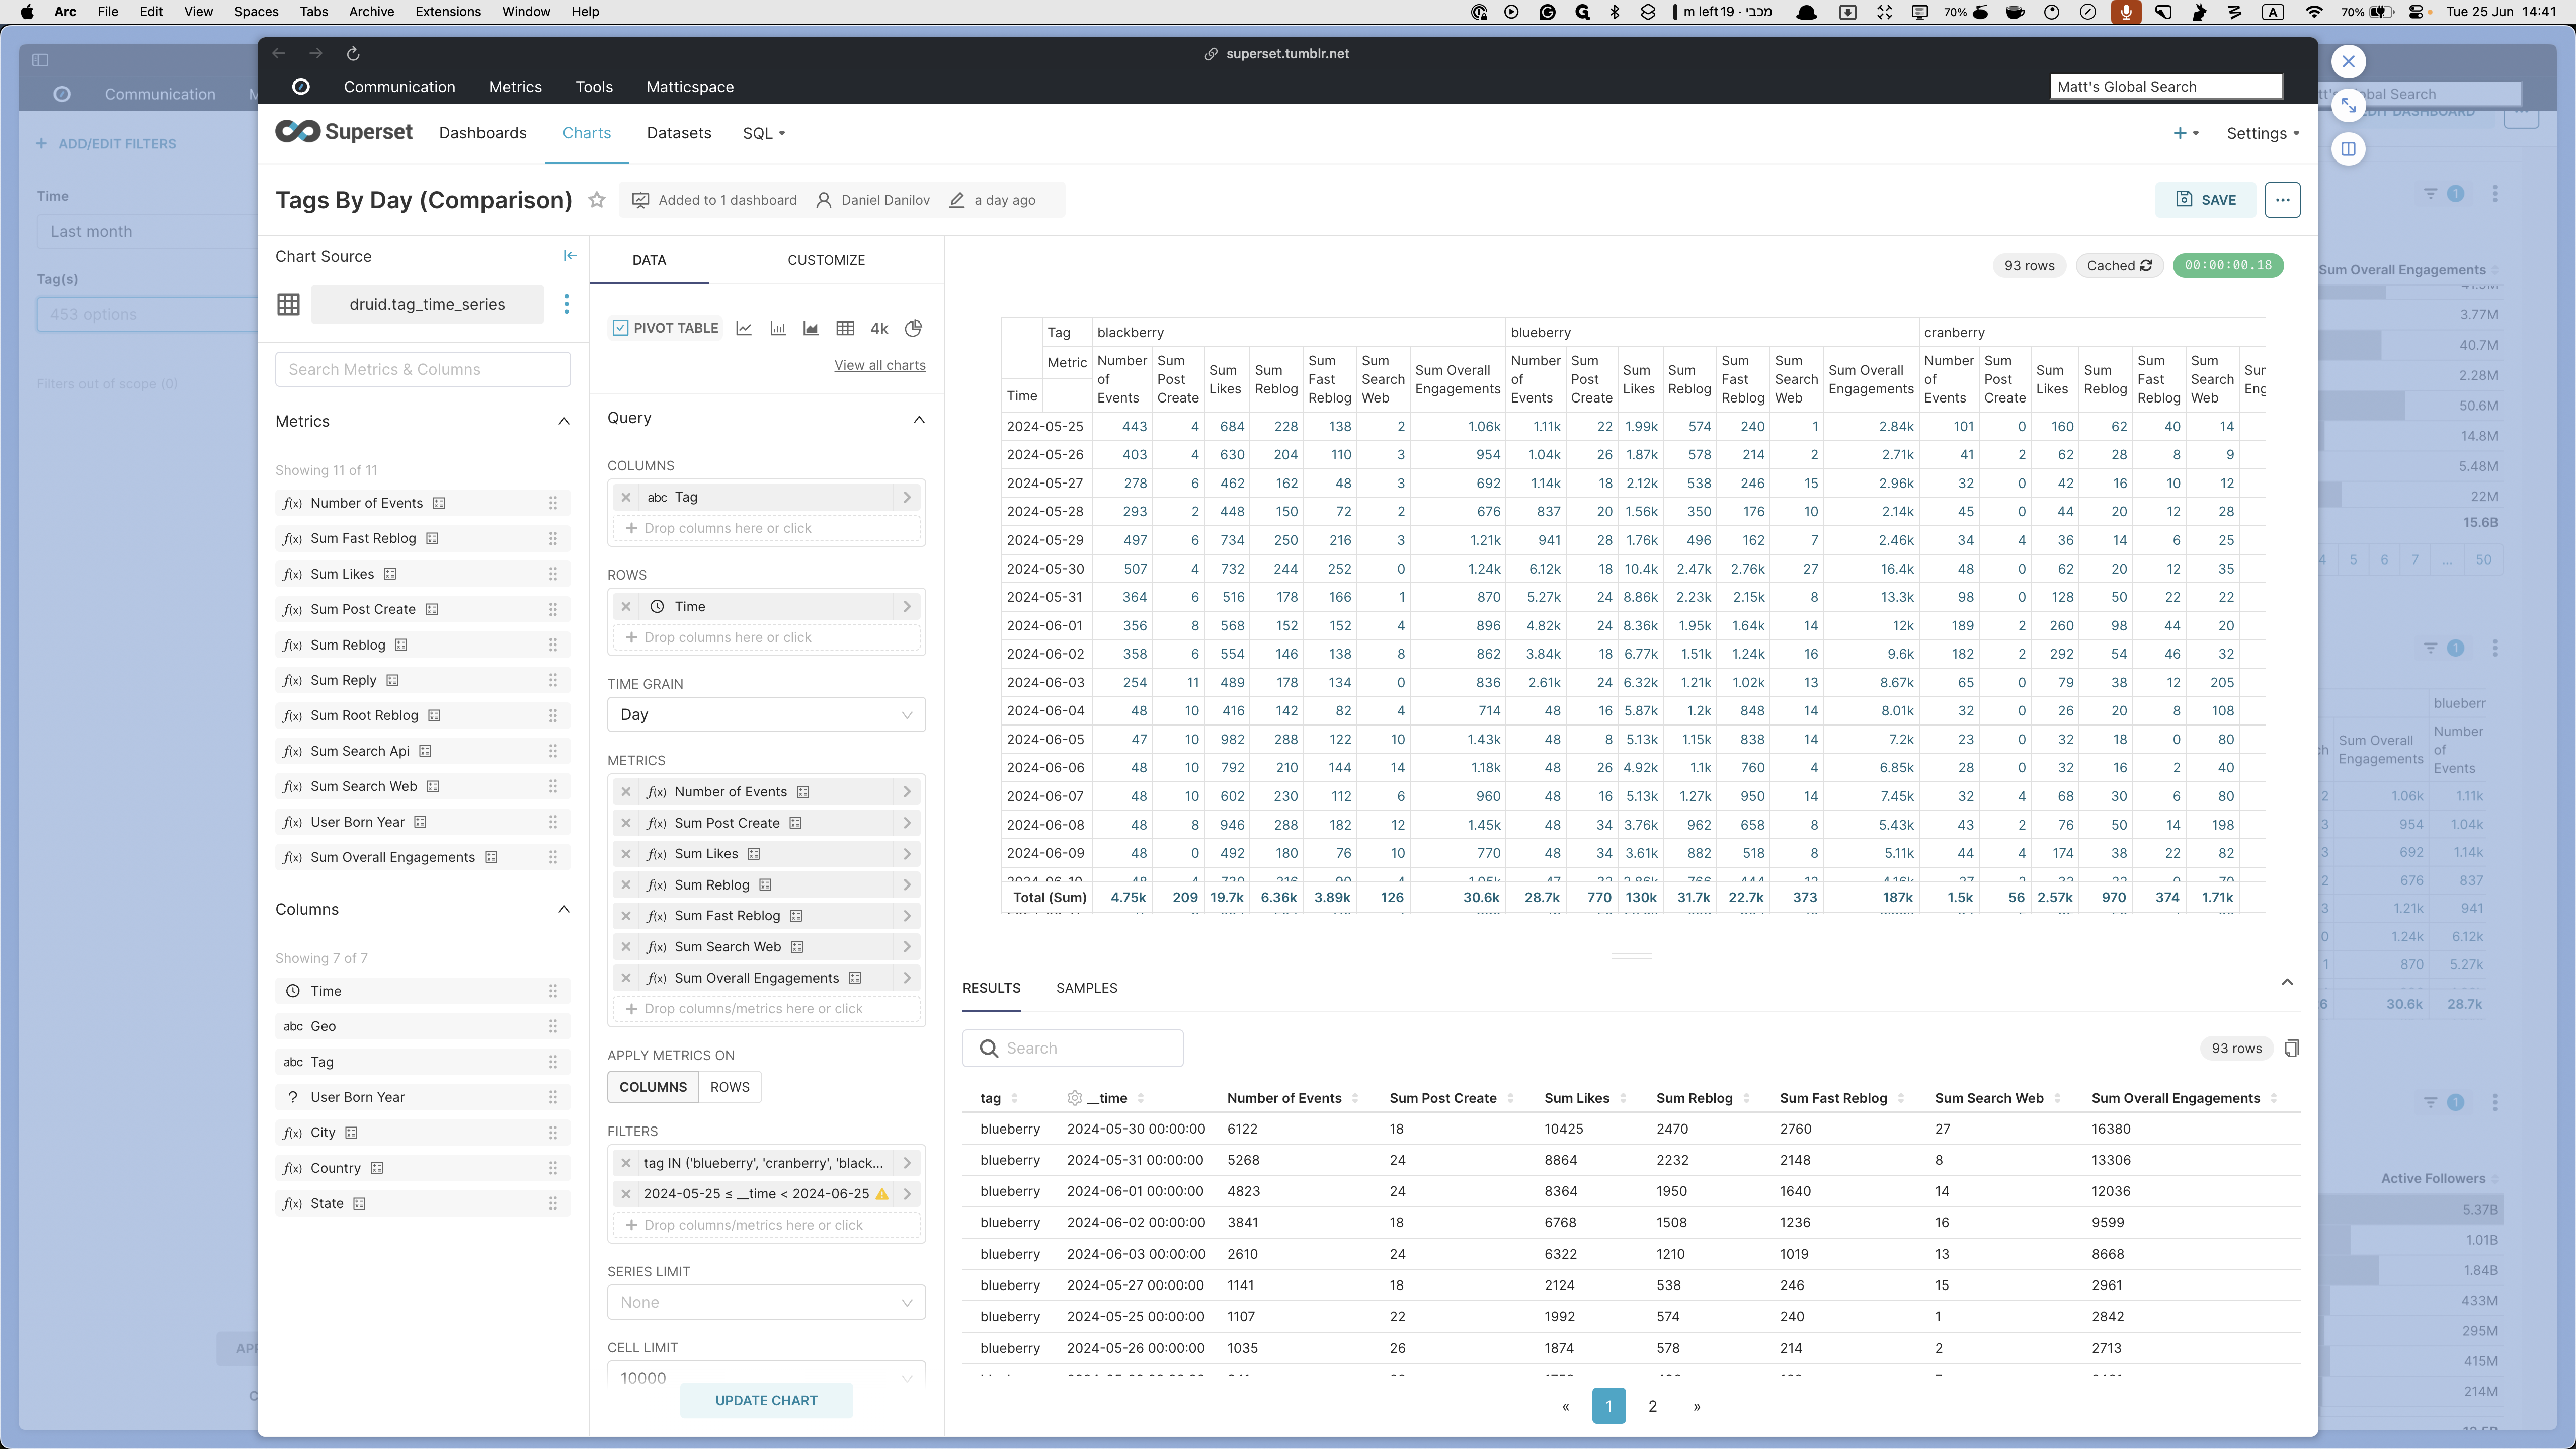
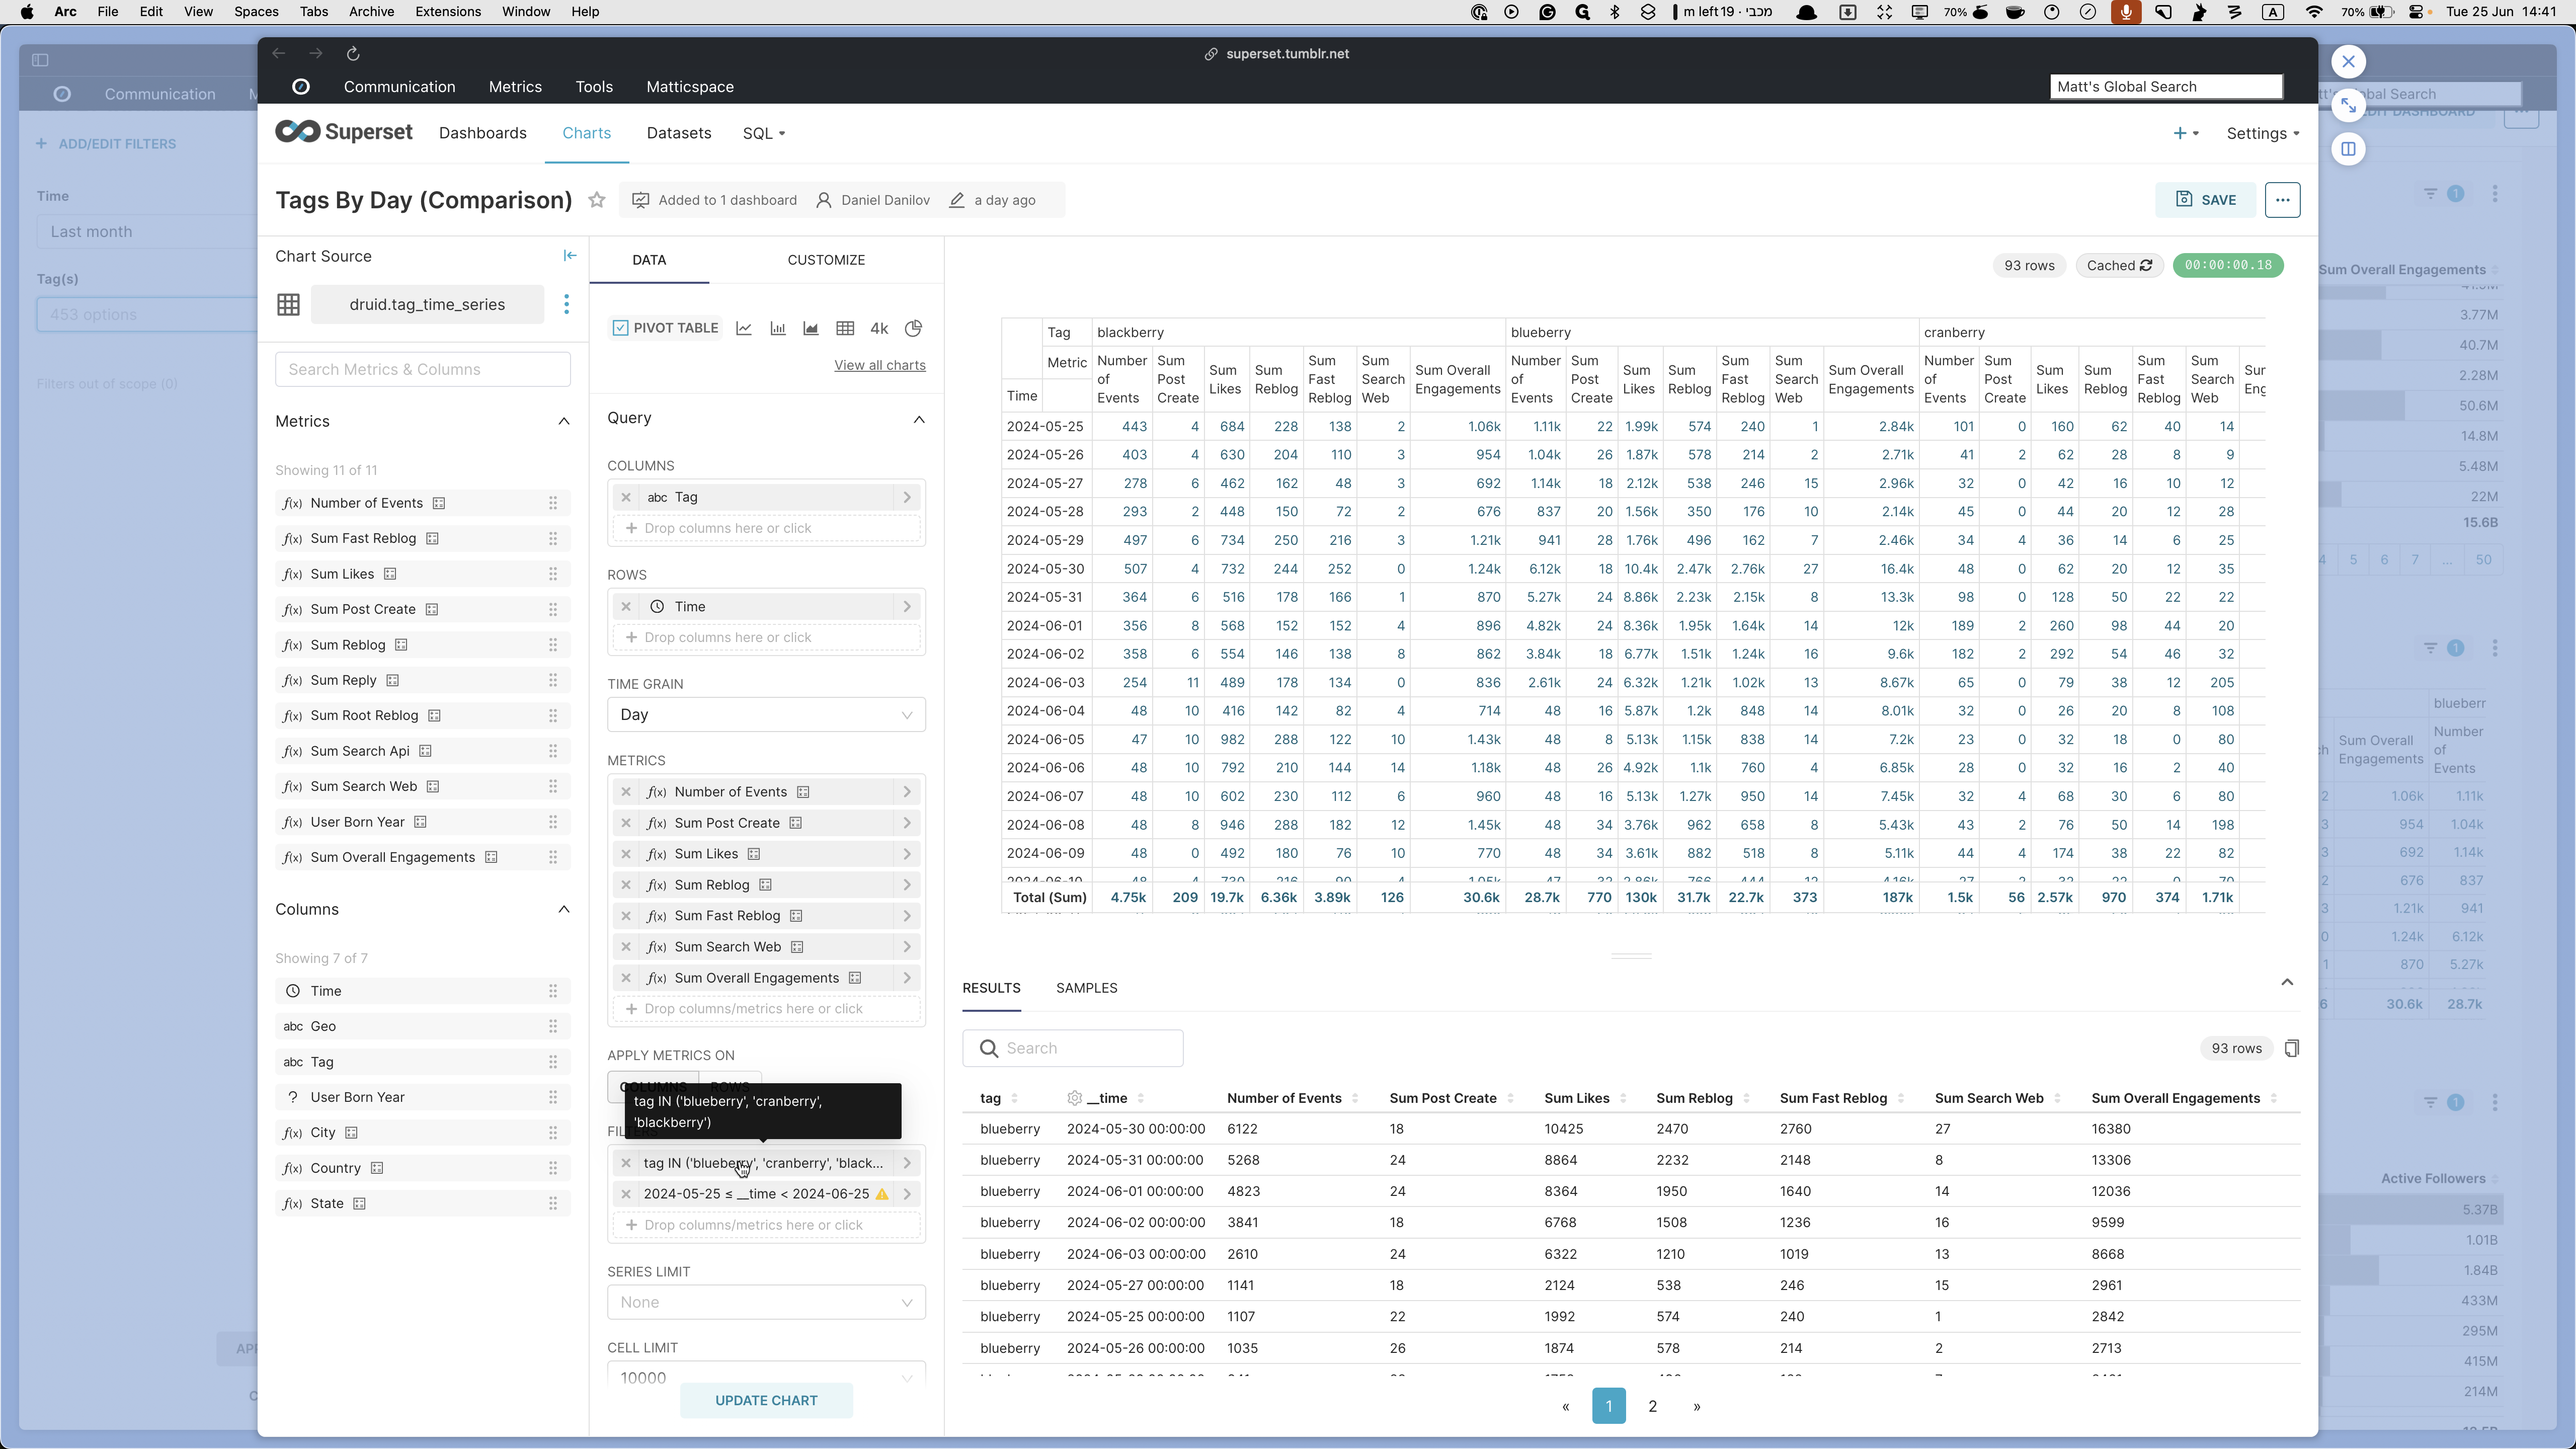
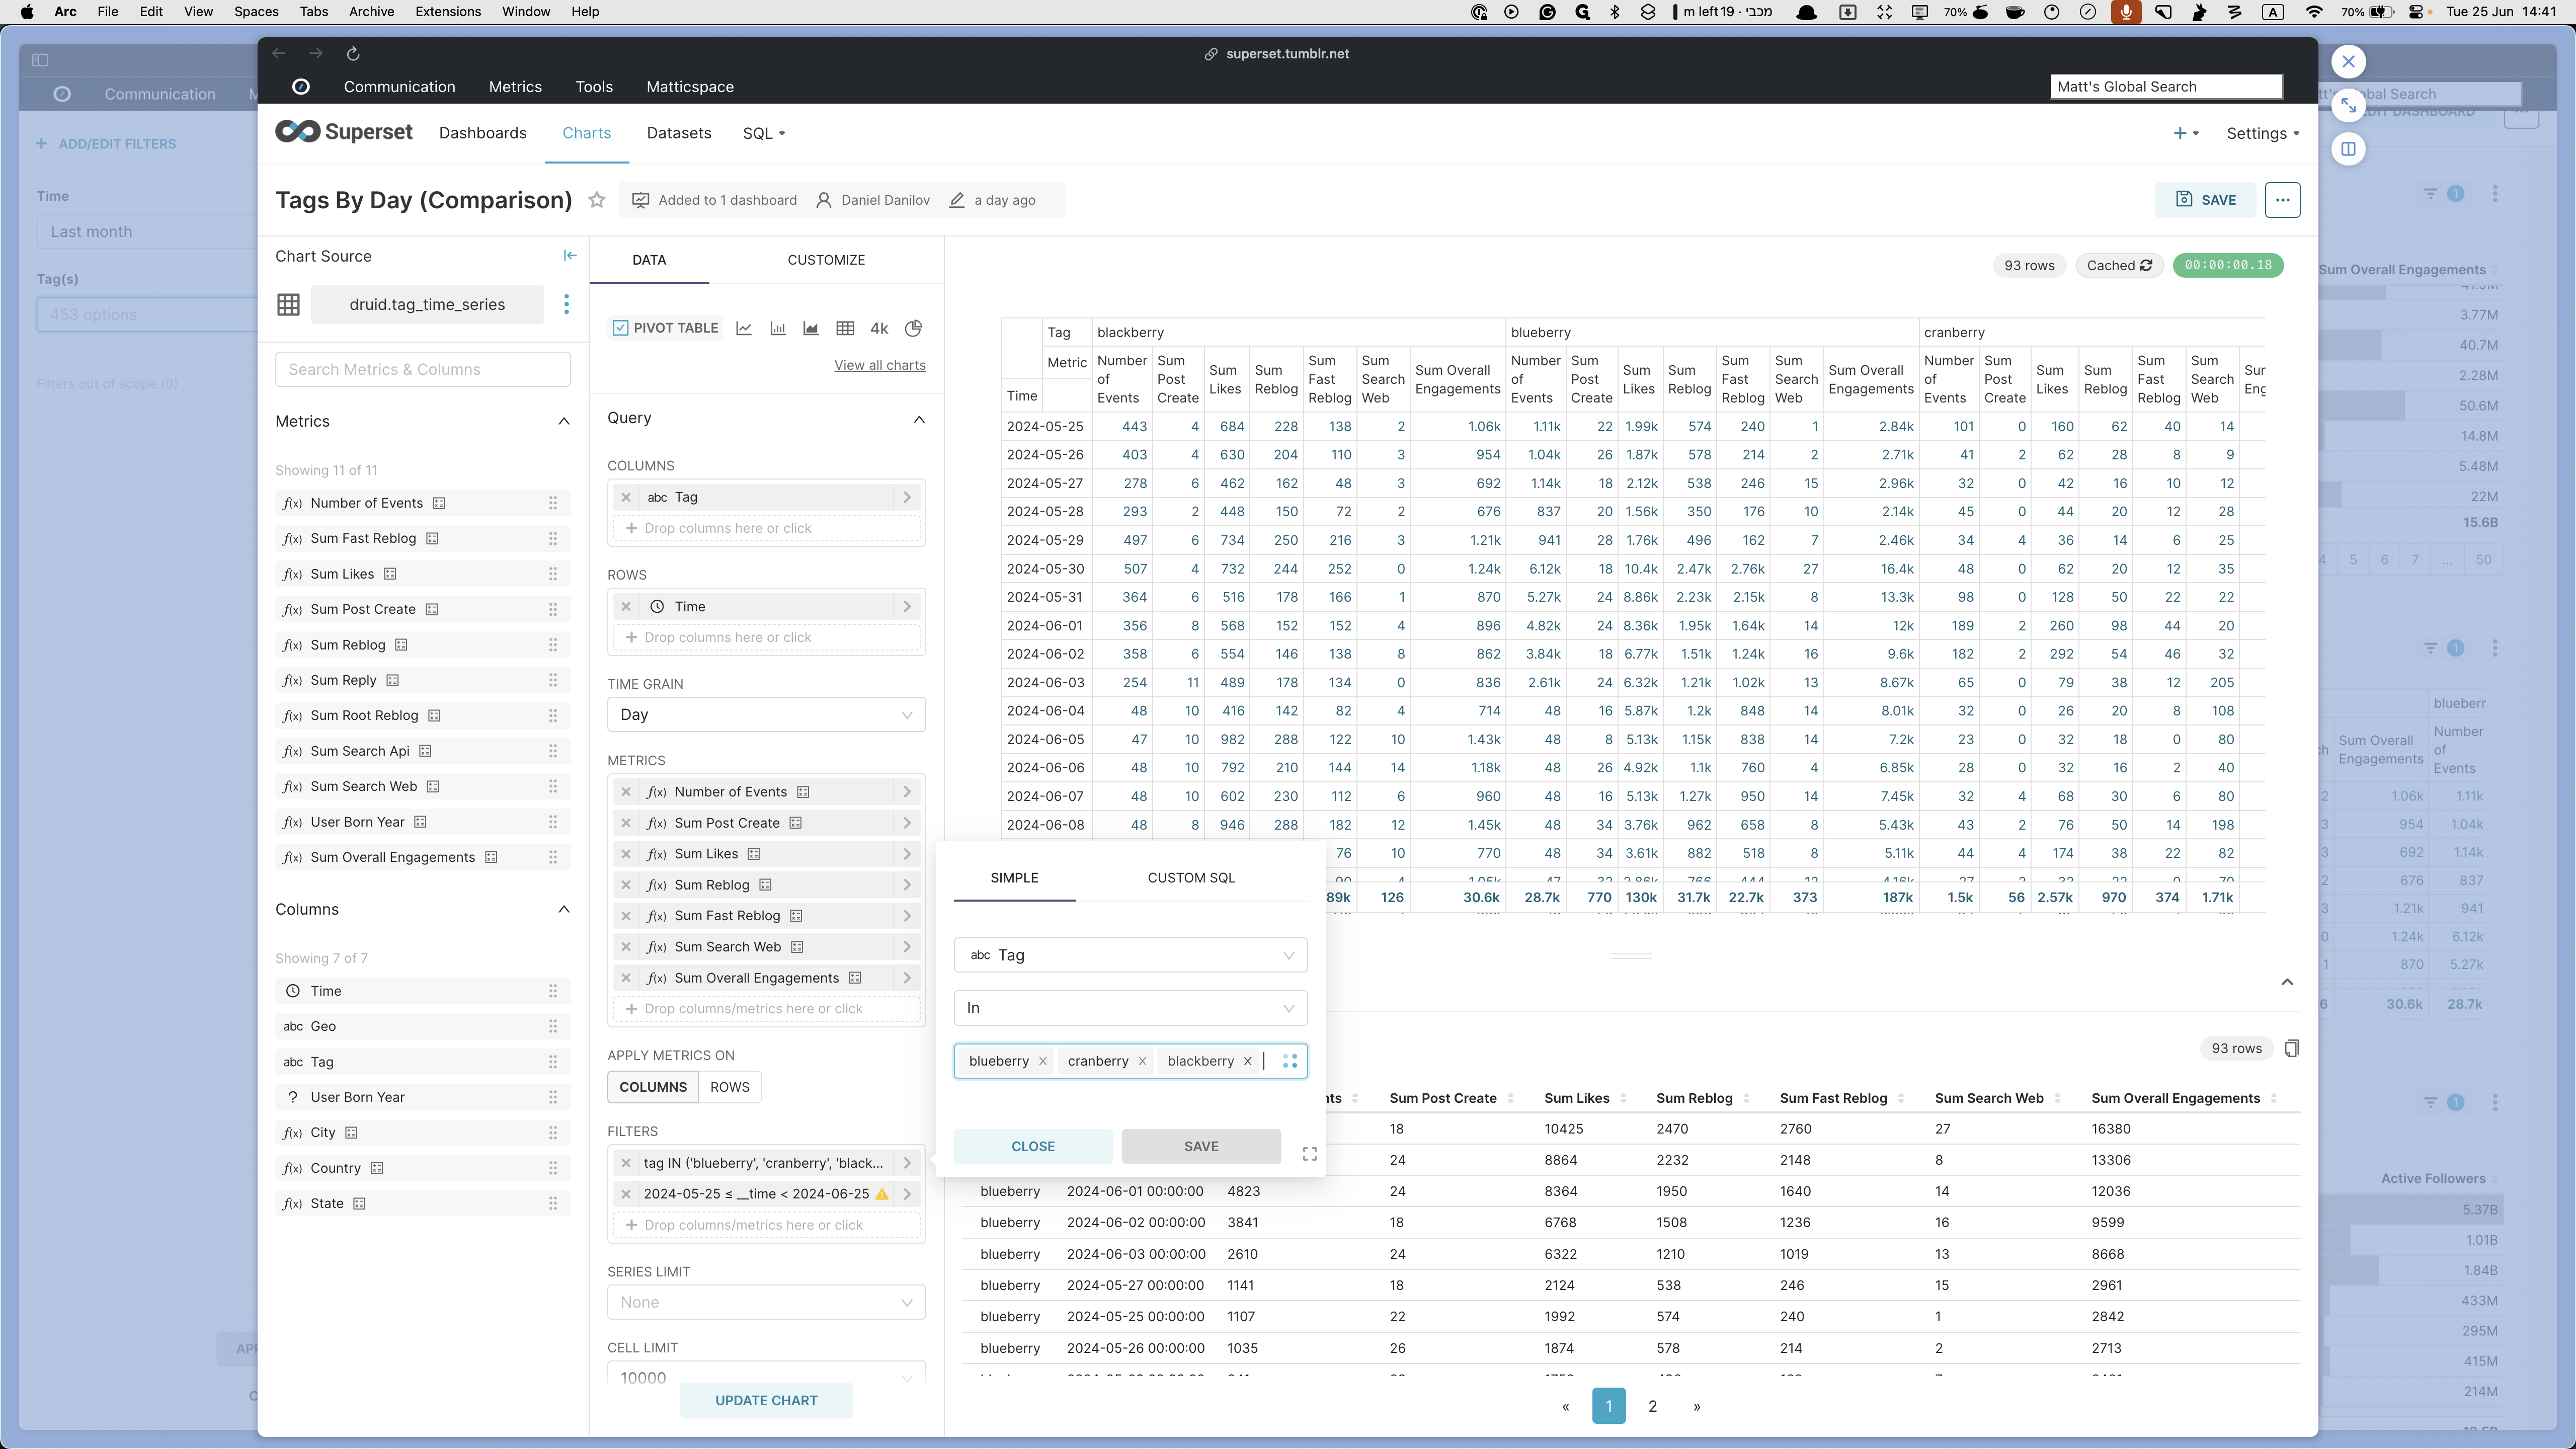
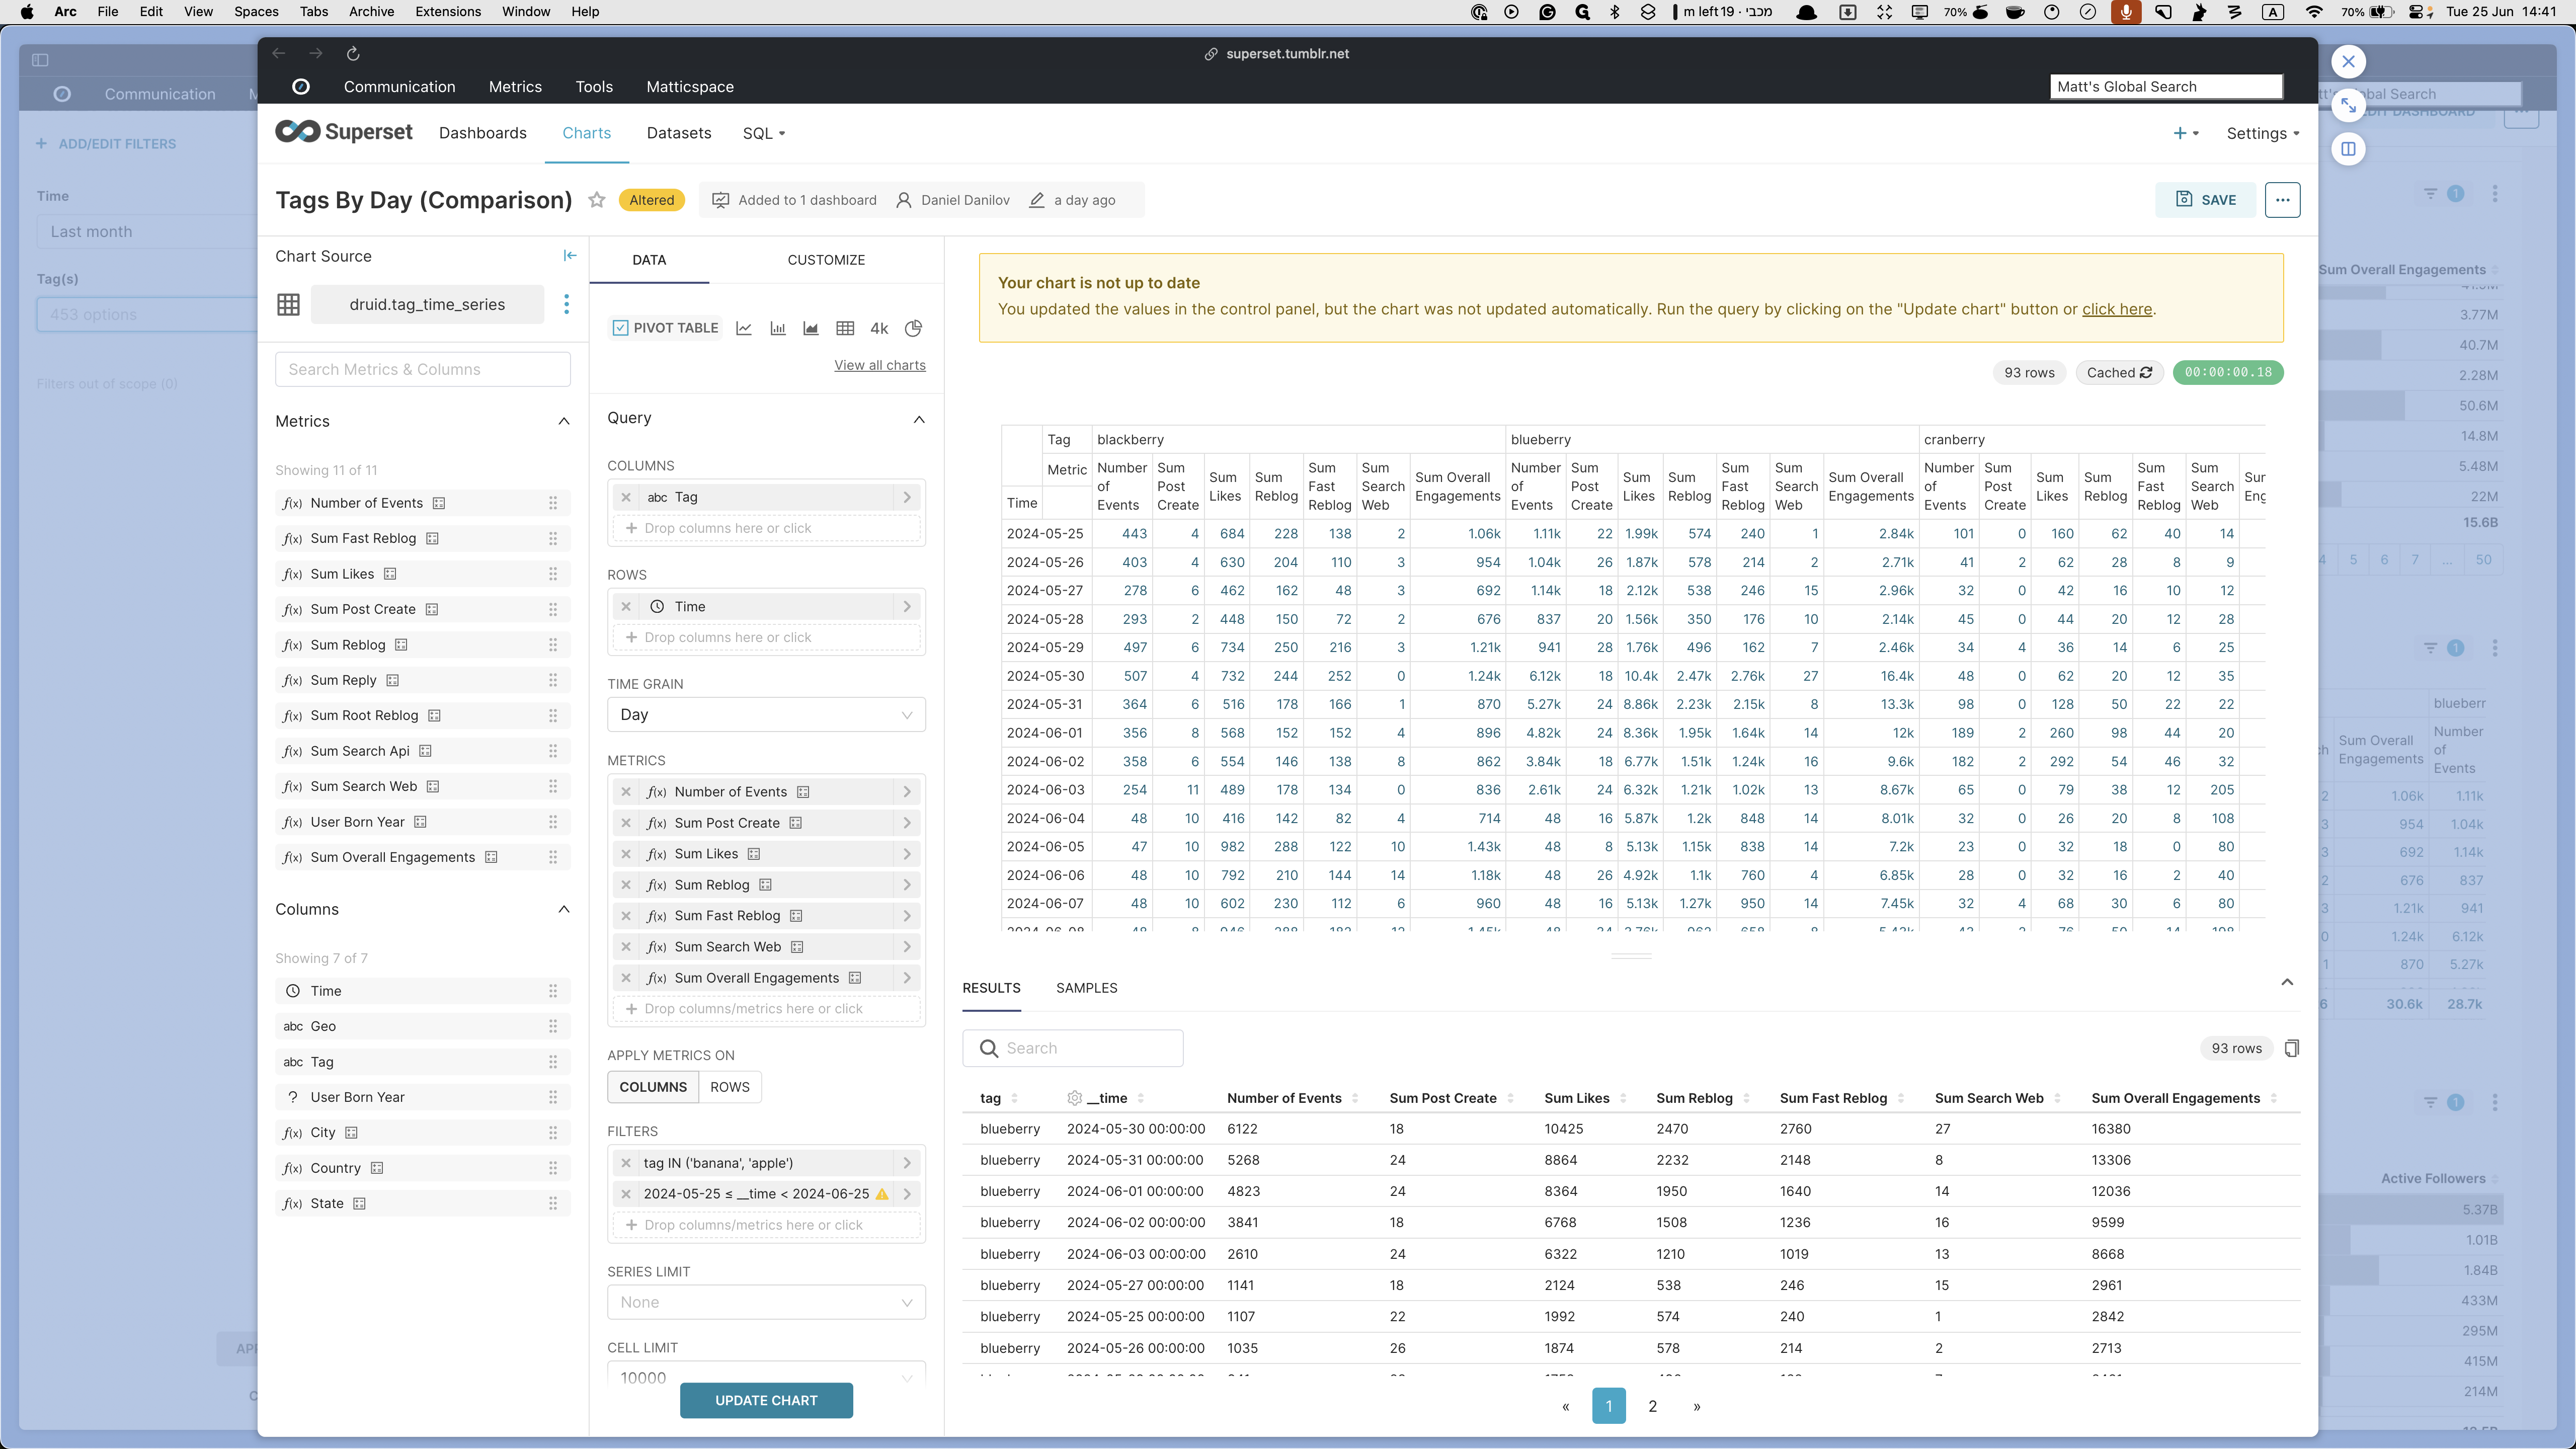
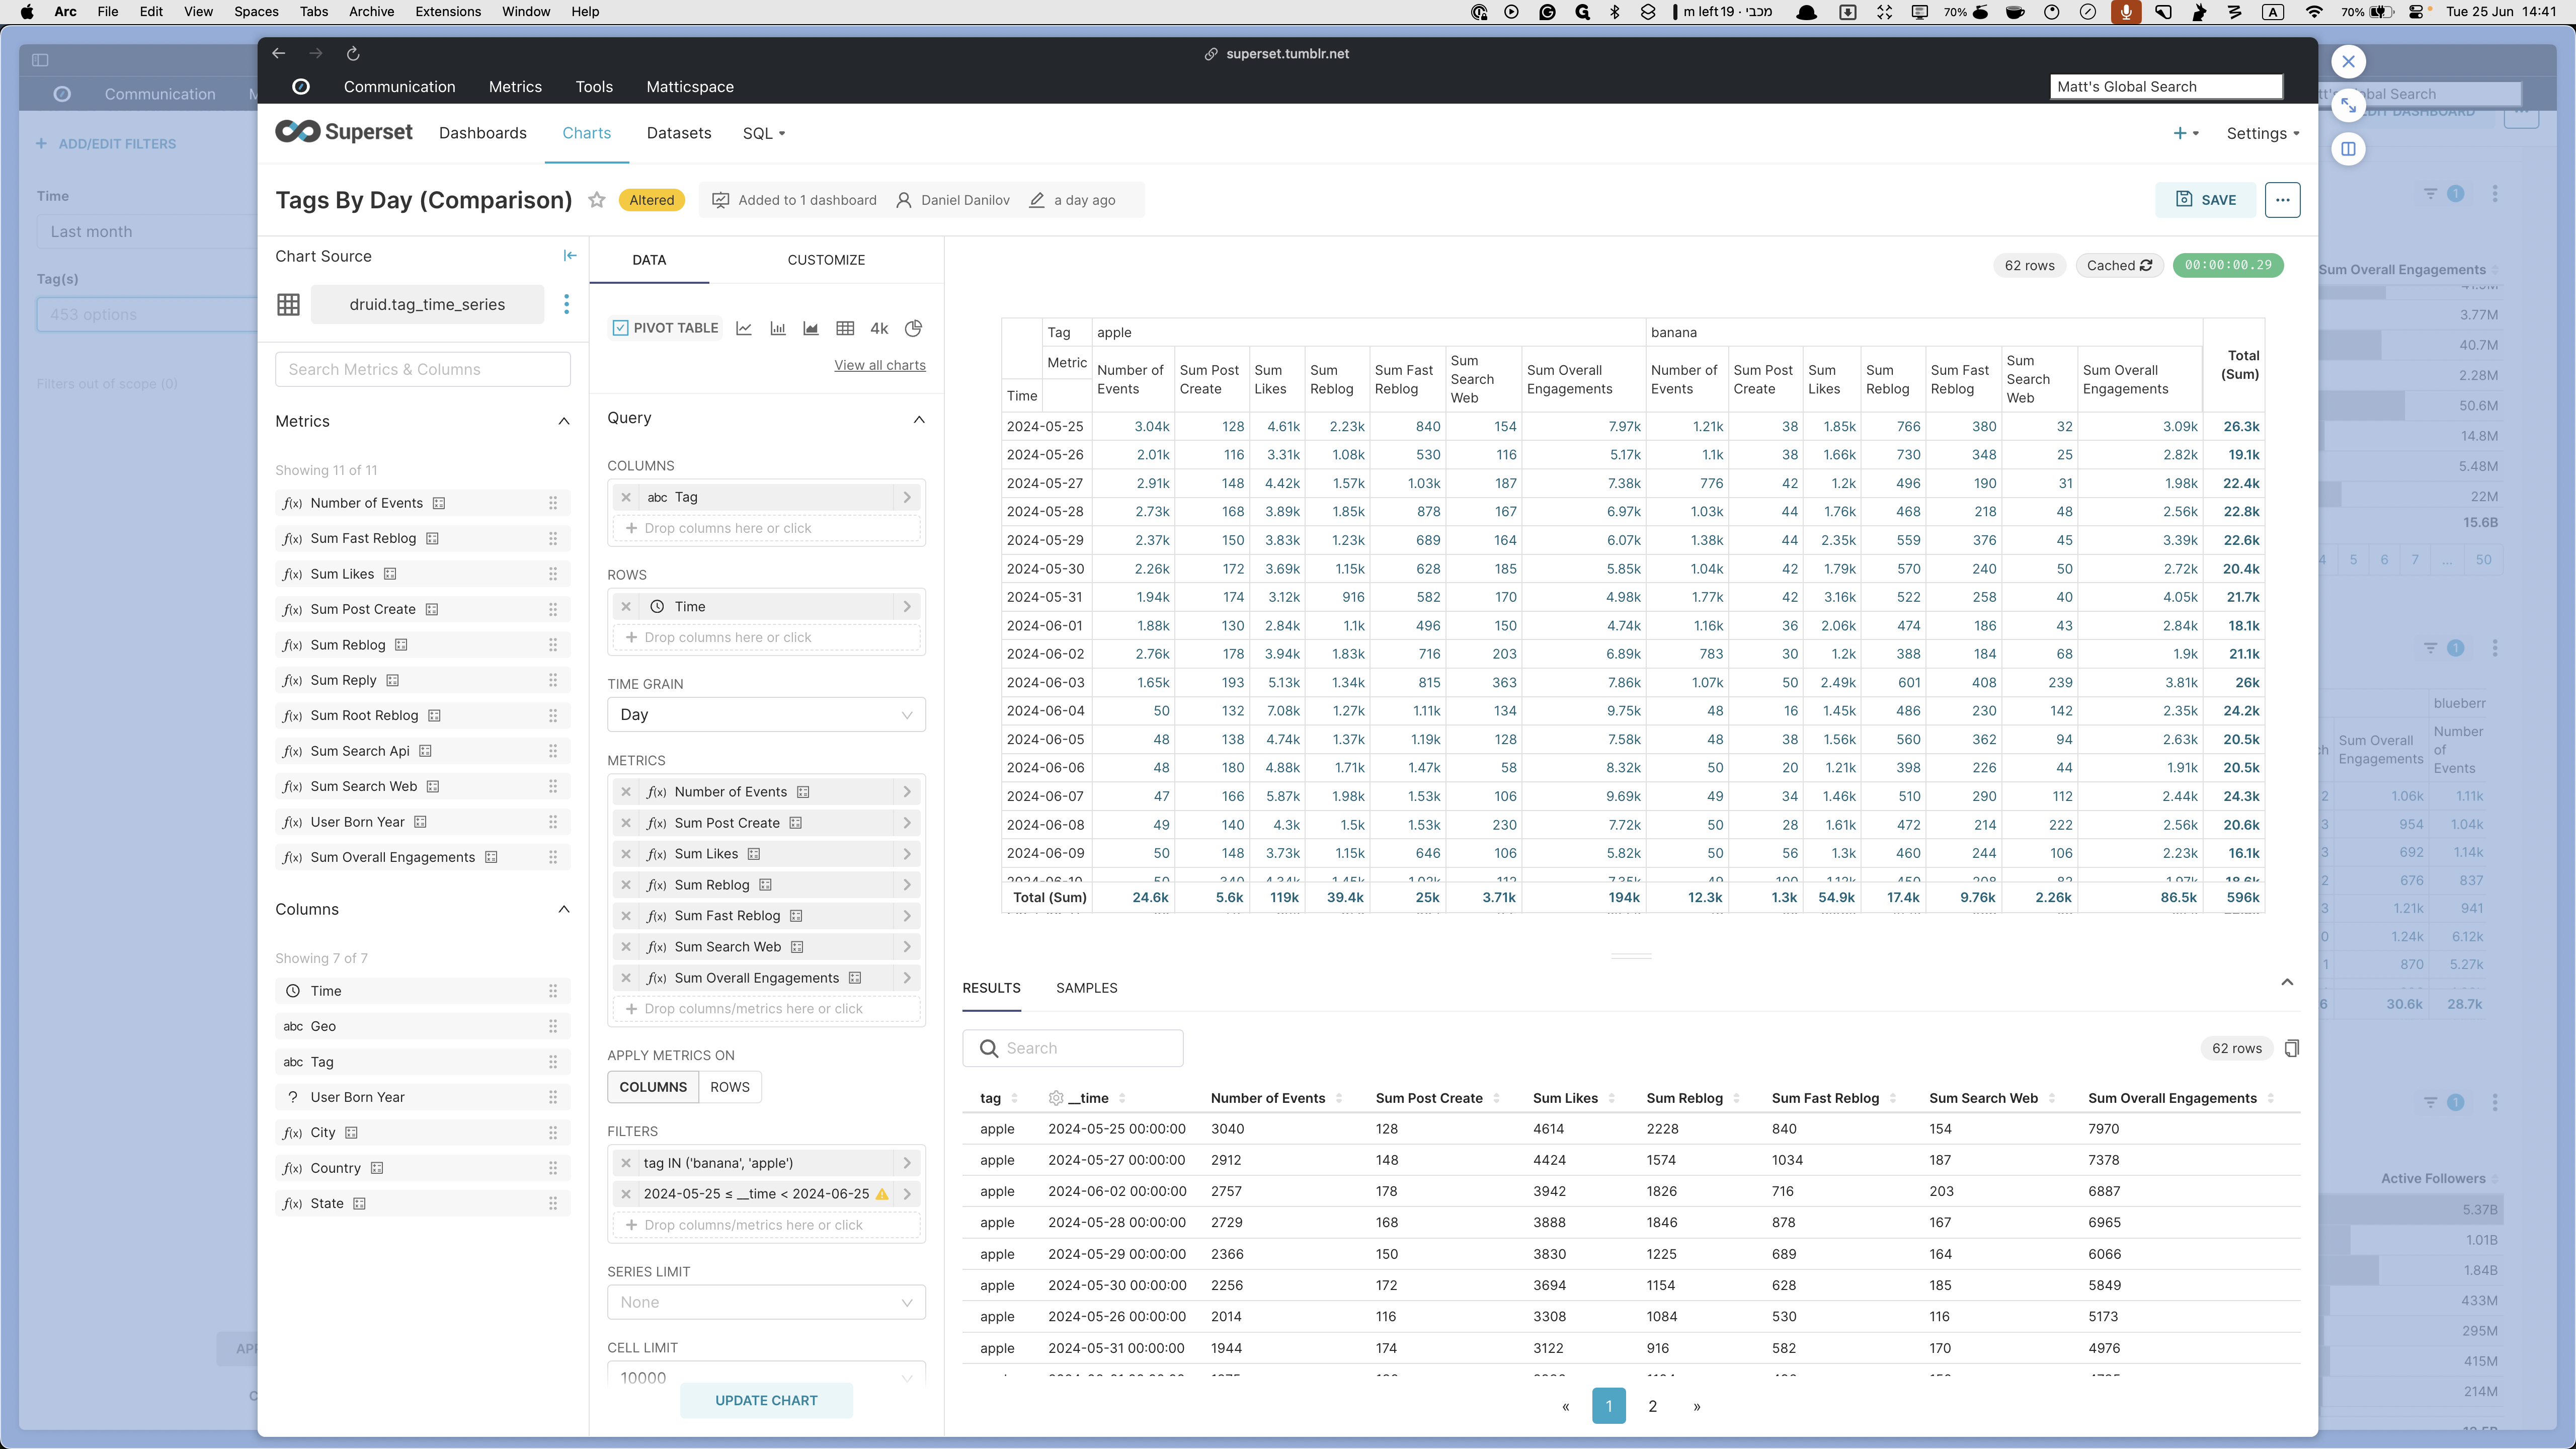
You can open this by clicking on the title. By default, I included some tags so you can see how it looks. You can change them by going to filters, clicking on the tag section, and selecting the tags you want to see. Let's take the following chart as an example of how you can drill further down to compare tags:
For example, let's compare a banana to an apple.
Other charts included in this tab are:

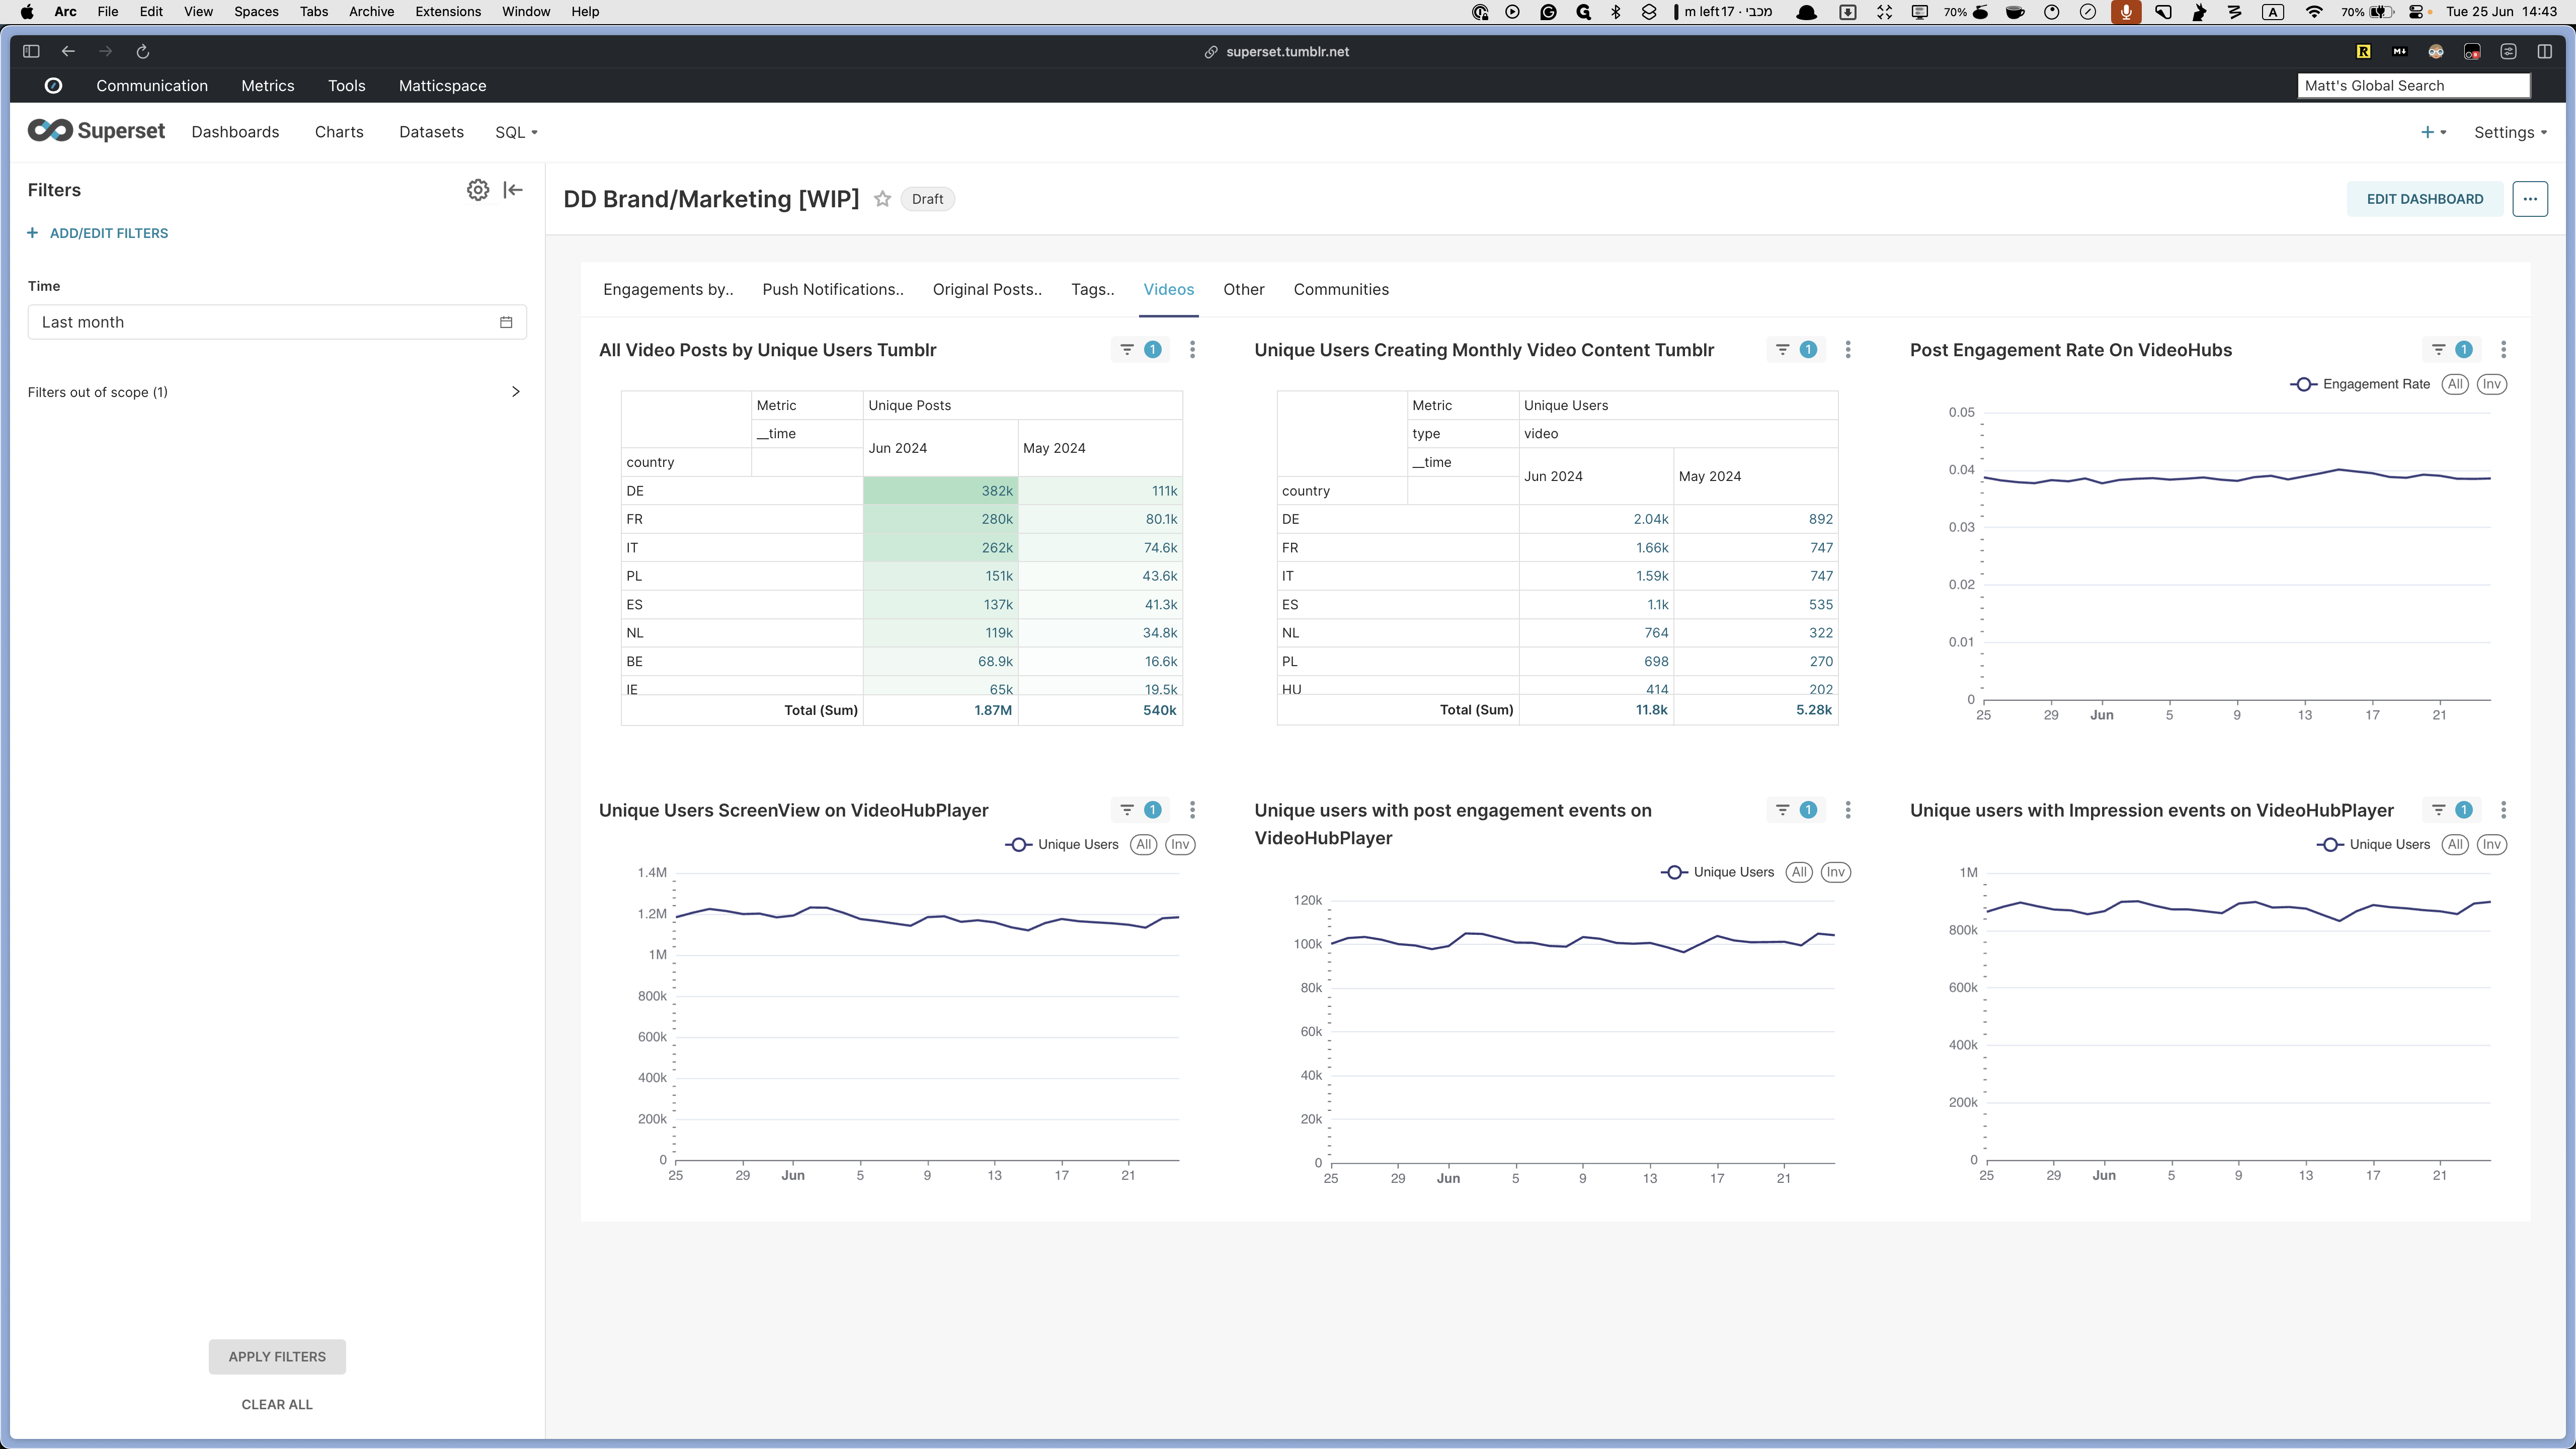
The next tab is Videos.
This section provides all the information you might need for videos.
For example, all video posts by unique users, broken down by country and month. Unique users creating monthly video content are shown in a table format. The overall post engagement rate, unique users' screen views on the video help player, unique users with post engagement events, and unique users with impression events are also included.


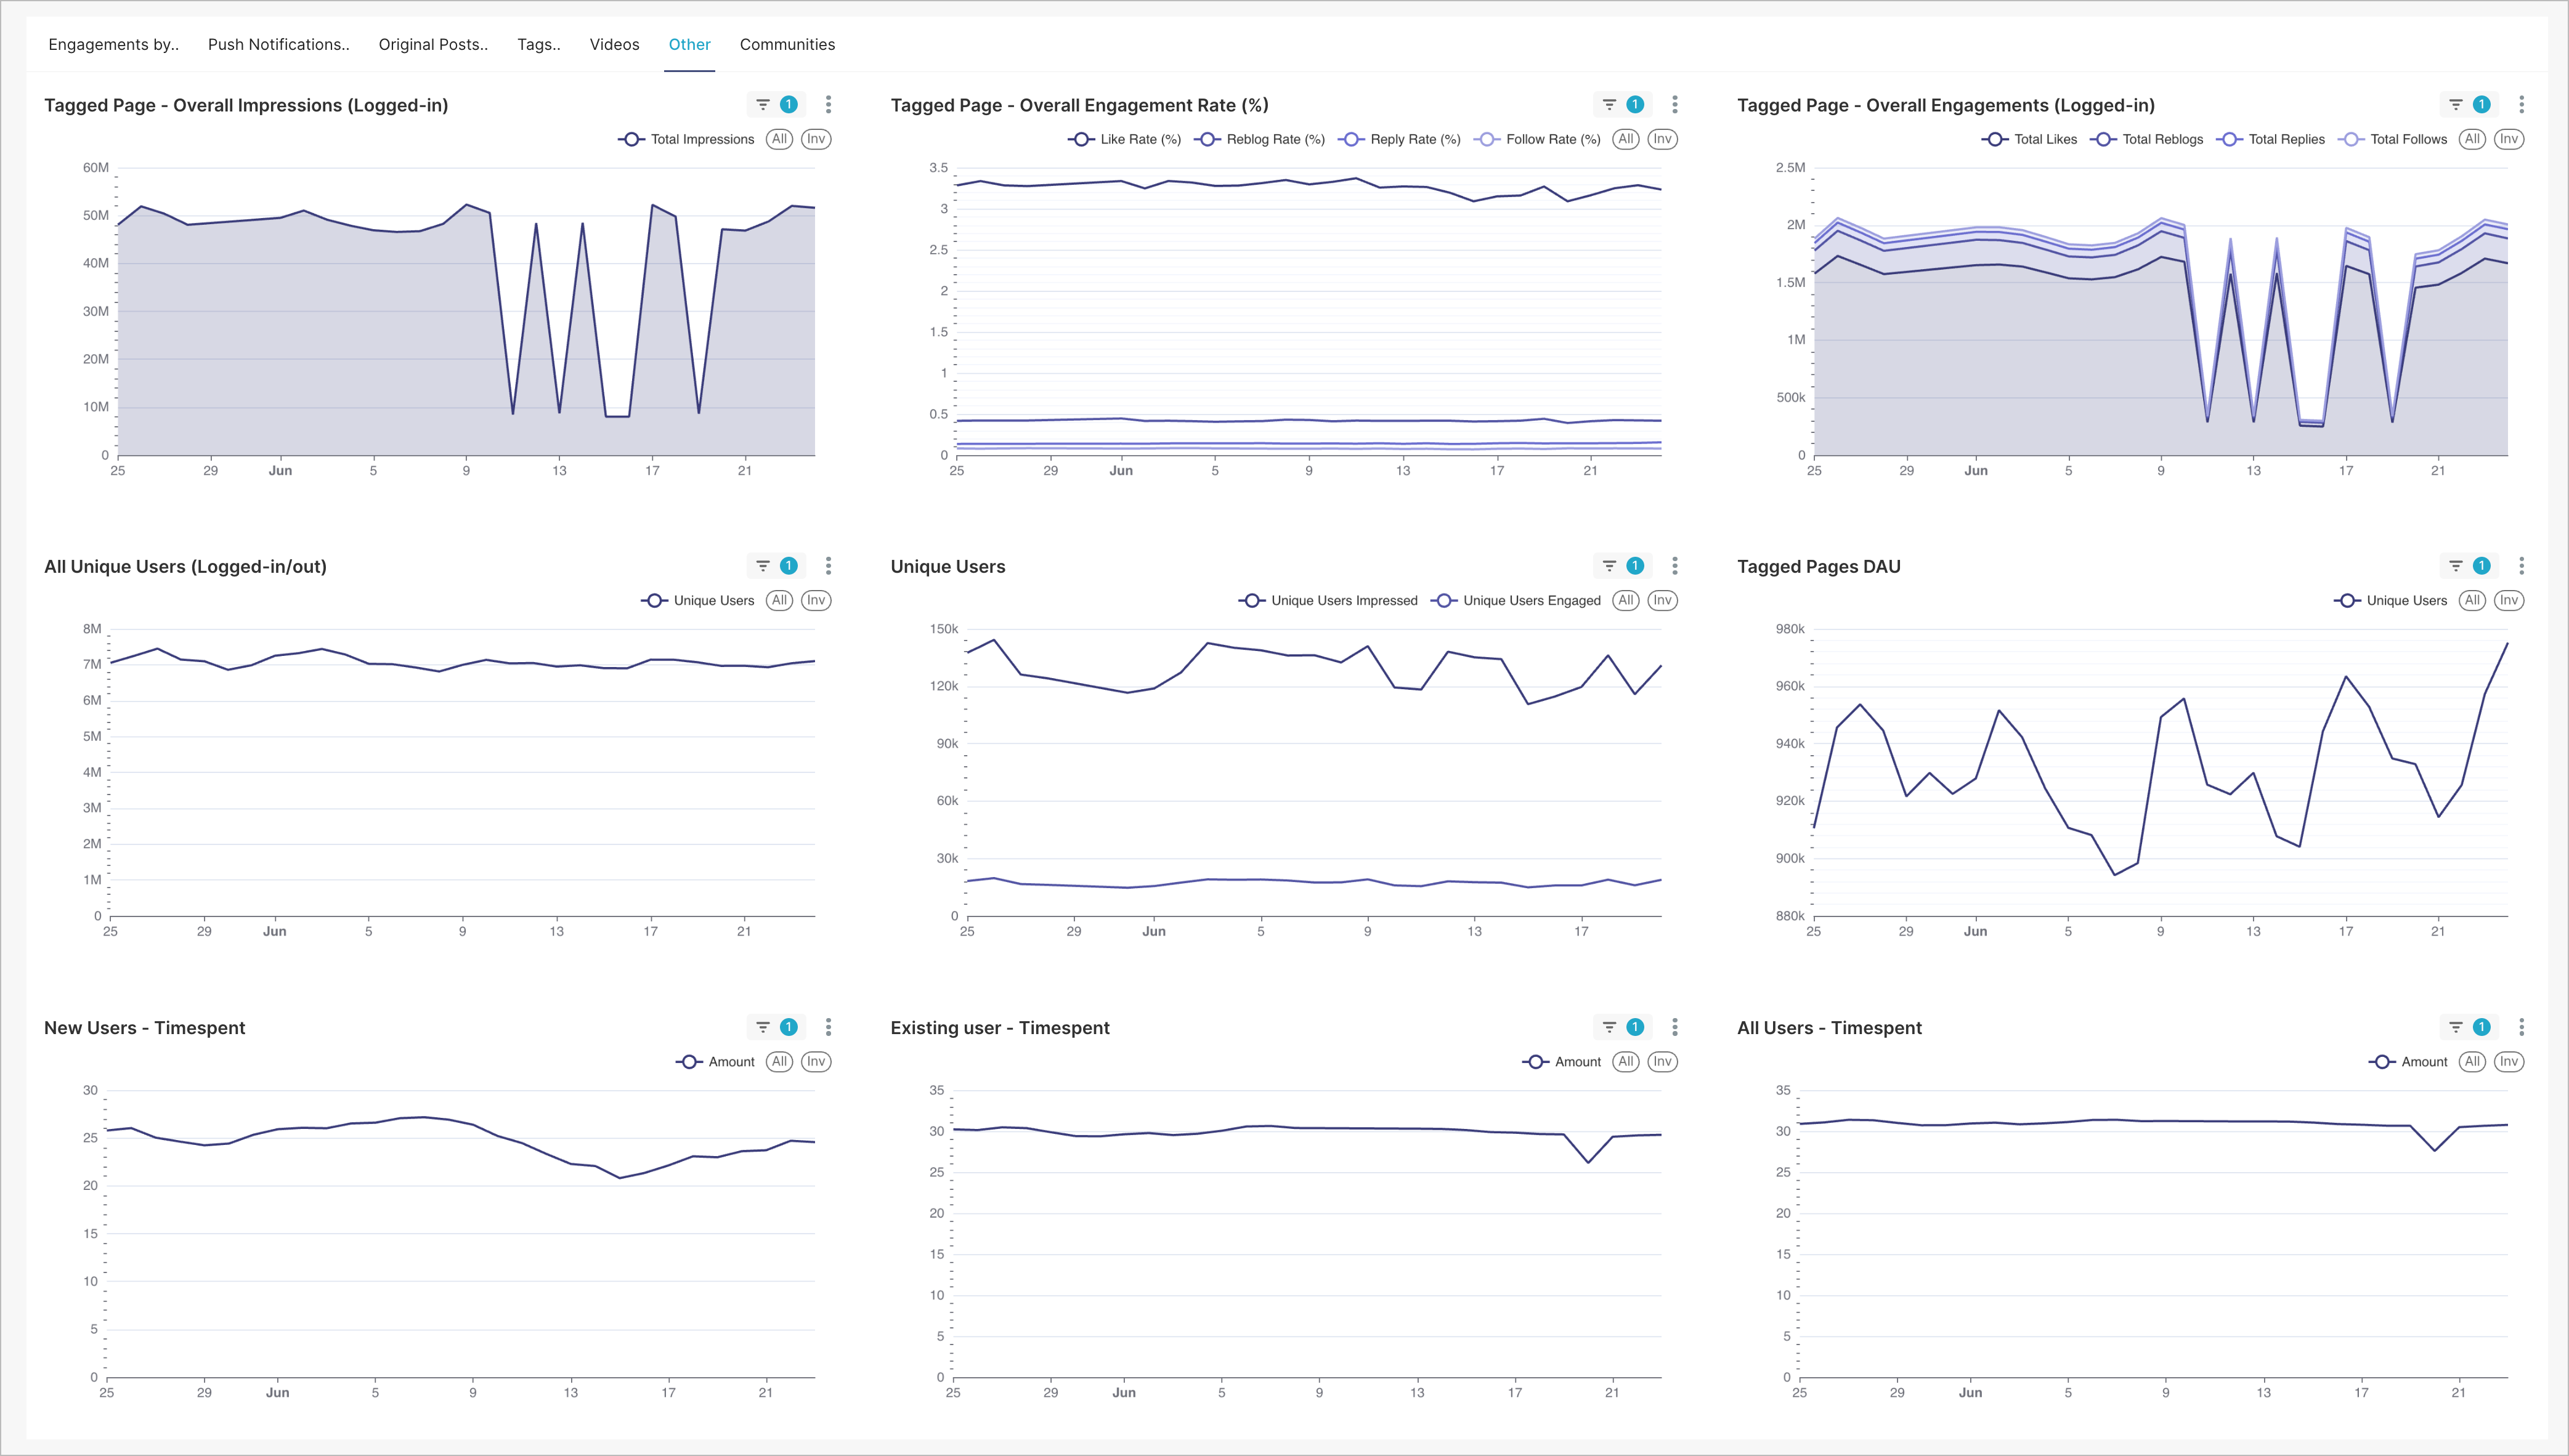
The Other Tab
This tab shows other related data that you might find useful. For example: total engagement/impressions rate on tagged pages, overall unique users, time spent for new/existing/total users, and more.
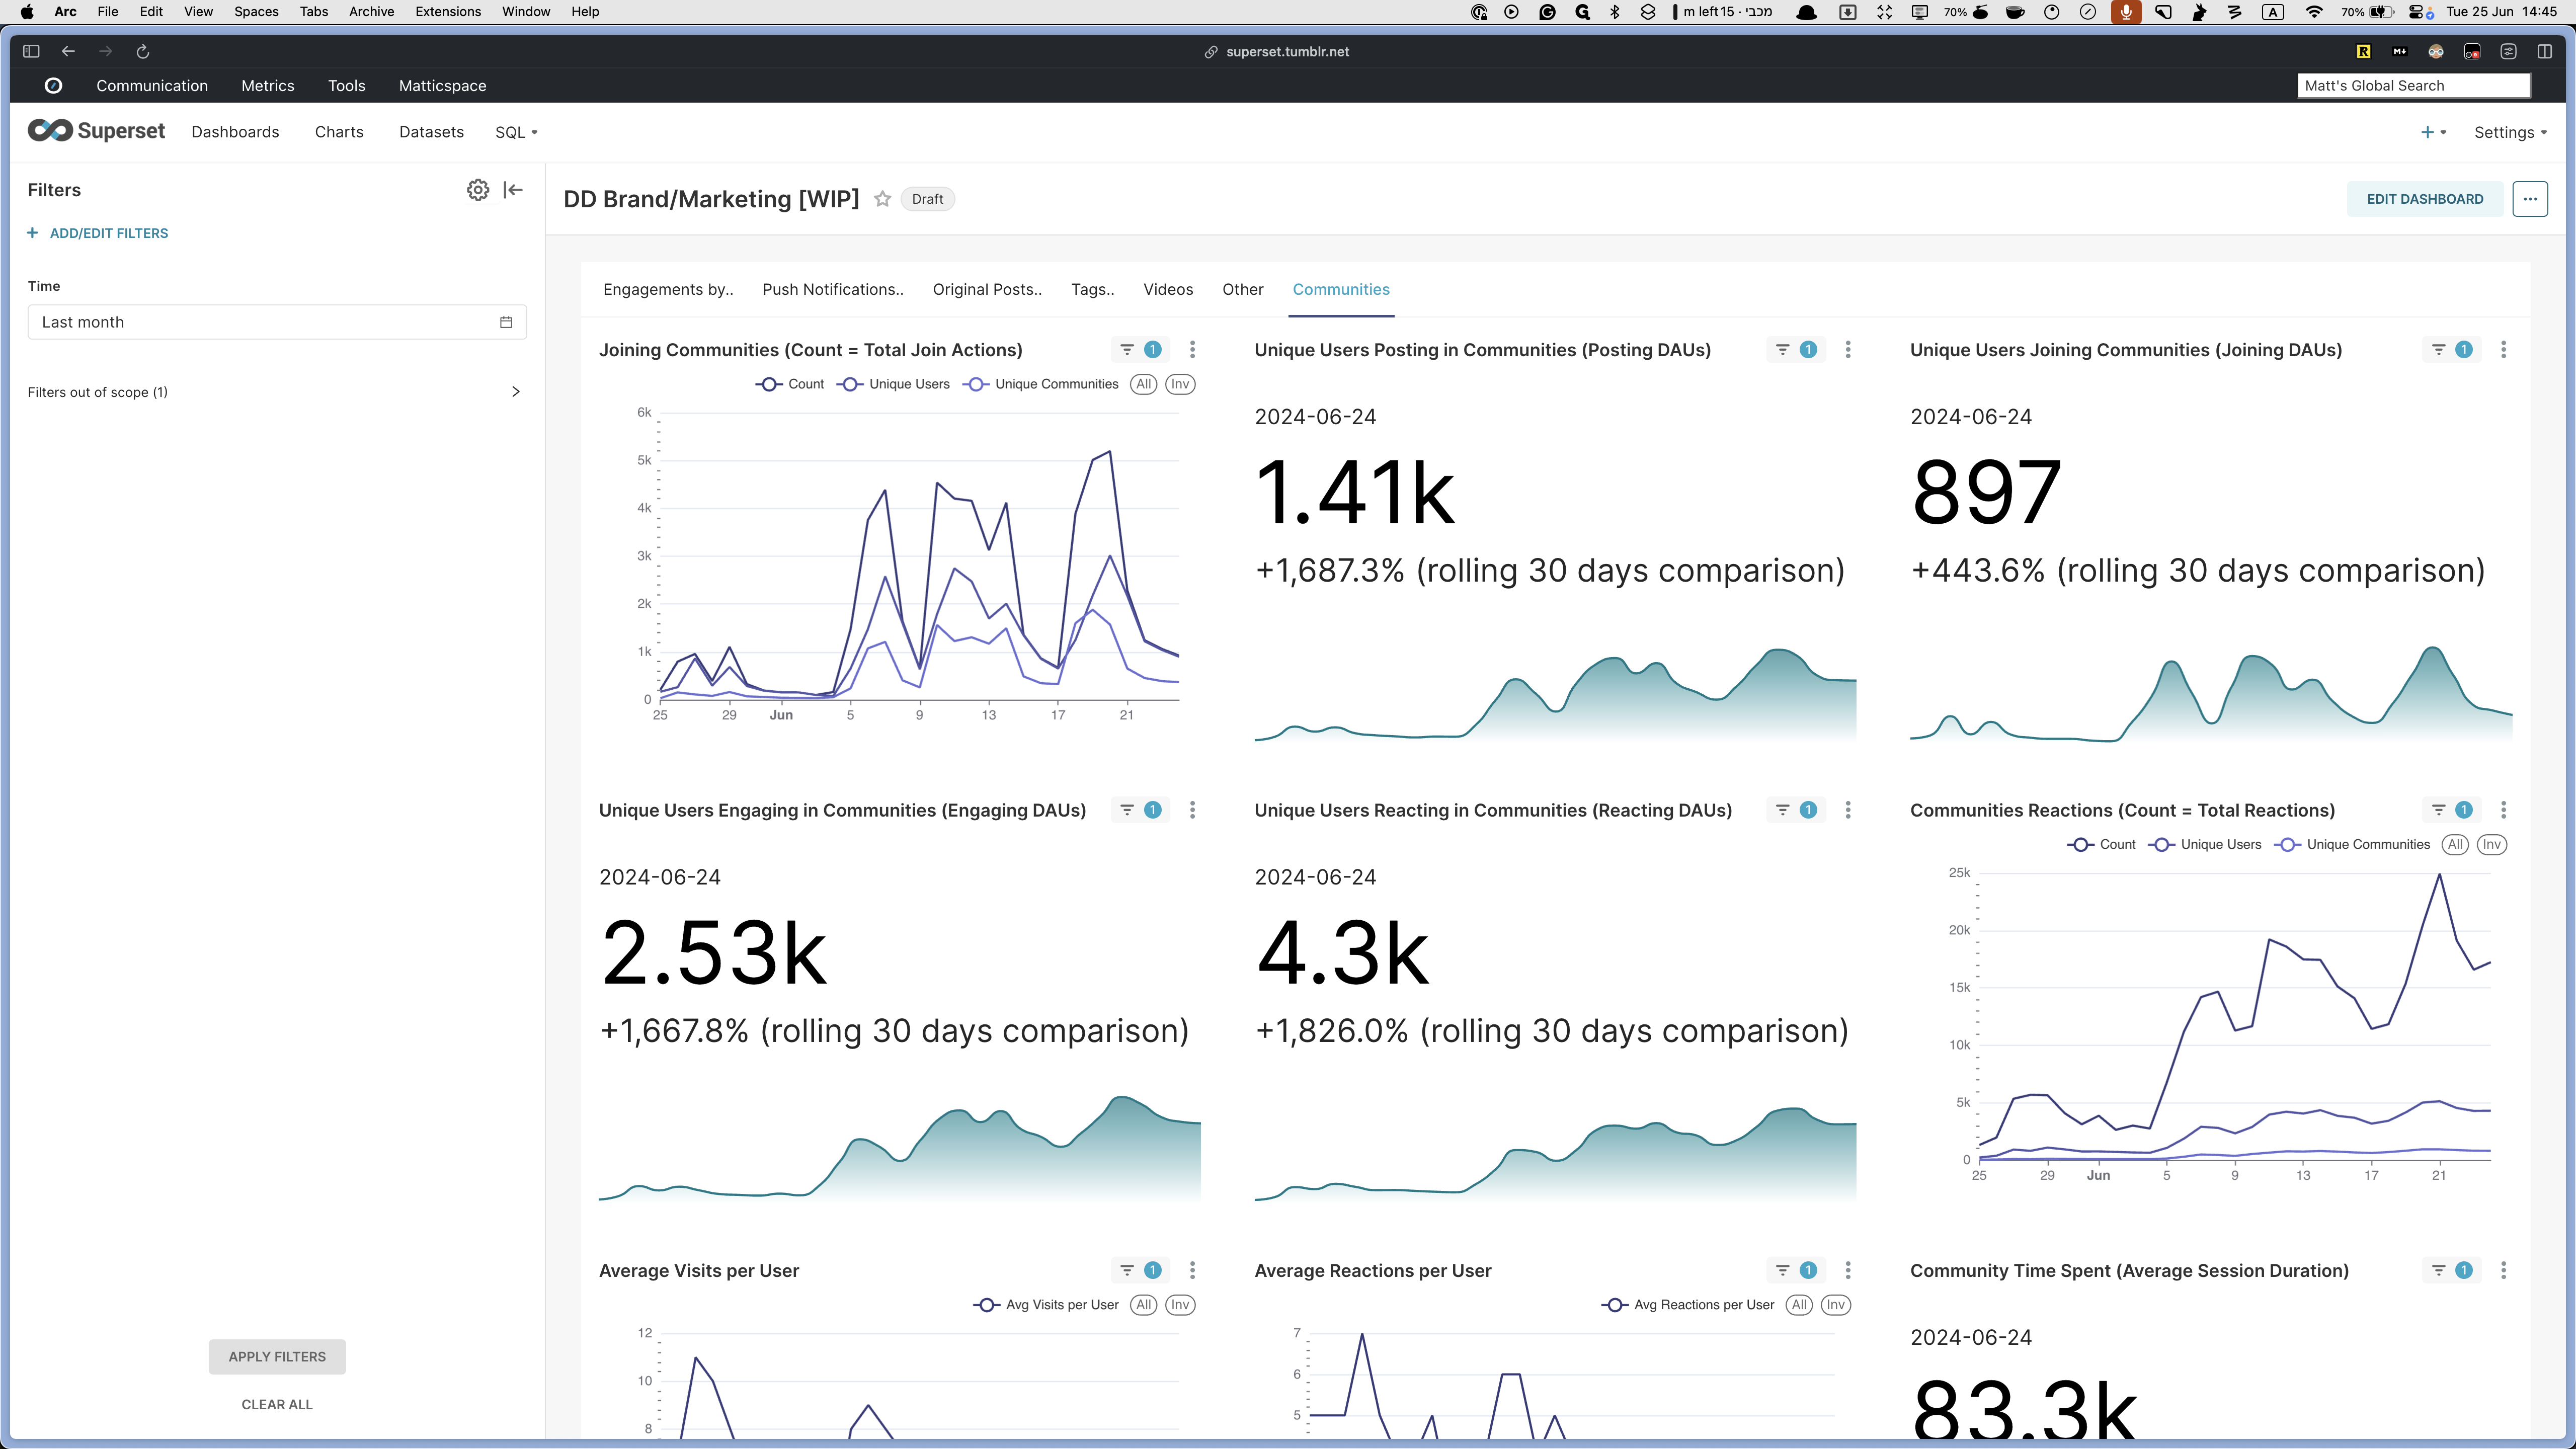
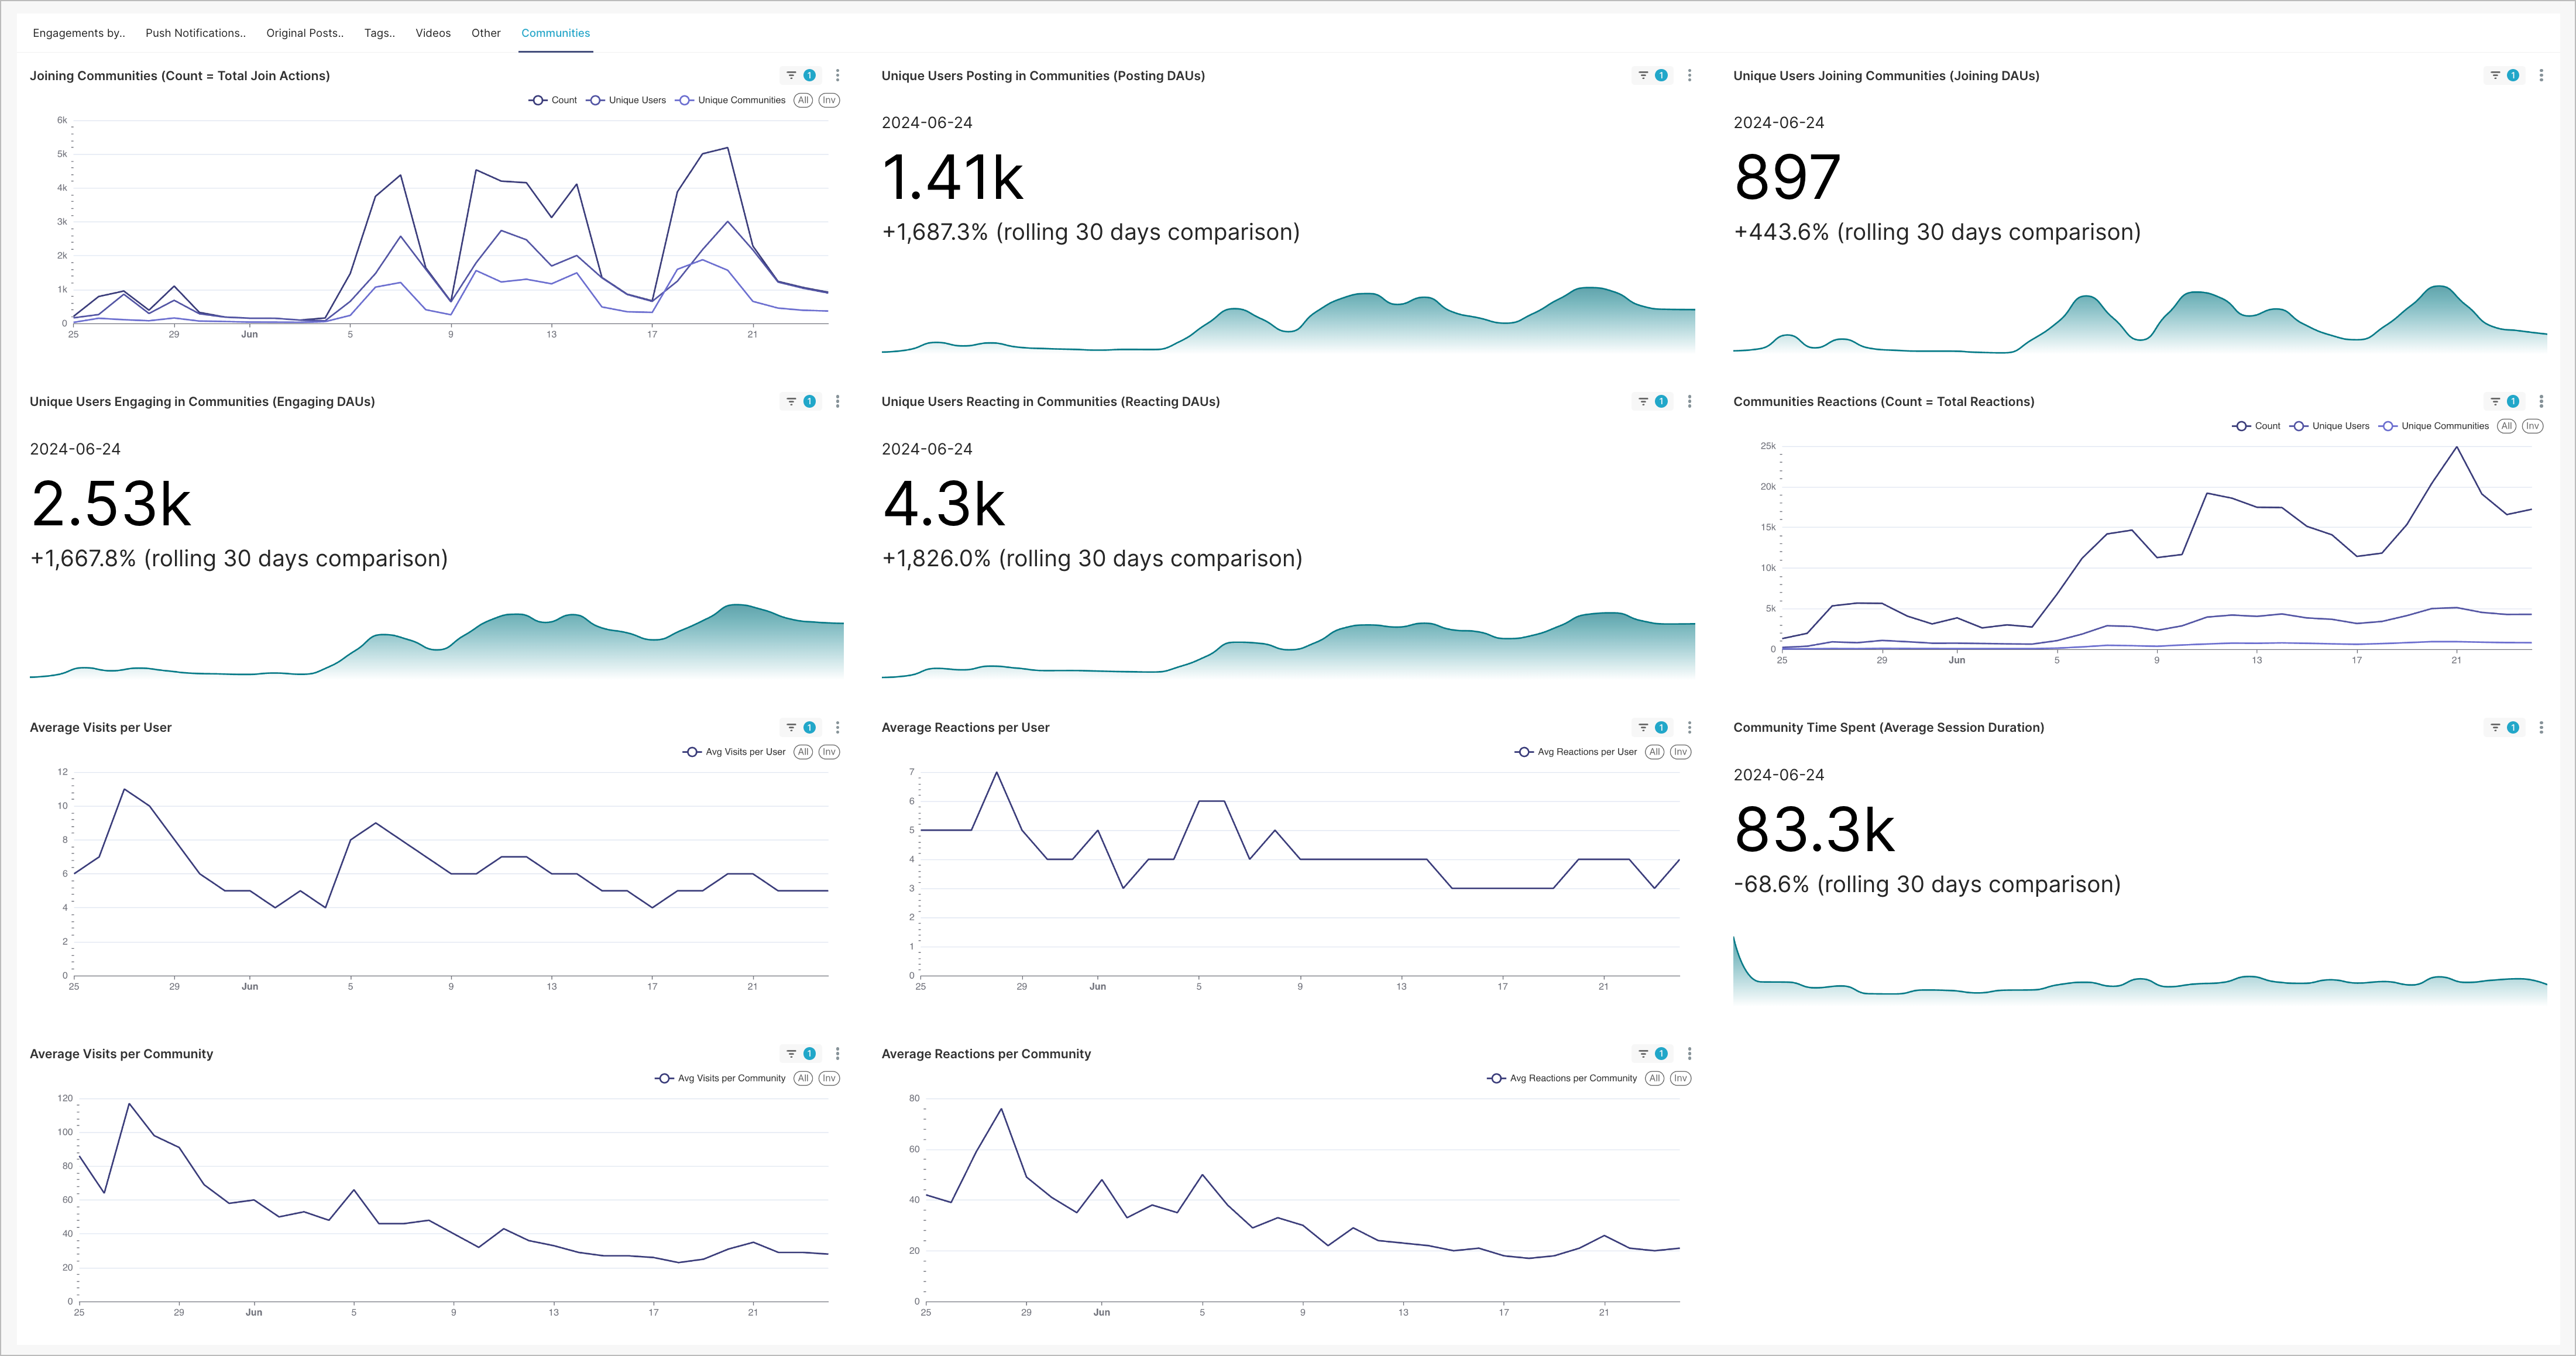
Finally, an extra "Communities" tab
While you didn't ask for this in the original request, it seemed like it may be helpful for future conversations, so I added it in.
(There is also a dedicated communities dashboard with even more breakdown.)
This dashboard shows the total number of people joining communities, the number posting, reacting, or engaging, the average session duration, and more. Yo