
How to Create a Weekly Amazon Performance Report
Learn how to build a weekly Amazon performance report by extracting sales, traffic, and PPC data from Seller Central into a Google Sheets dashboard.
This guide explains how to compile a weekly e-commerce performance report by extracting sales, traffic, and advertising metrics from Amazon and entering them into a master Google Sheets dashboard. Completing this ensures you maintain an accurate, up-to-date view of your brand's cross-regional marketplace performance.
This process is intended for e-commerce managers, data analysts, or marketing teams tracking weekly marketplace KPIs. It should be performed at the beginning of each new week to capture the previous week's Amazon metrics.
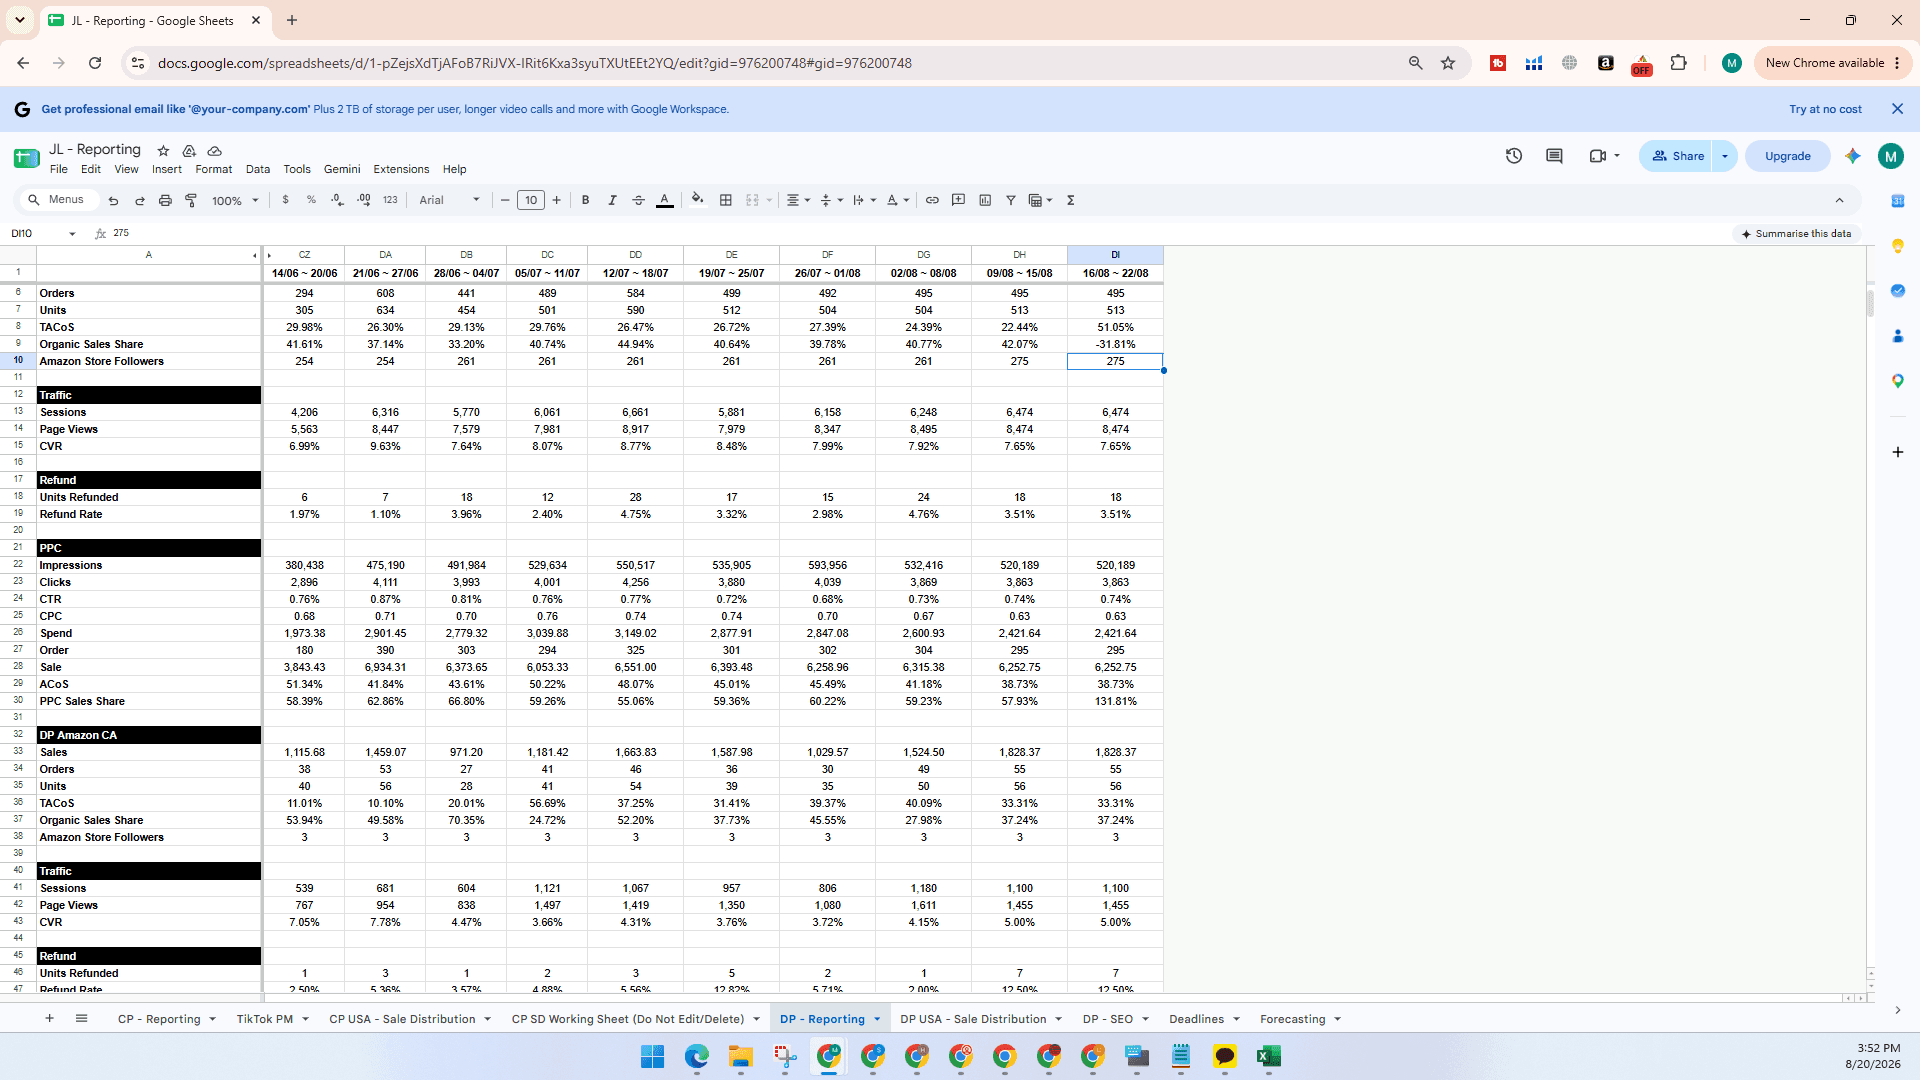
Step 1: Prepare the Tracking Spreadsheet
Before pulling new metrics, set up a new column in your performance tracker.
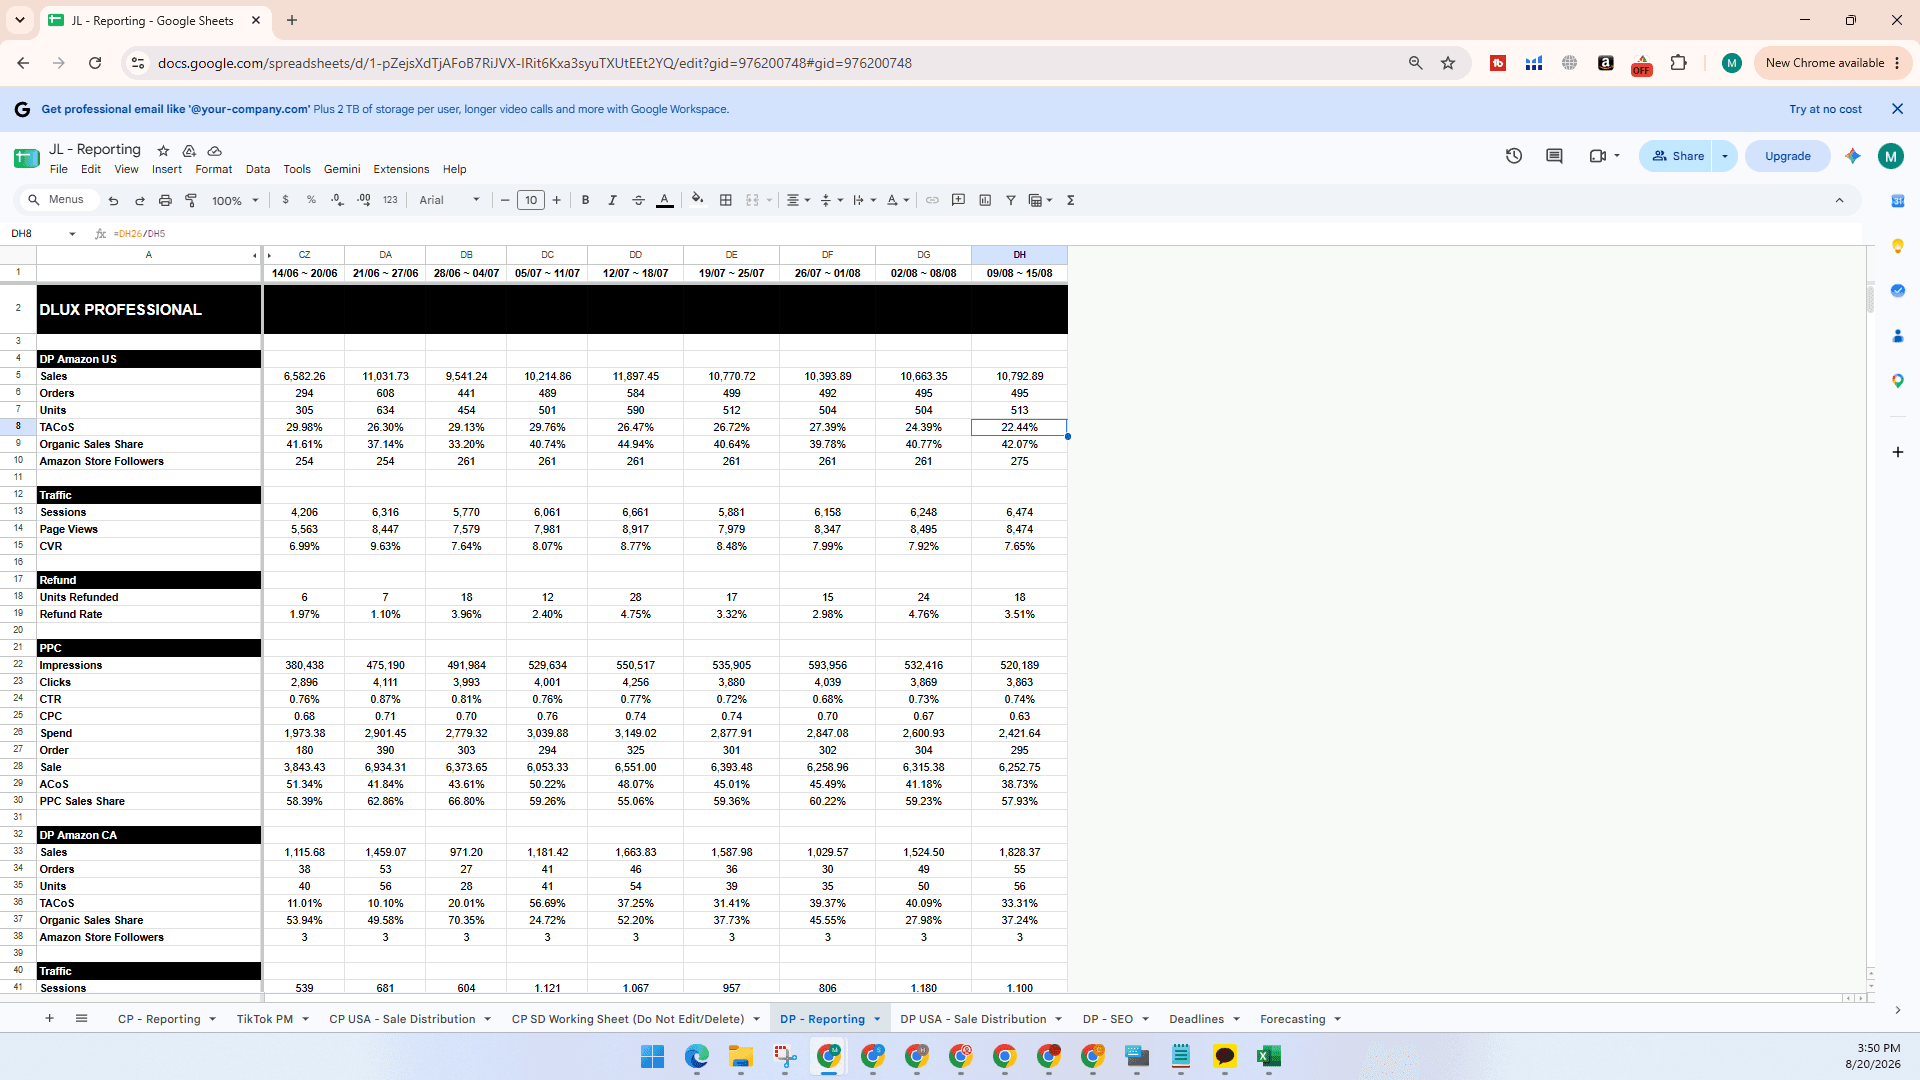
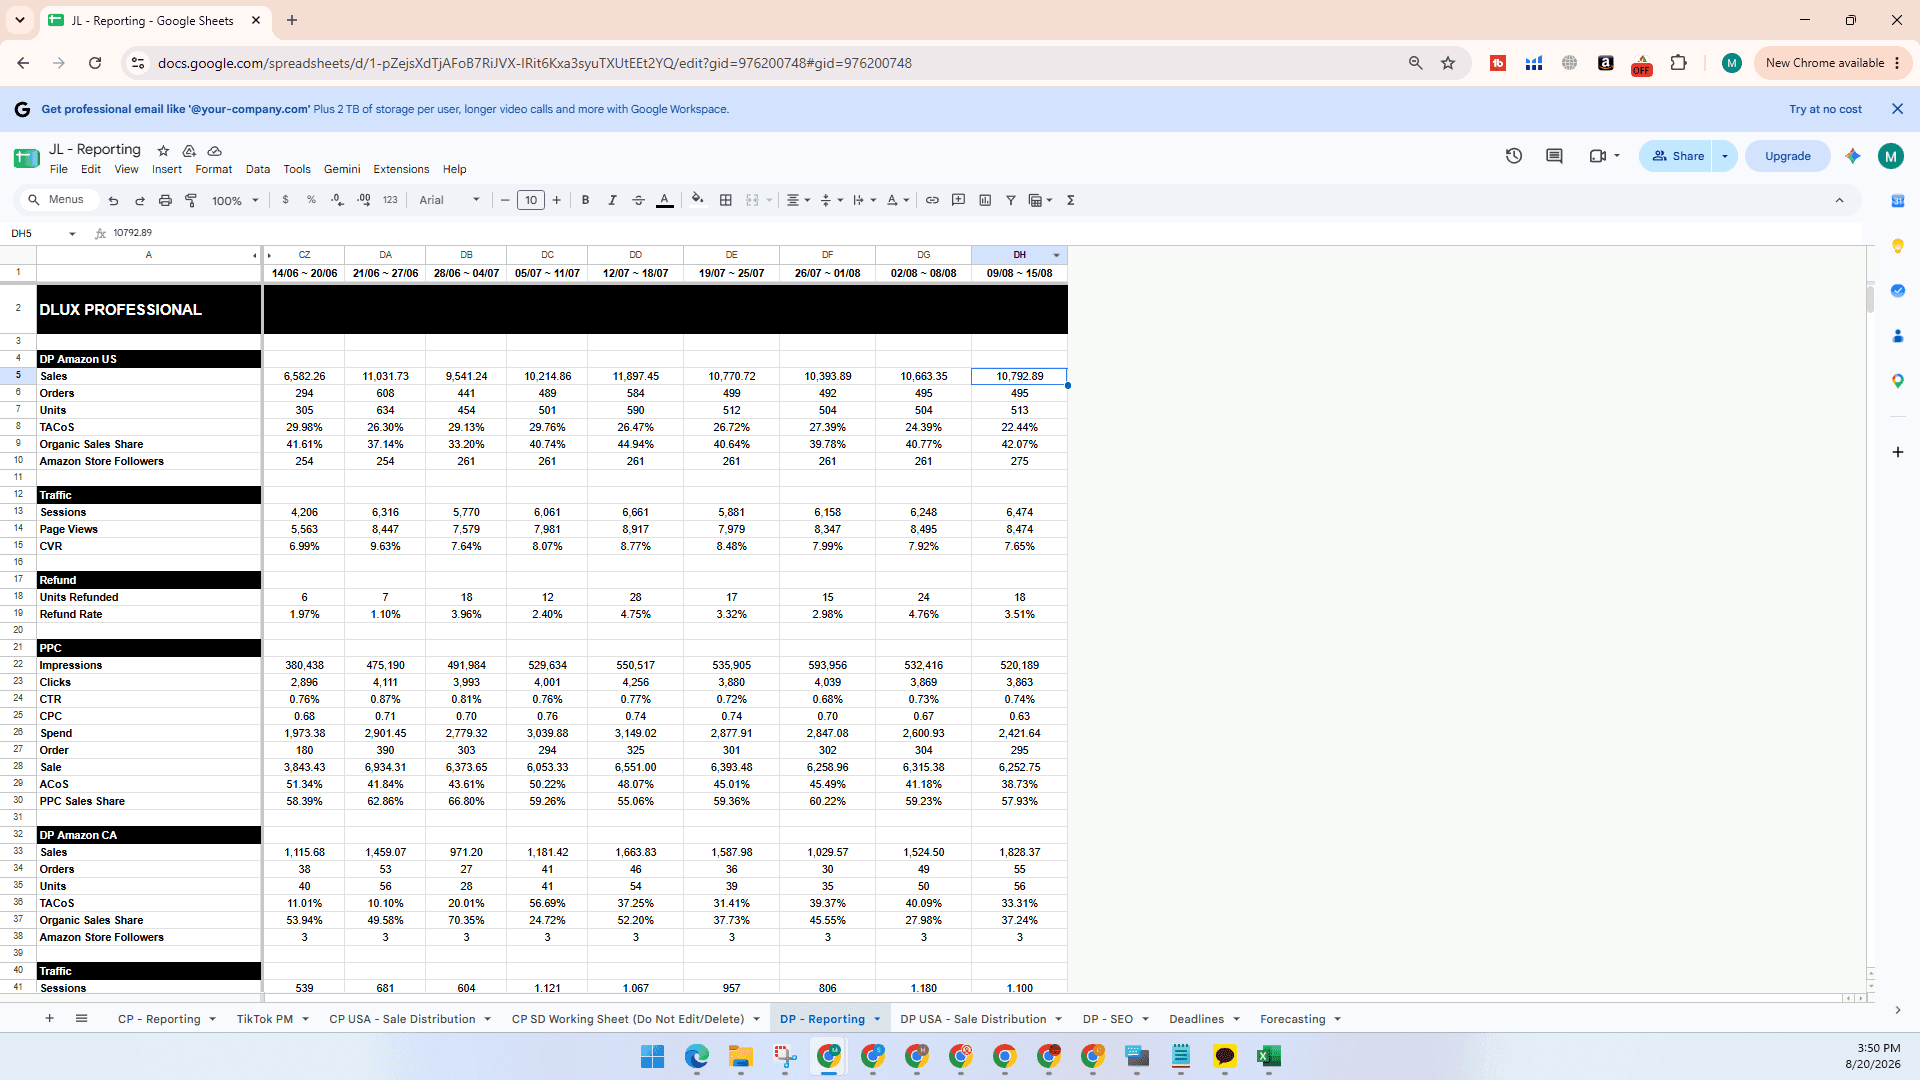
Ctrl + C (or Cmd + C) to copy it.Ctrl + V (or Cmd + V) to paste the formulas and formatting.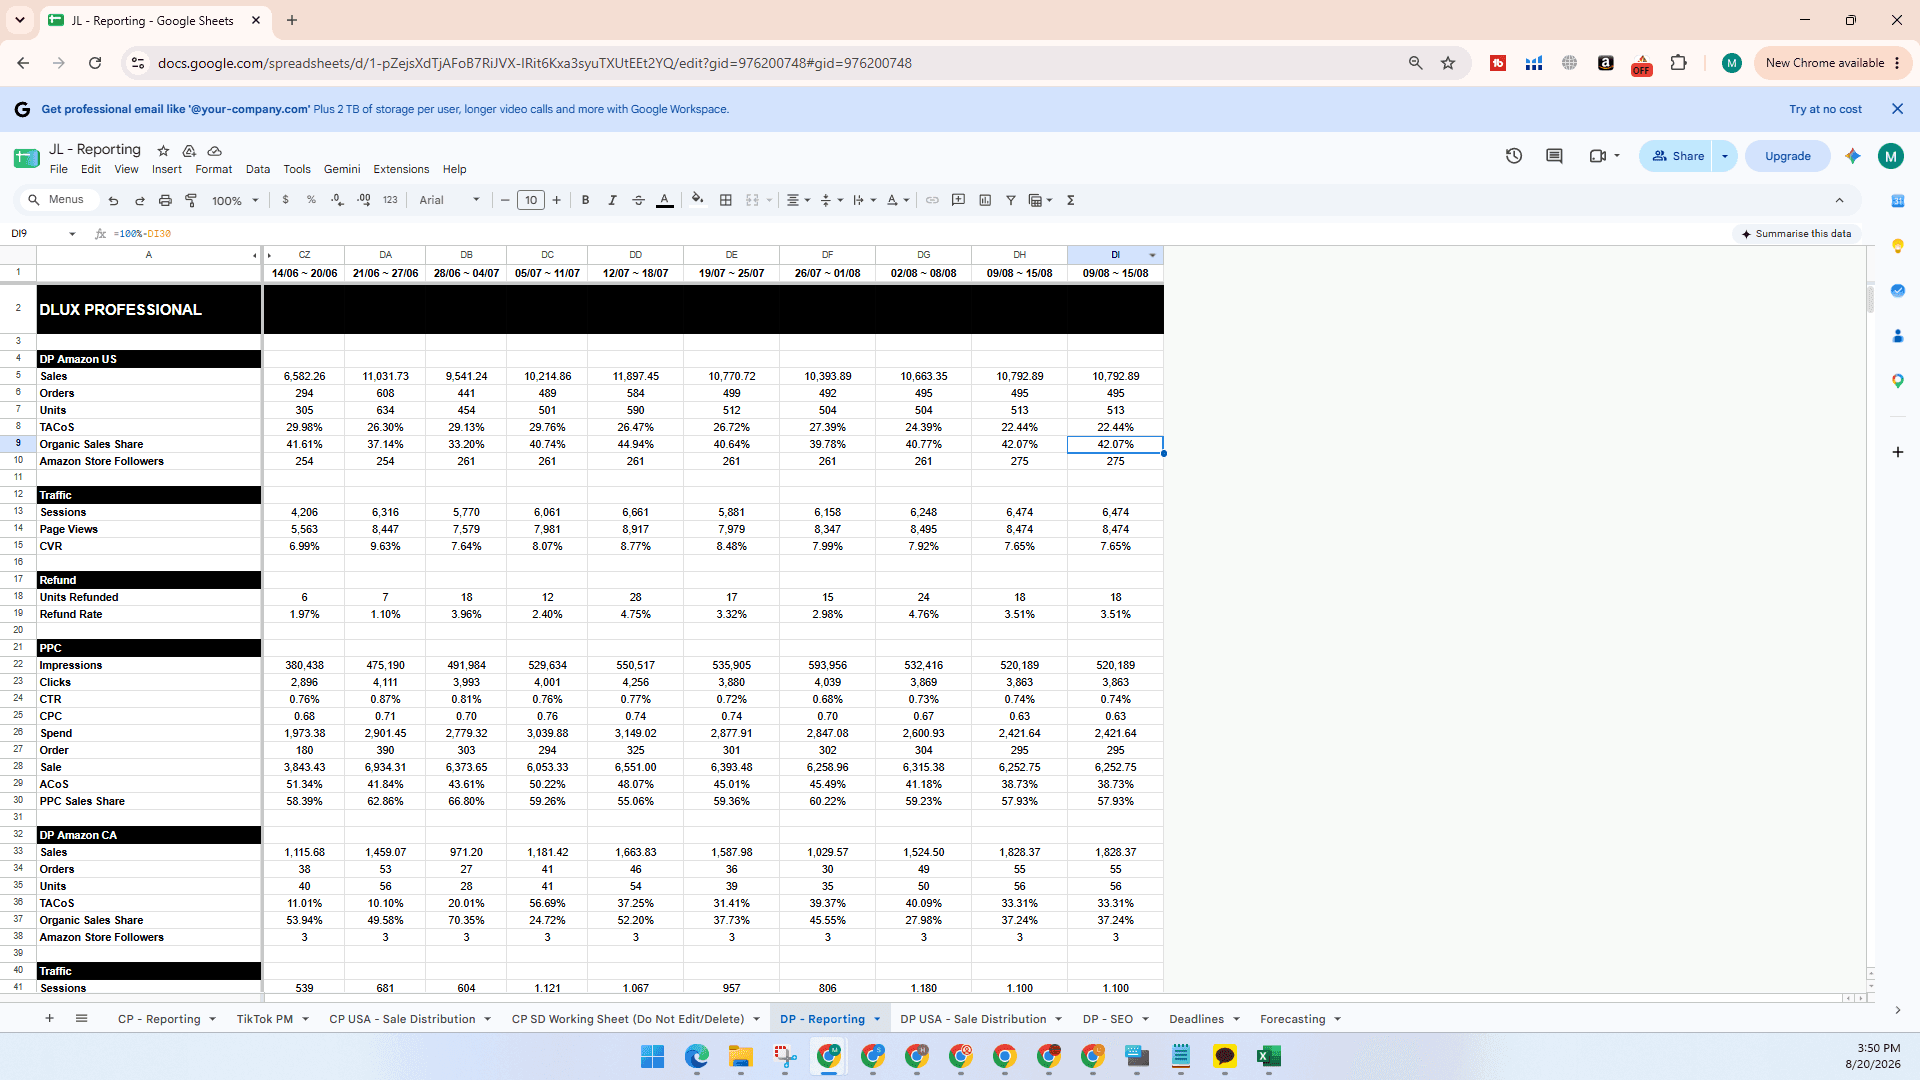
Step 2: Extract Data from Amazon
Because Amazon fragments business metrics across different tools, you need to pull data from three distinct sources to complete the report:
Data Category | Source Location | Metrics Extracted |
|---|---|---|
Sales & Traffic | Seller Central > Business Reports | Product Sales, Units Ordered, Sessions, Page Views, Refund Rate |
Brand Followers | Seller Central > Stores > Manage Stores | Total Store Followers |
PPC Advertising | Campaign Manager > Campaigns | Impressions, Clicks, Spend, Sales, Orders, CPC |
Sales & Traffic Metrics
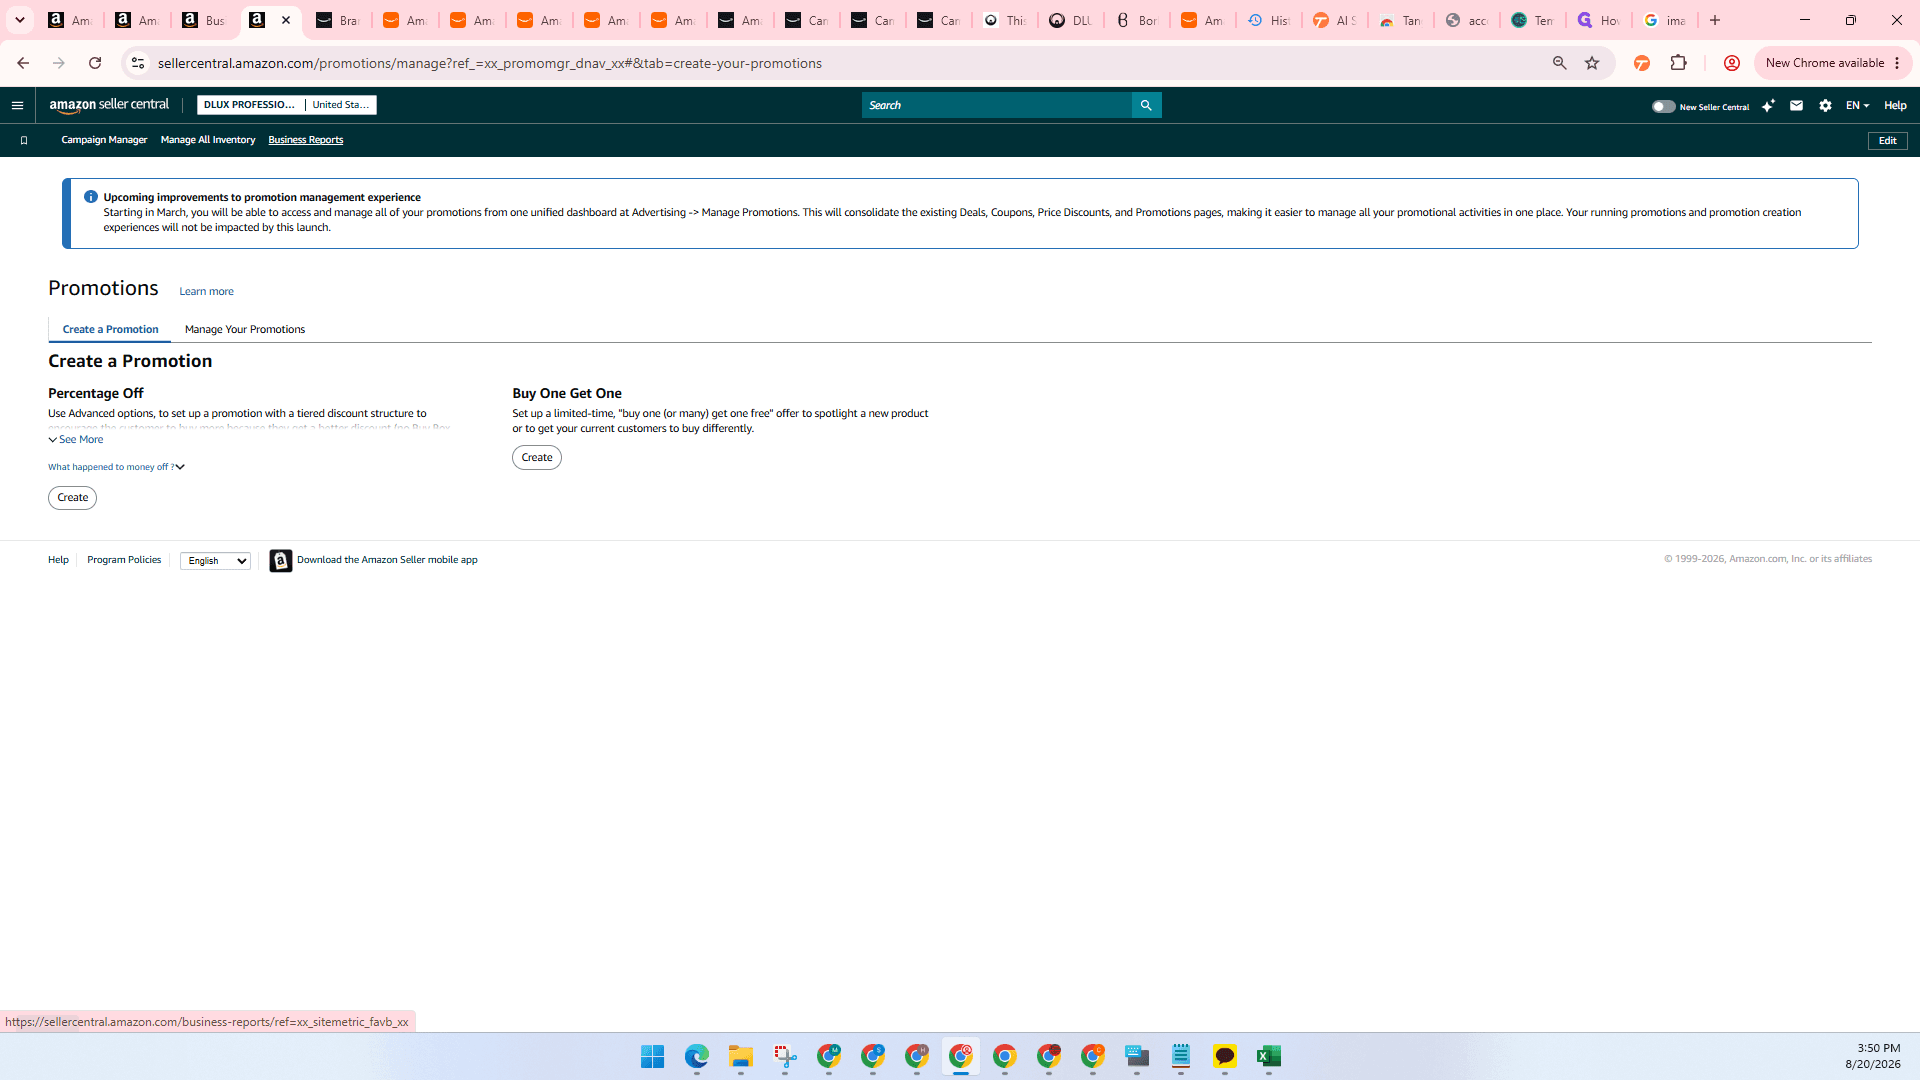
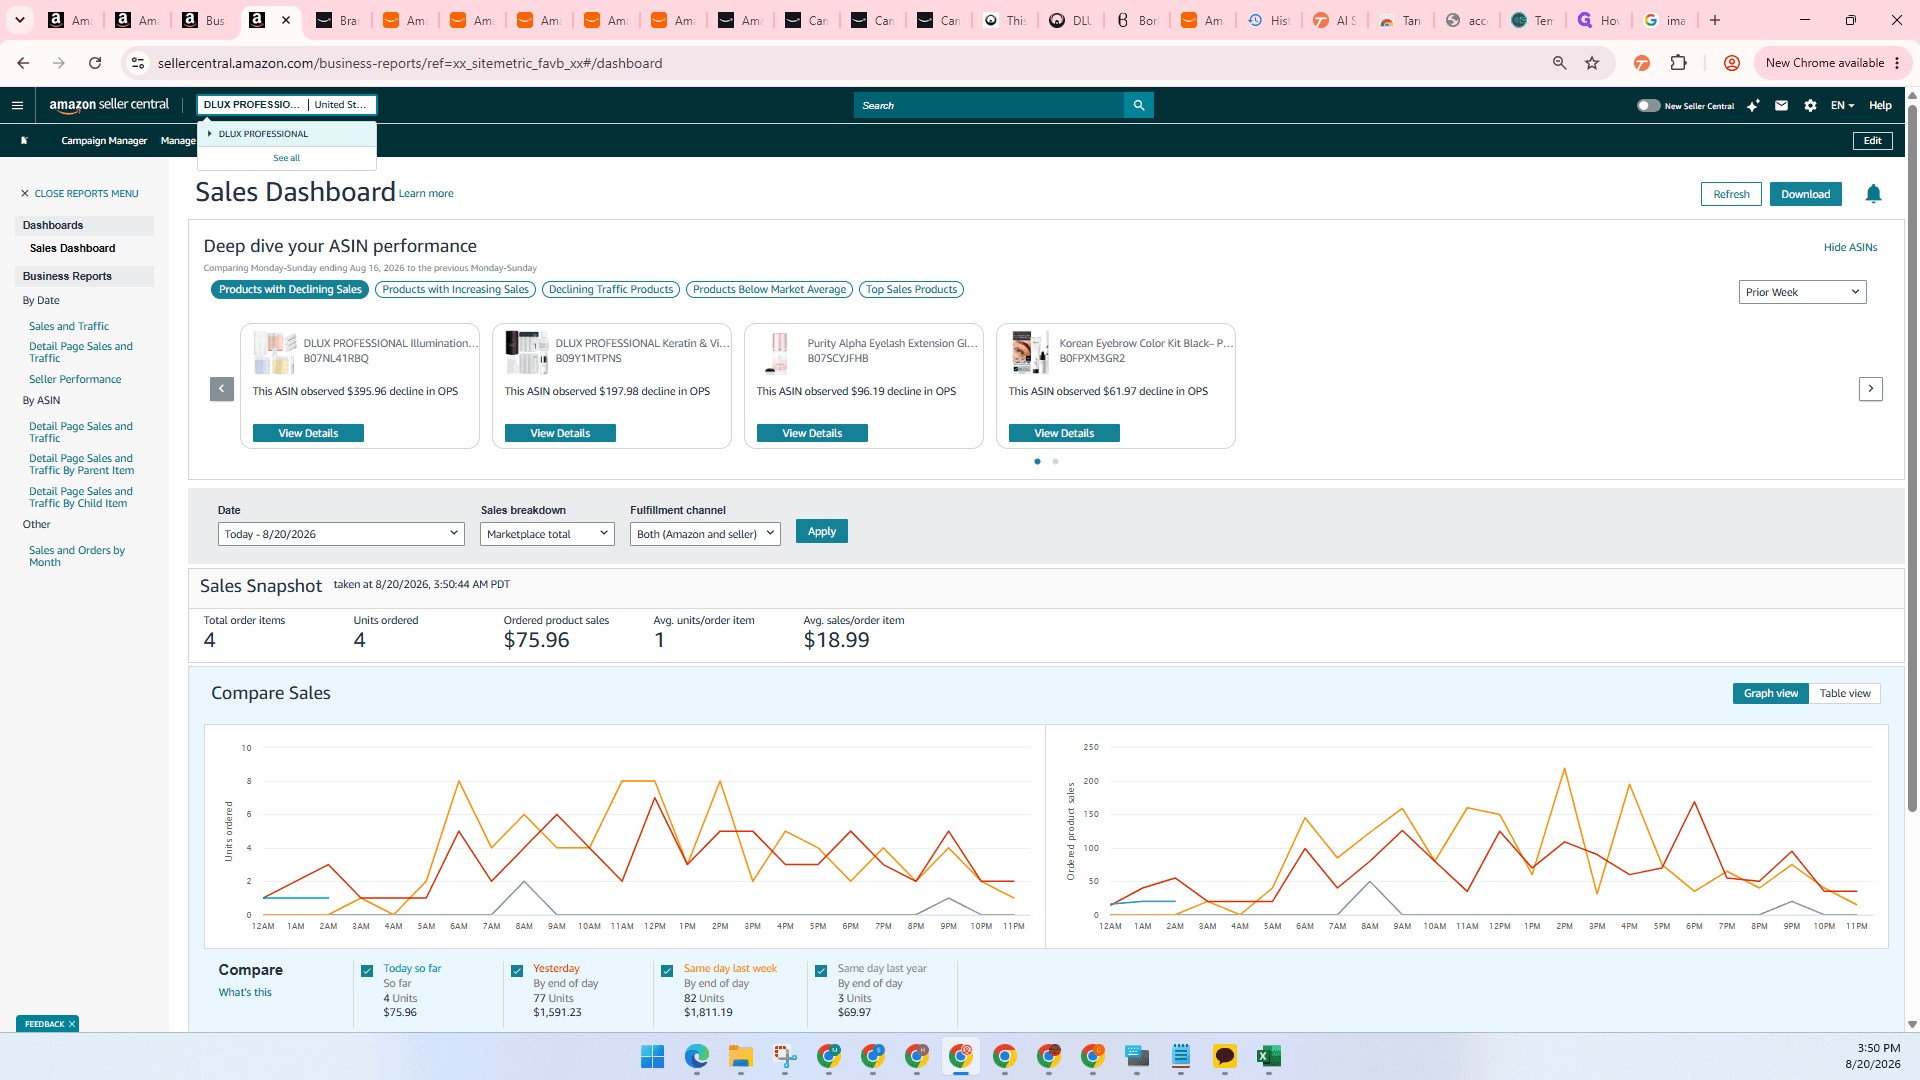
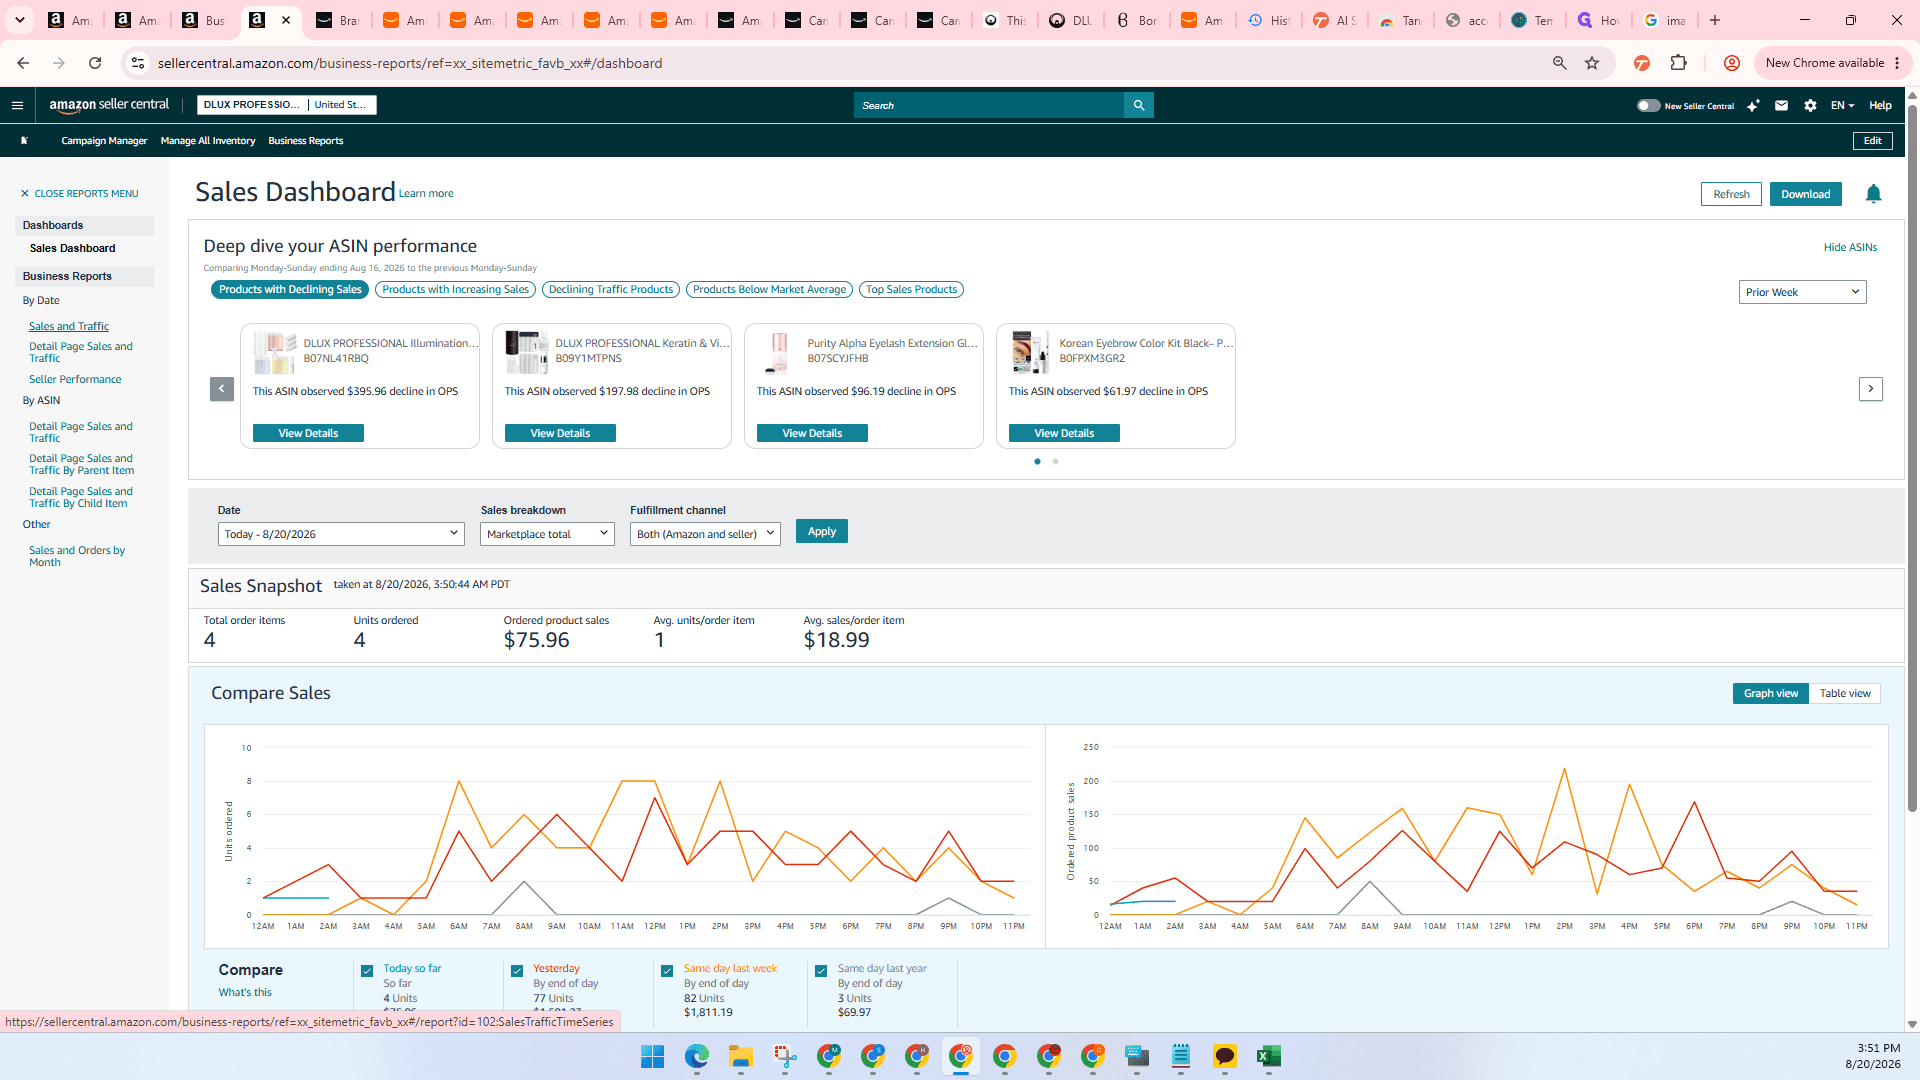
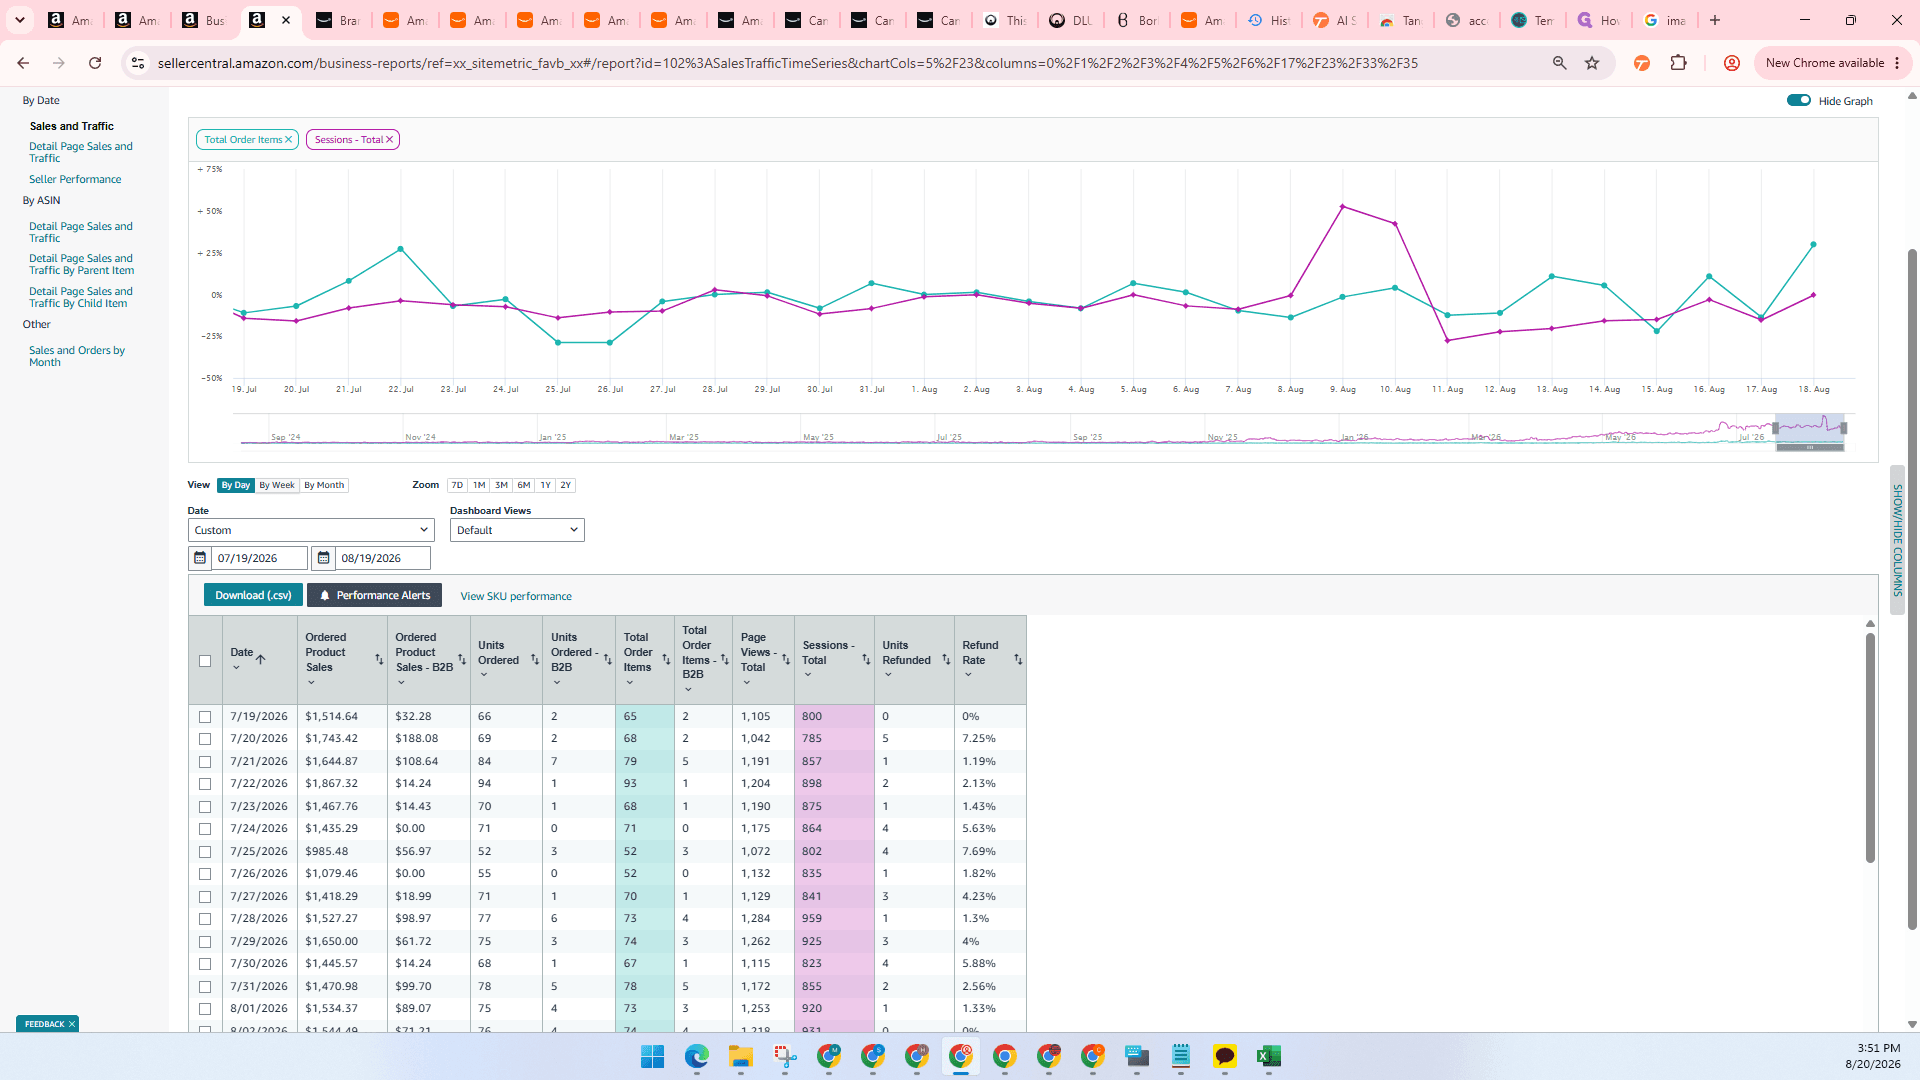
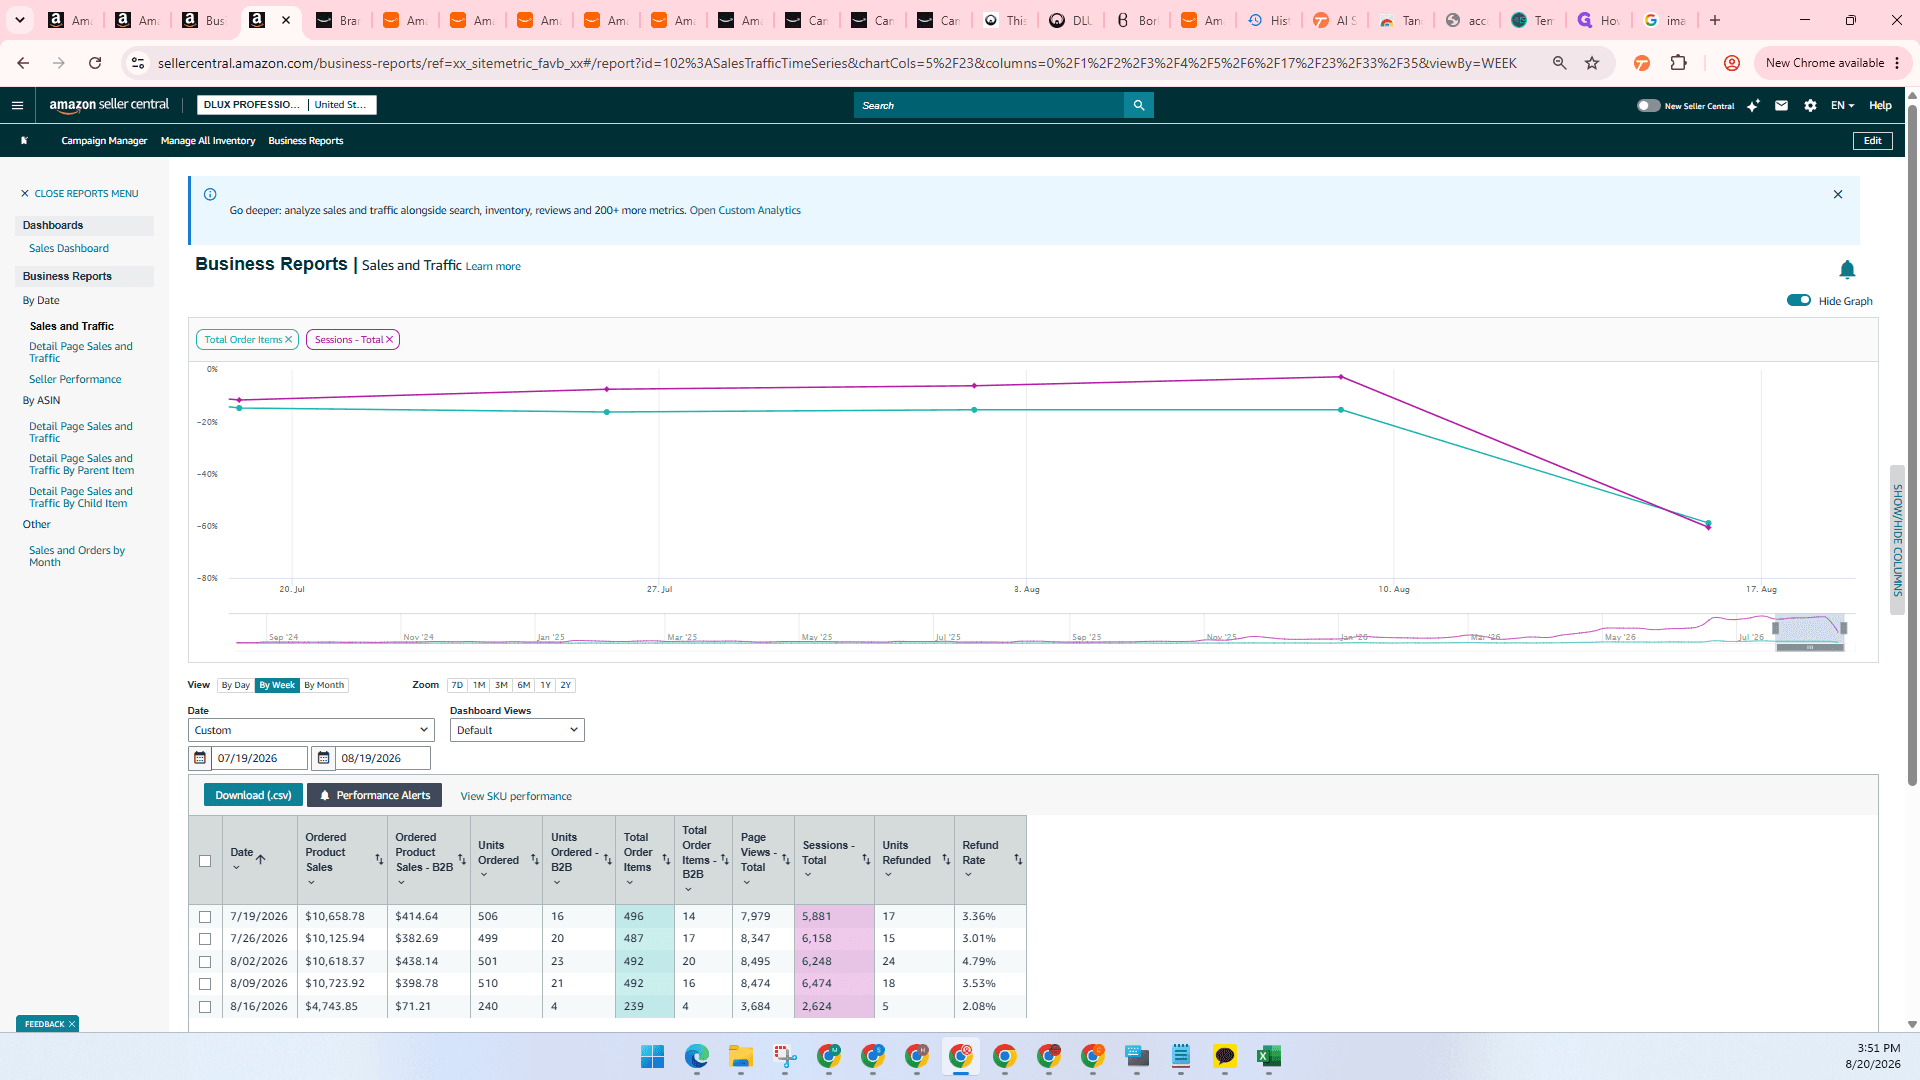
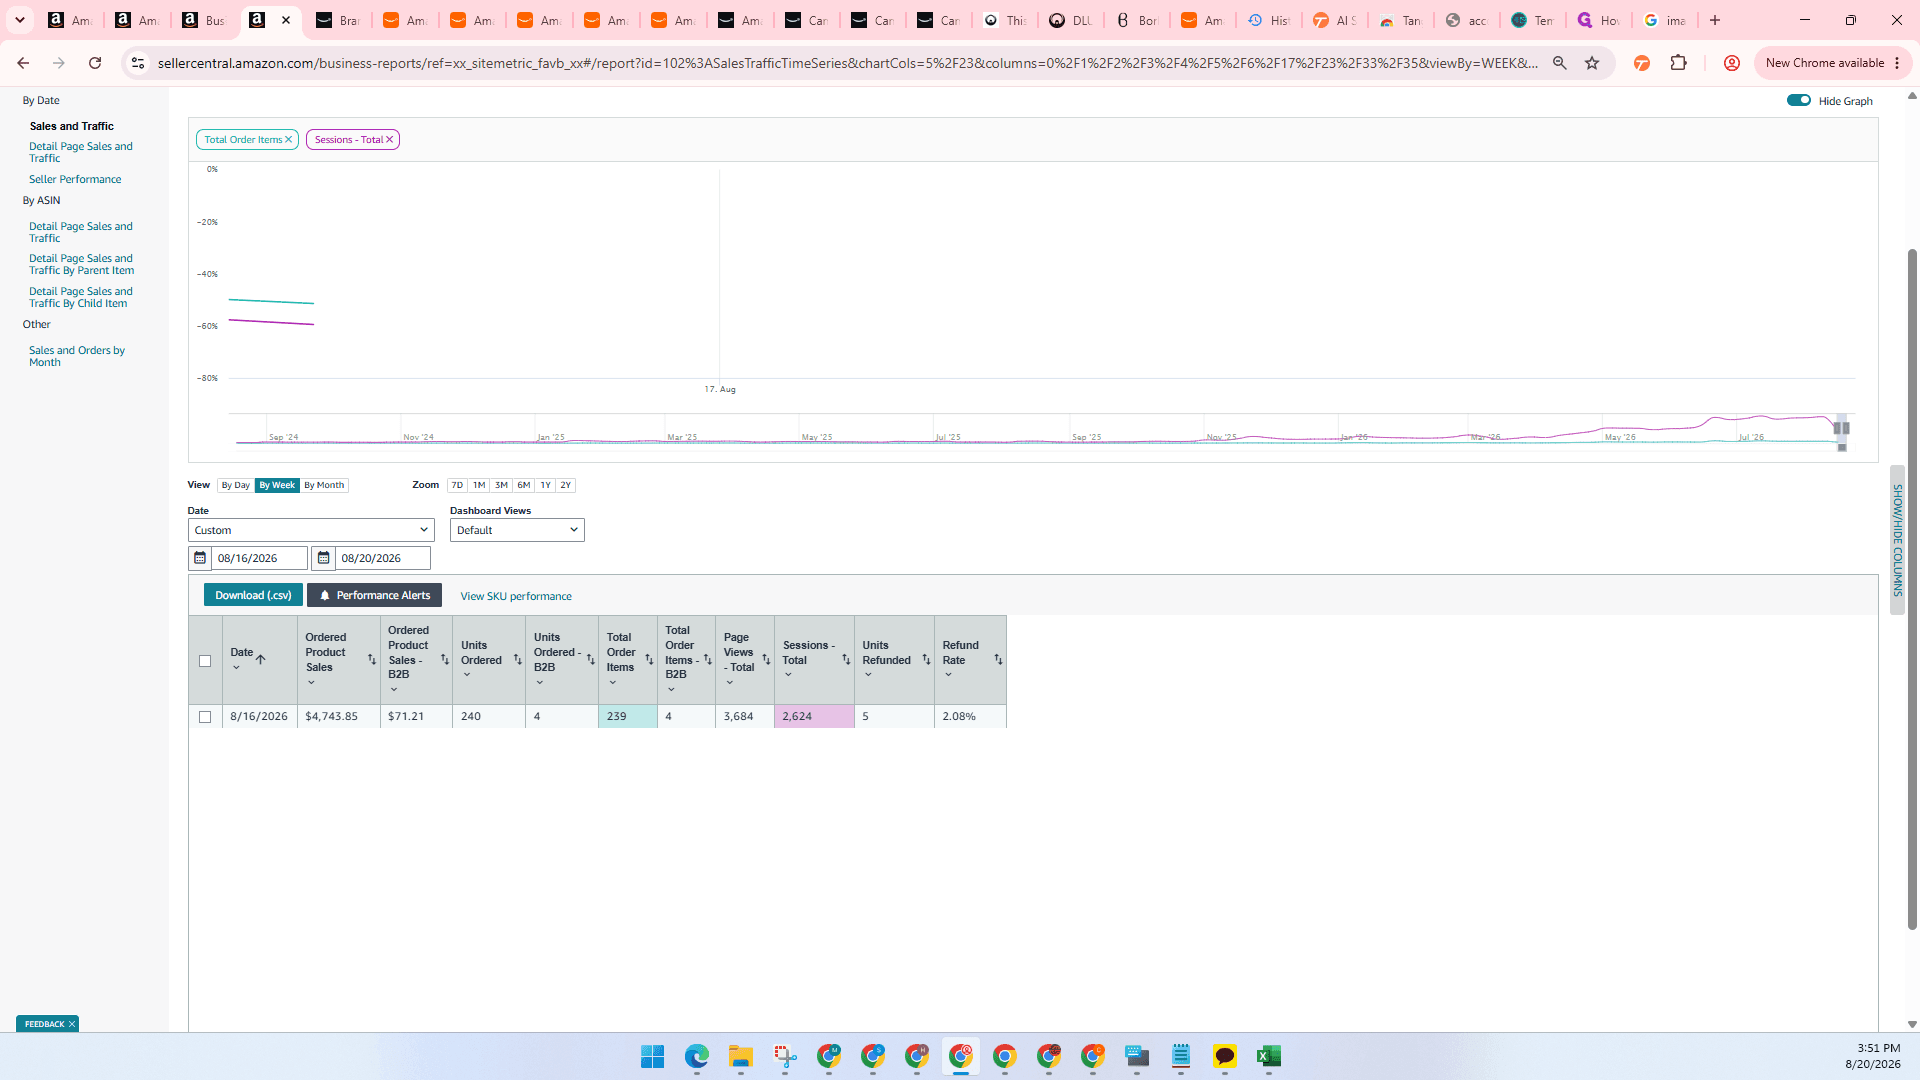
Shift + Ctrl + V to paste the values without formatting into their respective rows.Store Follower Metrics
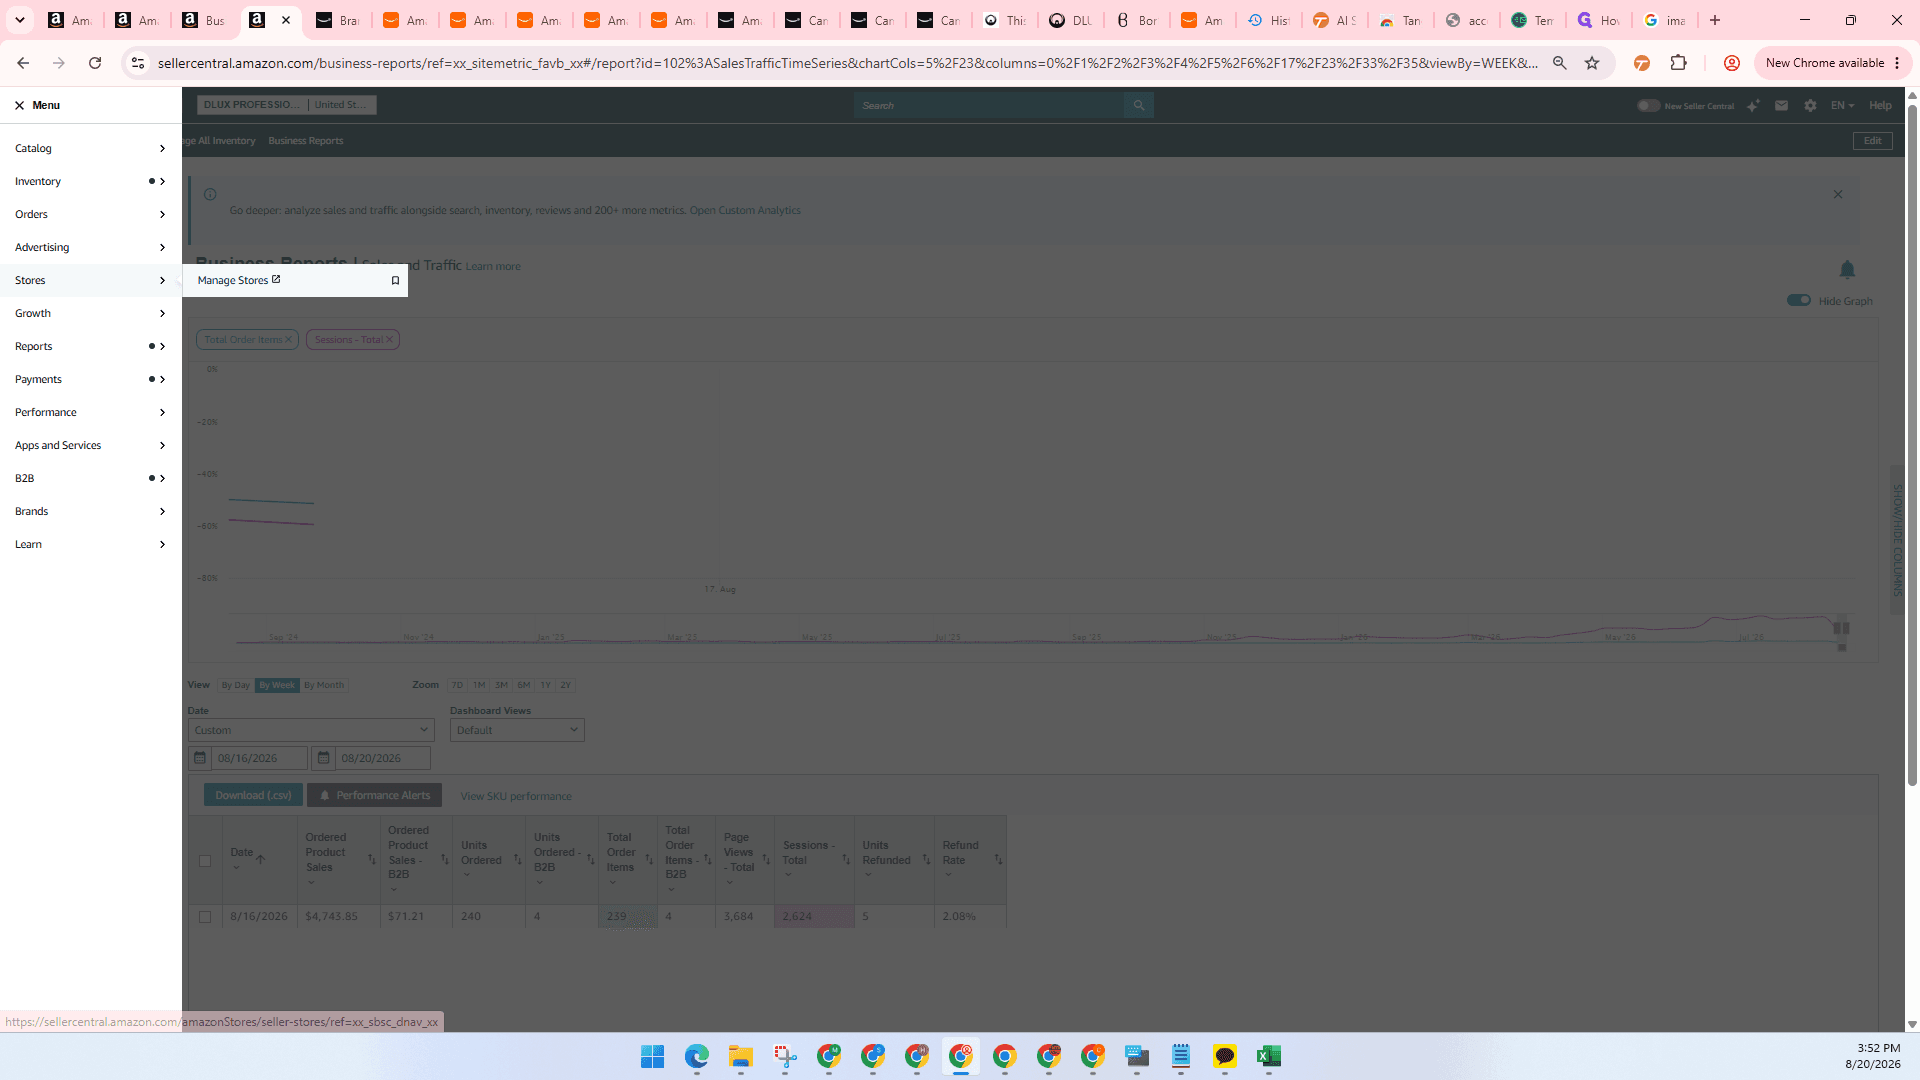
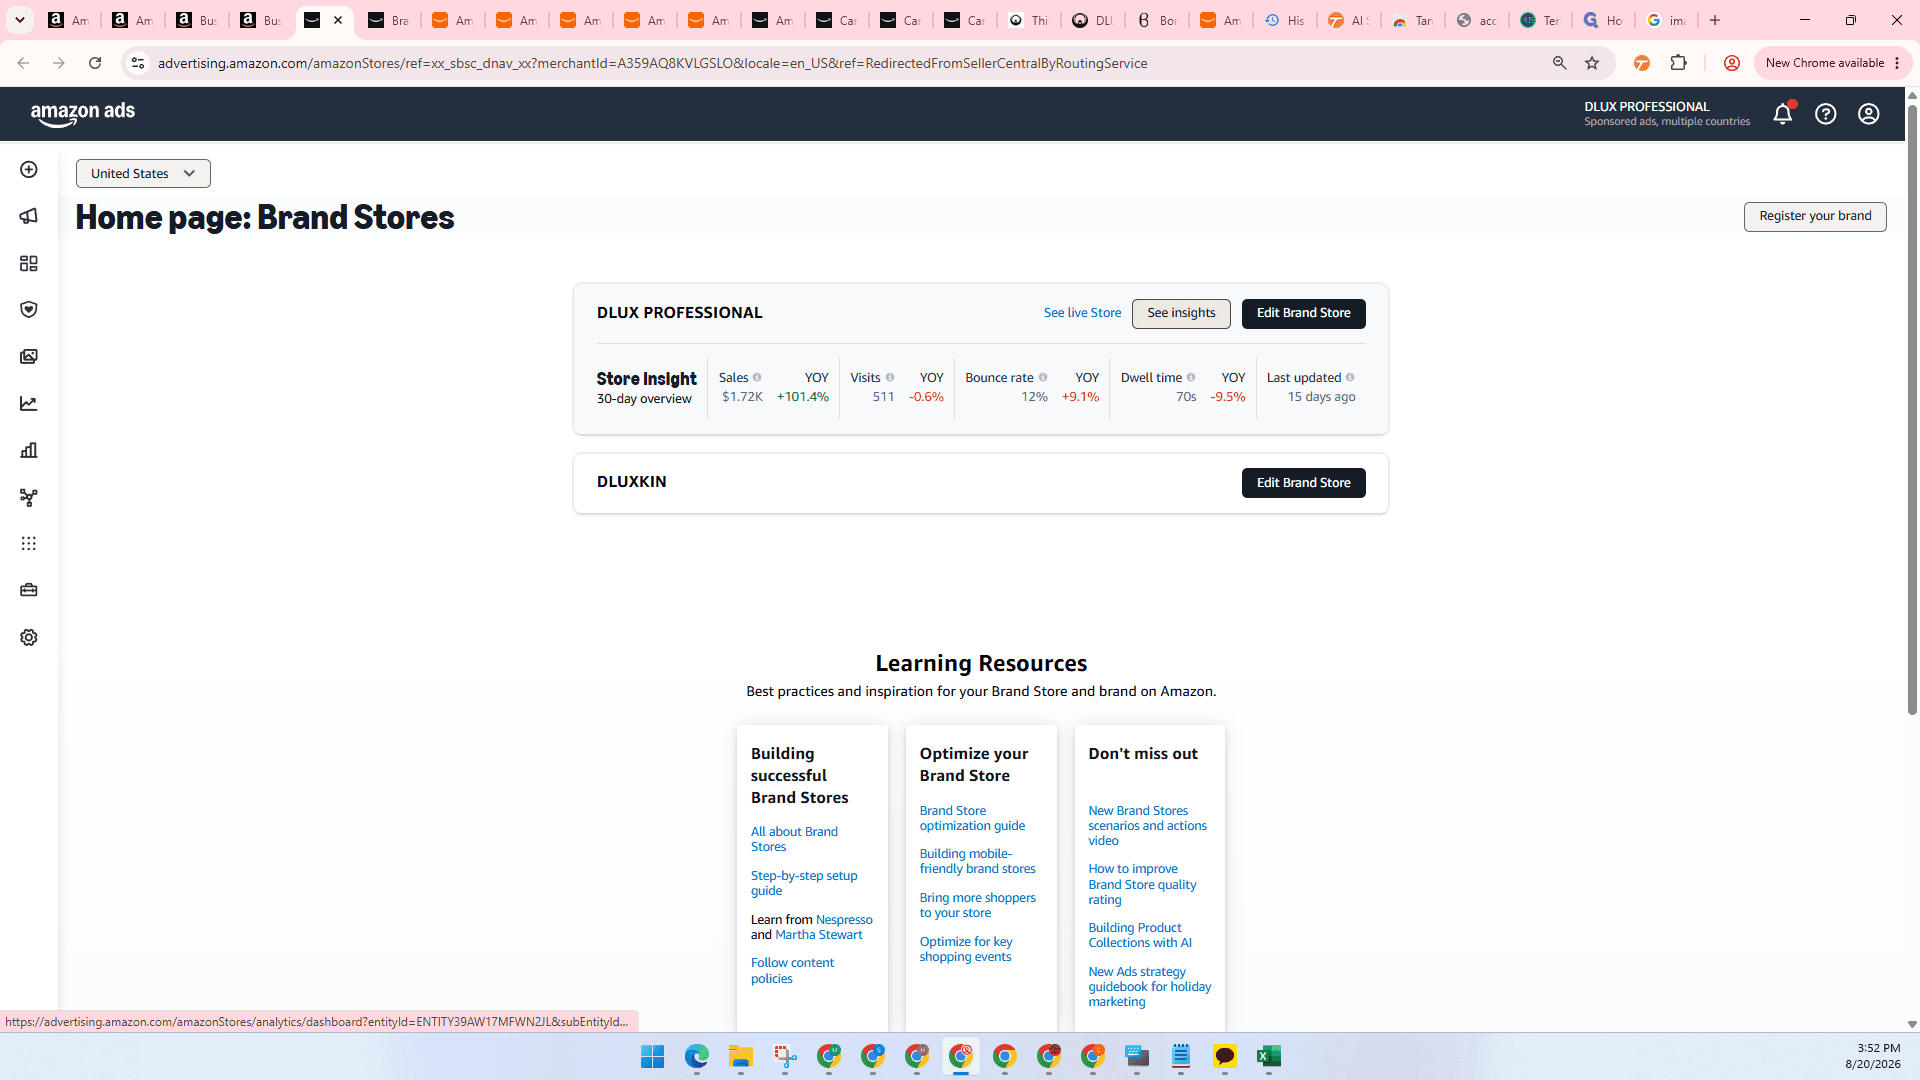
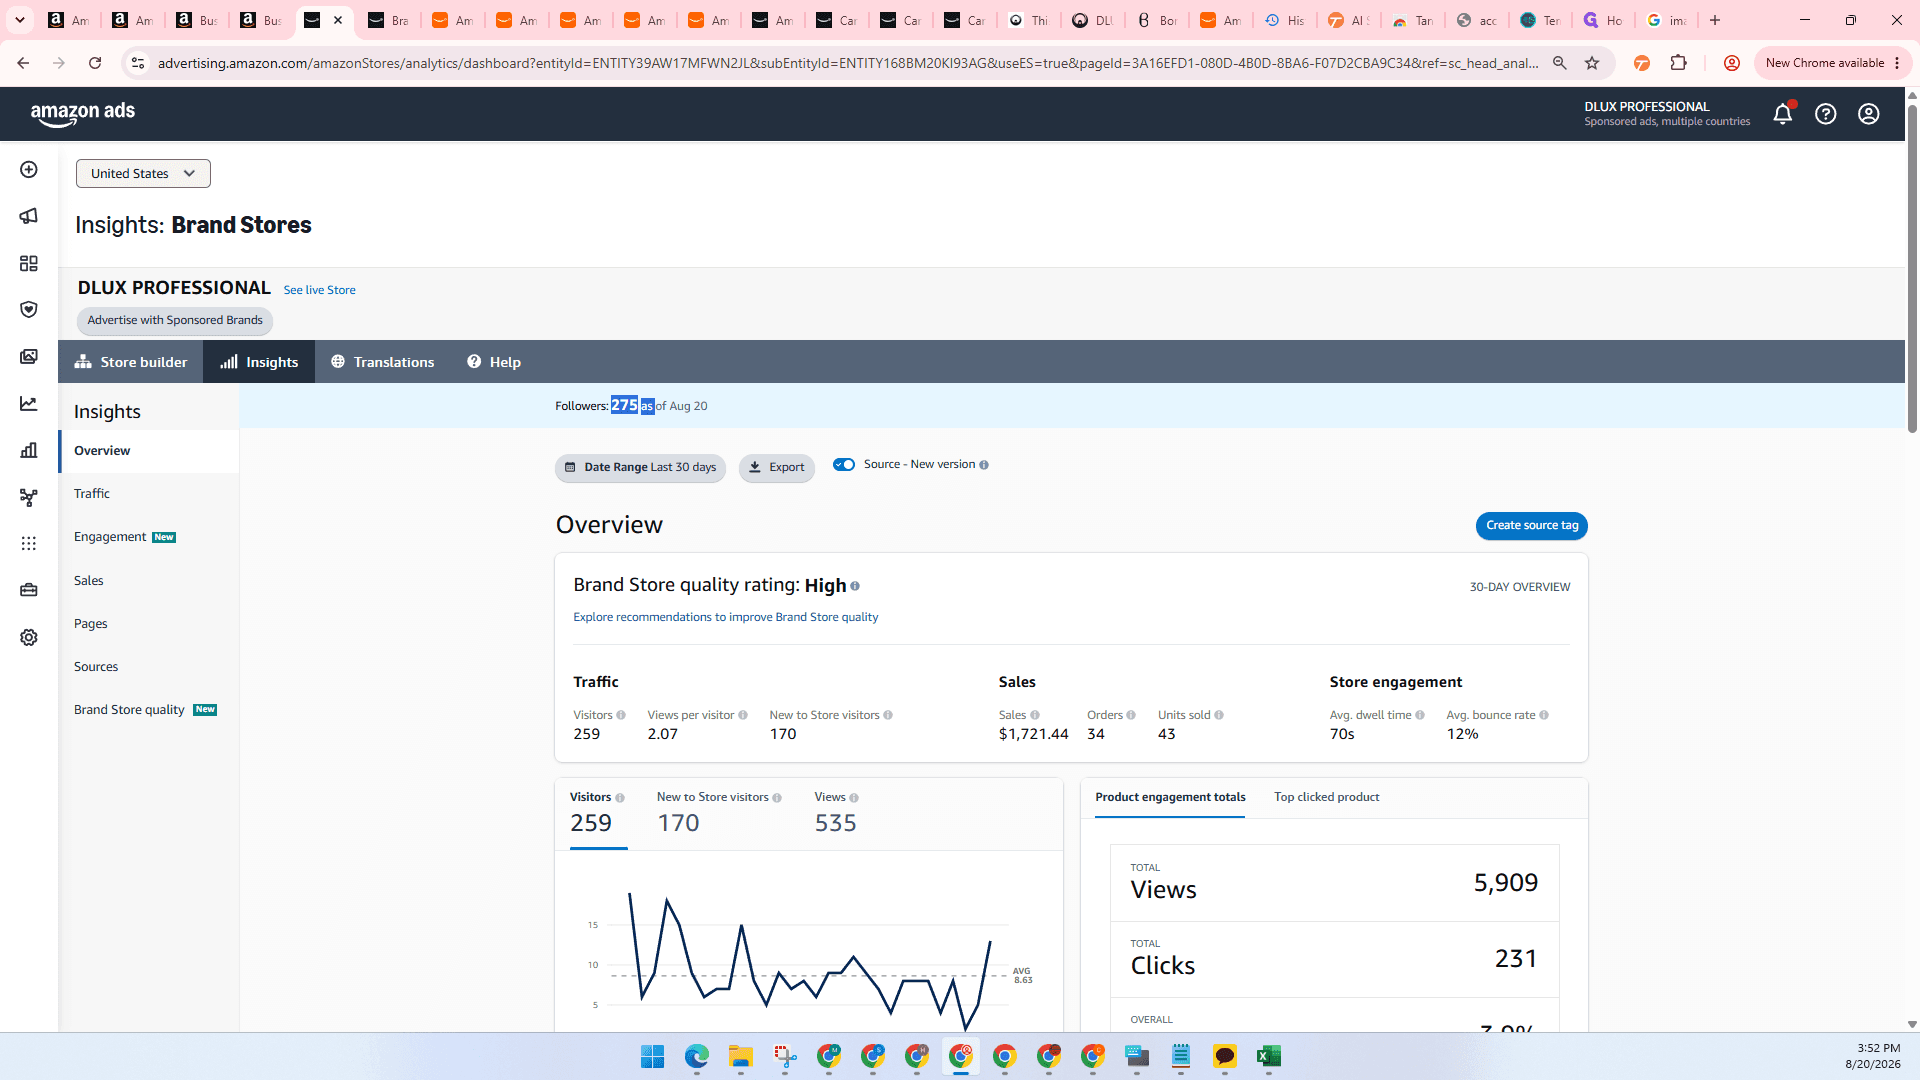
PPC Advertising Metrics
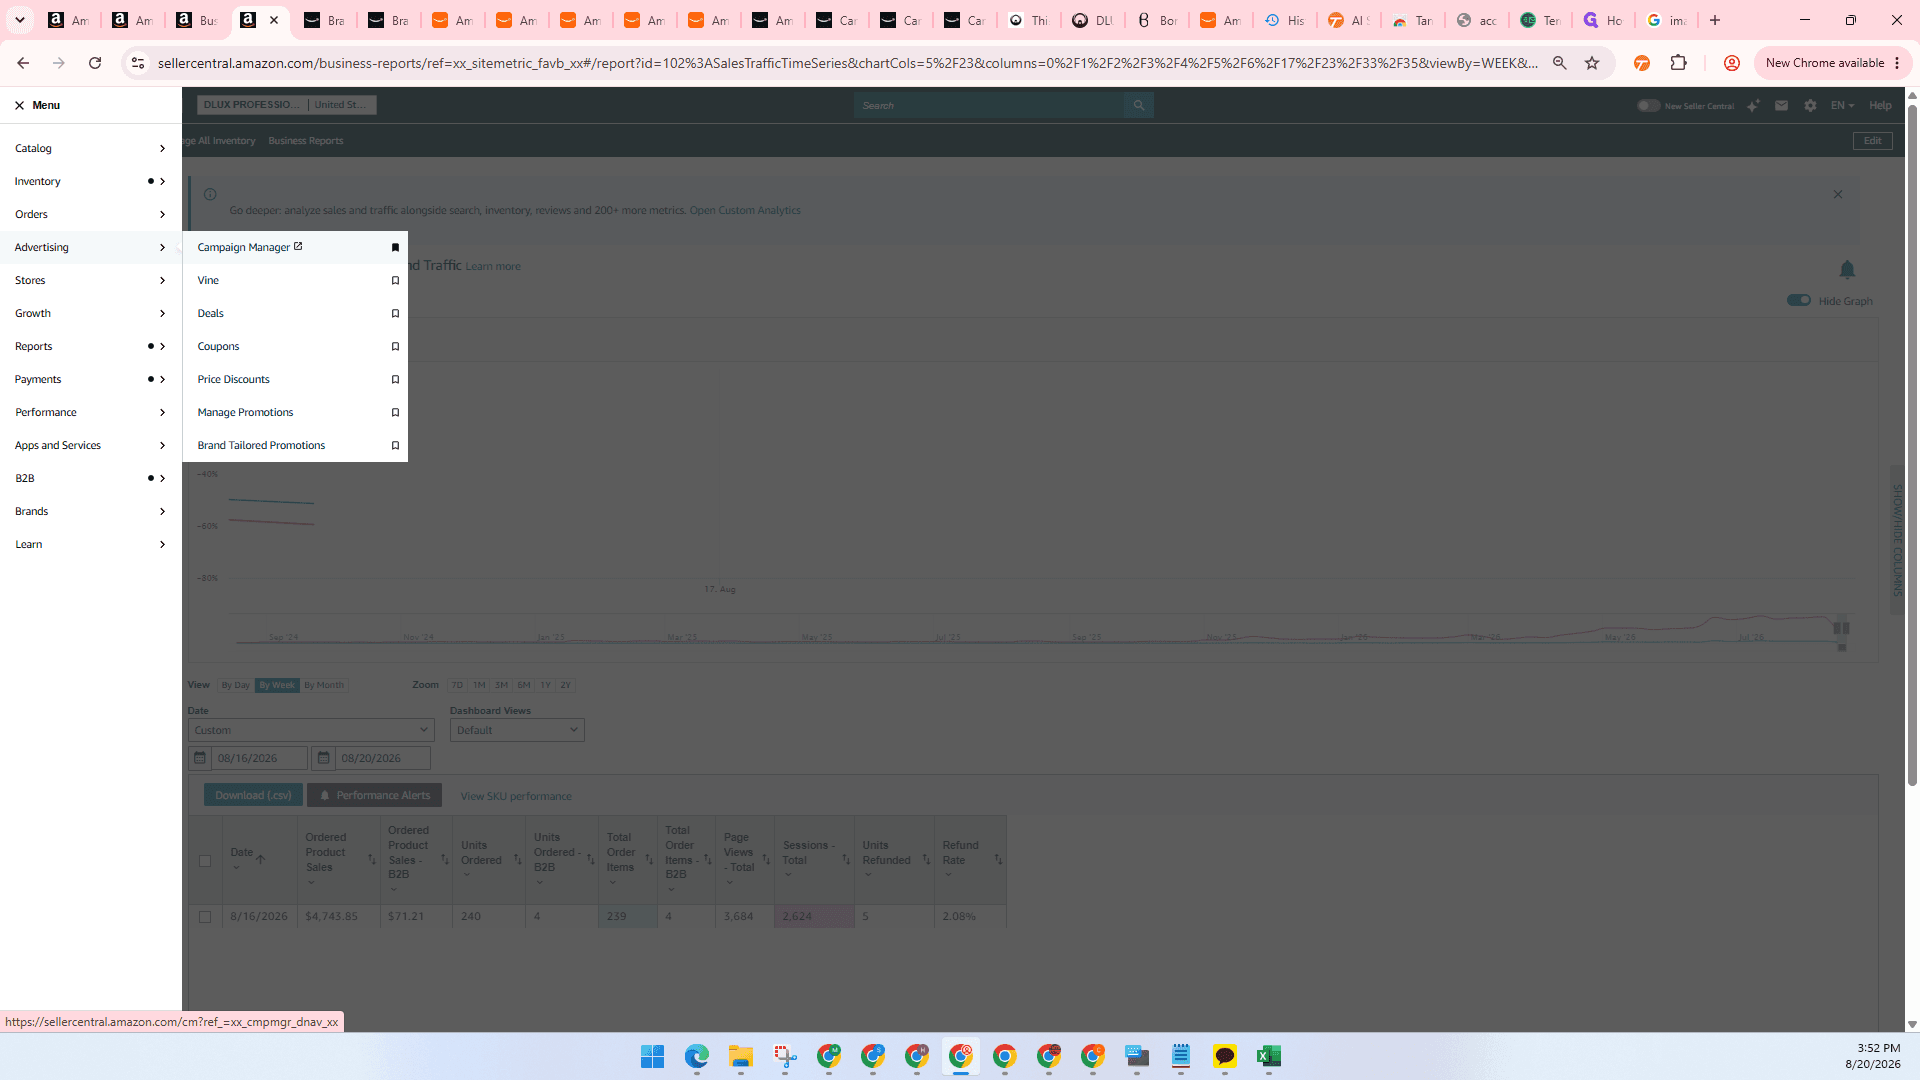
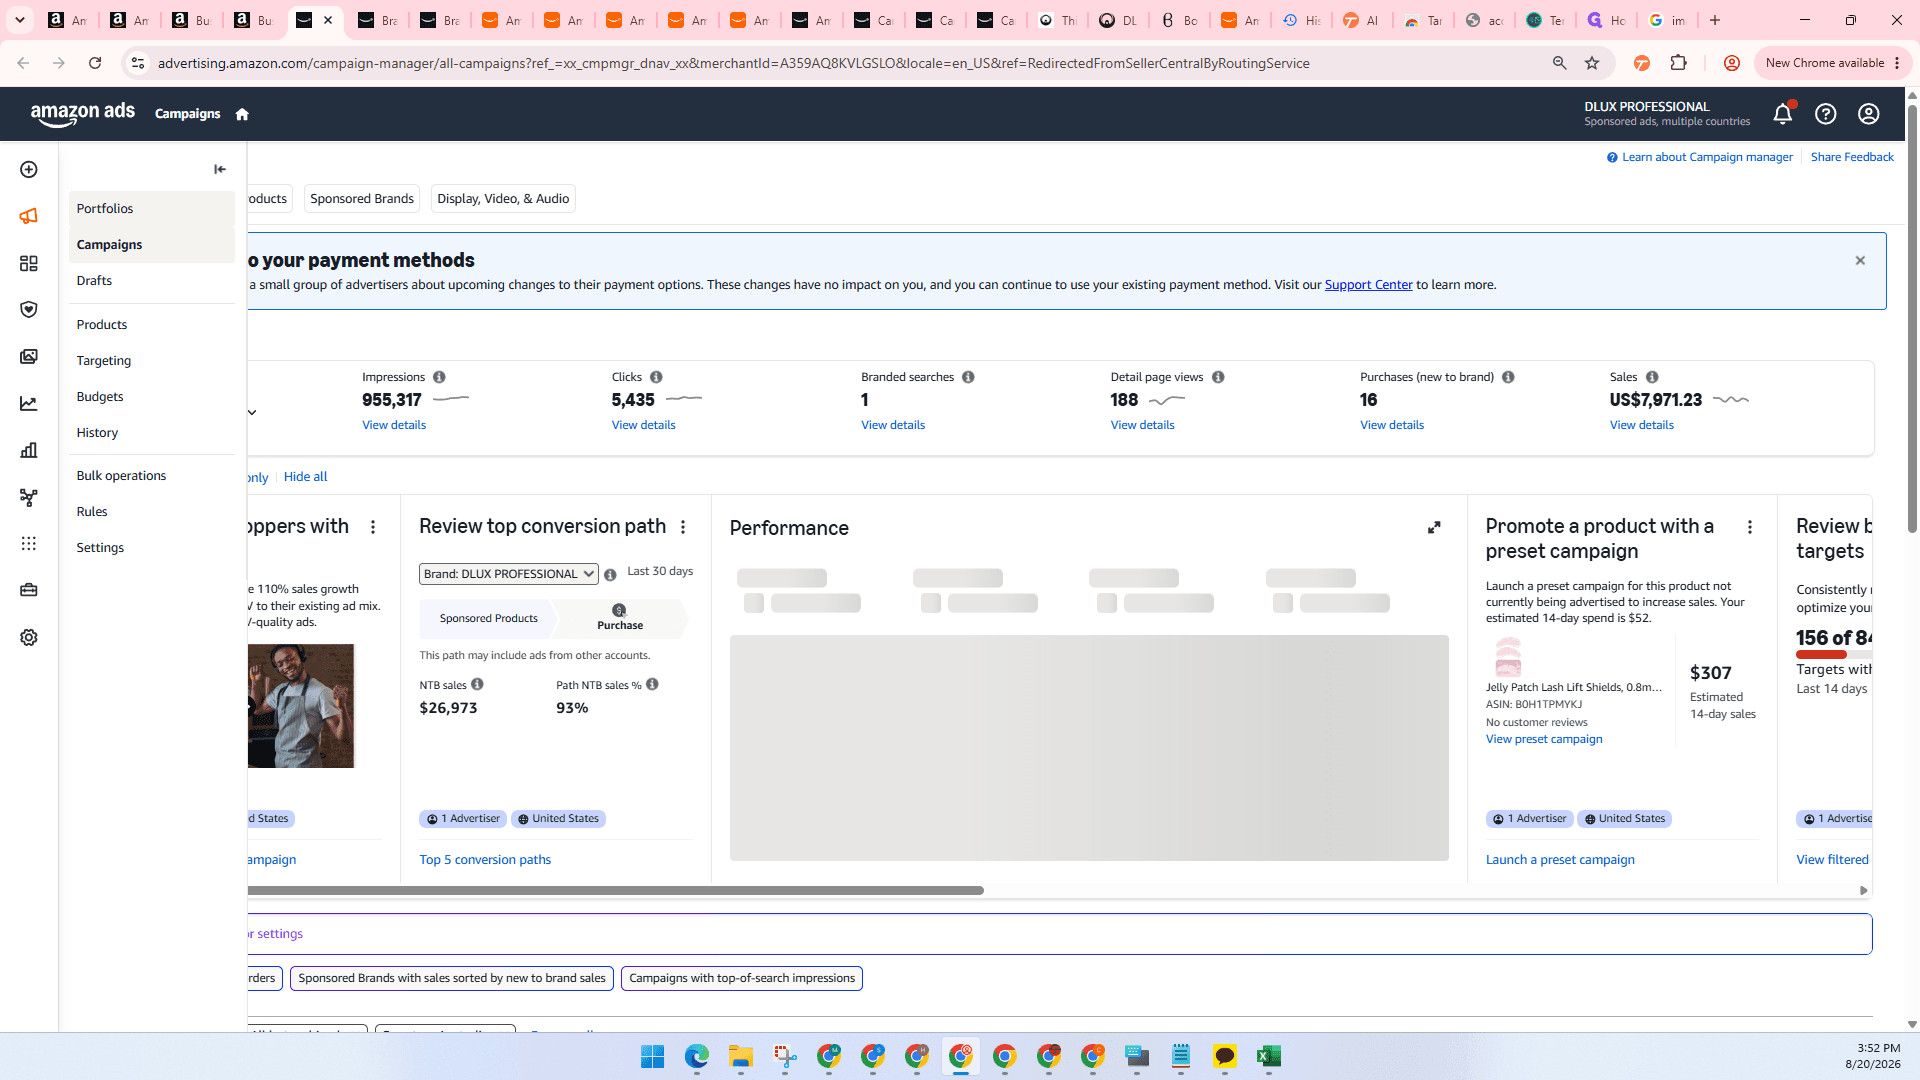
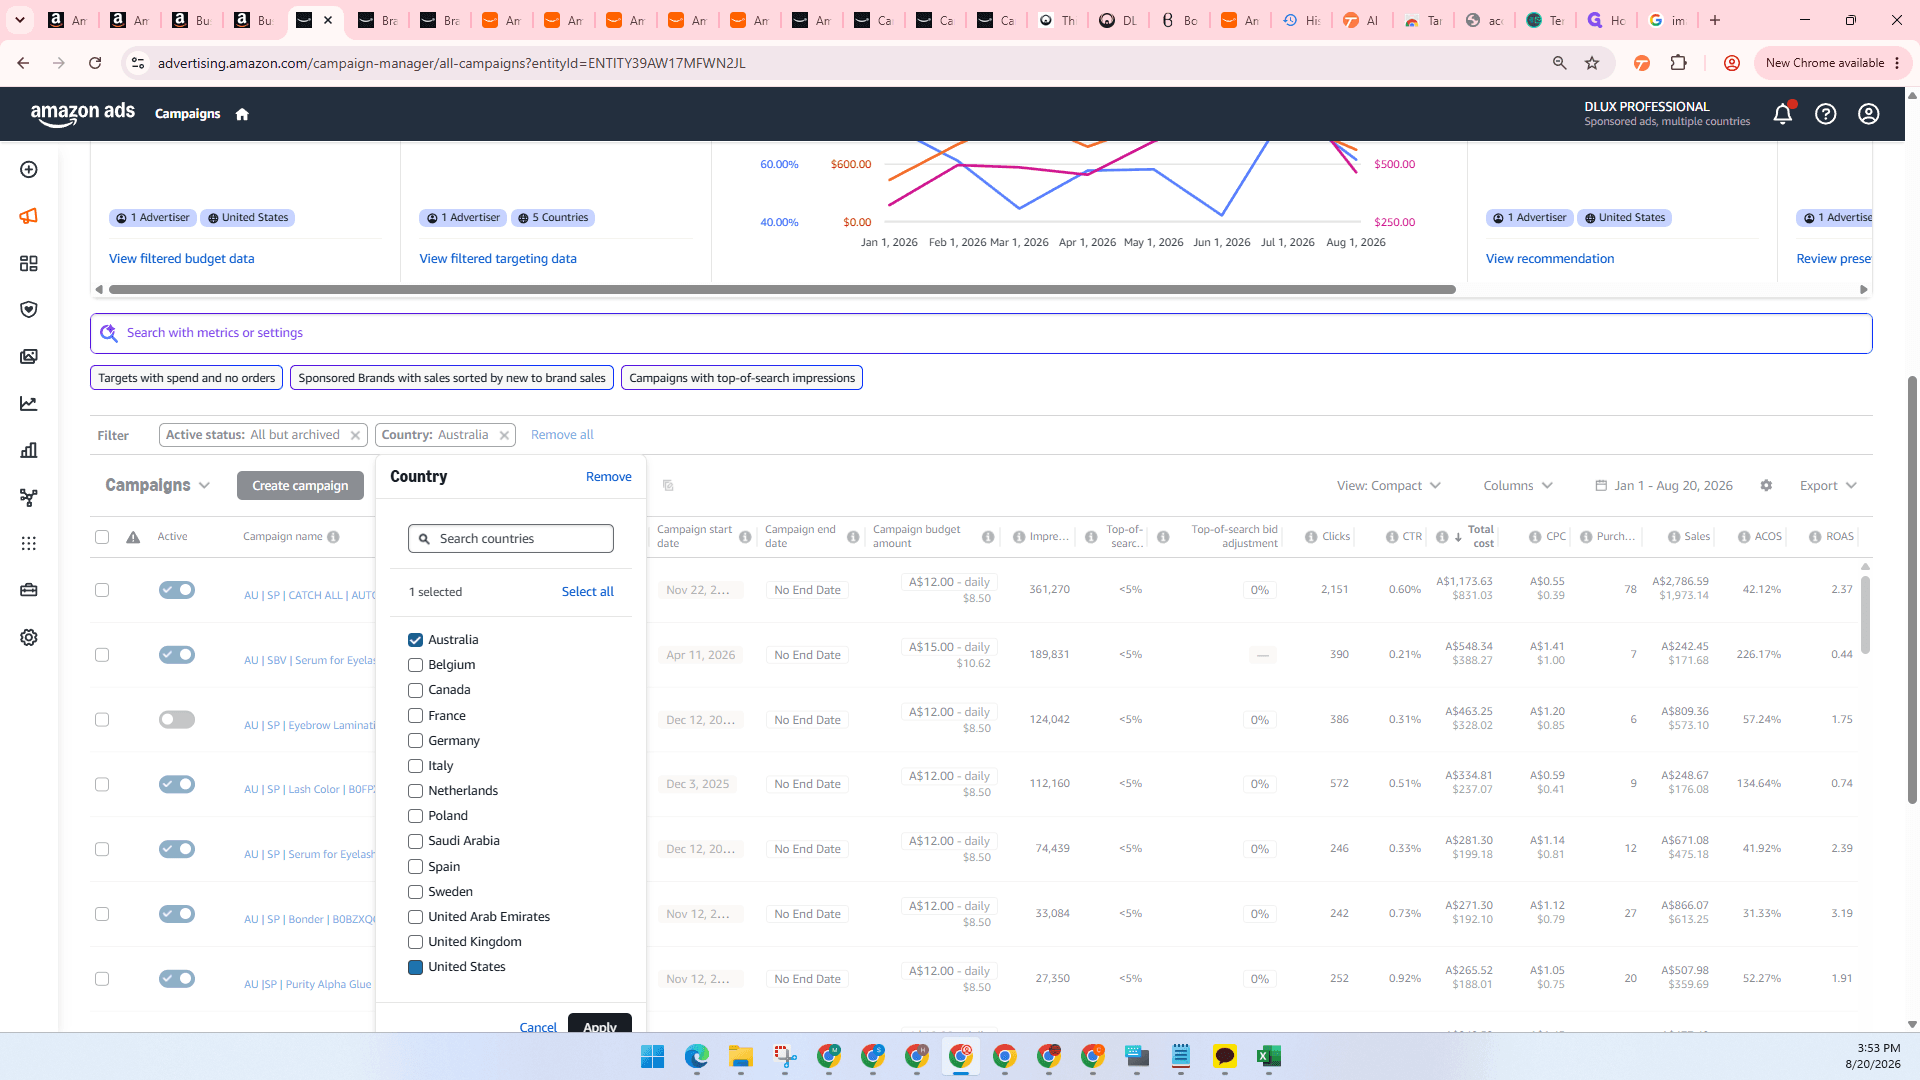
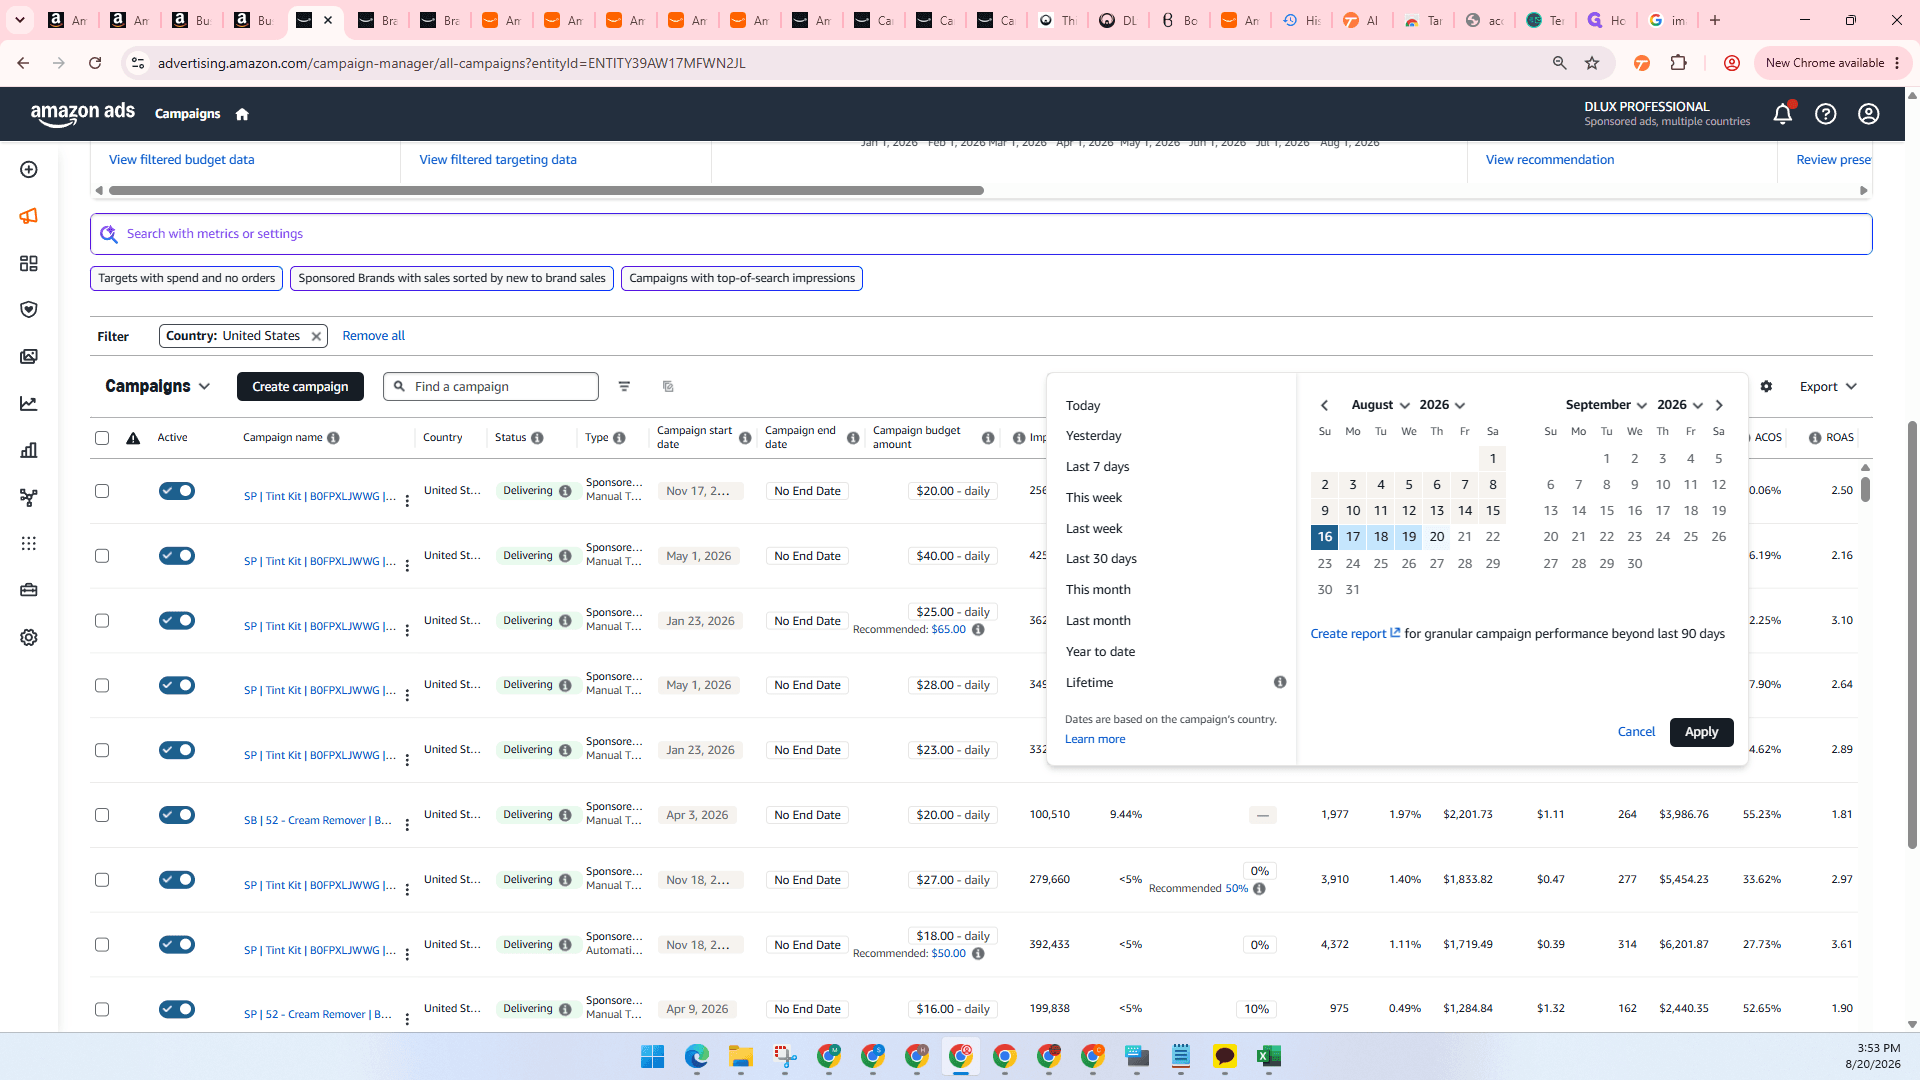
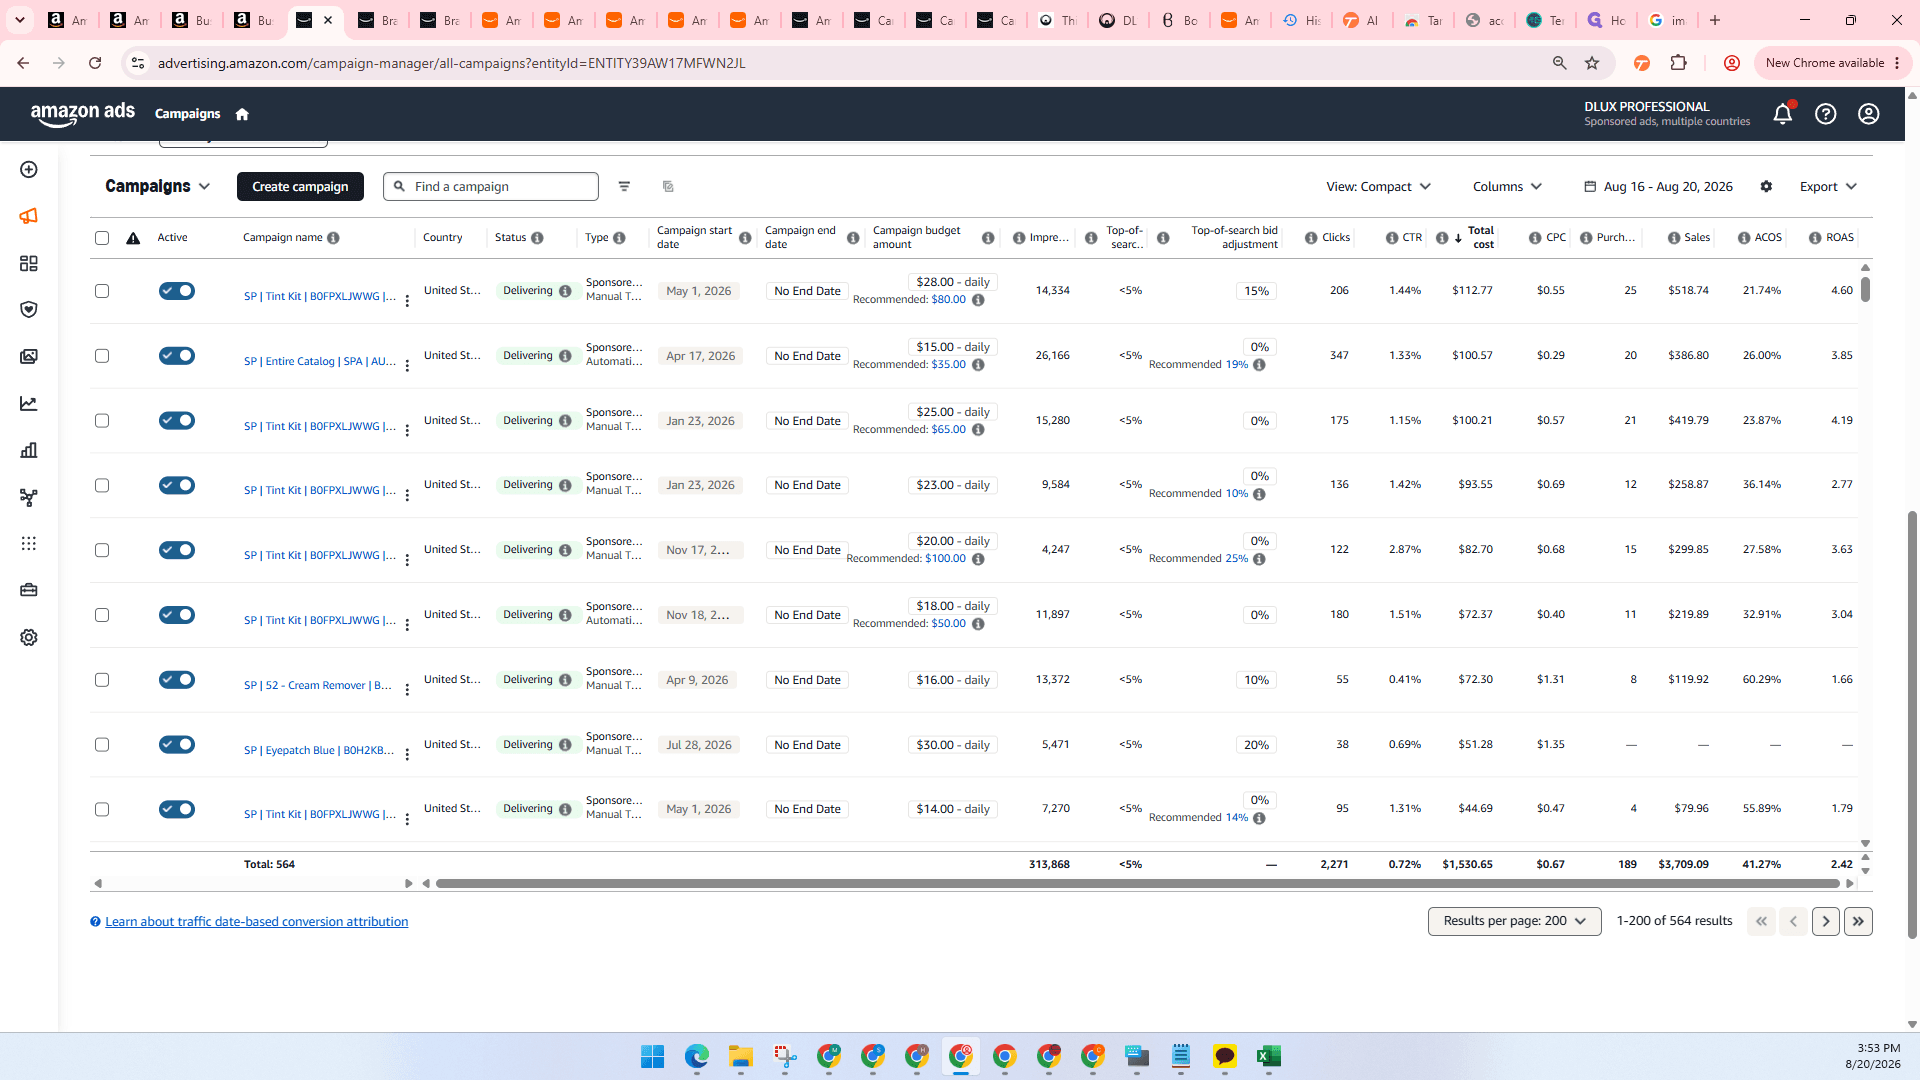
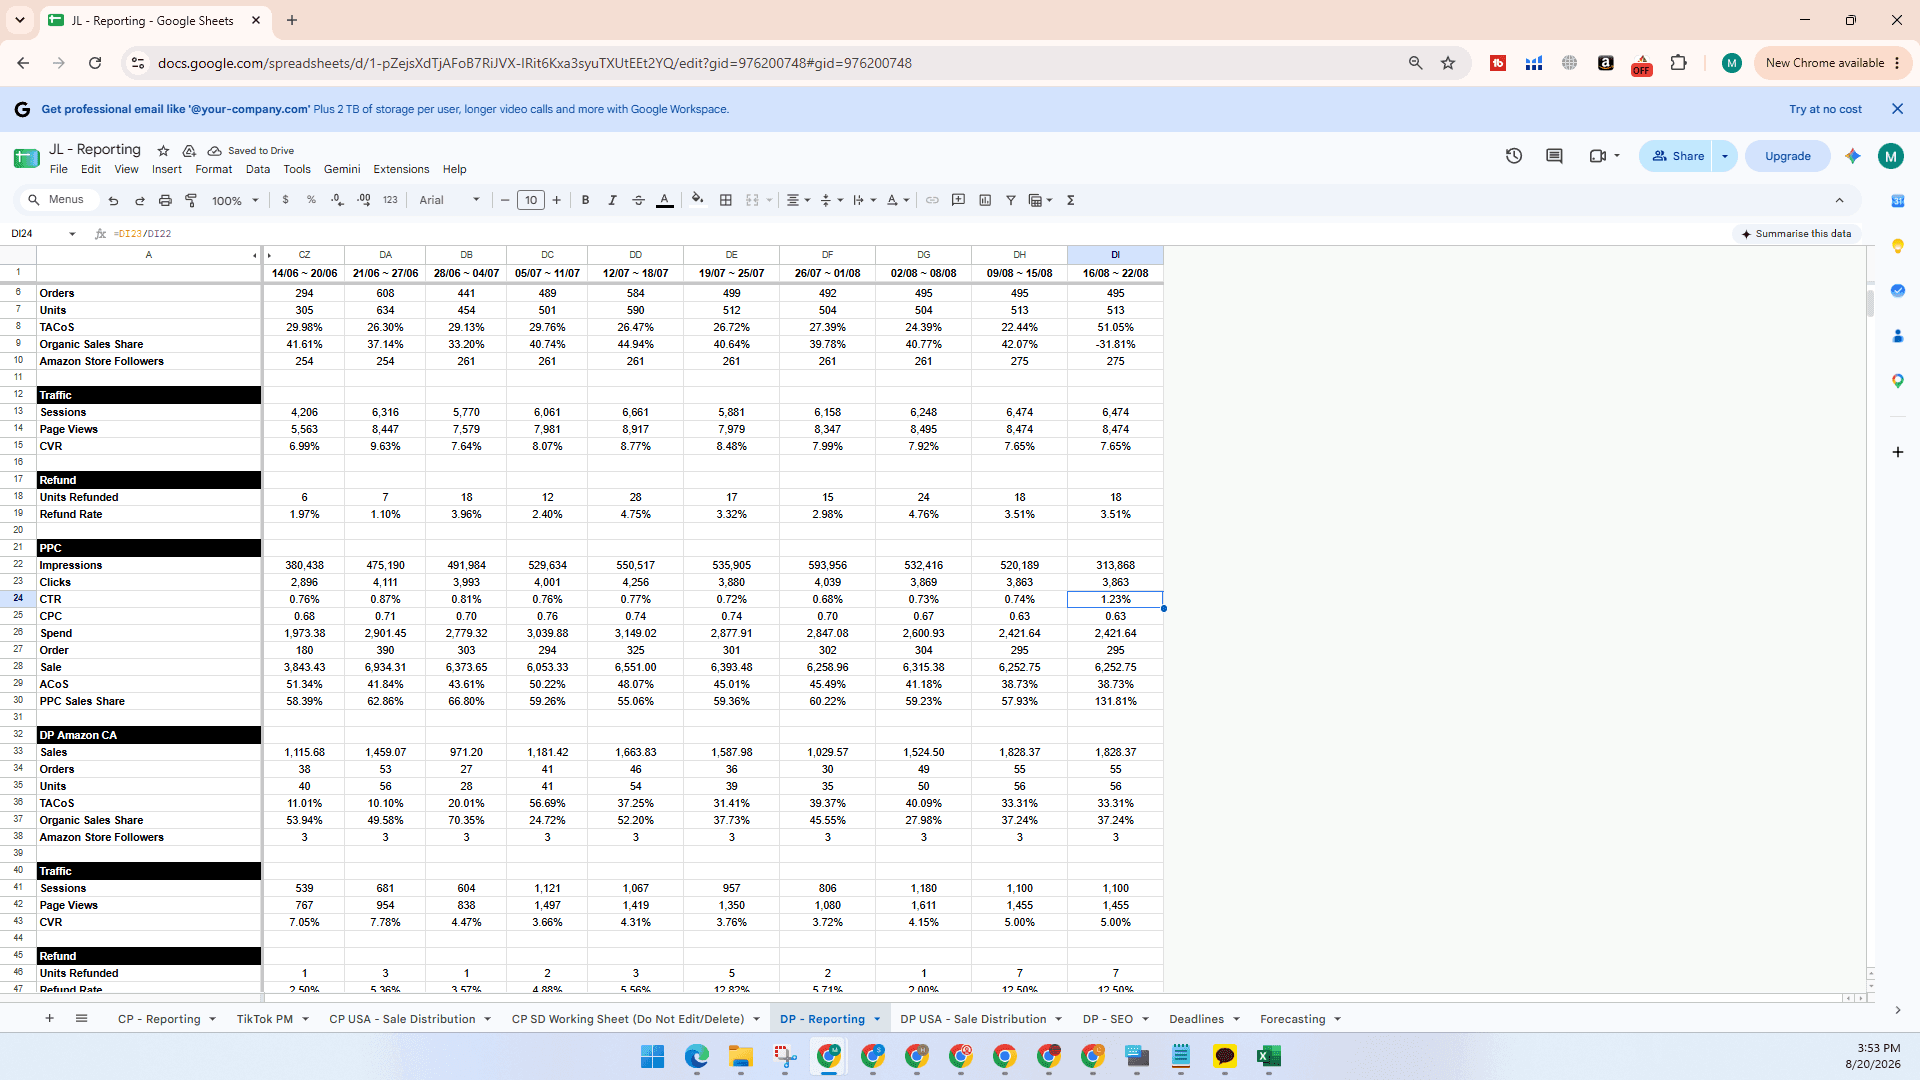
Shift + Ctrl + V to paste them into the PPC section of your Google Sheet.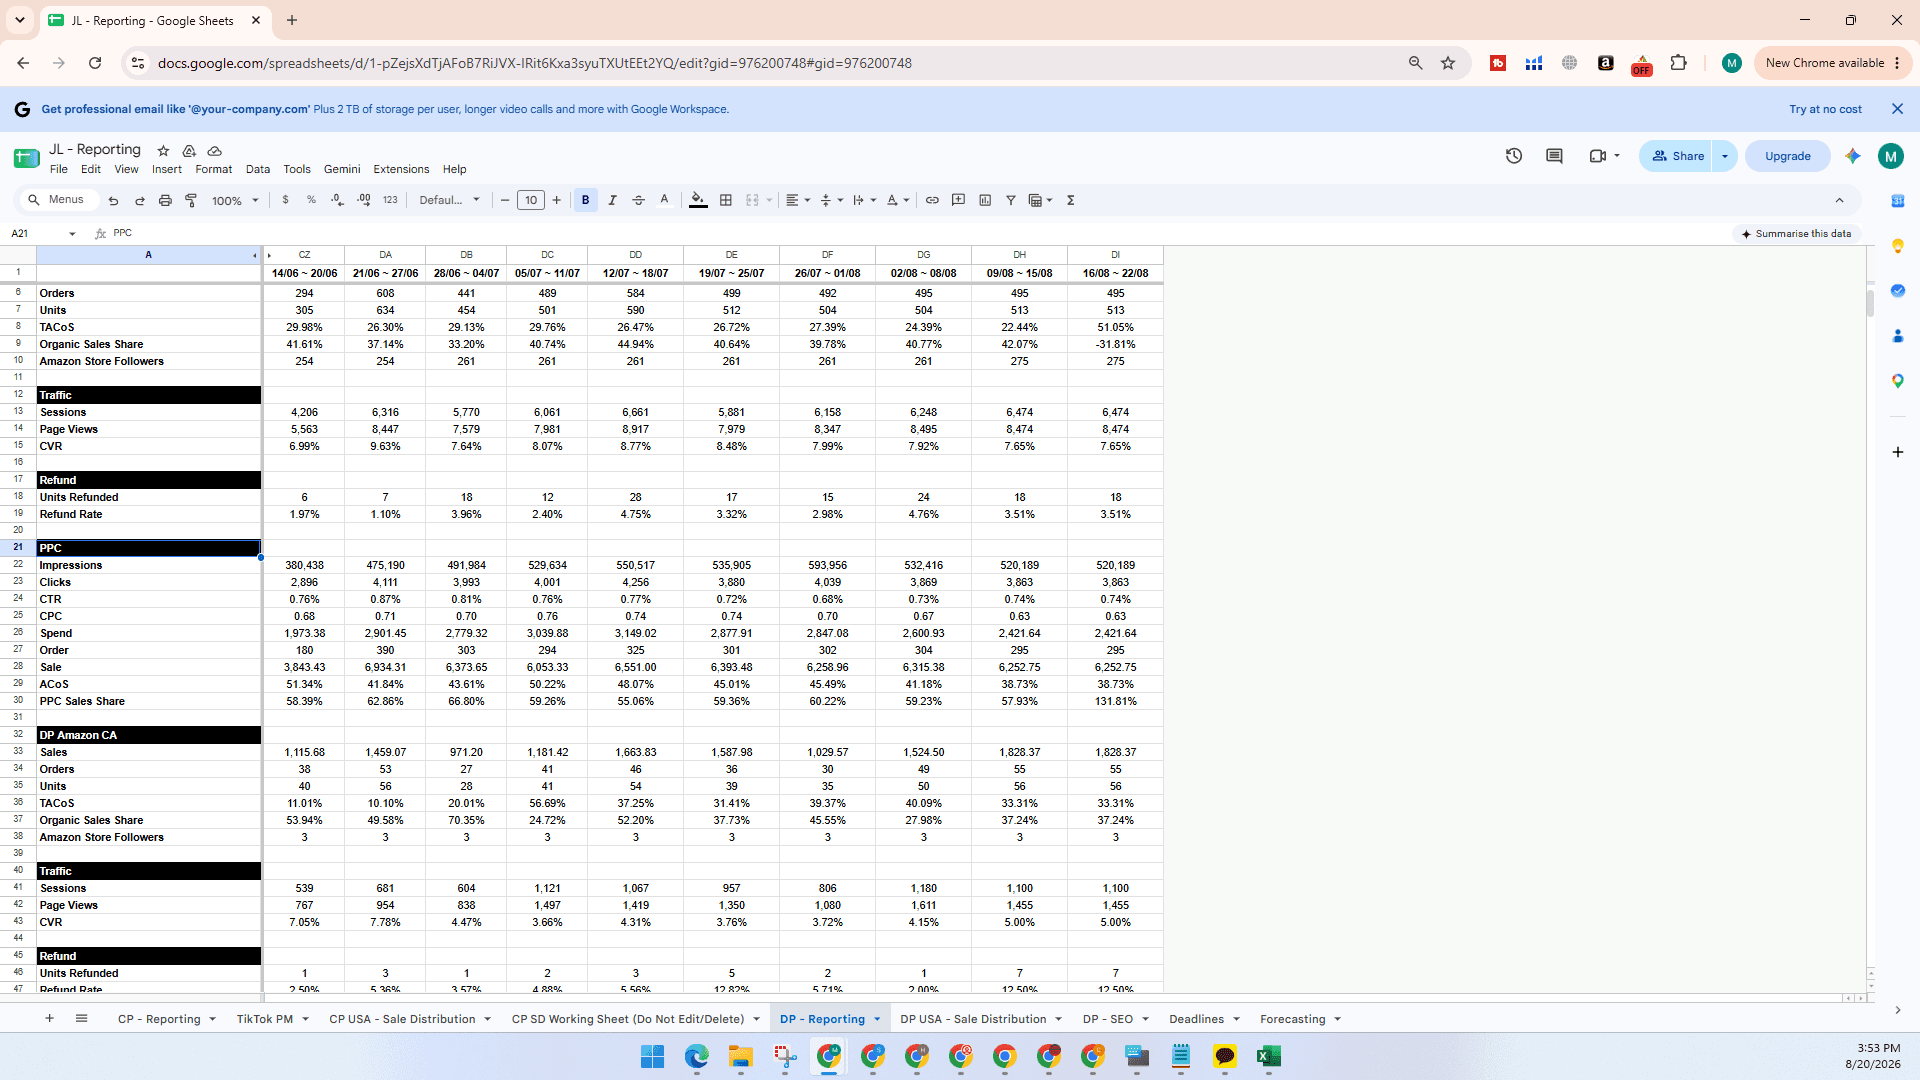
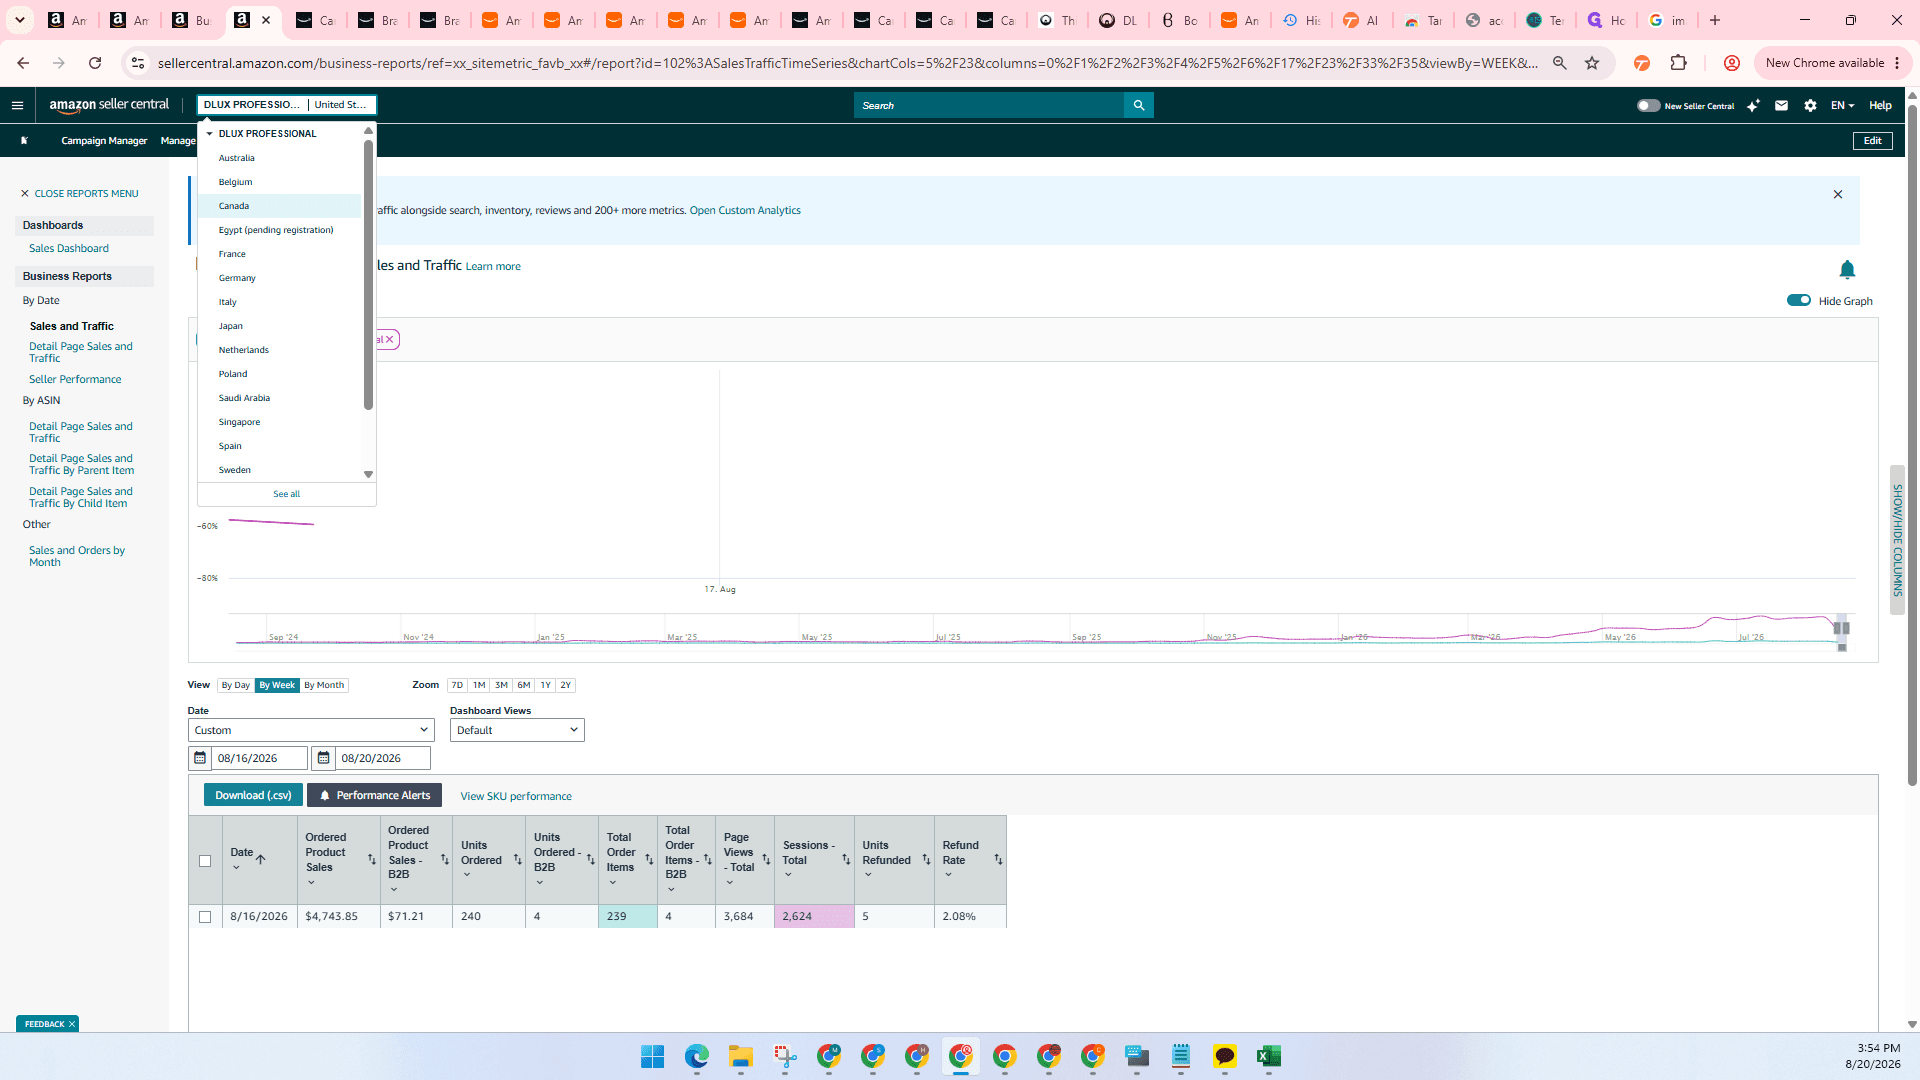
Q: Why is it important to check the selected marketplace before copying data?
A: The data changes entirely depending on the regional marketplace (e.g., US vs. Canada). Pulling metrics without verifying the active marketplace will result in reporting inaccurate data for your target region.
Q: Do I need to manually calculate my Click-Through Rate (CTR) and Cost Per Click (CPC)?
A: No, when you paste your primary metrics like impressions, clicks, spend, and sales, your Google Sheet formulas will automatically calculate composite metrics like CTR and CPC.
Term | Definition |
|---|---|
PPC (Pay-Per-Click) | An advertising model where you pay a fee each time one of your ads is clicked. |
CPC (Cost Per Click) | The average amount paid for a single click on an advertisement. |
CTR (Click-Through Rate) | The percentage of people who click an ad after seeing it. |
Sessions | The number of unique visits to your product pages by users within a given timeframe. |