Enhance User Experience with Team Support's Insights 2.0
Discover how Team Support's Insights 2.0 simplifies dashboard creation and KPI management for SaaS companies with user-friendly features and direct app integration.
In this guide, we'll learn how to navigate and utilize Team Support's new Insights 2.0 feature. Insights 2.0 aims to simplify the process of creating dashboards and meaningful KPIs for your team. It offers the convenience of launching directly from the app, eliminating the need for separate logins.
You'll discover how to use pre-configured dashboards tailored for SaaS companies, focusing on metrics like tickets and agent performance. Additionally, you'll learn how to clone these dashboards as templates or create your own from scratch, enhancing your ability to track and analyze data effectively.
Let's get started
Team Support has introduced Insights 2.0 to enhance user-friendliness in creating dashboards and meaningful KPIs. This update allows for straightforward use without delving into complex interactions unless desired. A key benefit of Insights 2.0 is its ability to be launched directly from the app.
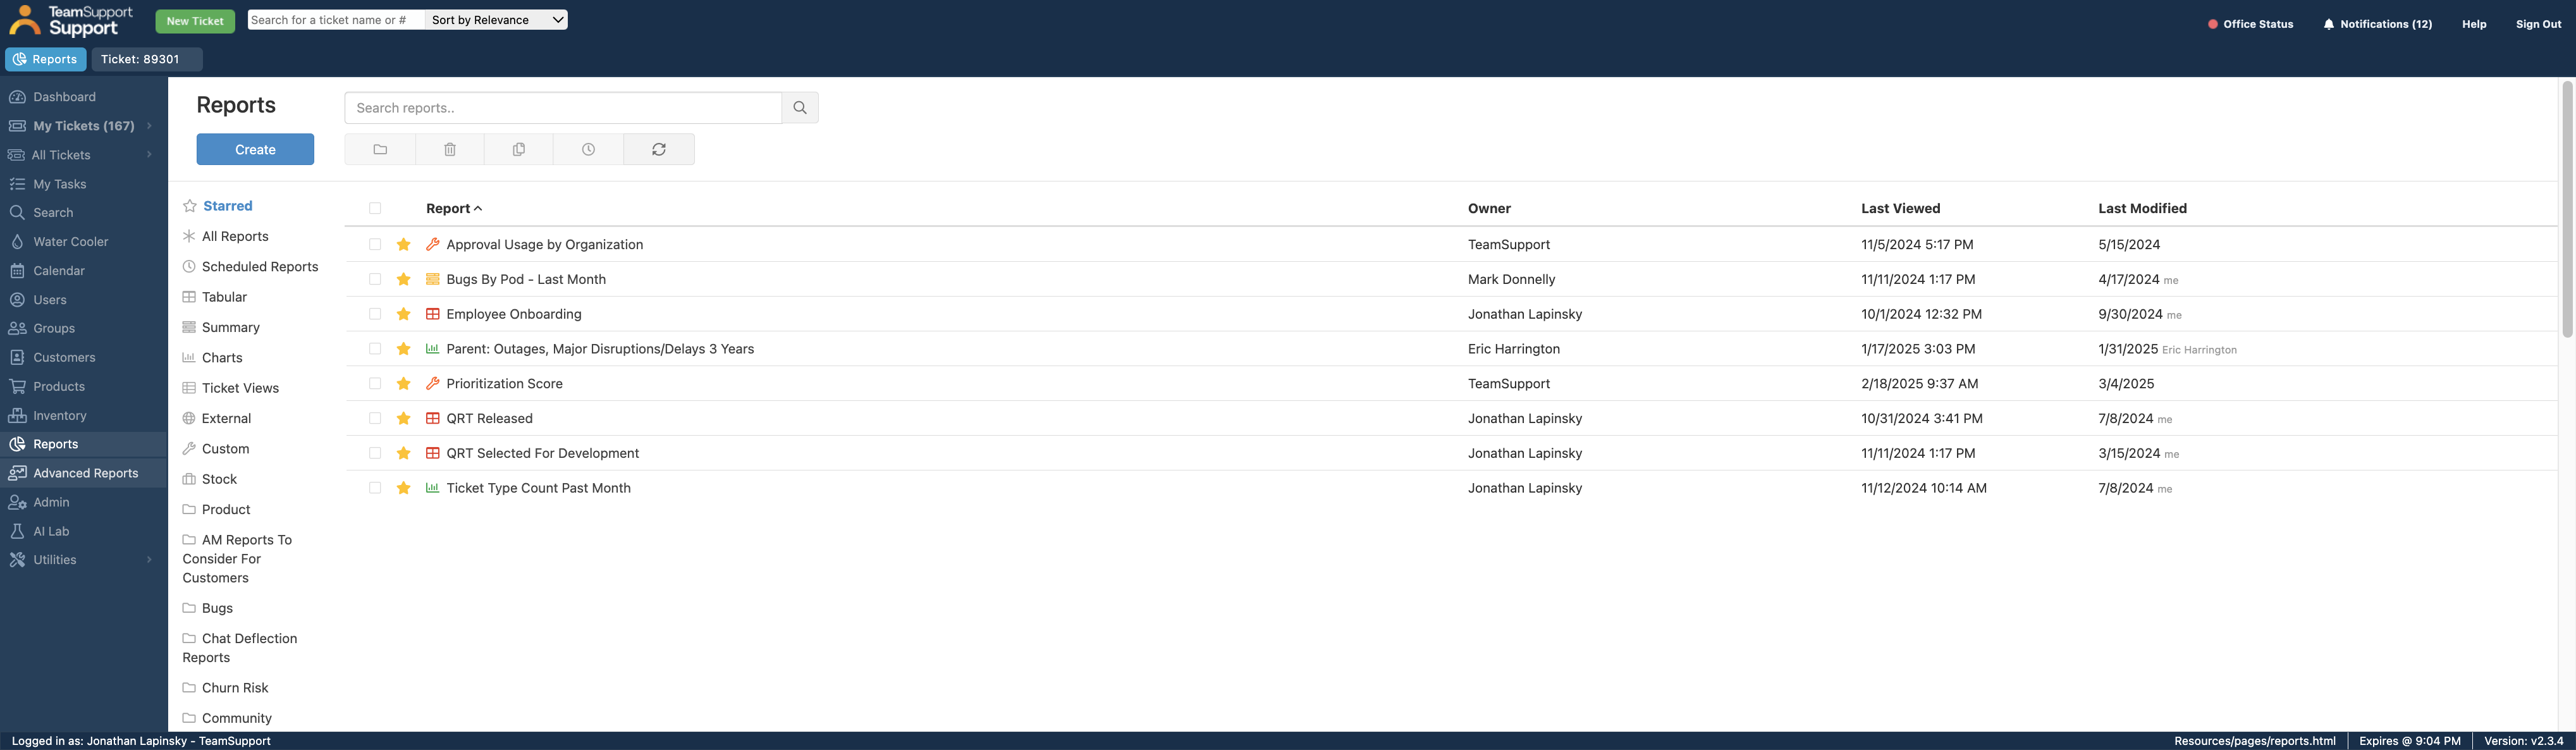
Click on Advanced Reports, and it will open in a new tab.
As a bonus, this will give you a sneak peek of the new UI changes coming in 2025: When you click Advanced Reporting, it will log you in directly, eliminating the need to open a separate app or page. This simplifies accessing reports. Upon logging in, you'll find two collection types. One is the Team Support collection, featuring pre-configured dashboards with metrics tailored for SaaS companies. These KPIs focus on tickets, agent performance, and product performance. There is no set up required with these dashboards, your data is pre-populated in the charts. If these metrics match what you are looking for, you are off and running no set up required. If you have additional, business specific metrics that you are looking to build, we have that too.
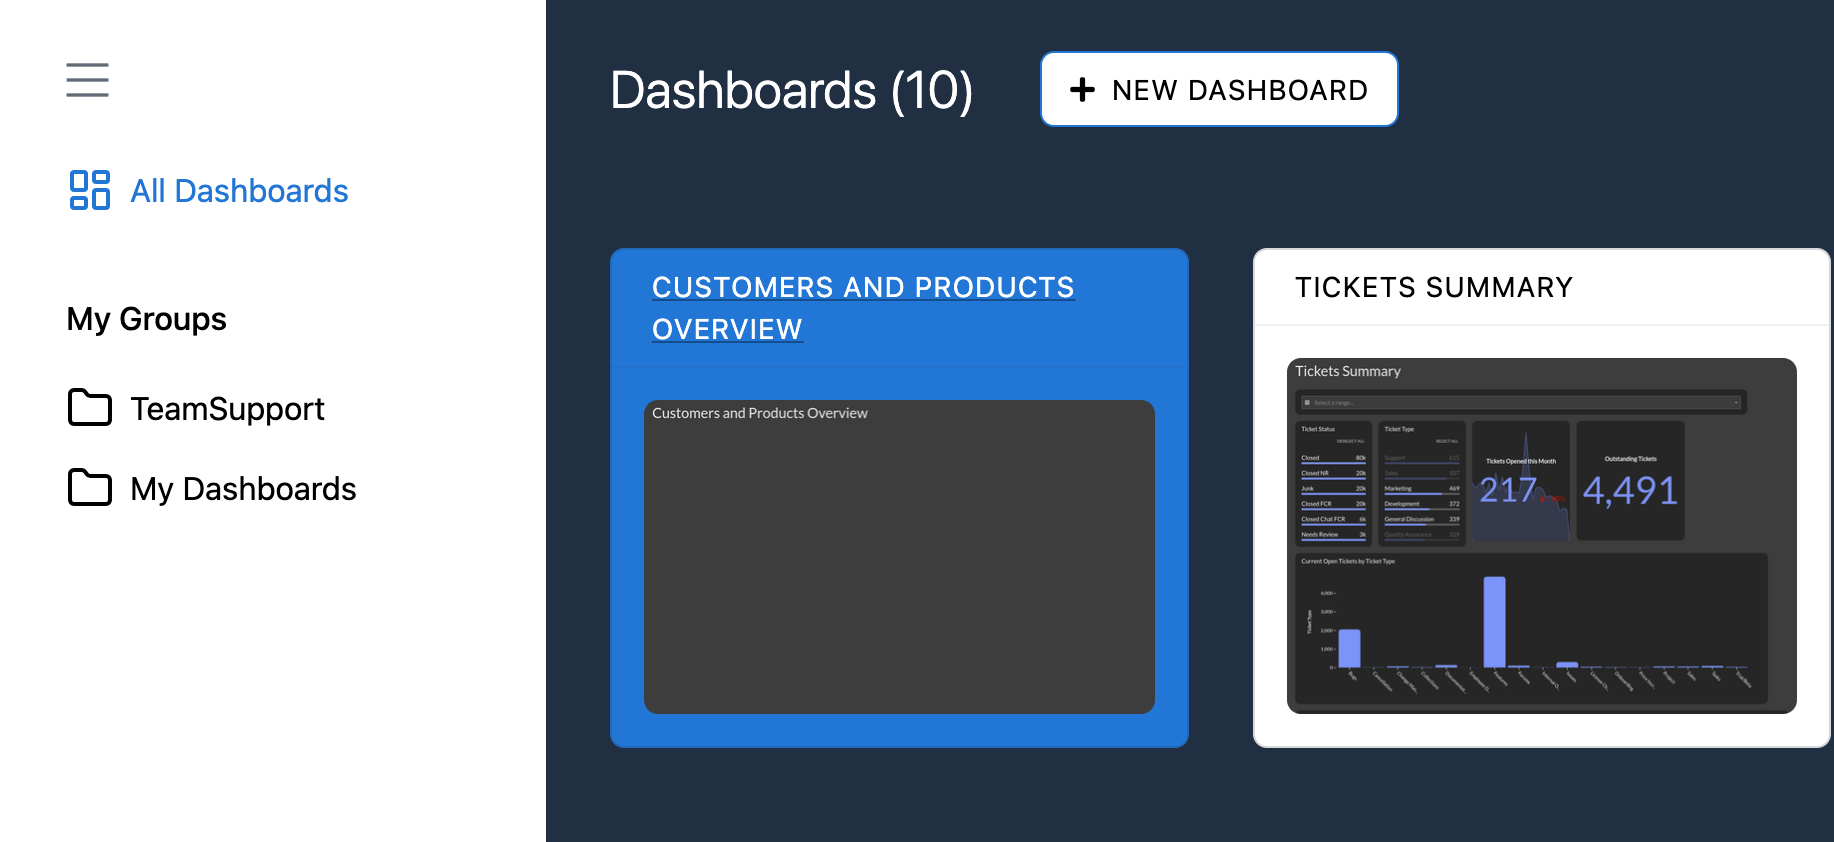
You'll find a selection for My Dashboards, where you can create business specific dashboards.
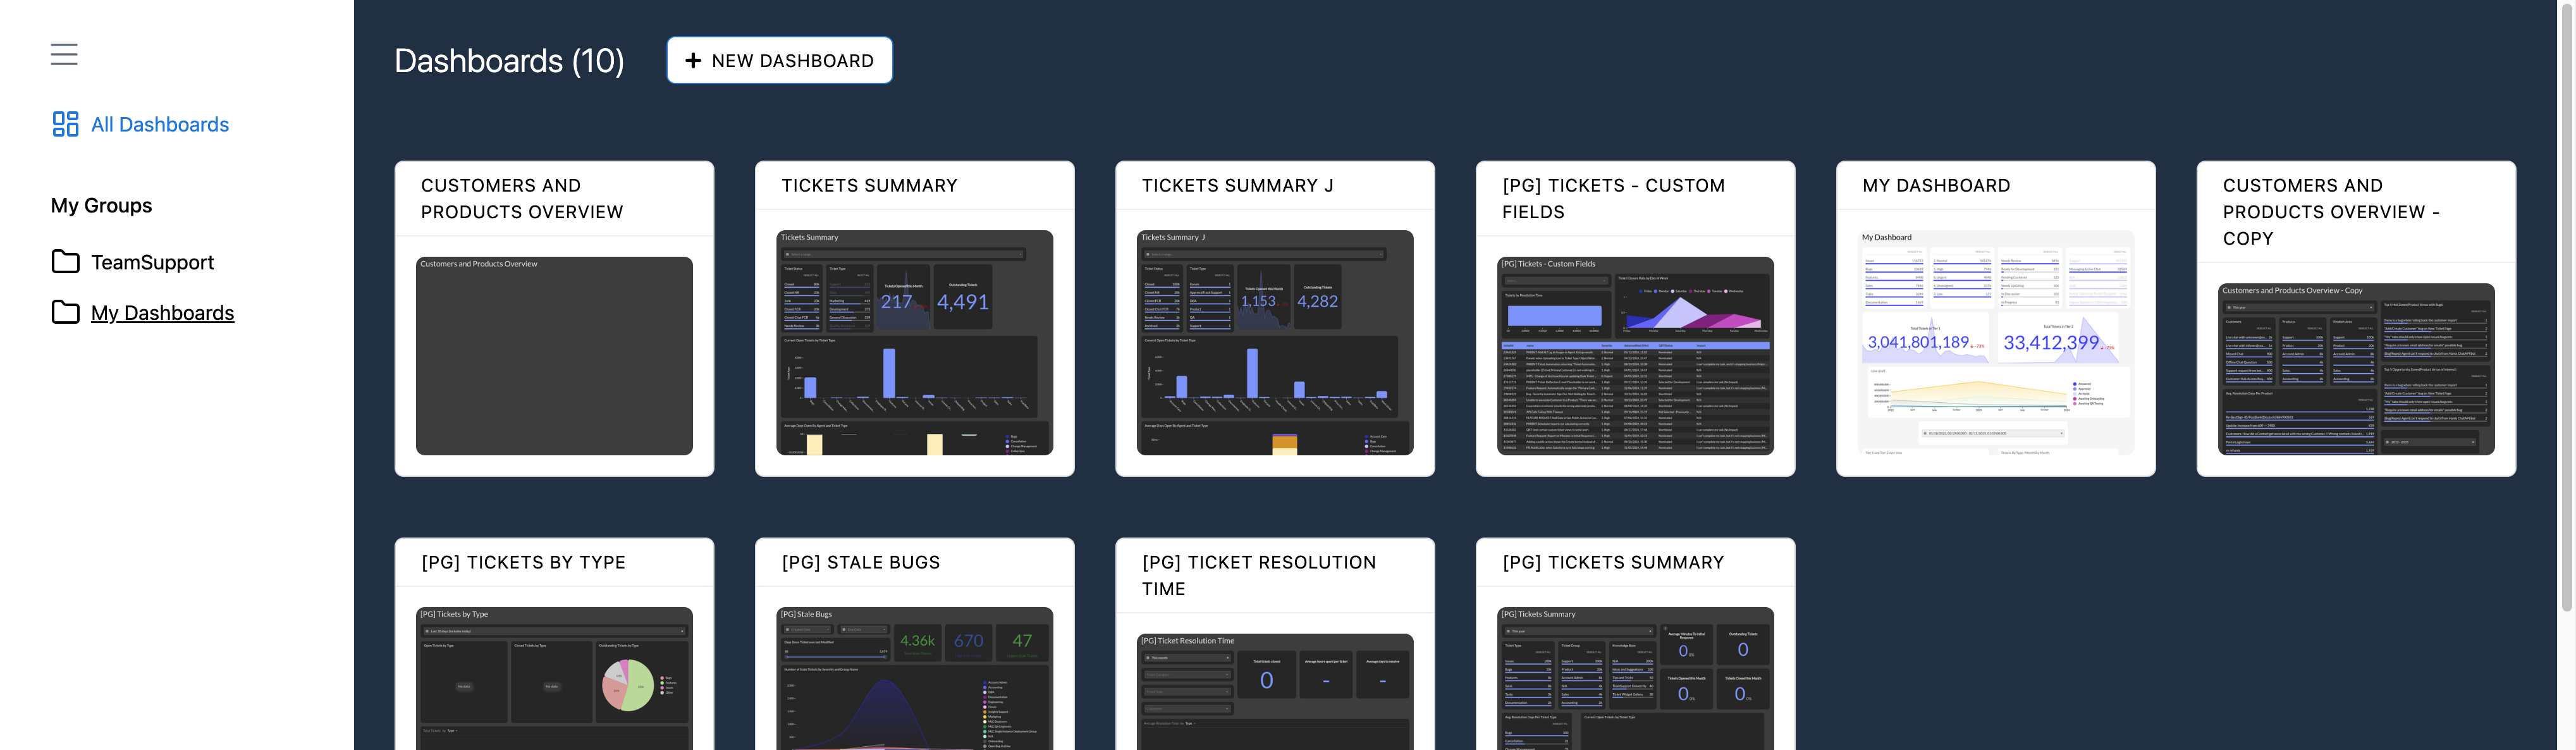
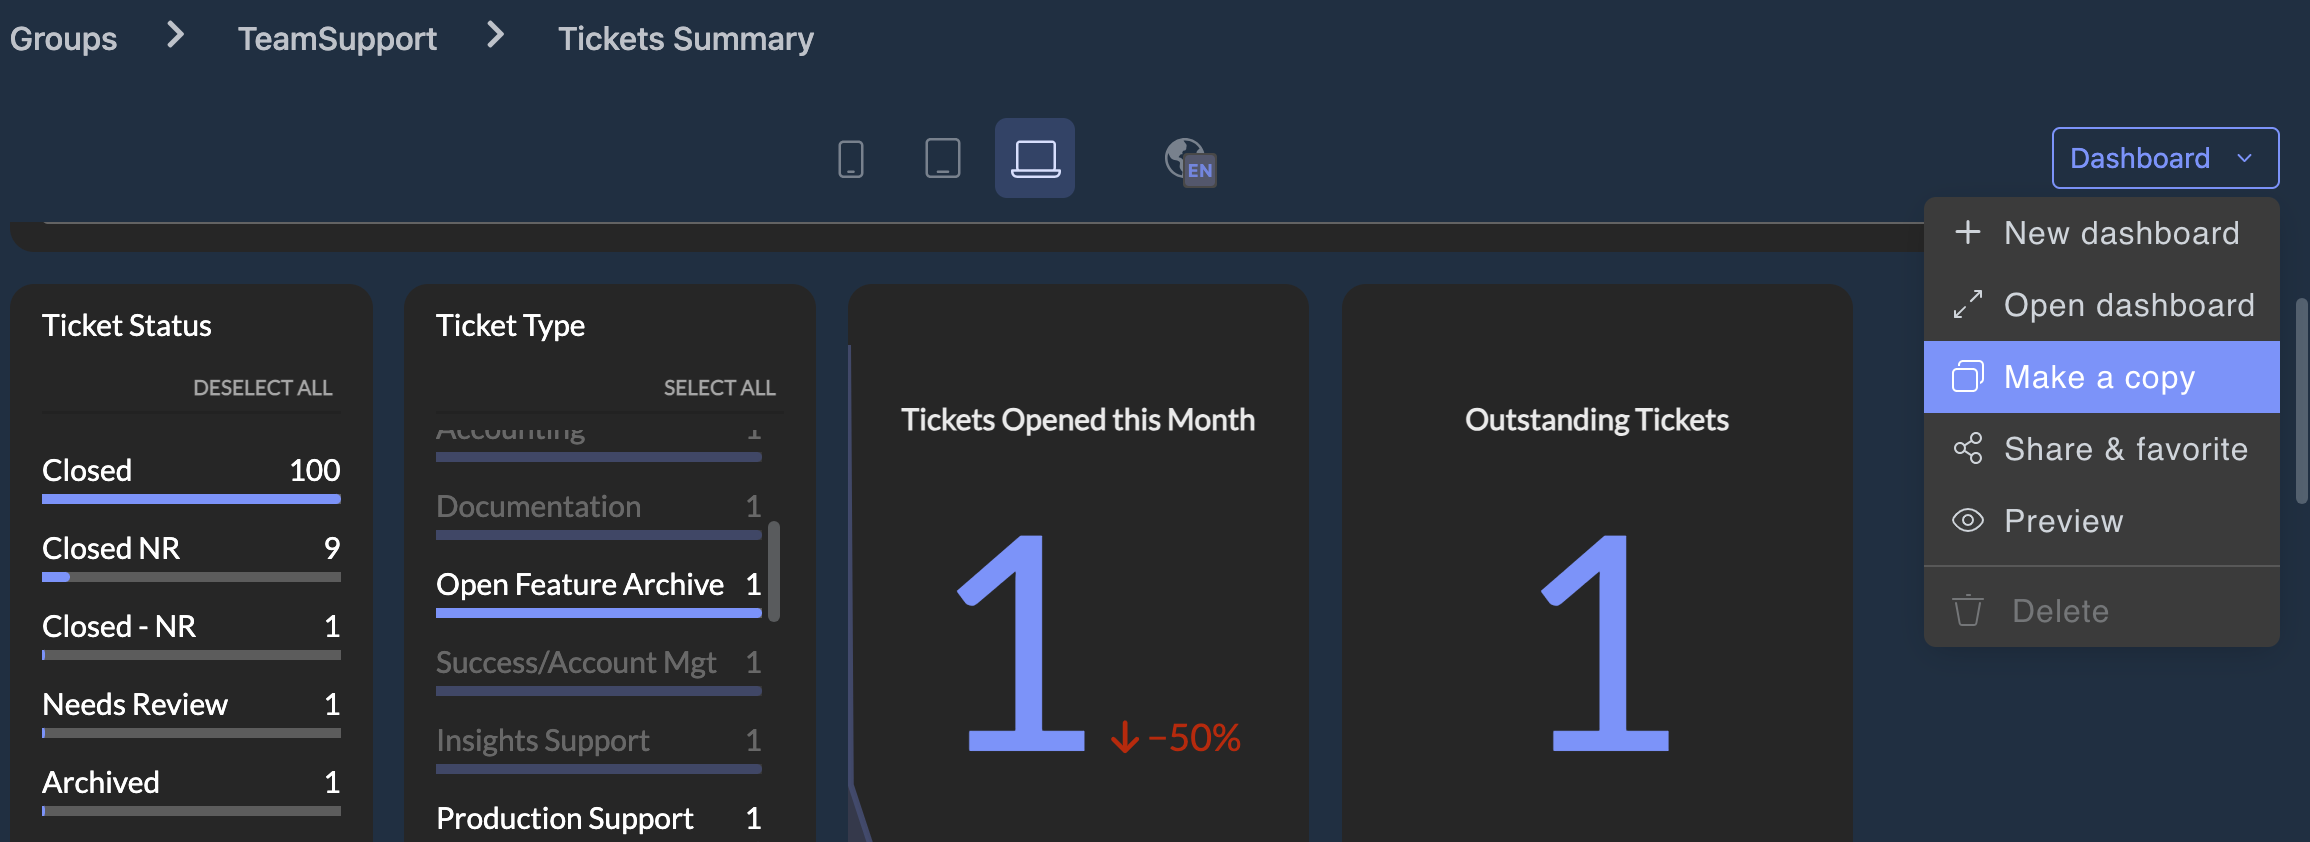
There are two ways to create your own dashboards. First, you can create clones of the Team Support dashboards and use them as templates. This gives you a head start by making copies of our existing templates, and giving you edit capabilities to add or adjust the data.
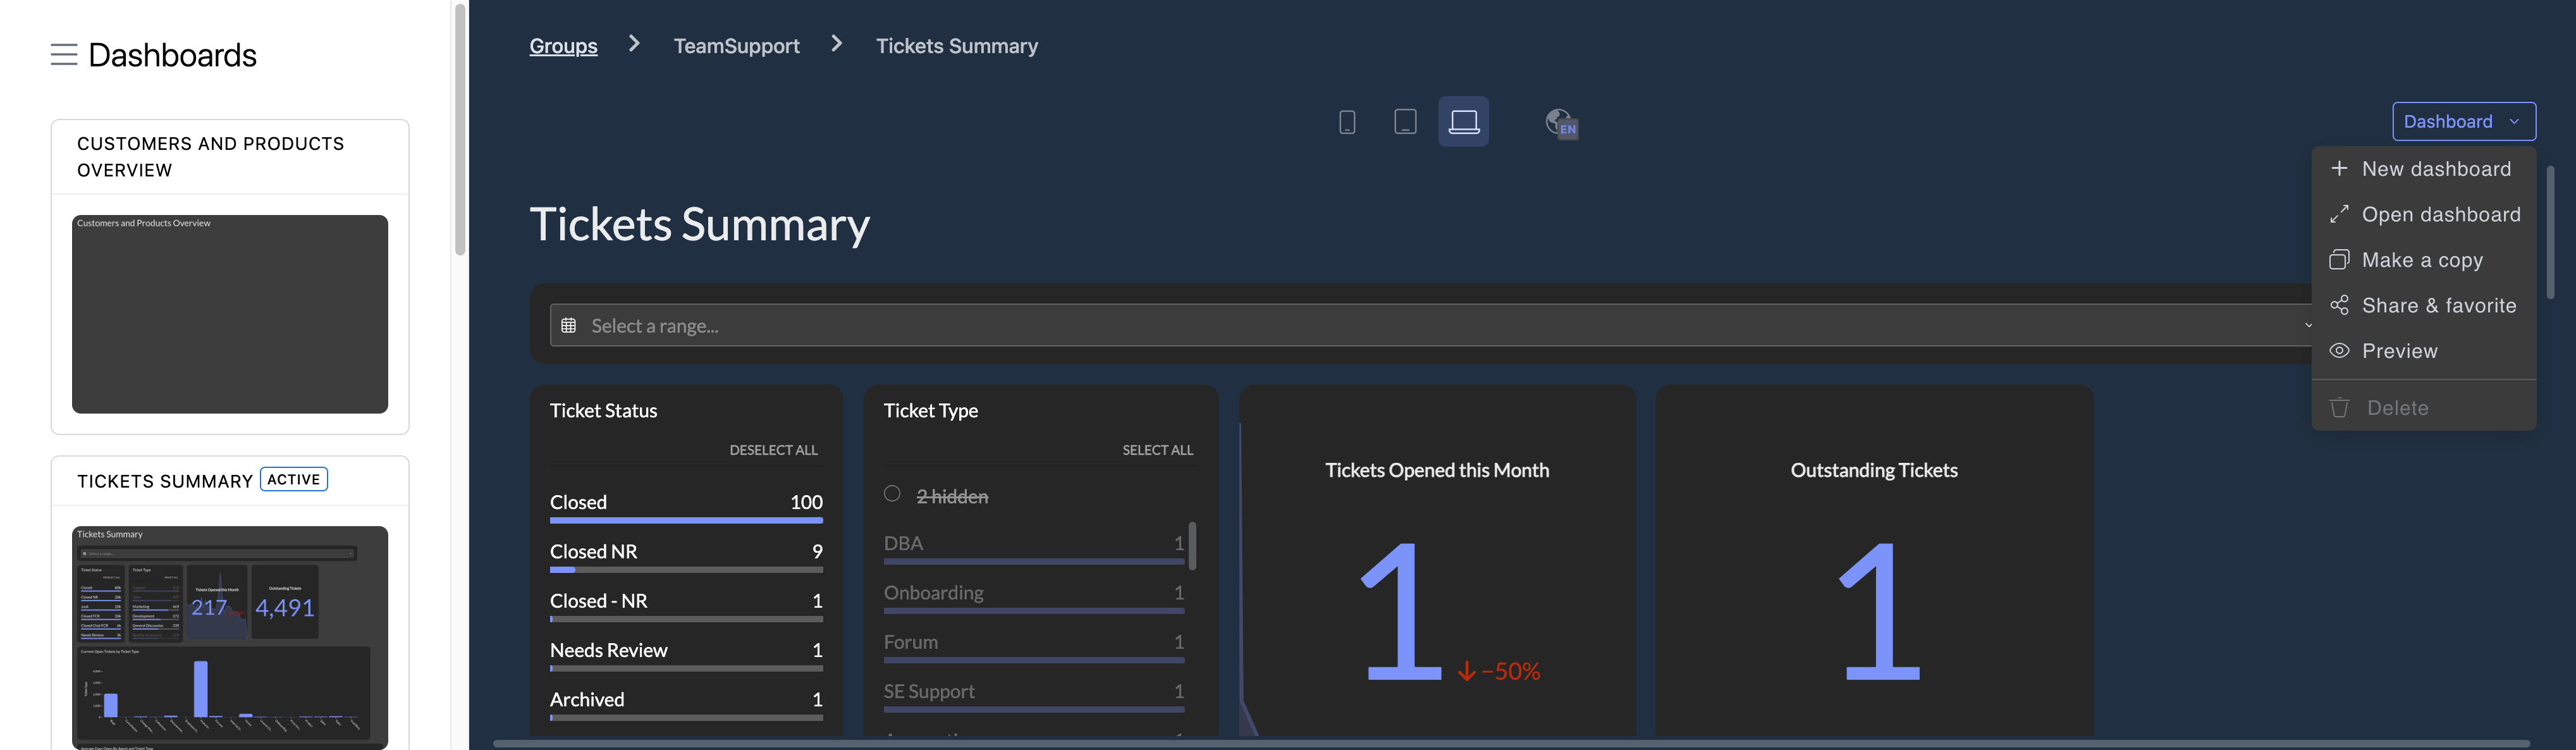

If you want to create your own dashboard, click "New Dashboard" to start from scratch. This allows you to create your own widgets, which we will cover in the next session. Here are a few quick highlights about the dashboards and the benefits of Insights 2.
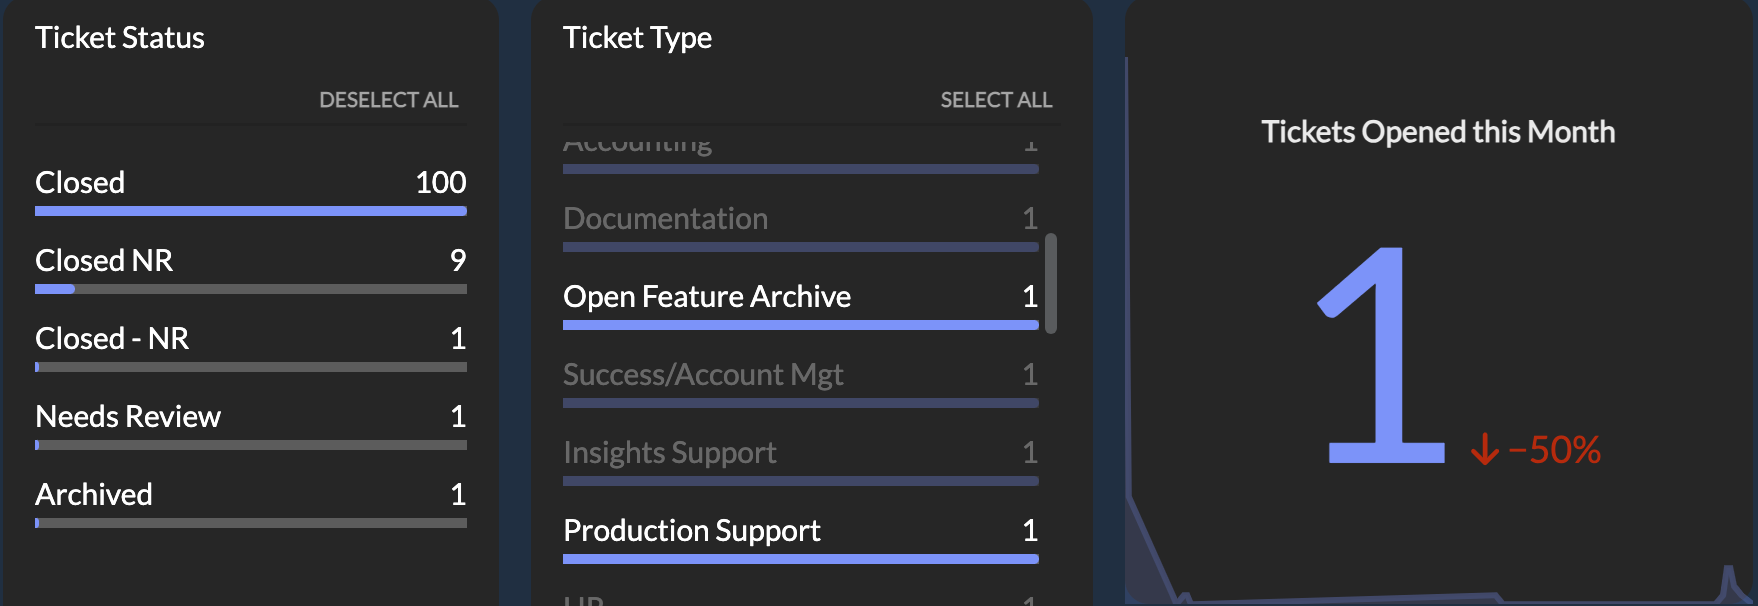
The dashboards are thematically grouped by metrics. For example, a dashboard focused on ticket summary uses a combination of charts that all work together to tell the story of what tickets you have open, how long it takes to respond to them, what areas of your product they are coming from, what features are driving the tickets and themes across units of time like quarters or months. Unlike previous insights, we now offer live filtering. Example. Instead of needing a separate chart to show how many tickets were created by ticket type, or product type, you can create a simple ticket and product type filter. With just two charts, you can easily see This updates the ticket type or ticket count metrics accordingly.
Example. You'll notice in the screen shot below, some of the ticket types are greyed out. This means the user has filtered the number of tickets open this month by Production Support and Open Feature Archive ticket types. By simply clicking on a status or a ticket type on the dashboard, you can quickly see a count of how many tickets are open this month, without having to create separate charts for each ticket type.