Getting Started With Call Analytics and Widgets in Tinkle CX
Learn how to view call statistics, manage custom dashboard layouts, configure scheduled reports, and interact with data widgets in Tinkle CX.
By Becca Atkinson
Accessing call analytics and configuring your dashboard widgets in Tinkle CX allows you to gain deeper insights into your team's performance. You can manage saved layouts, schedule automated reports, and drill down into specific metrics using interactive visualizations.
Navigating to Call Statistics
1
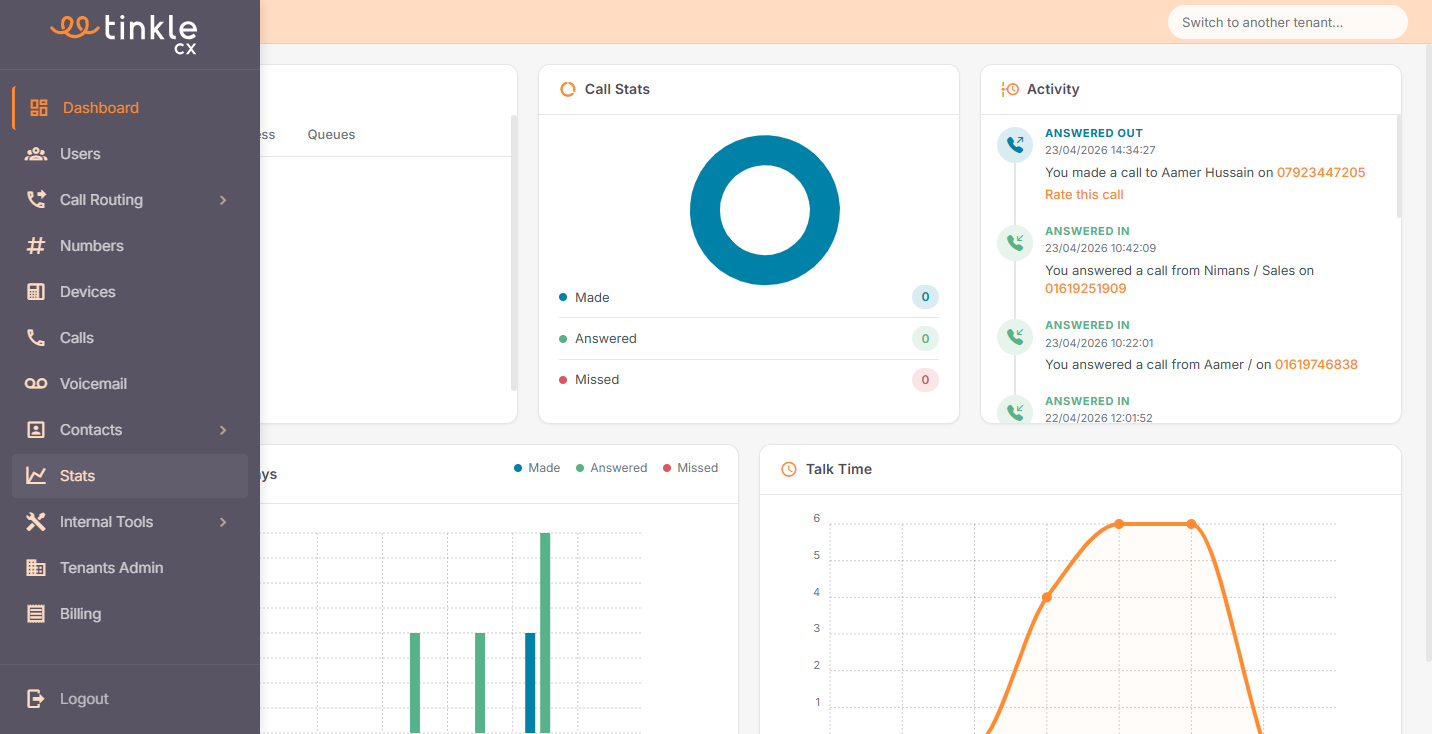
Navigate to your Dashboard.
2
In the left sidebar menu, click Stats.
Managing Dashboard Layouts
If you frequently use specific widget configurations, you can save them as a custom layout for quick access.
3
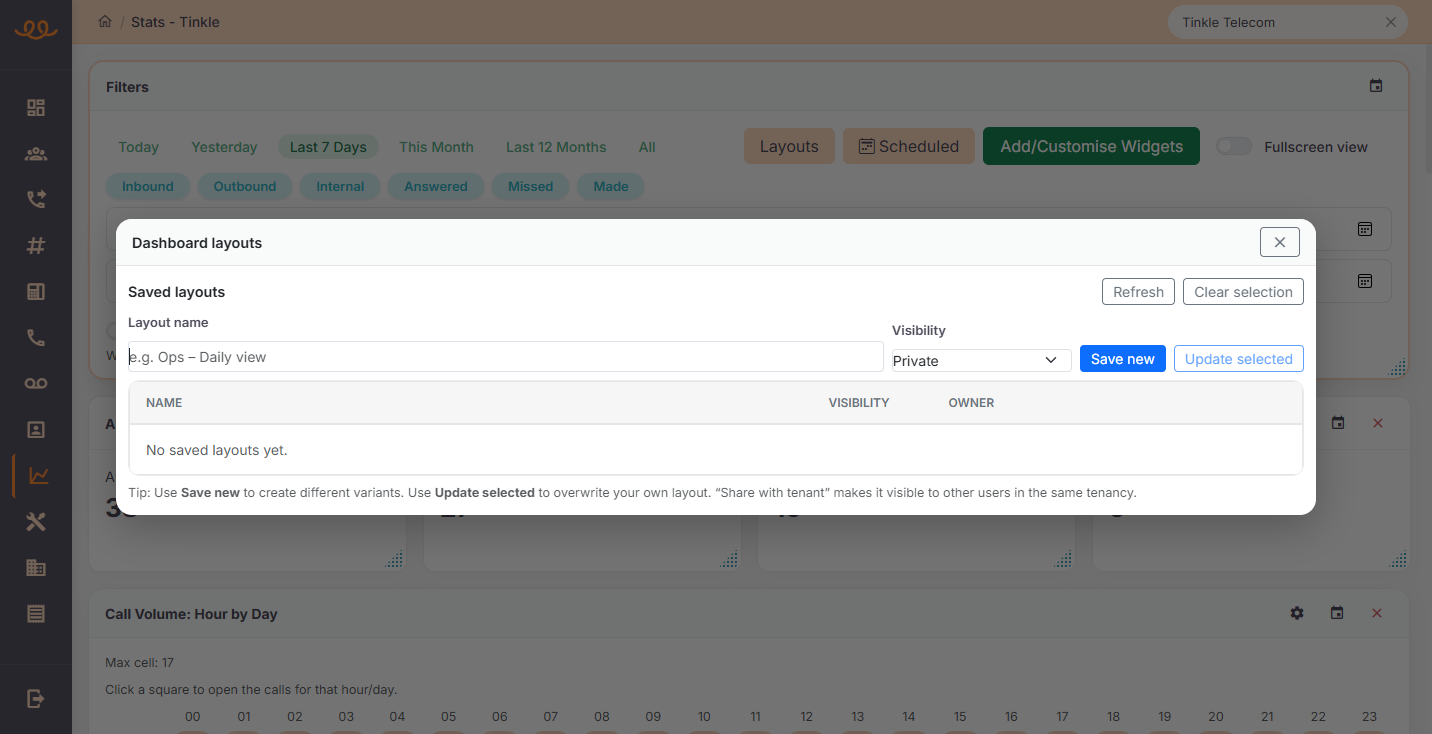
Click Layouts in the dashboard control panel.

4
In the Dashboard layouts modal, enter a name for your new layout, select your desired visibility (such as Private), and click Save new.
Configuring Scheduled Reports
You can set up automated emails to receive regular updates on your call metrics directly to your inbox.
5
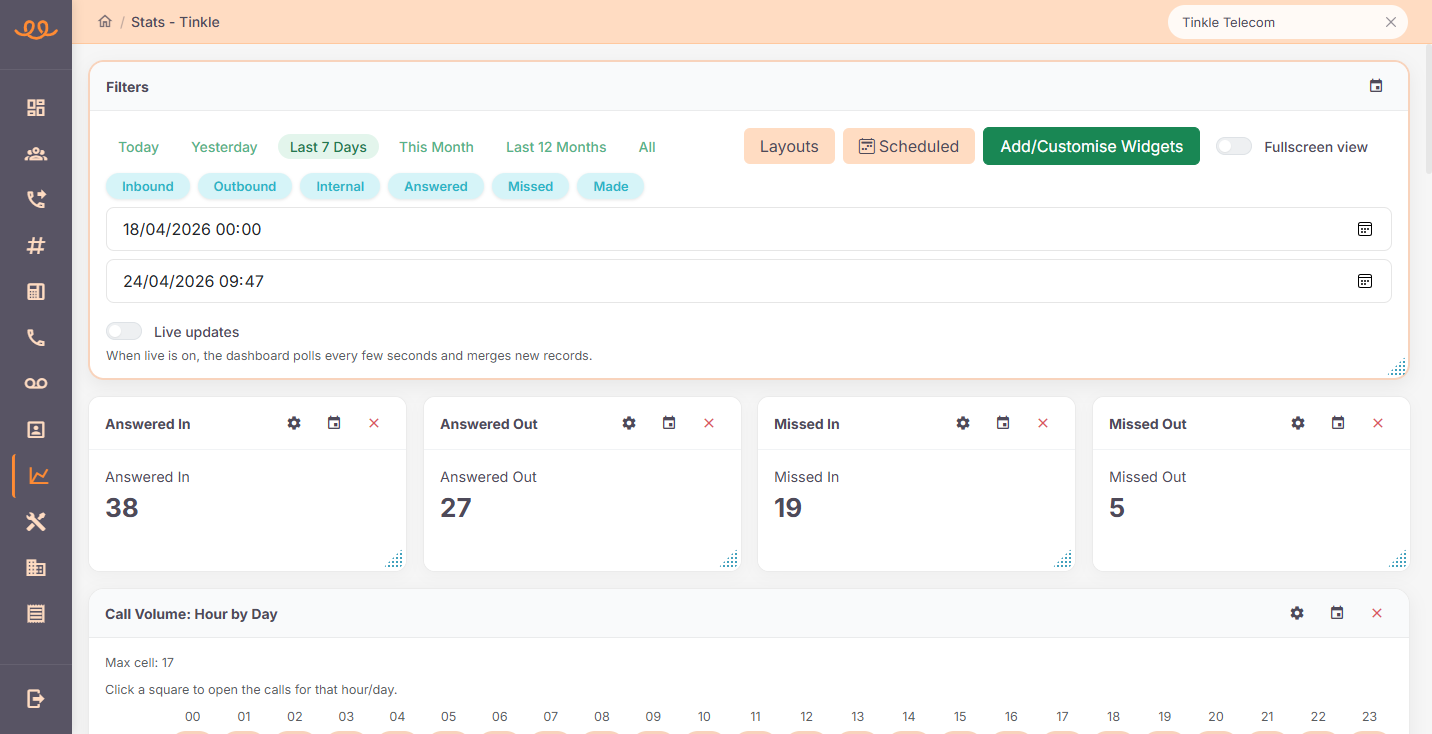
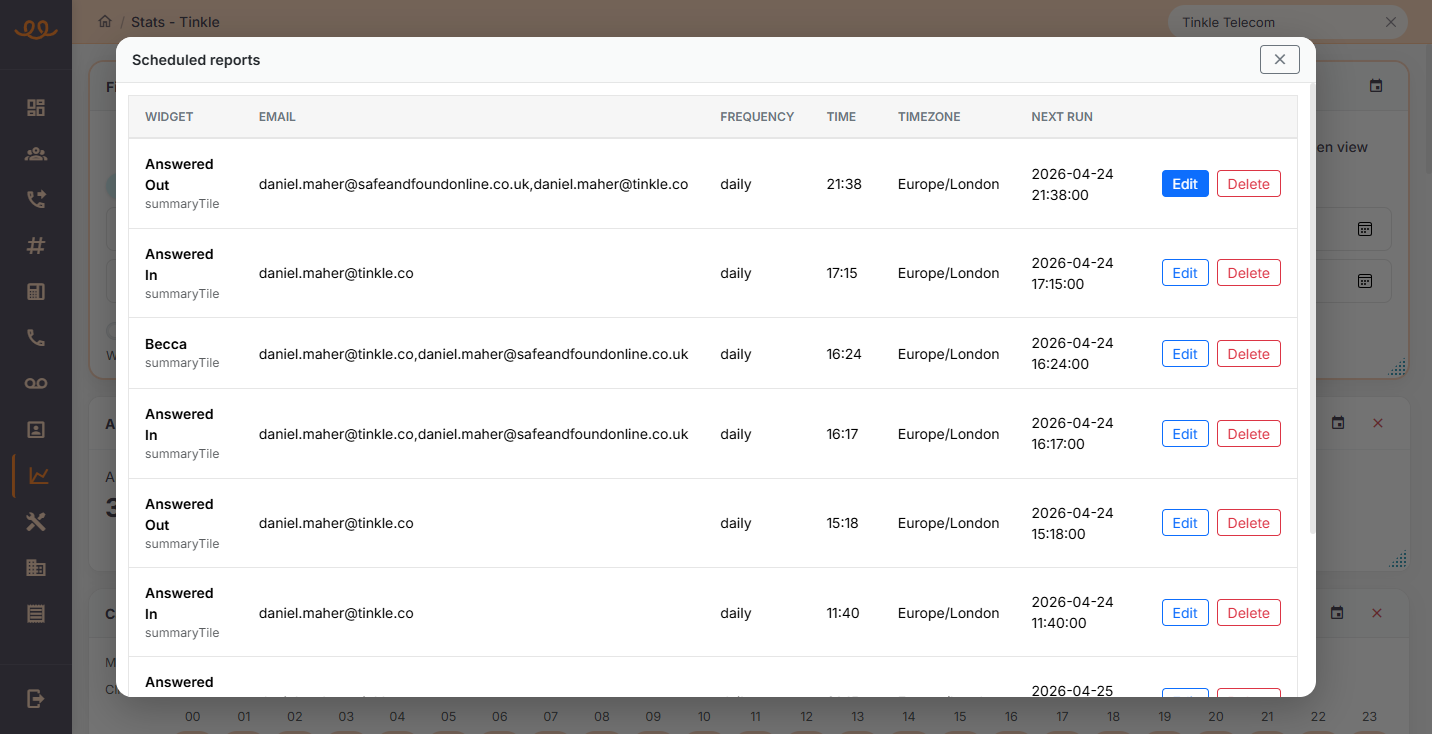
Click Scheduled to view and manage your recurring data reports.
6
Click Edit next to any existing report to modify its configuration. You can update recipient email addresses, adjust the delivery frequency, or change the data format (e.g., grouped calls vs. raw rows).
Customizing and Interacting with Widgets
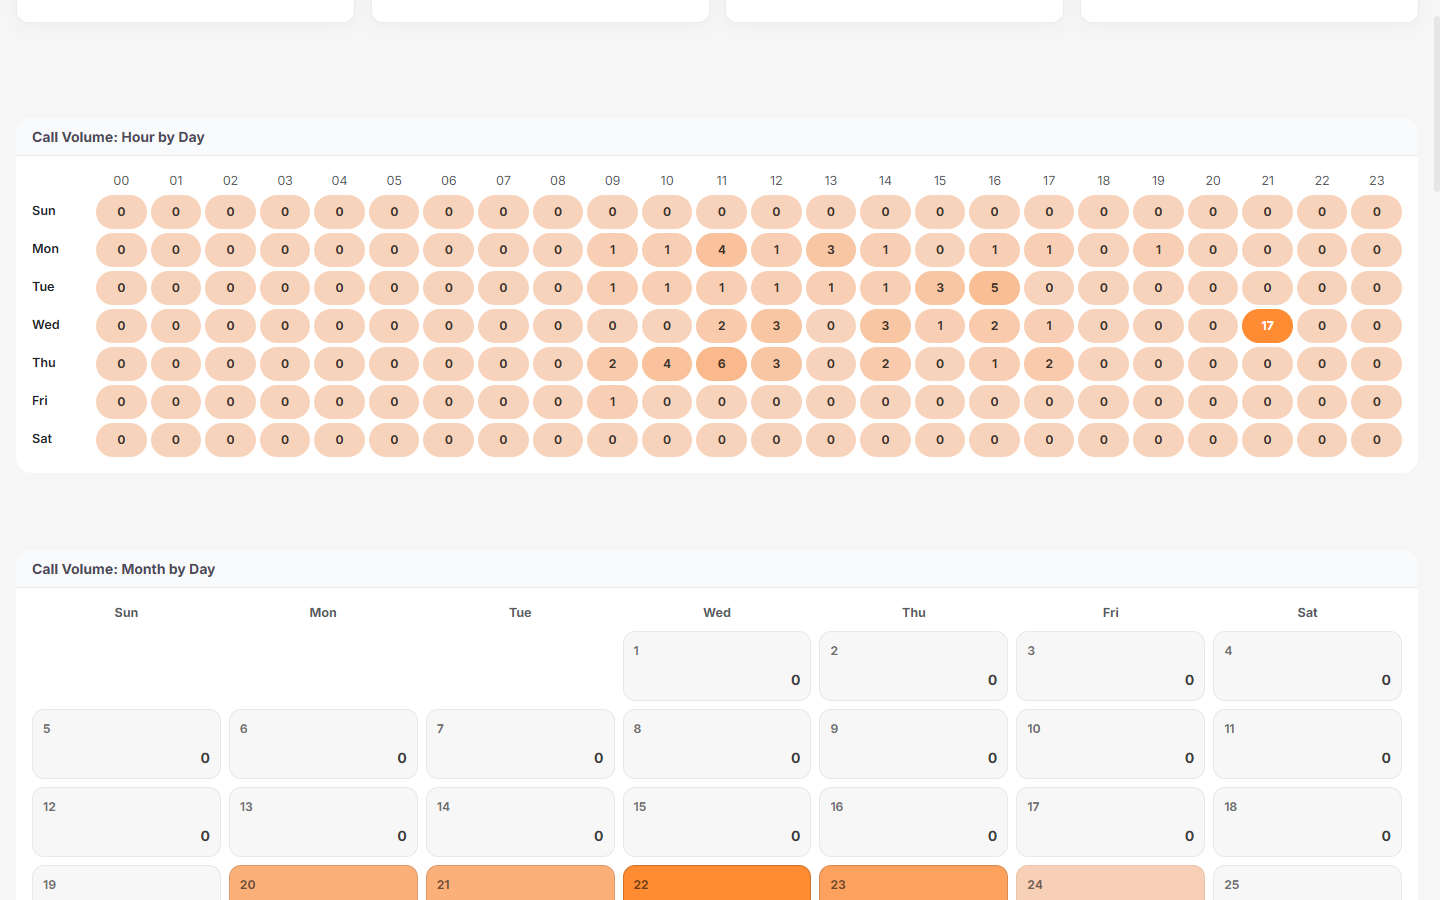
The dashboard offers a variety of visual widgets to help you analyze call volumes and identify trends over time.
7
Click Add/Customise Widgets in the top right area of the dashboard to select and arrange your data visualizations.
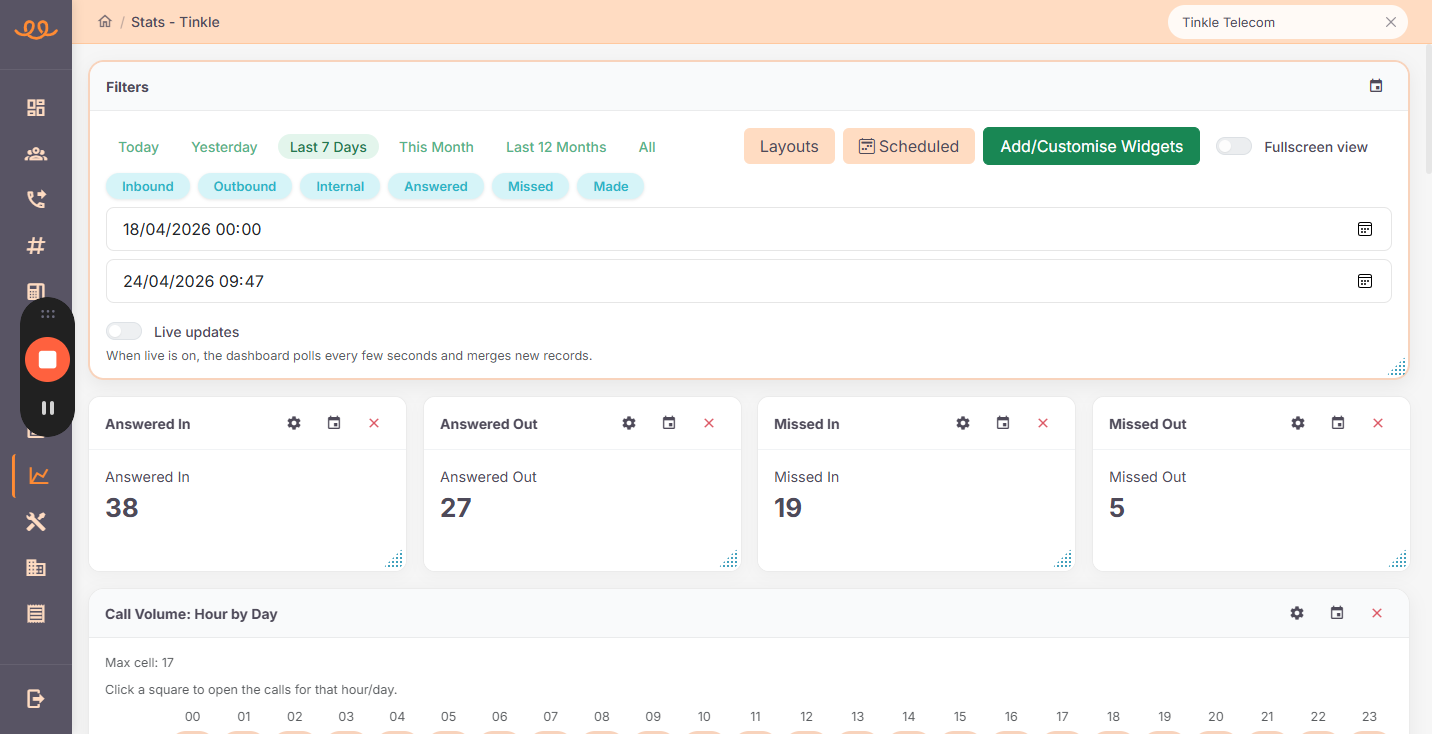
8
You can click directly on specific data points within widgets—such as the colored cells in the Call Volume: Hour by Day heatmap—to drill down into detailed call records for that specific time block.