How to Access and Use FY27 Budget Financial Reports
Learn how to access, navigate, and utilize the FY27 Budget financial reports, including P&L, CFO, and monthly breakdowns. Discover key features, filters, and variance analysis for effective financial reporting.
In this guide, we'll learn how to access and use the financial reports available for the FY27 budget. We will cover how to navigate to the correct folders, select and run the main P&L report, and understand the key columns and filters. We will also look at the other available reports, including the CFO report and the monthly P&L, to help you compare budgets and analyze variances.
Let's get started
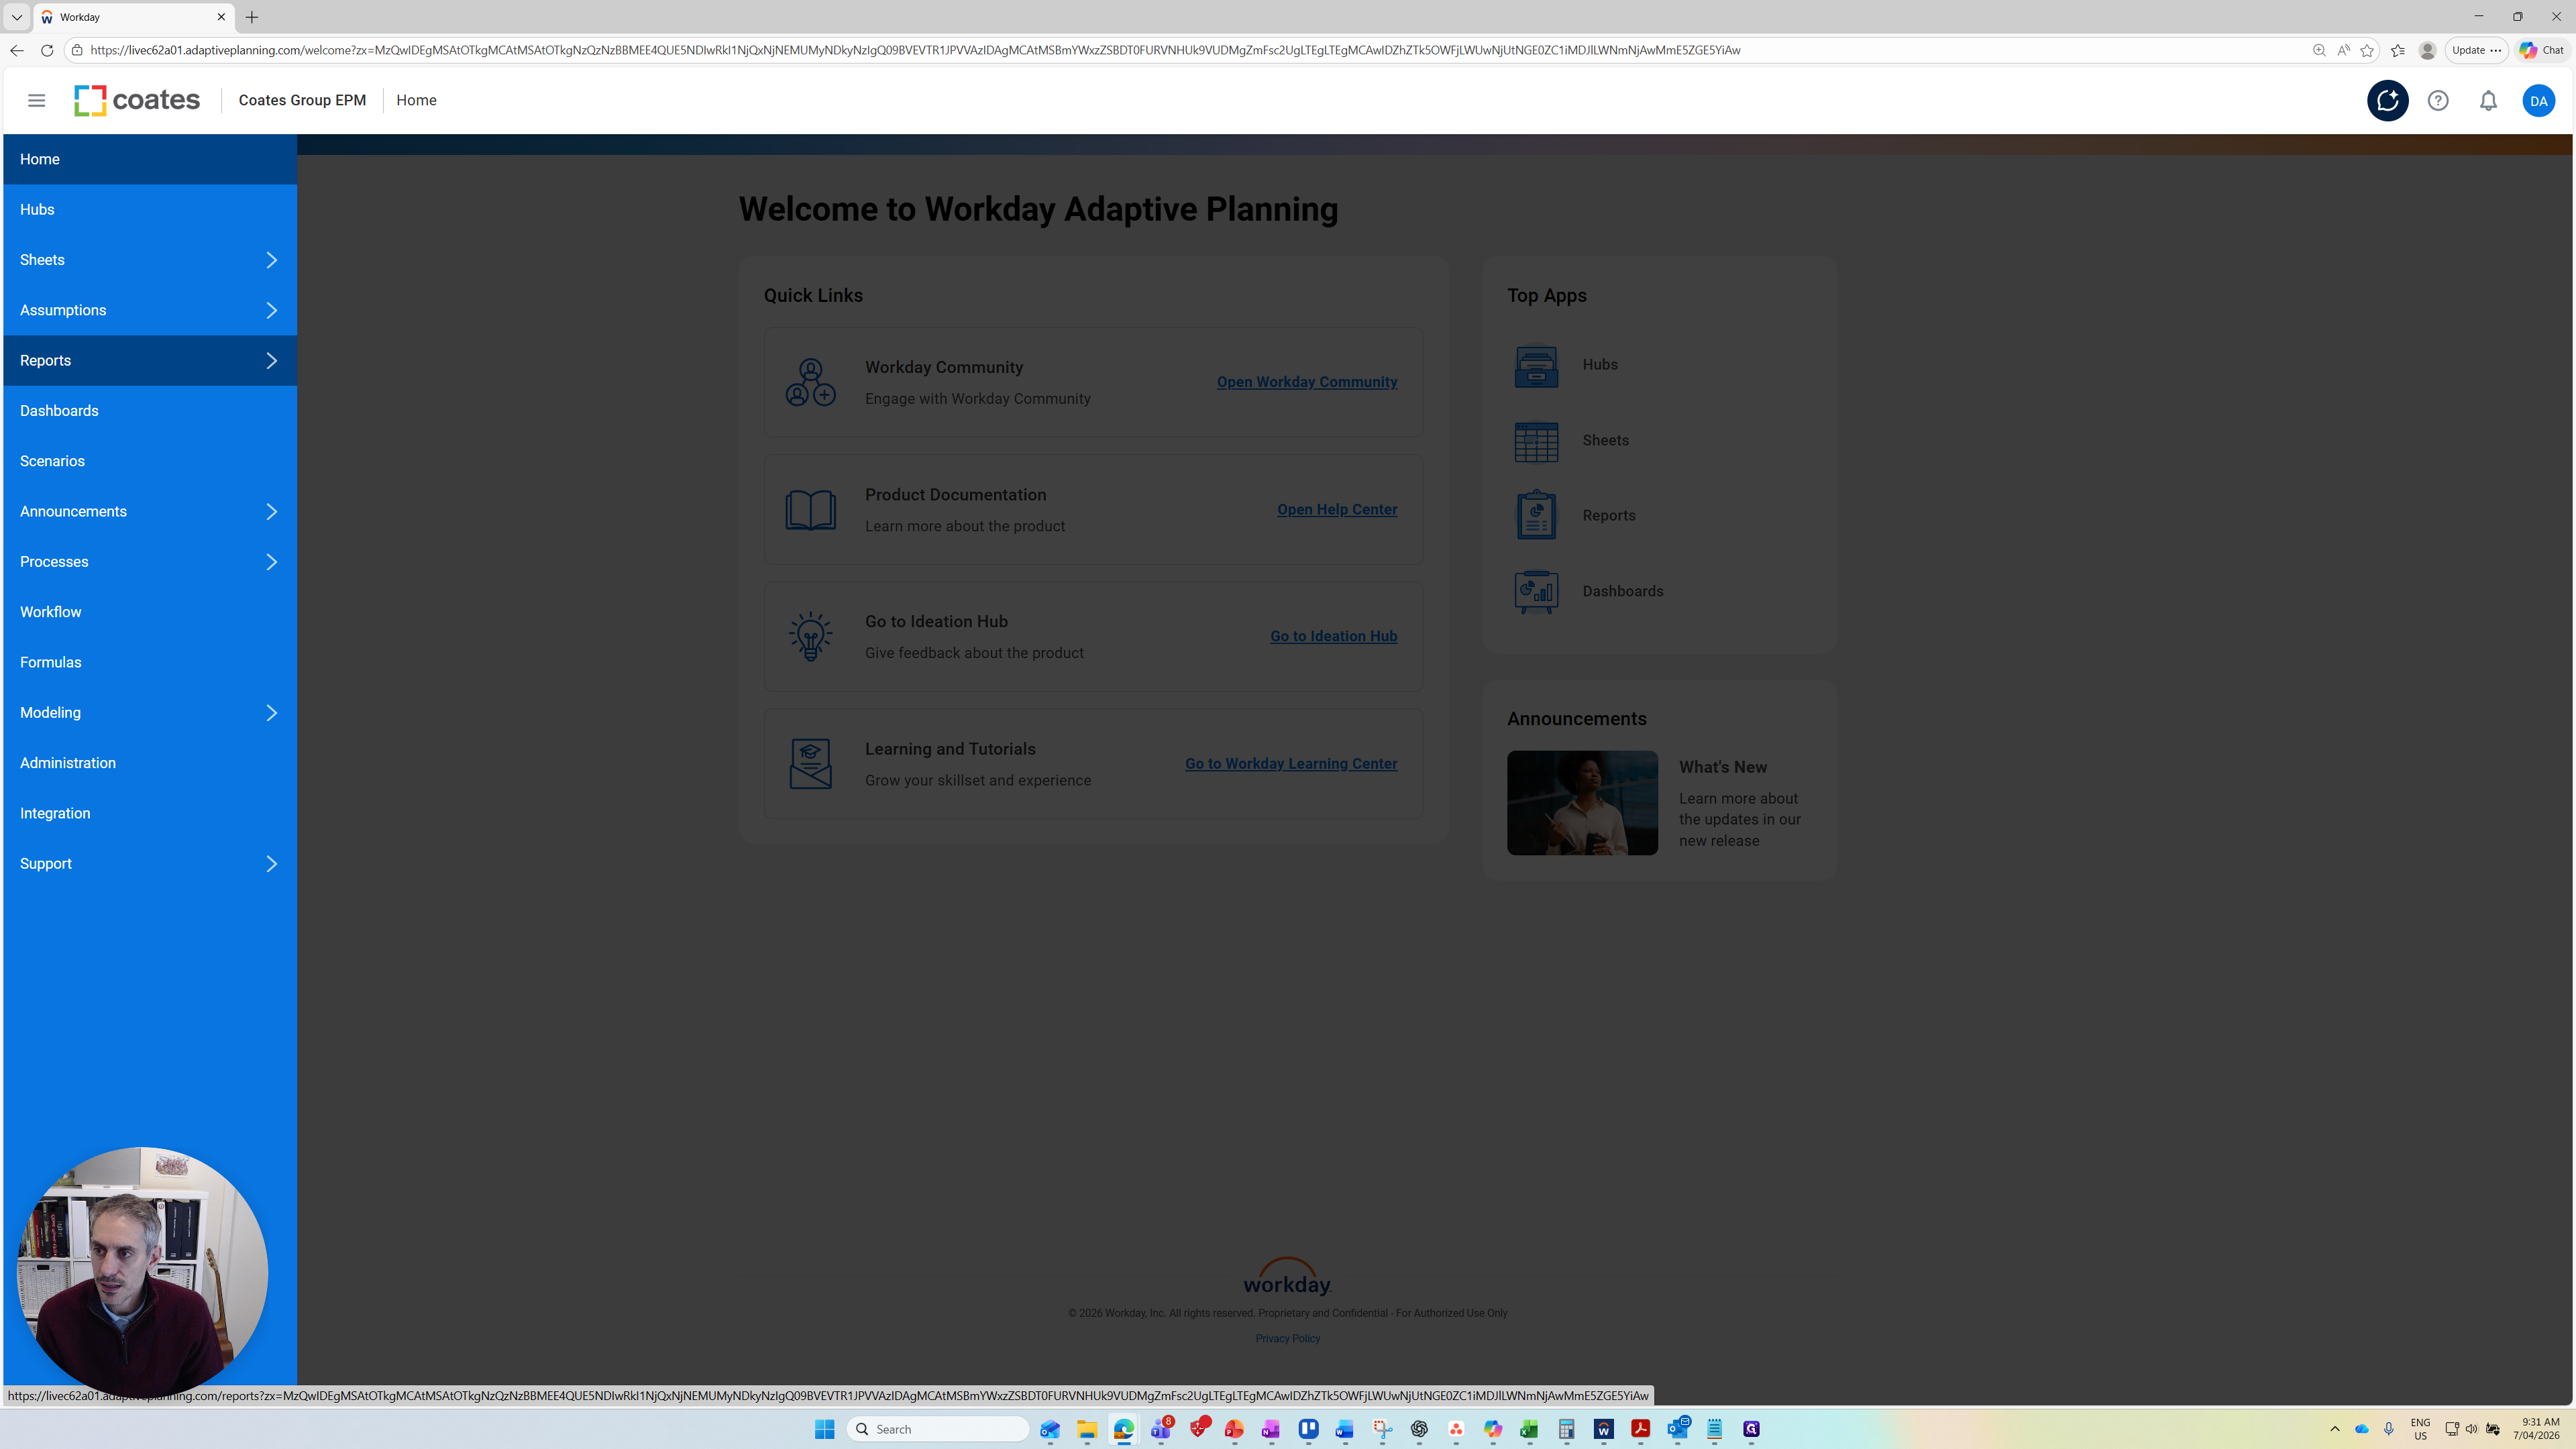
In this session, we will review the financial reporting available for the FY27 budget. First, click the three-line navigation bar and select the Reports link.
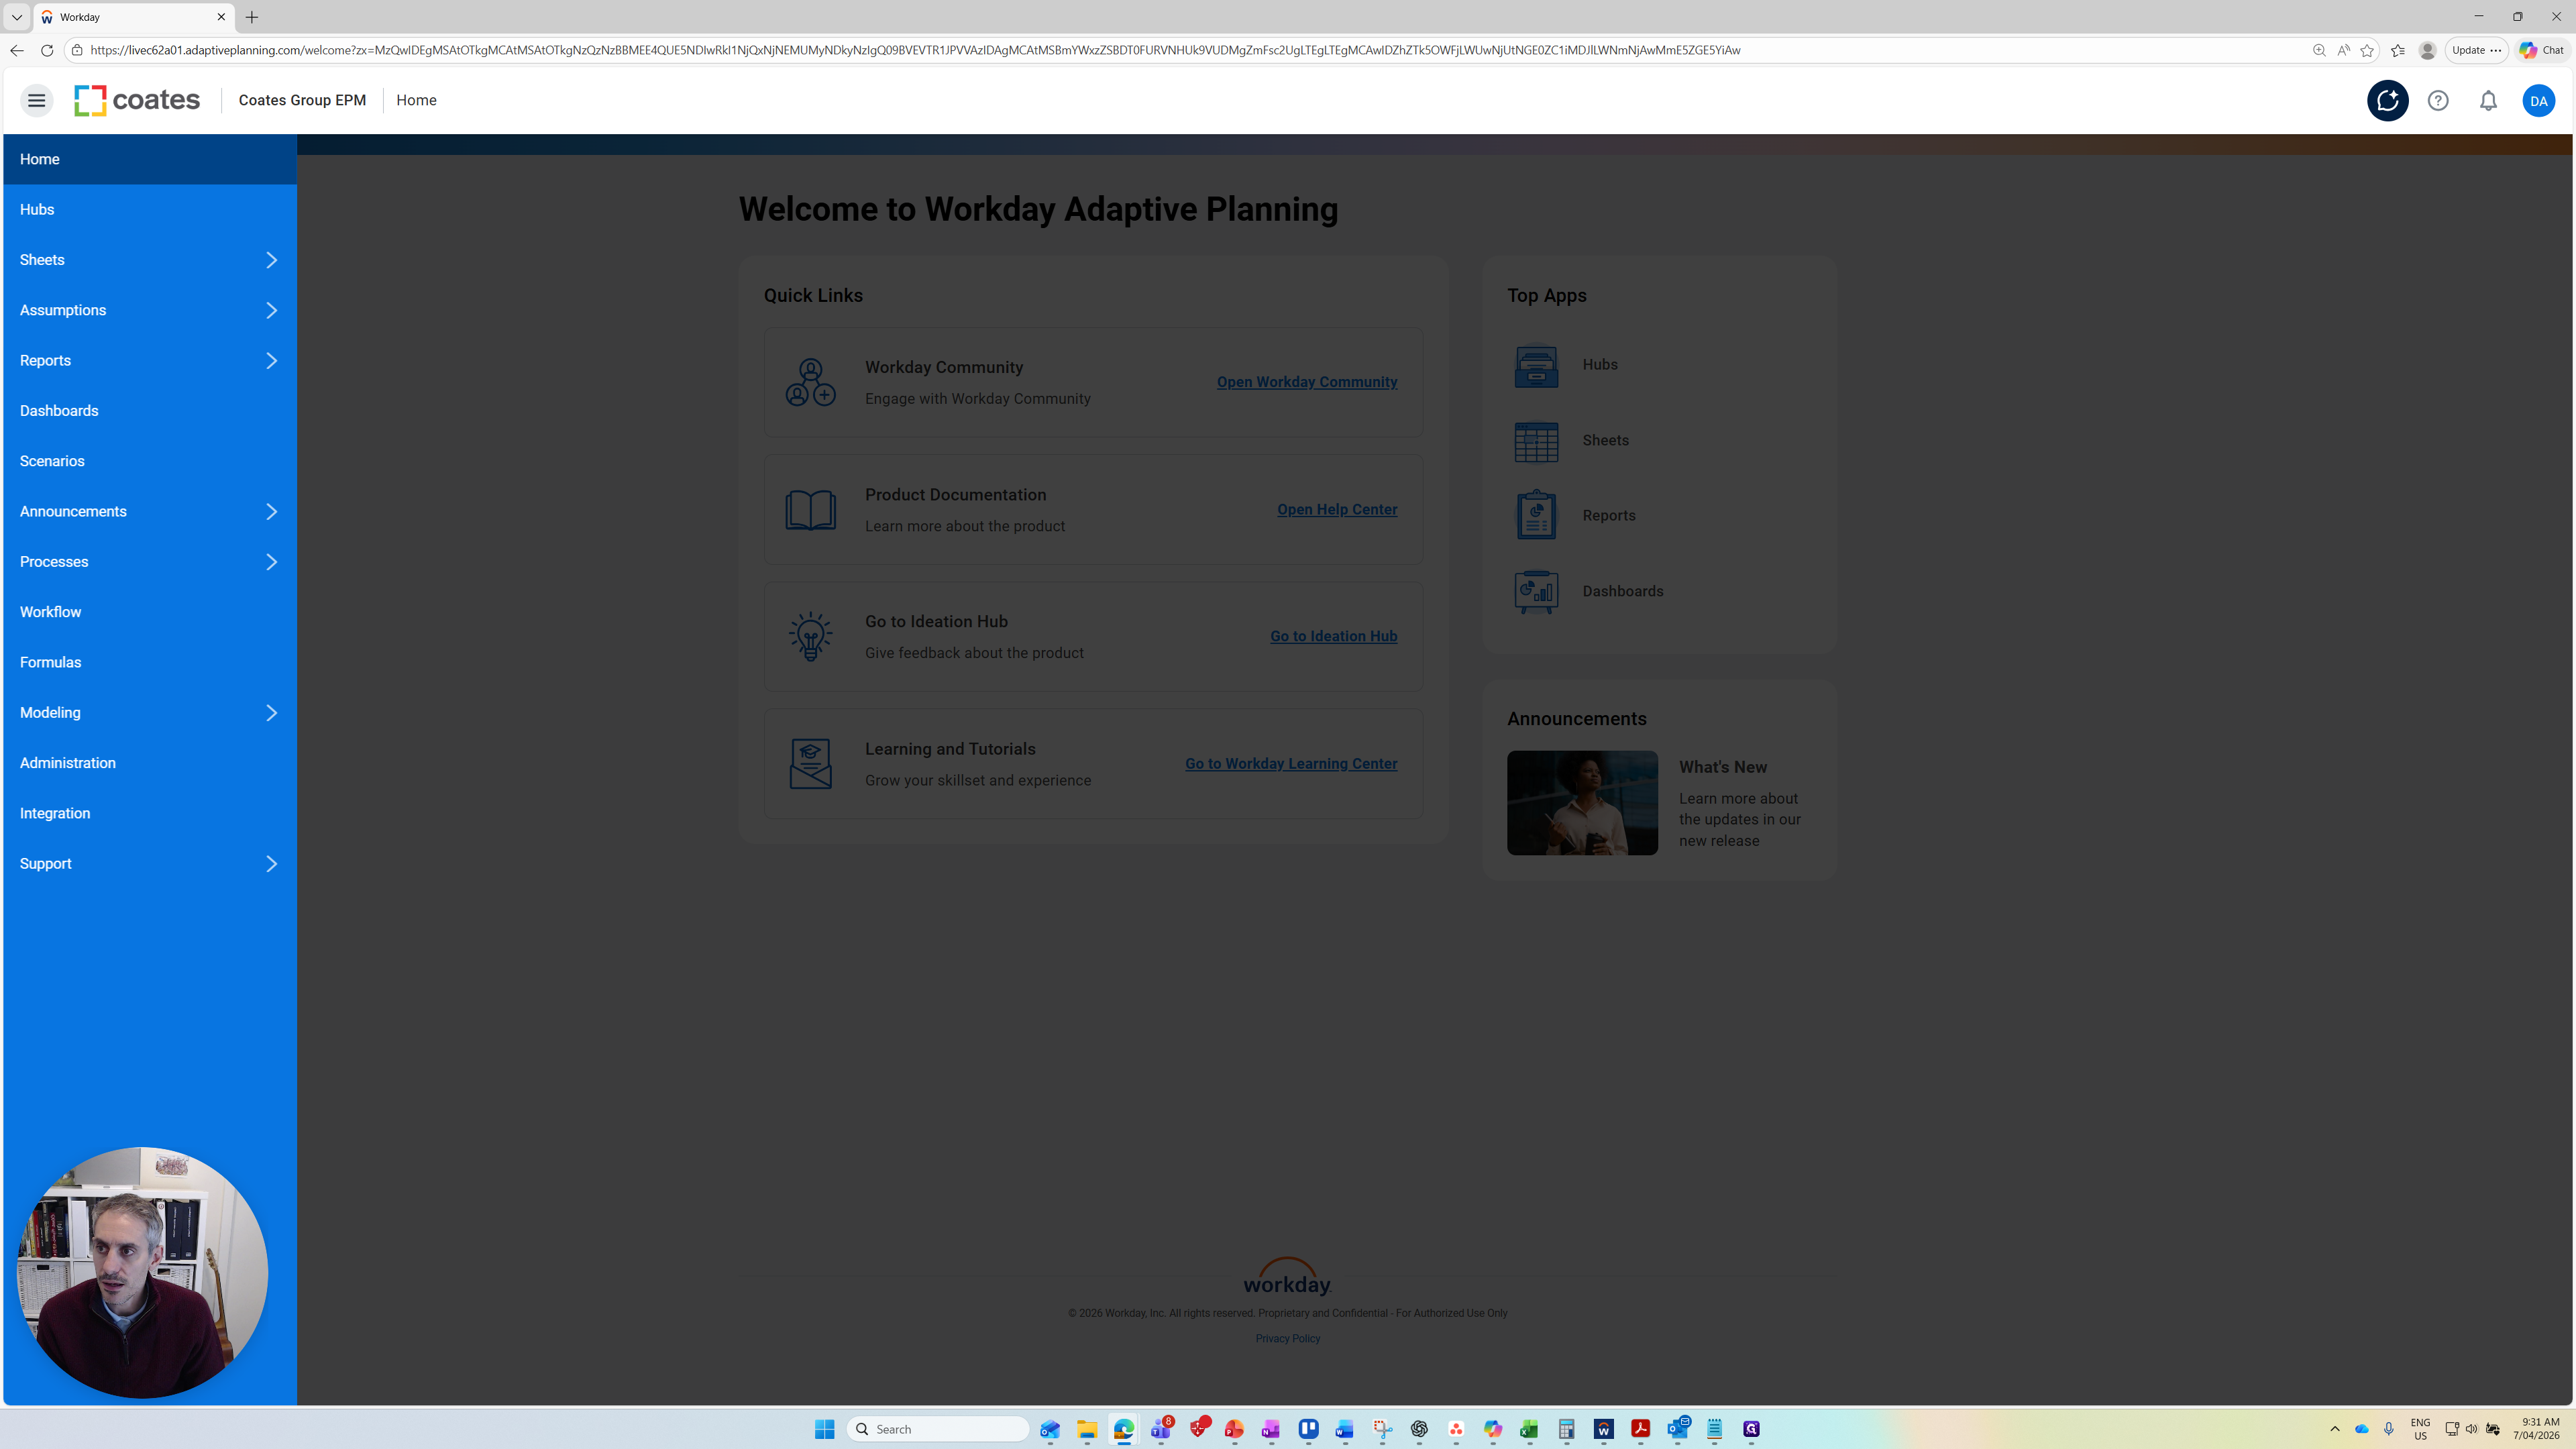
Click the Reports link.
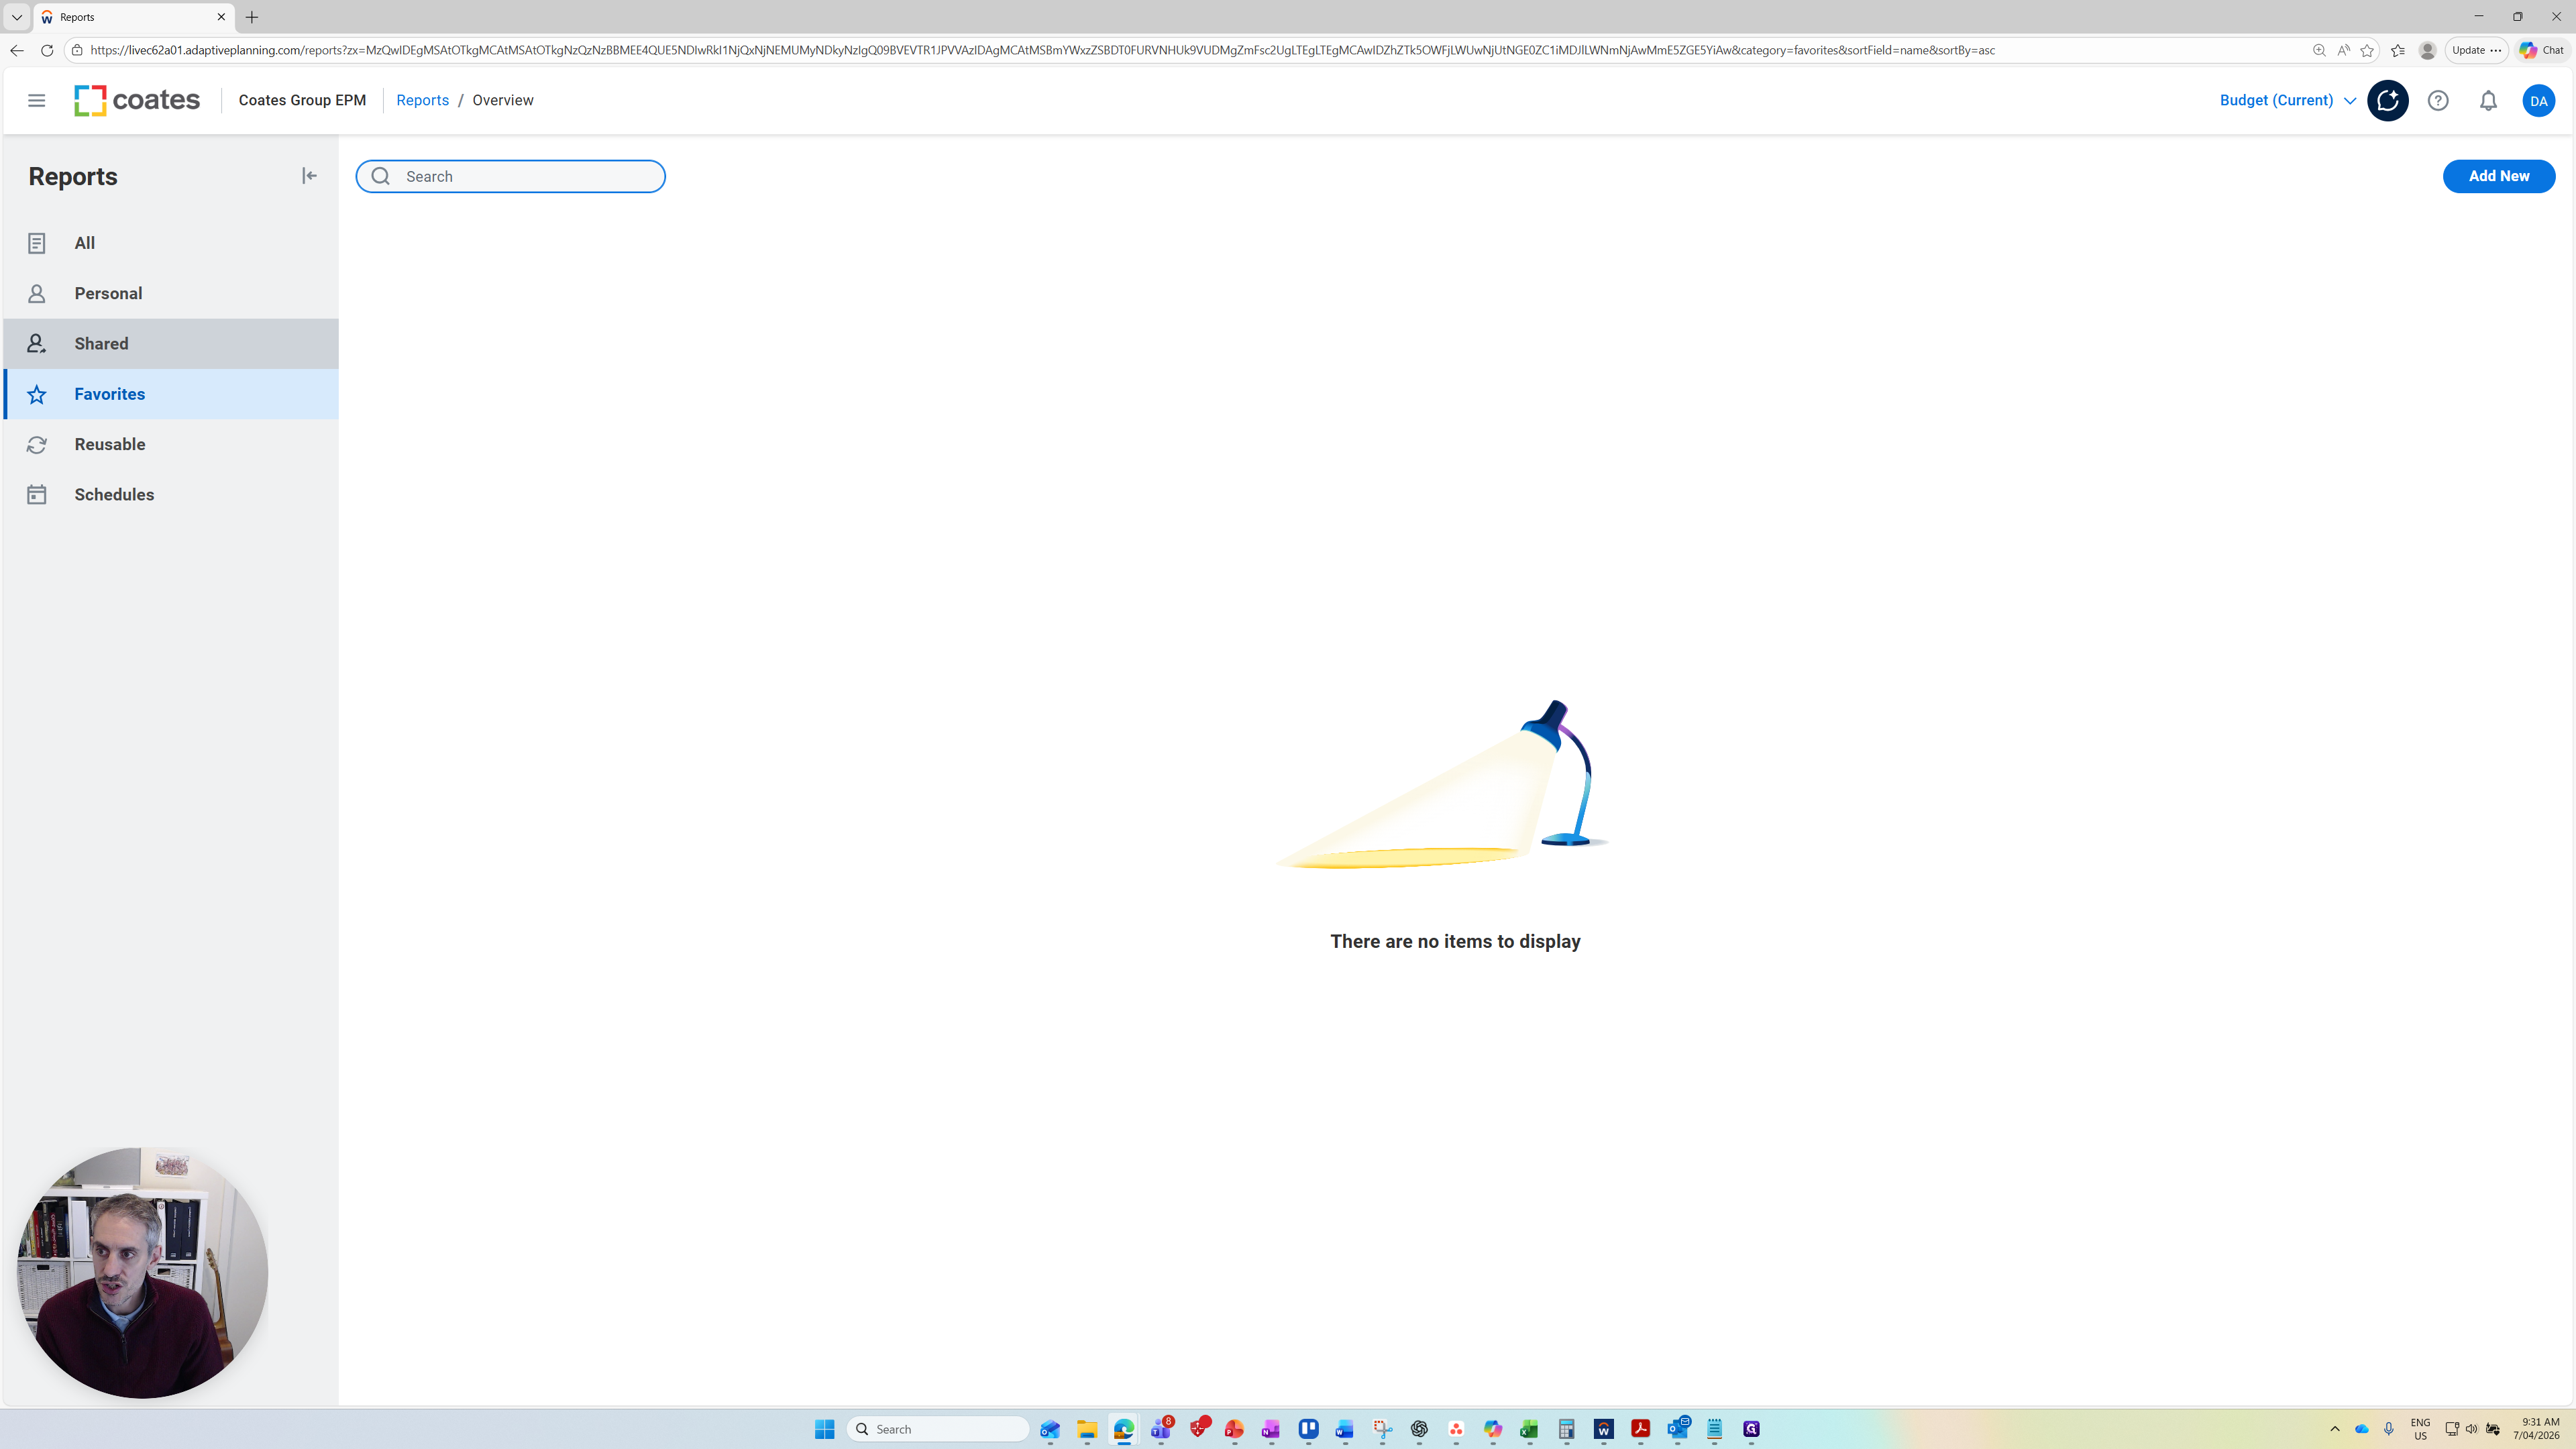
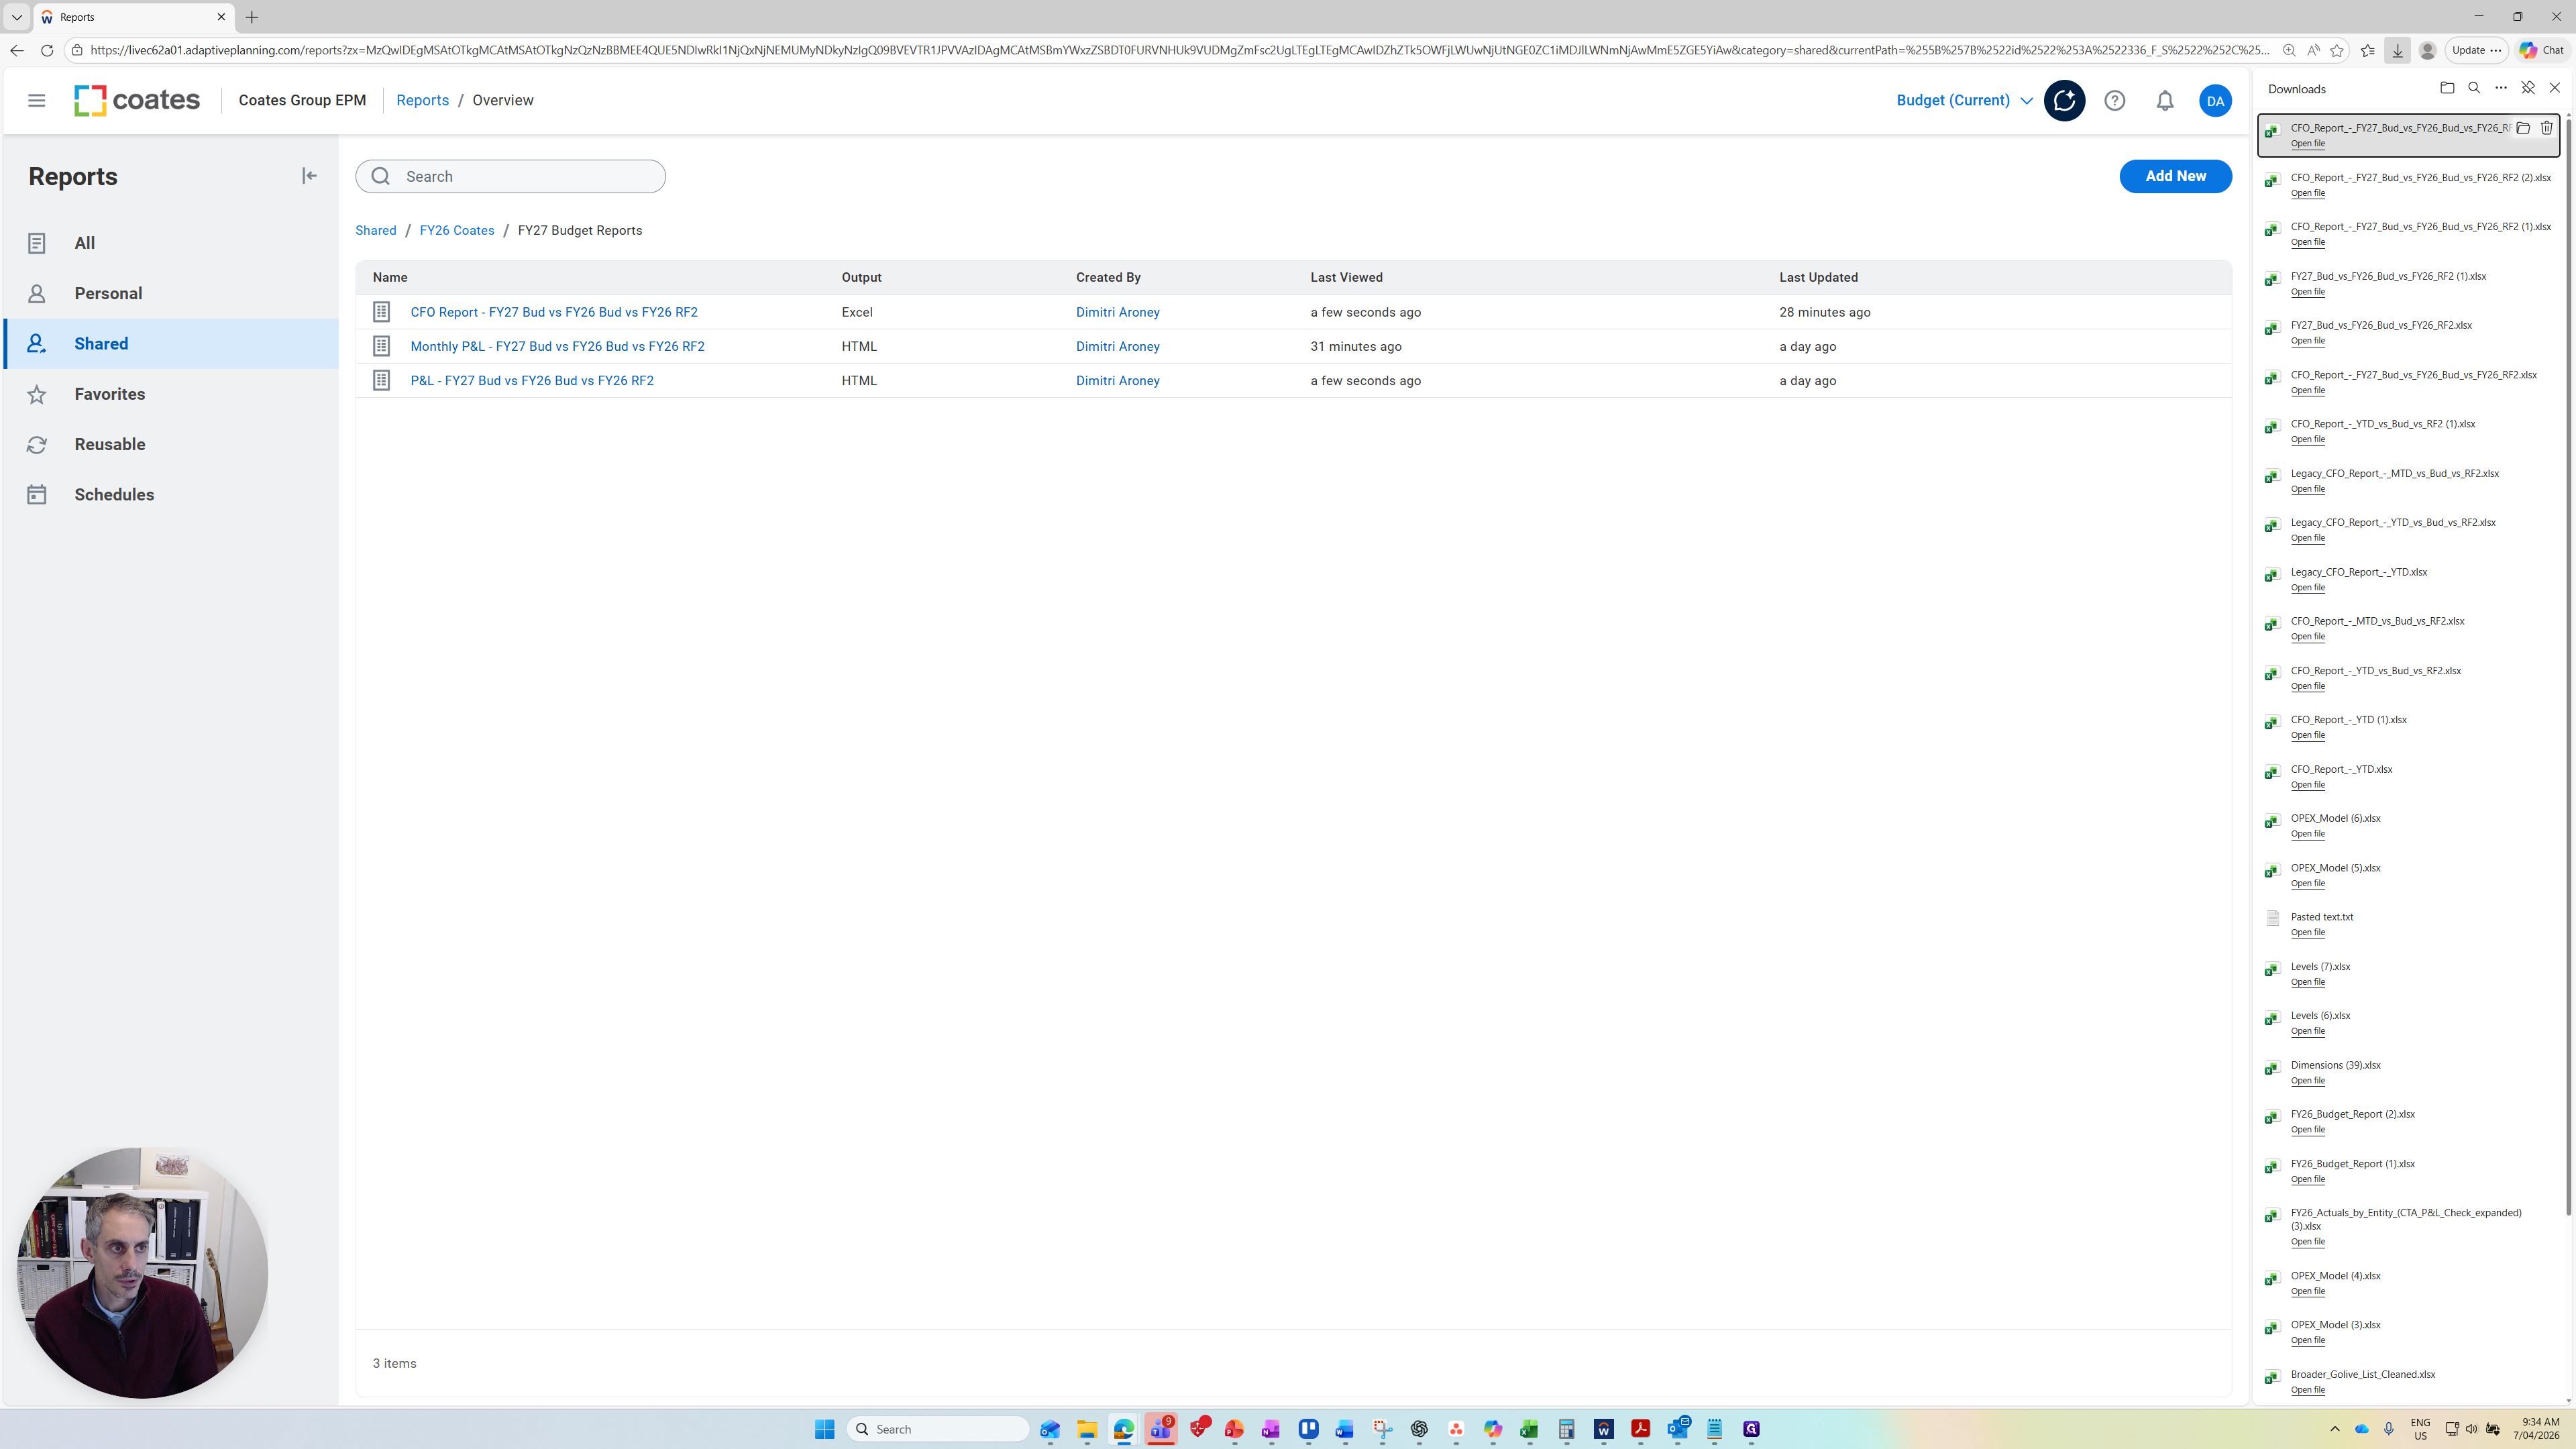
Next, go to the Shared folder, then open FY26 COATES.

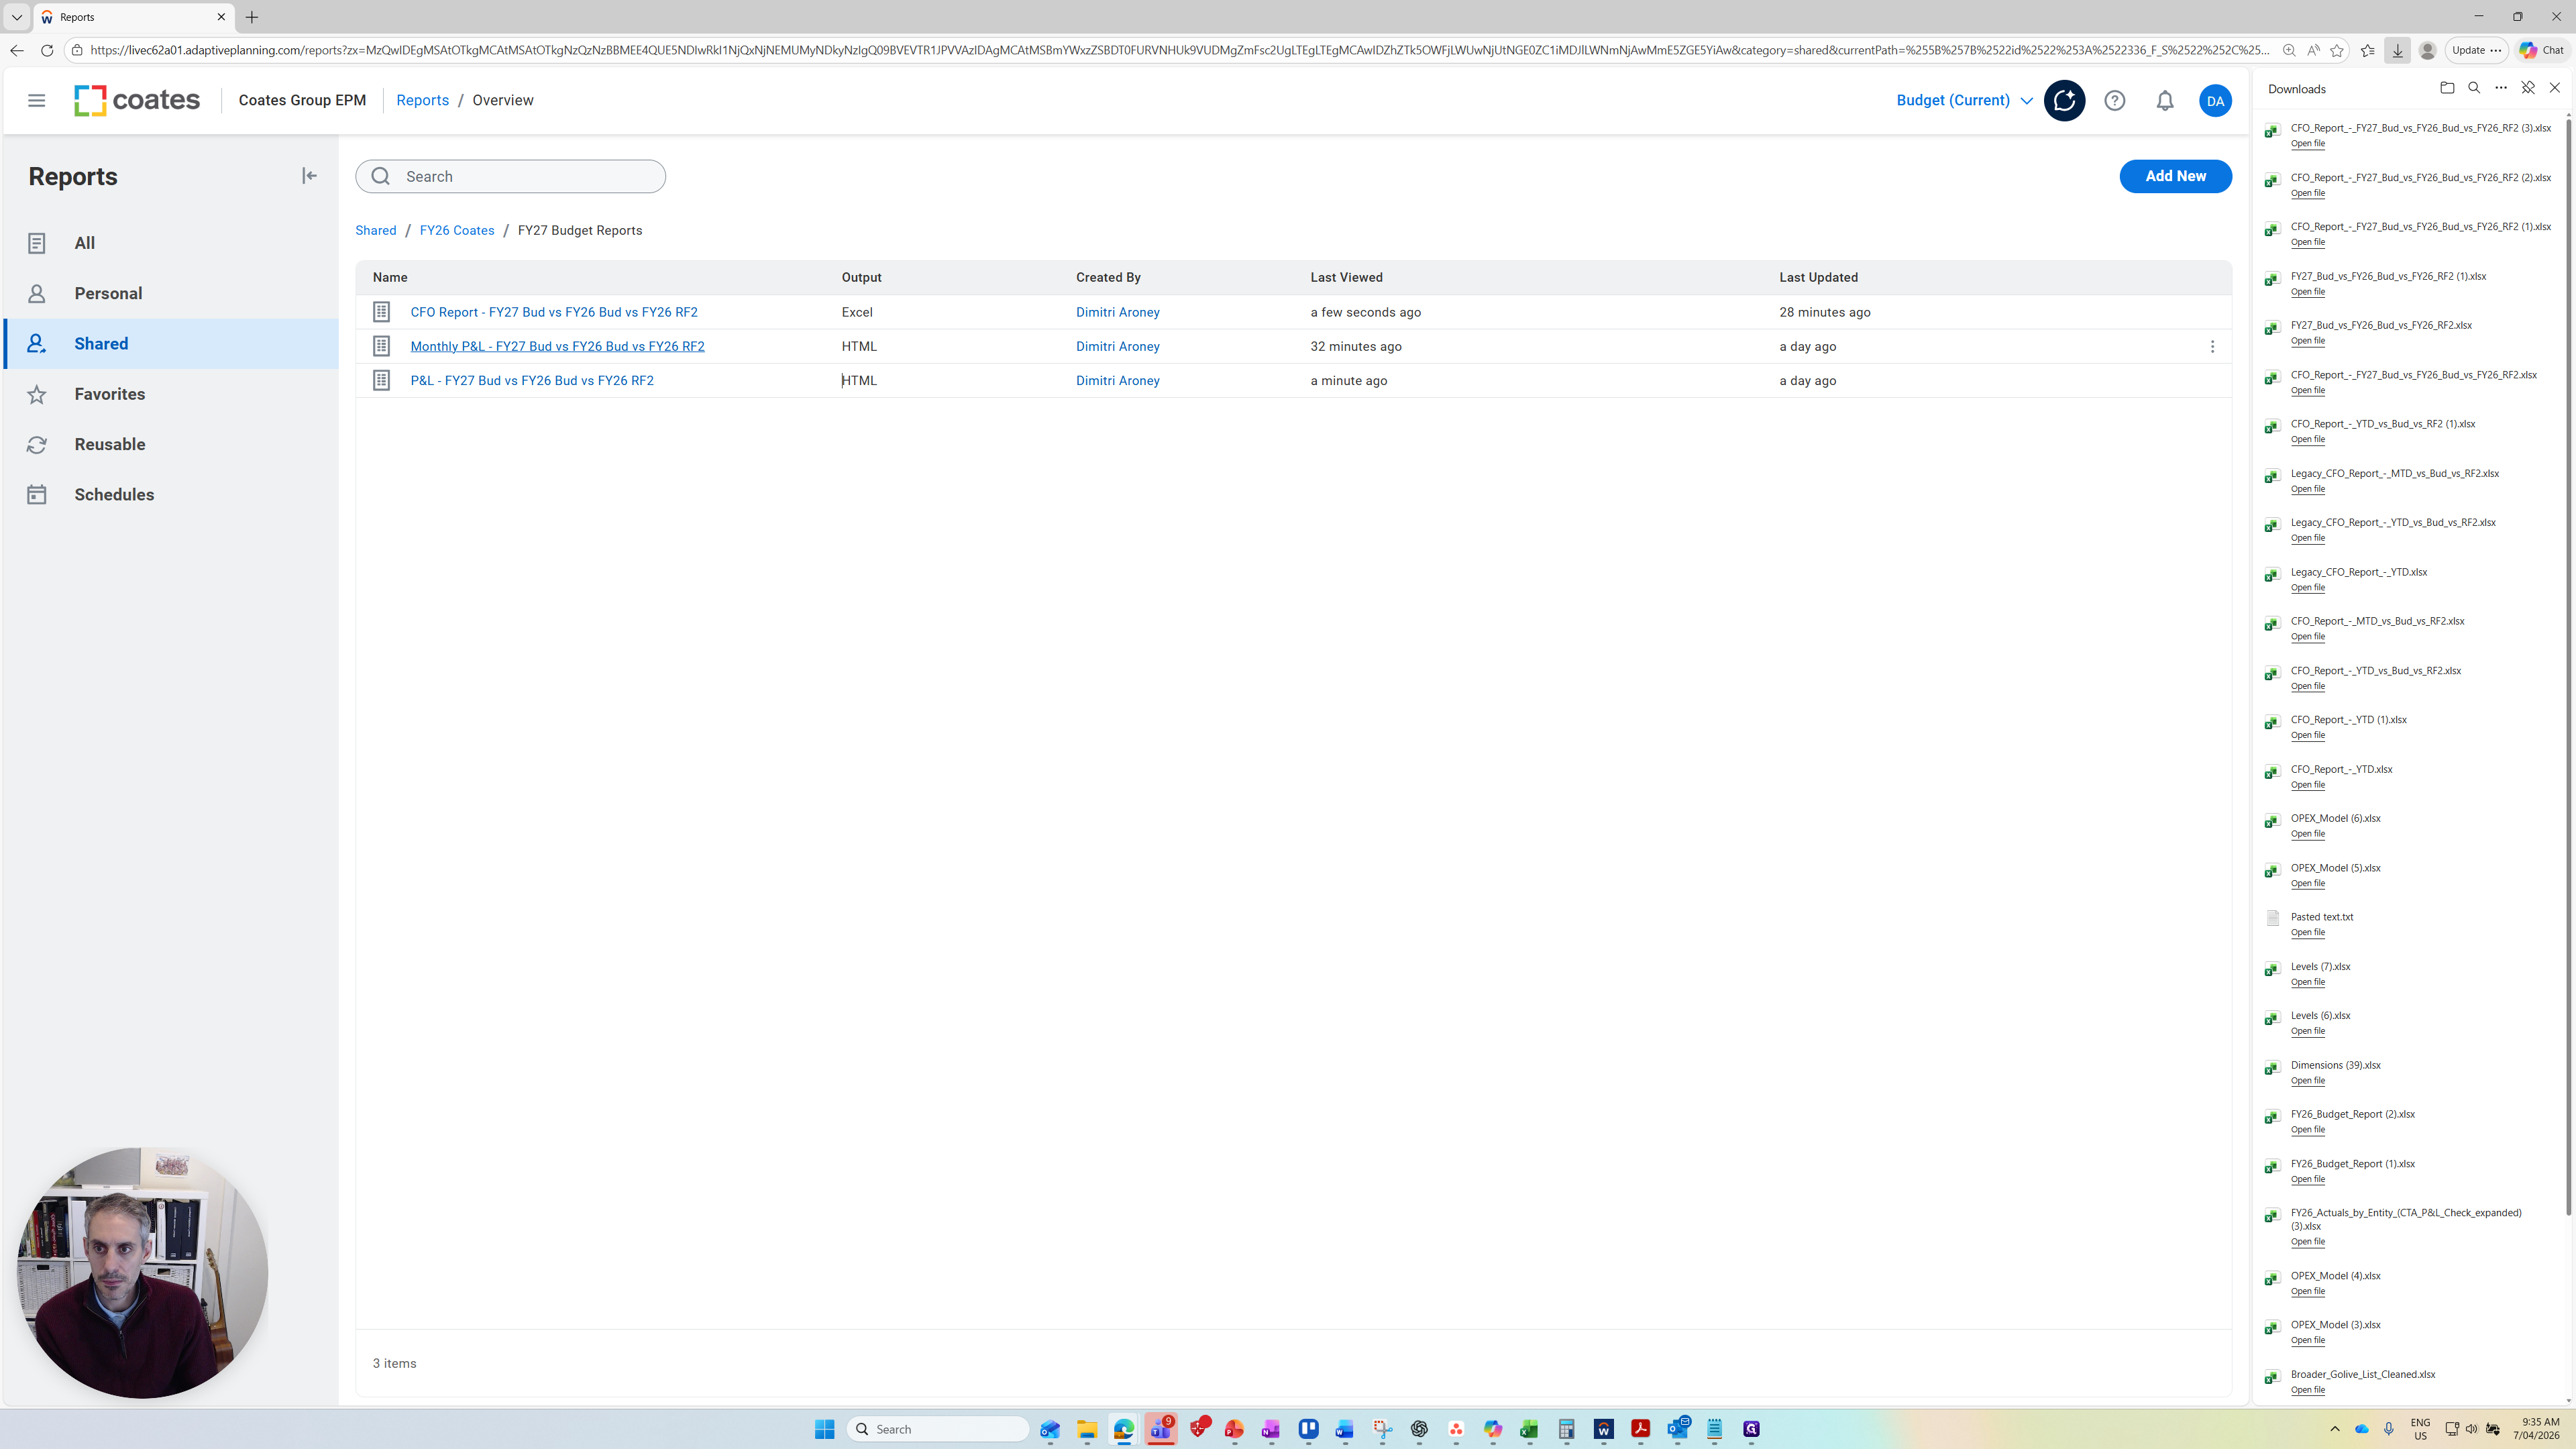
Here, you'll see a folder called FY27 Budget Reports. There are three financial reports available today.
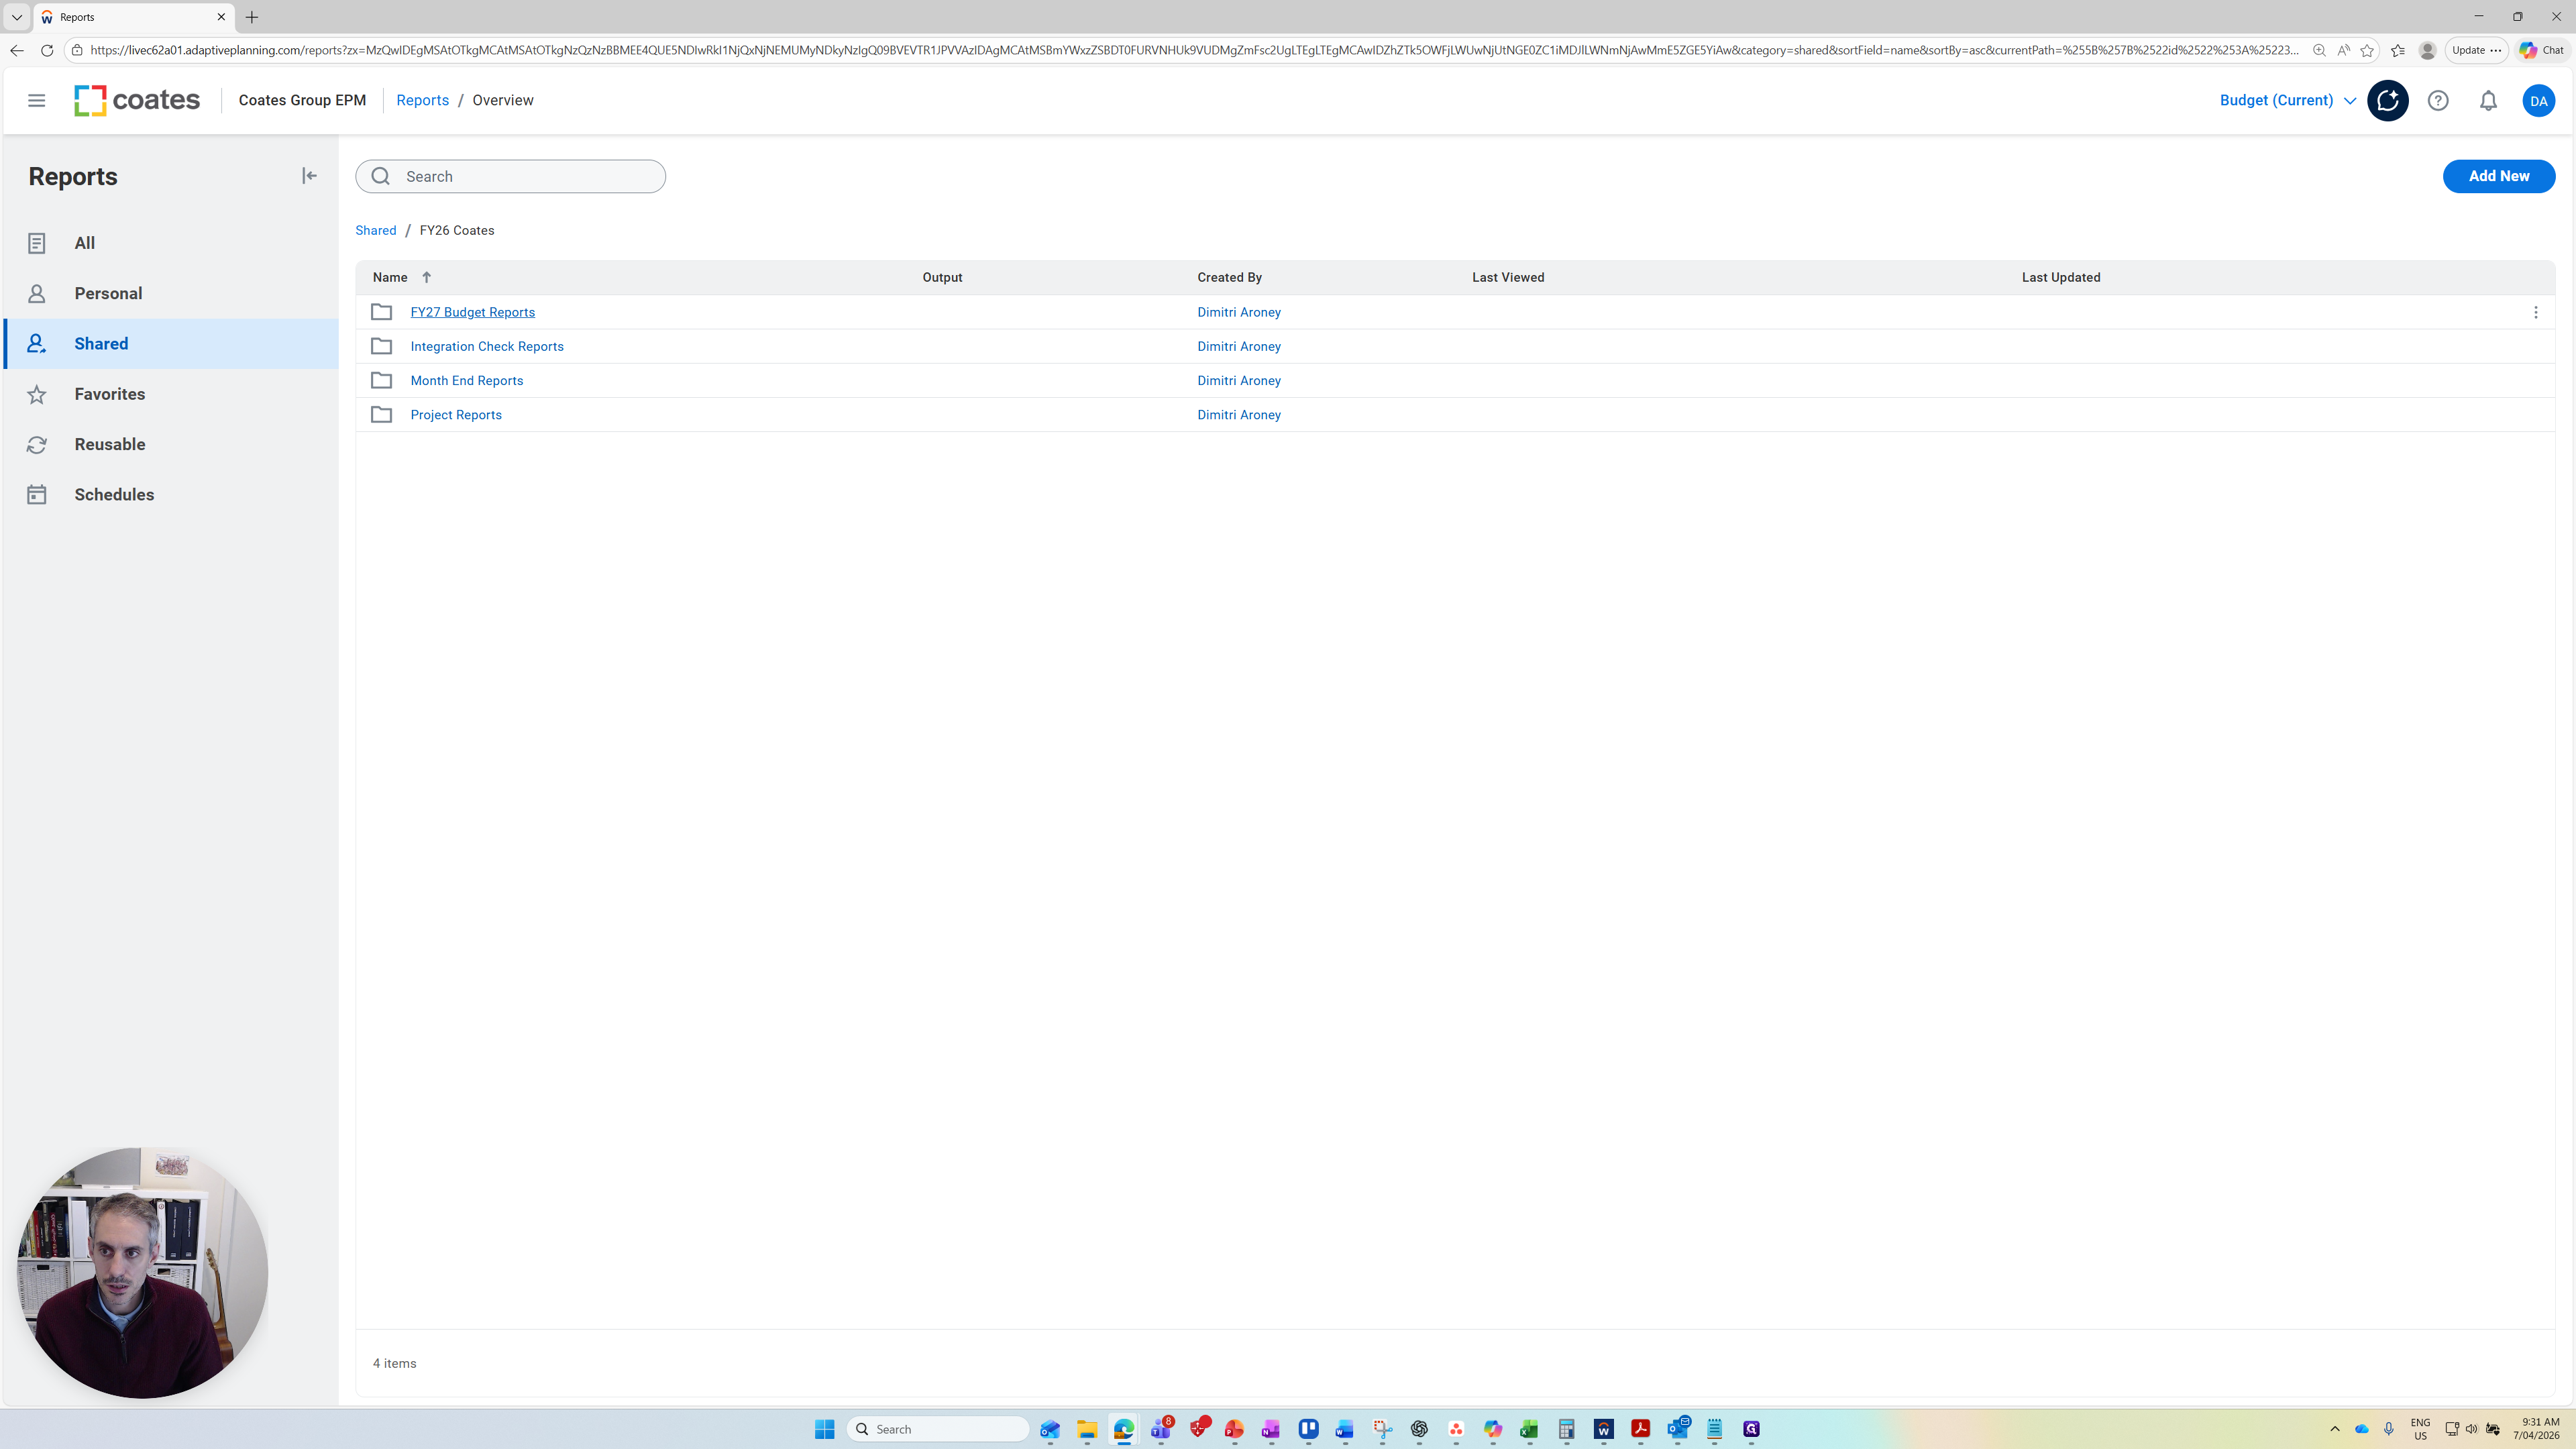
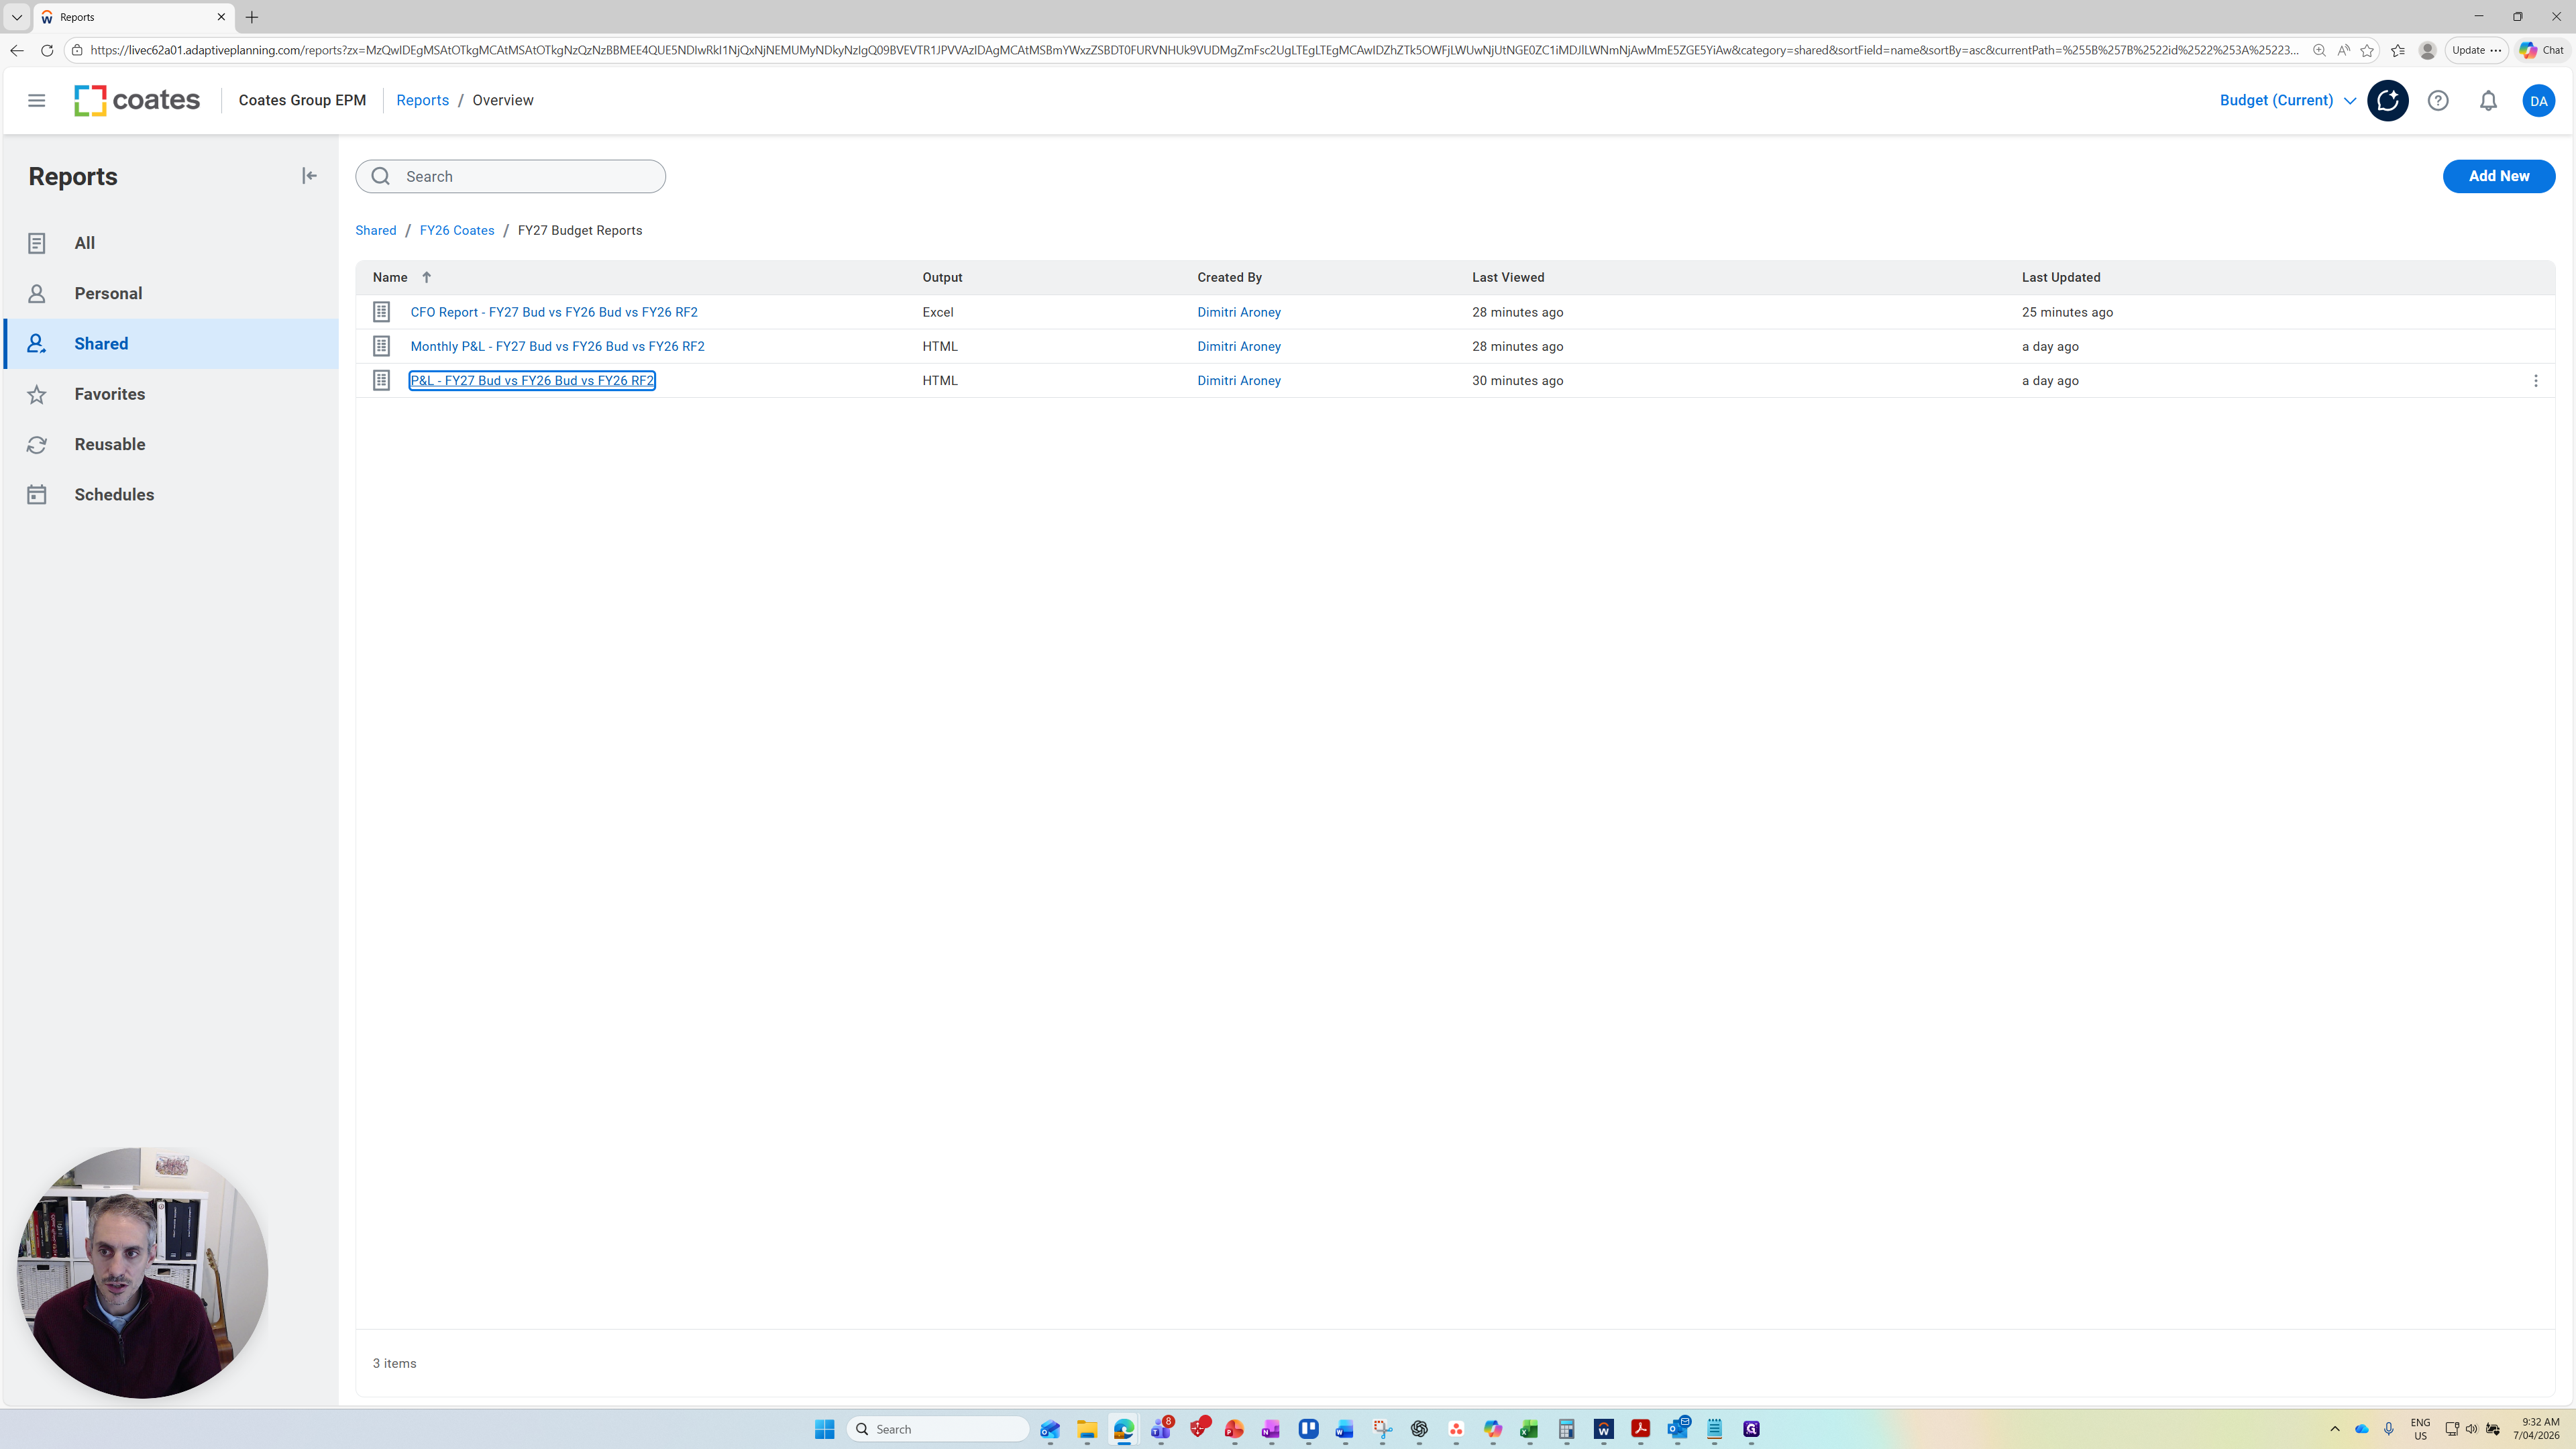
Potentially, more will be added as we continue through the budget session. These are the standard reports built so far. This does not prevent you from creating more reports in the future. There are three reports available. The main one I suggest is the P&L report at the bottom.

I'll open that so you can see its nature.
At the top, you have filters/parametres. You can change the currency.
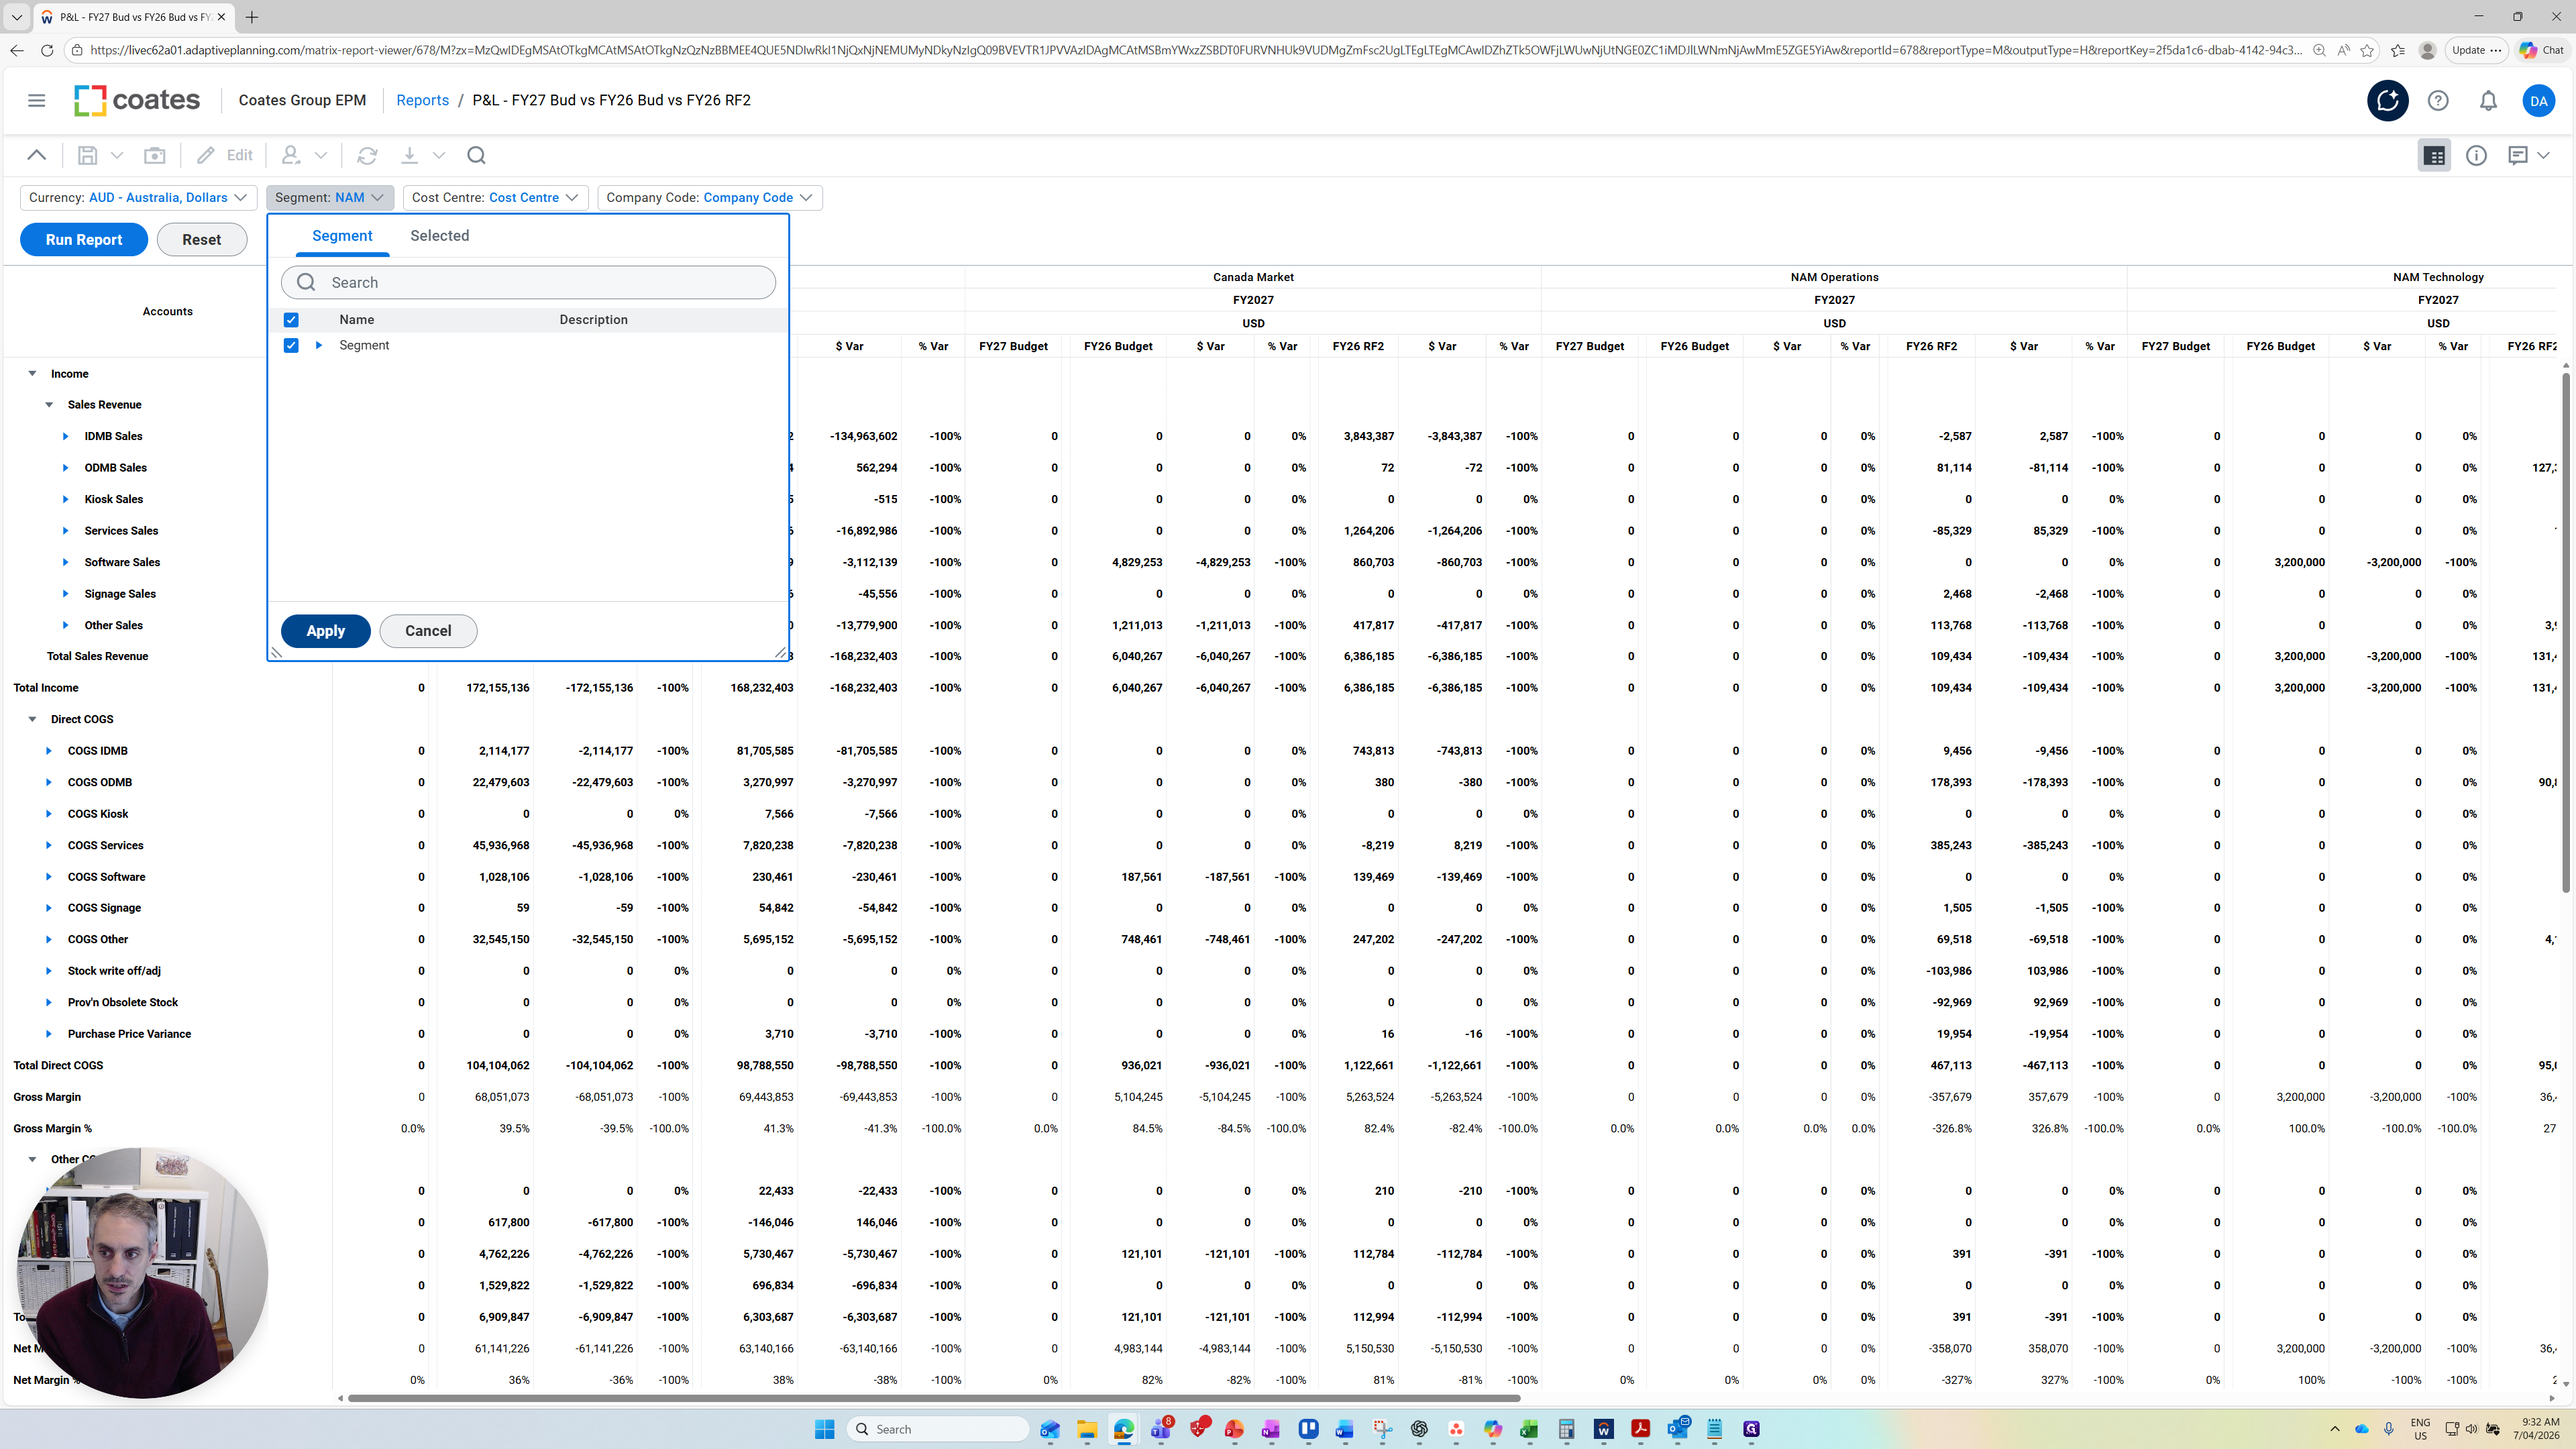
You can change the segment you want to report on.
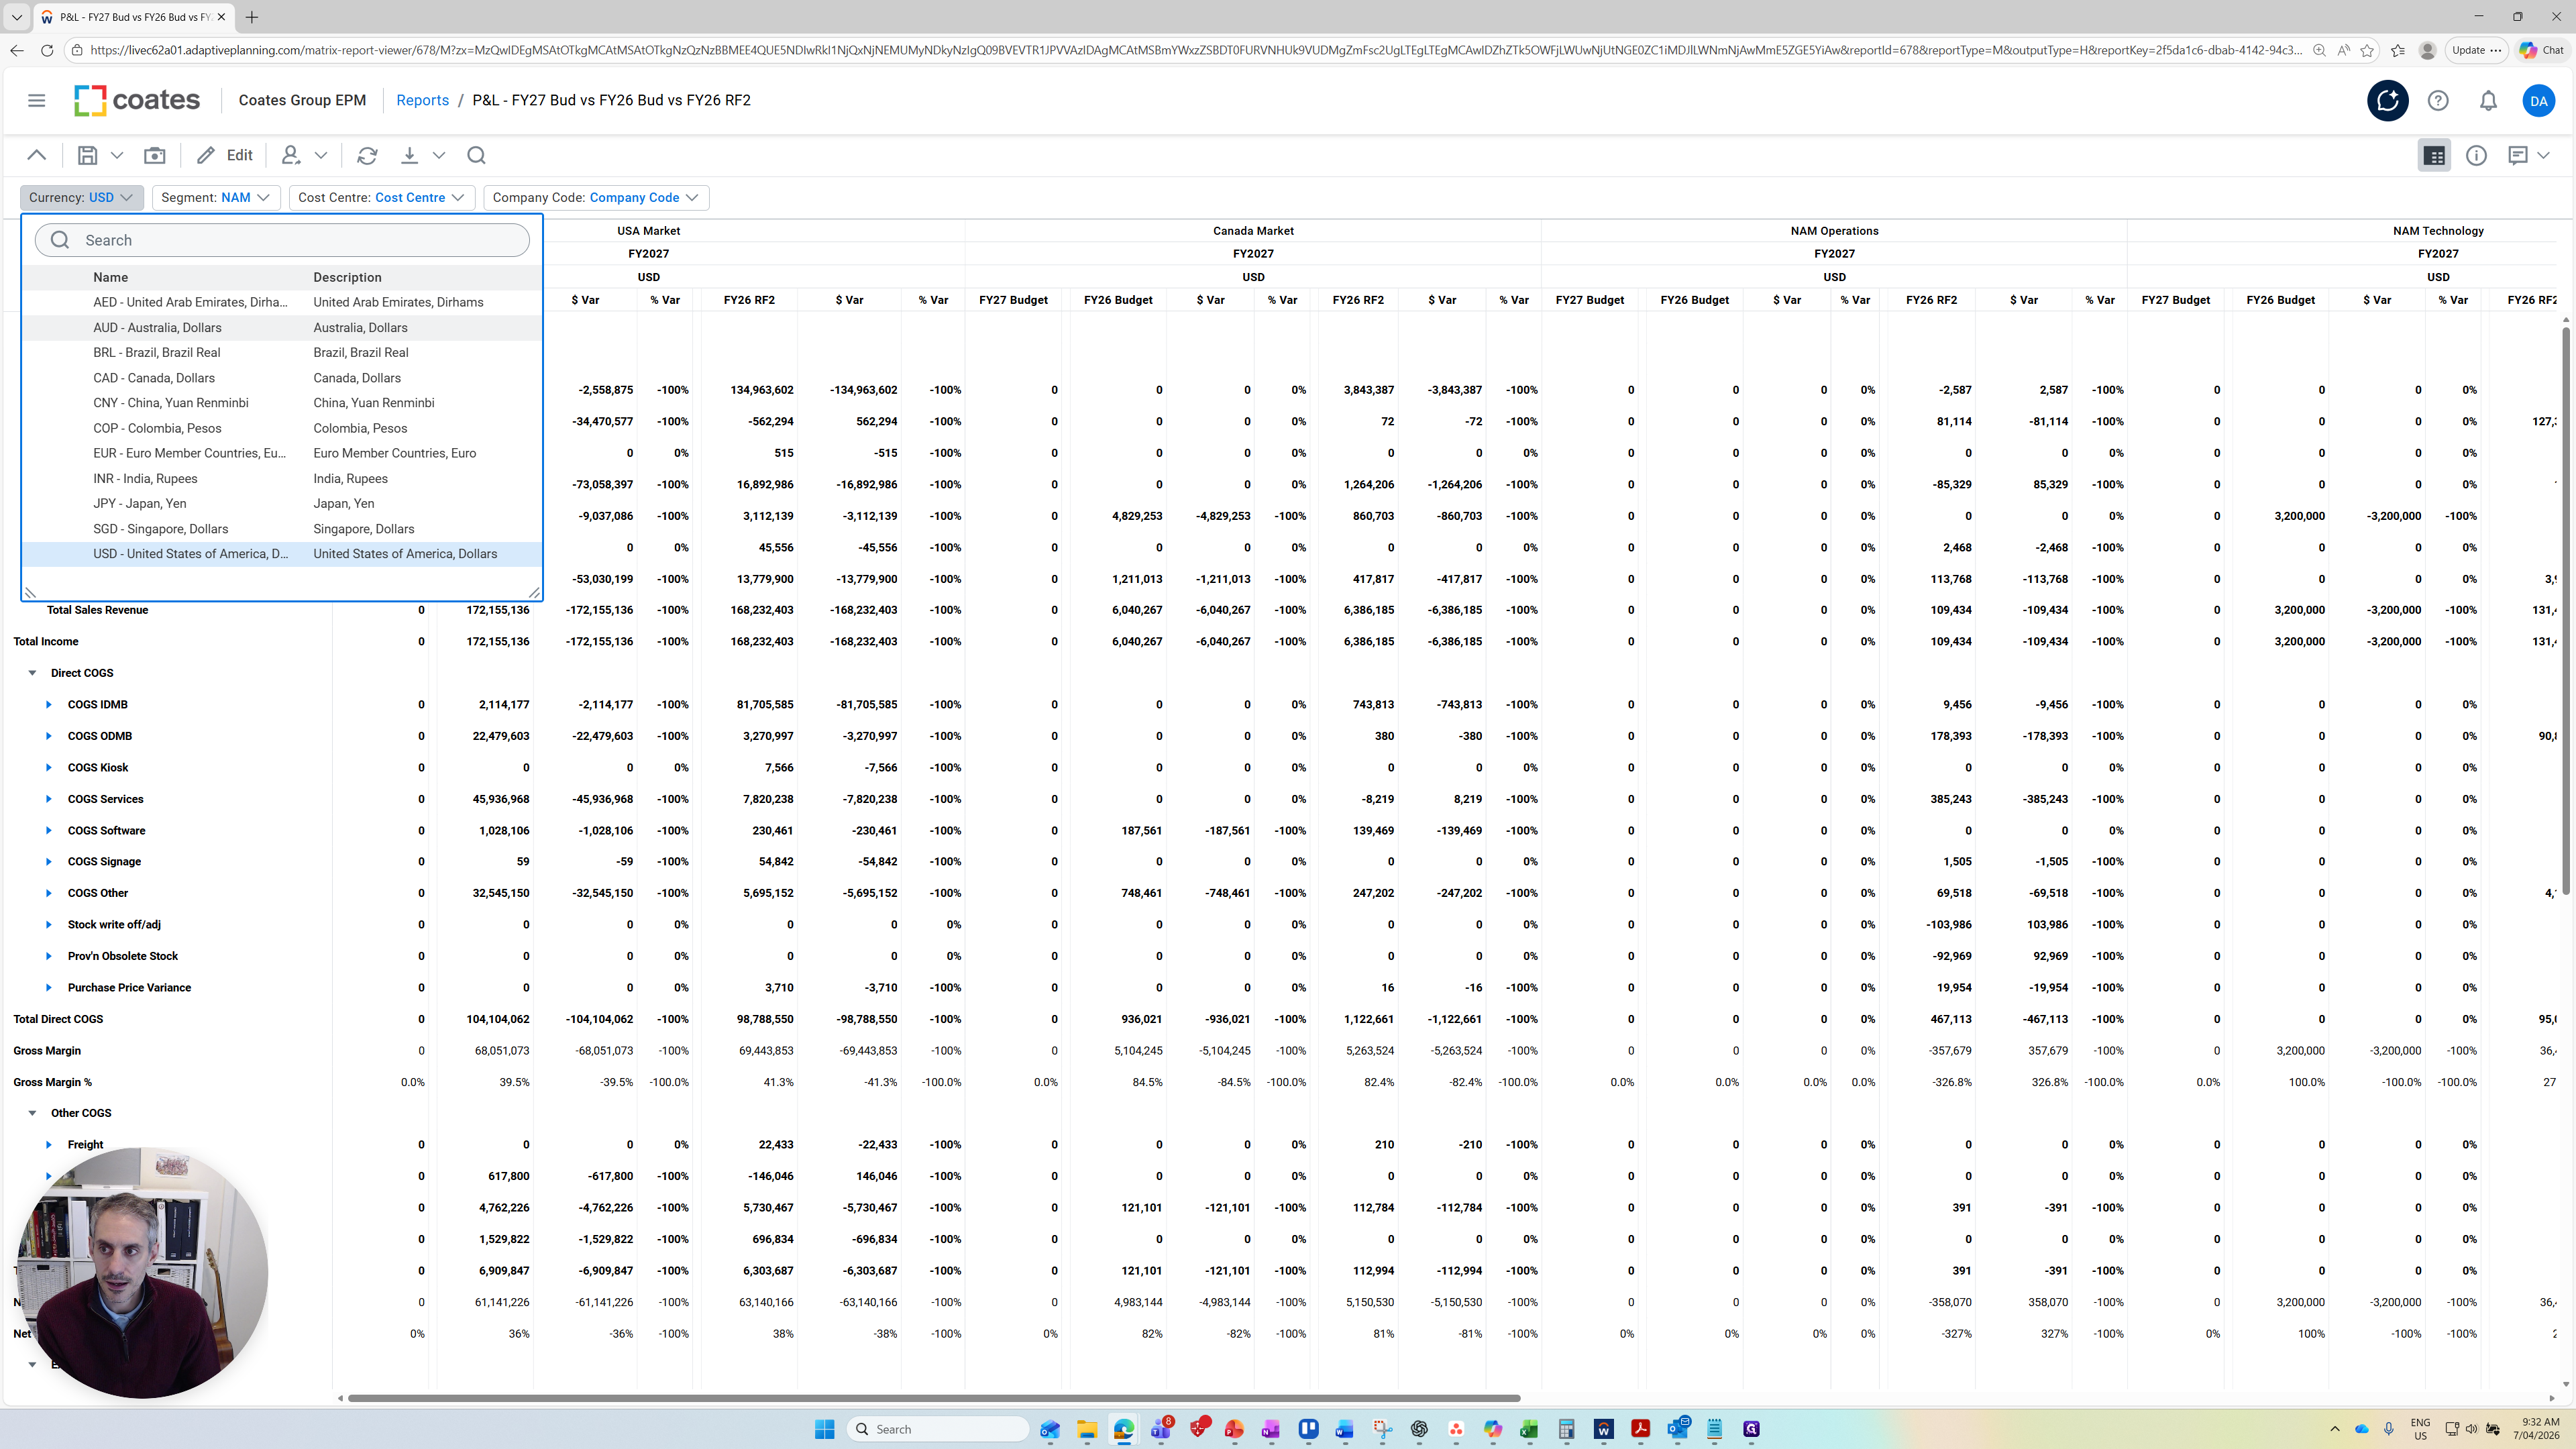

You can make it all segments.

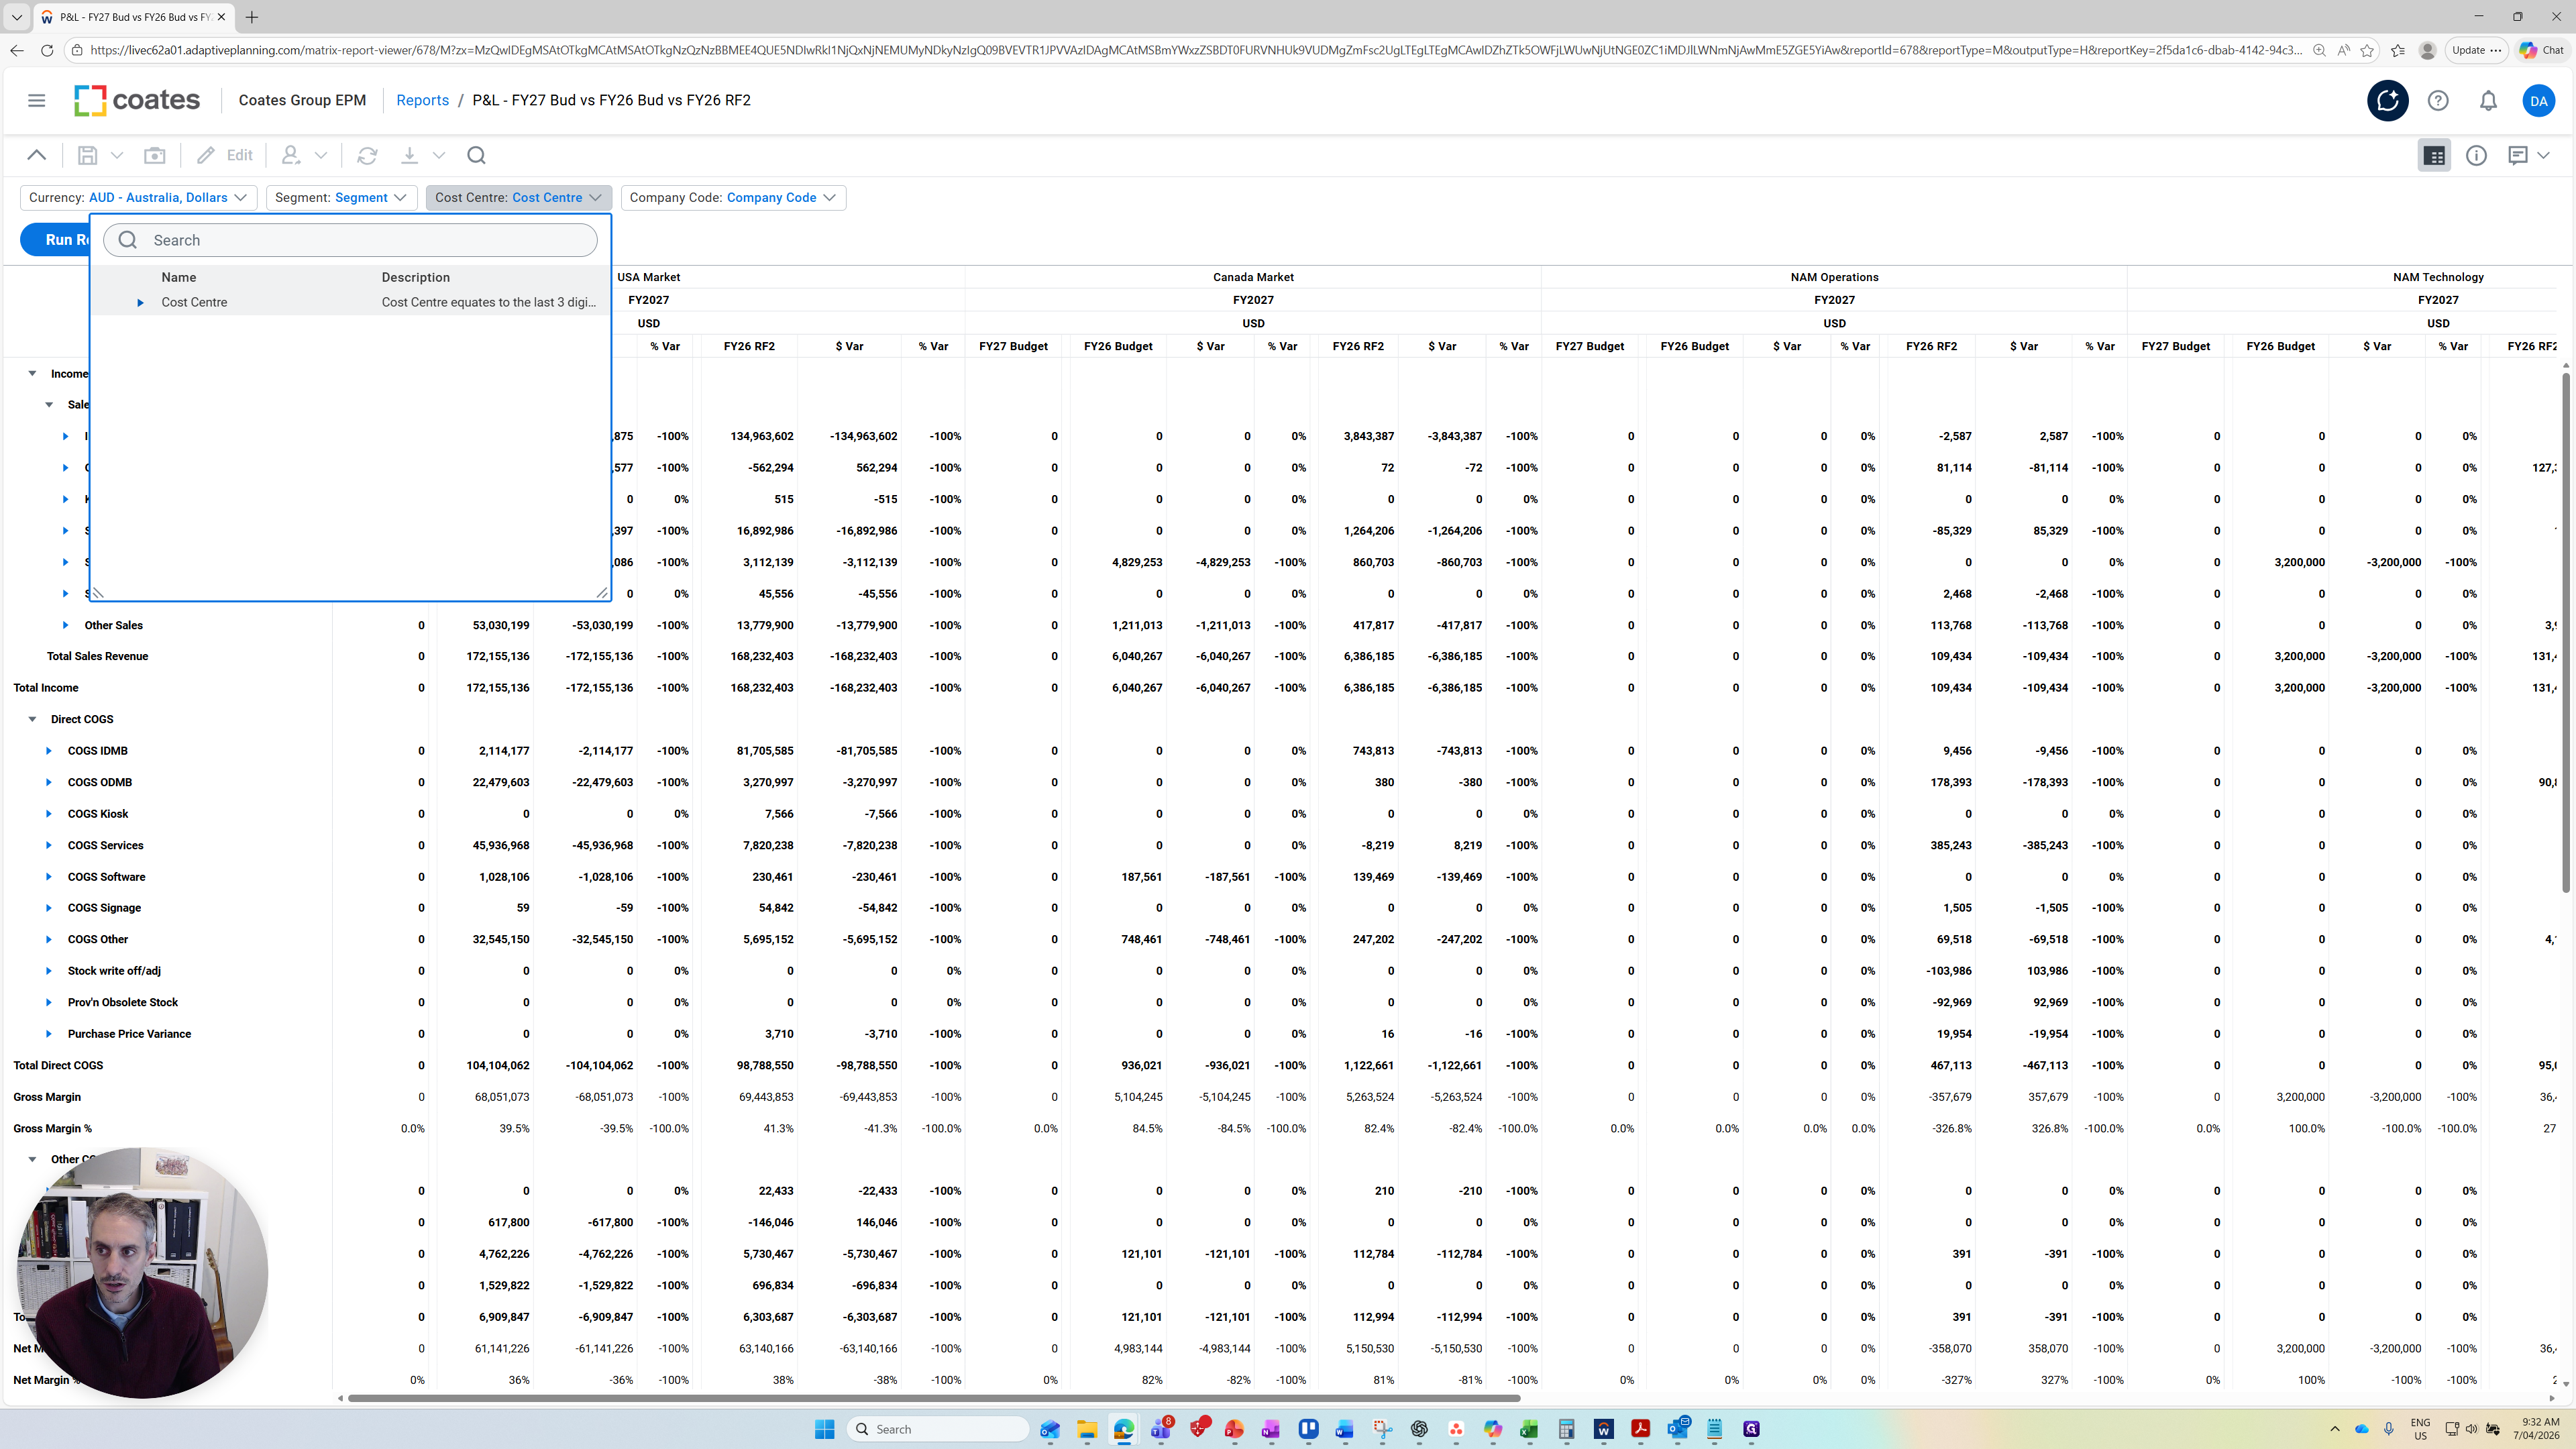
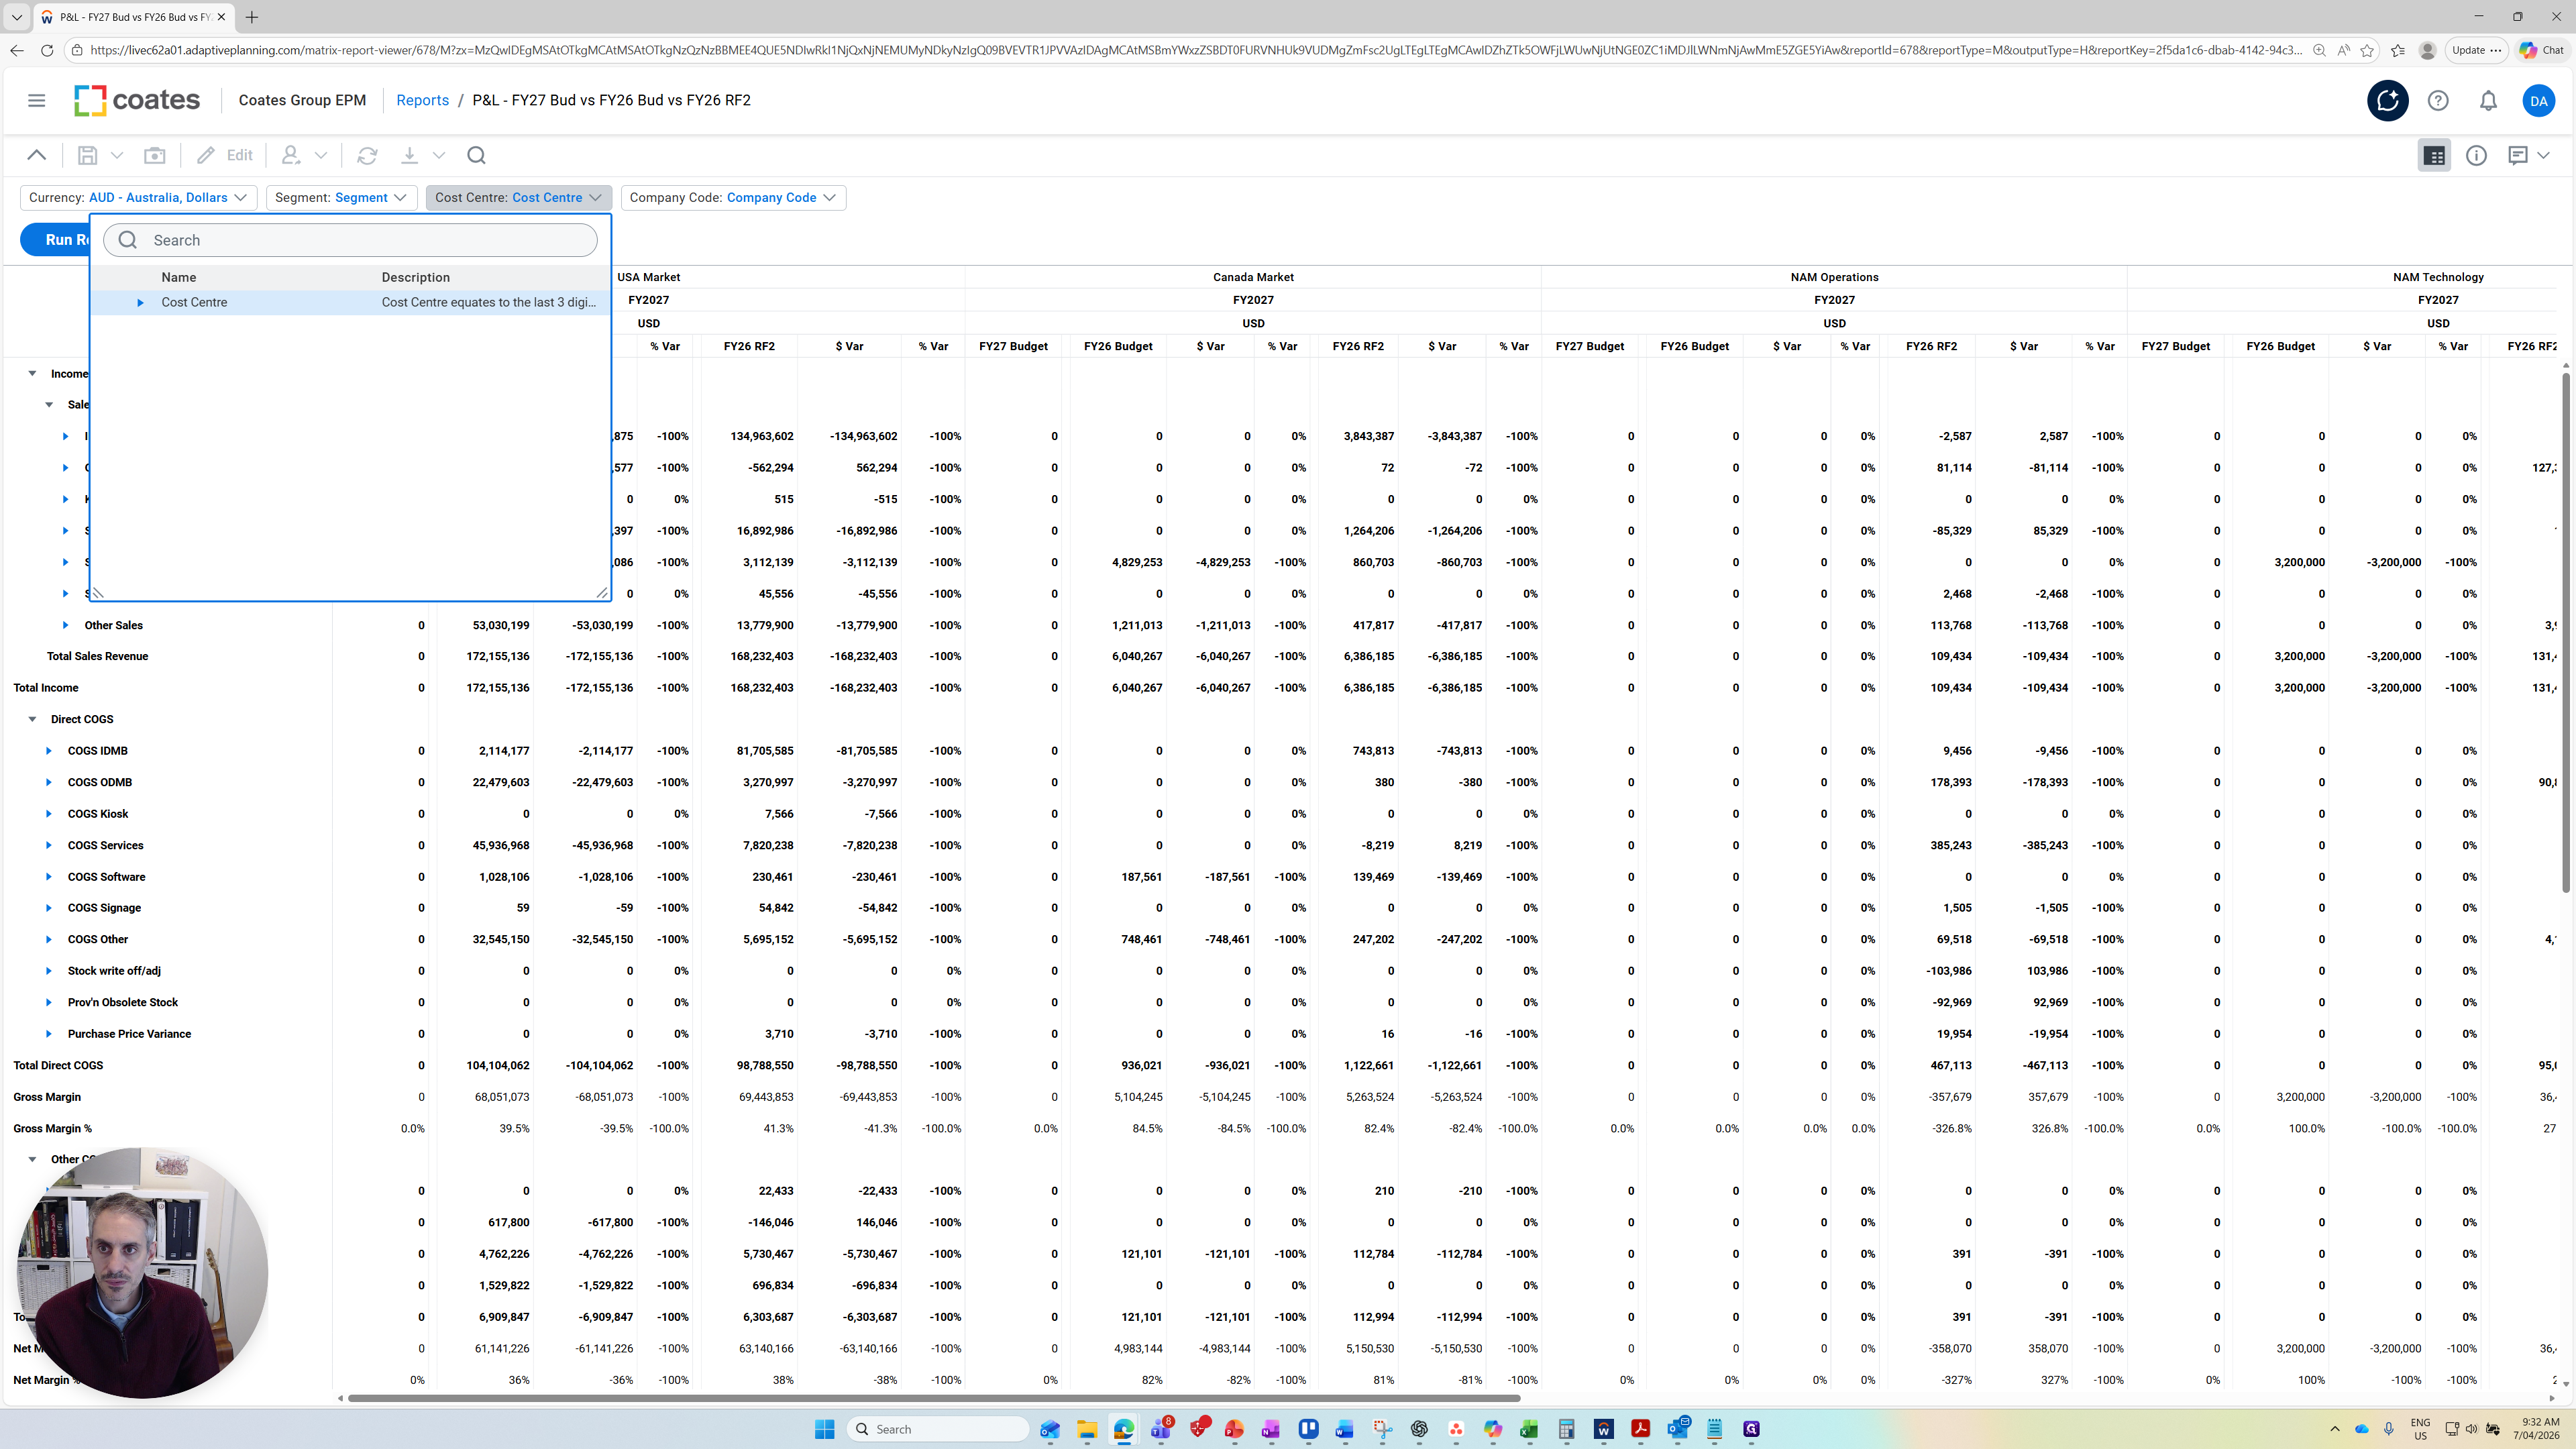
You can focus on an individual cost center or a combination of segment and cost center.

You can also focus on a company code.

When you have finished setting up your parameters, press Run Report. You will then receive the refreshed report.

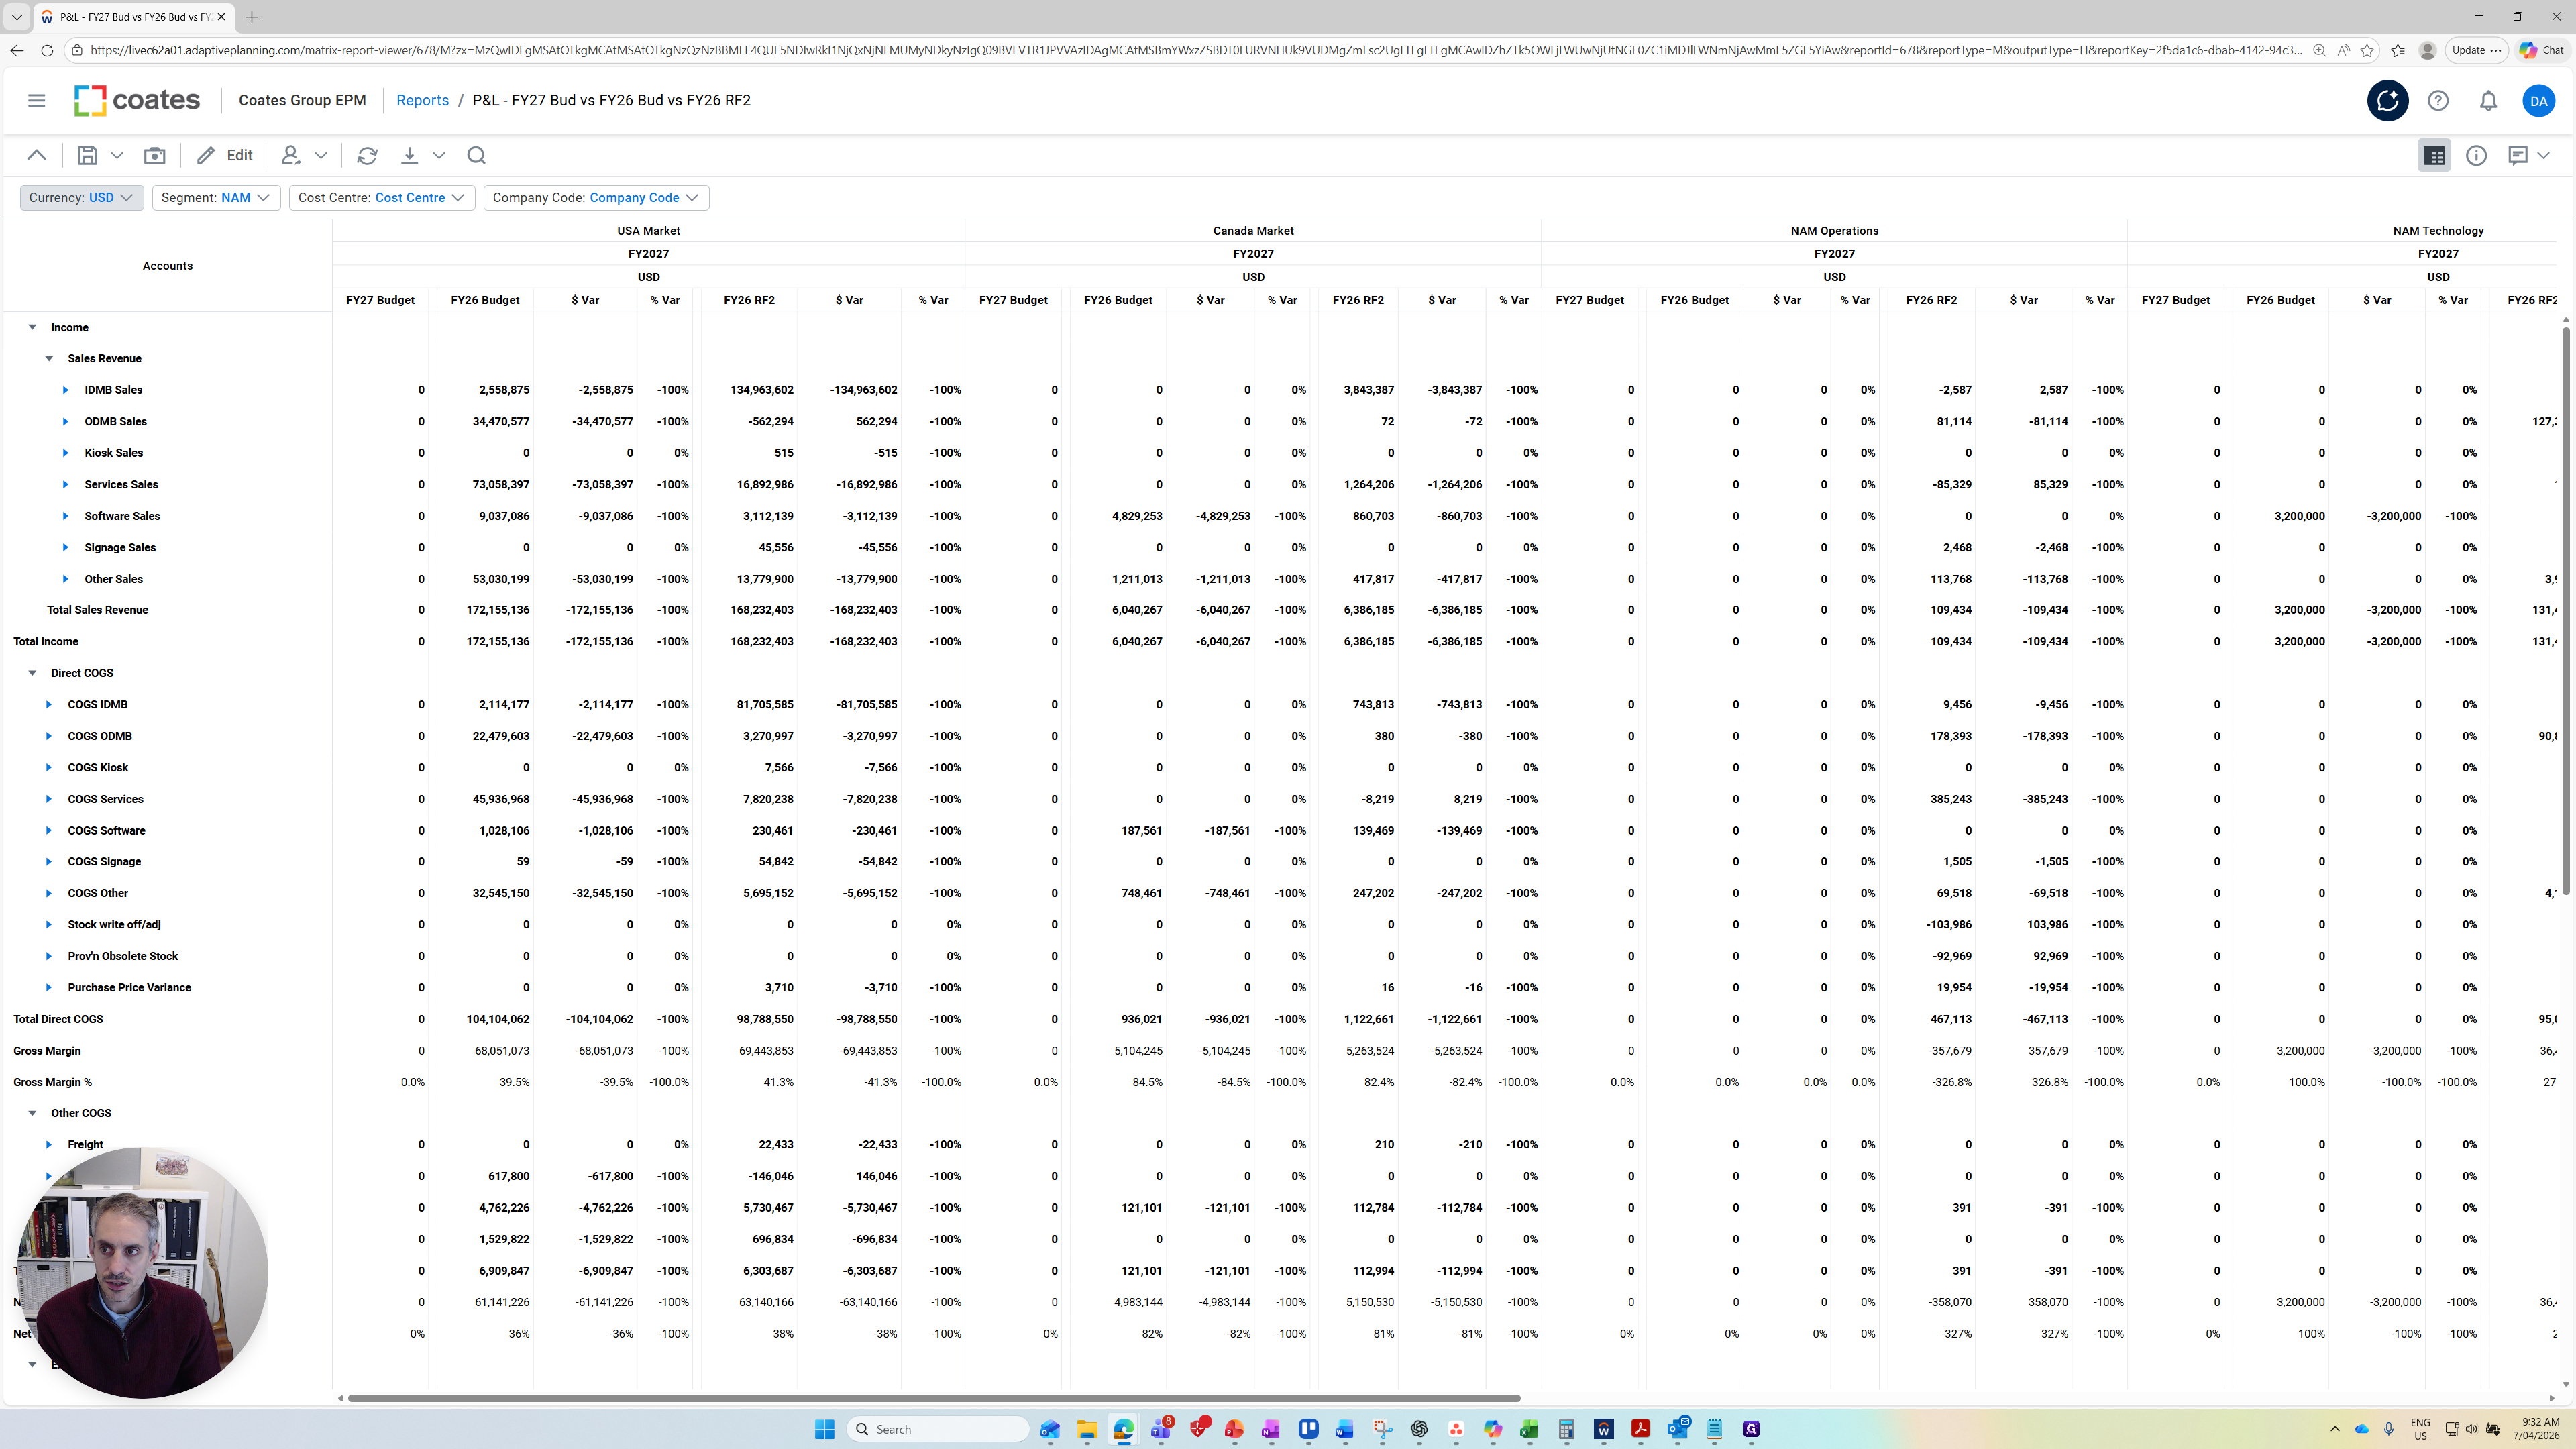
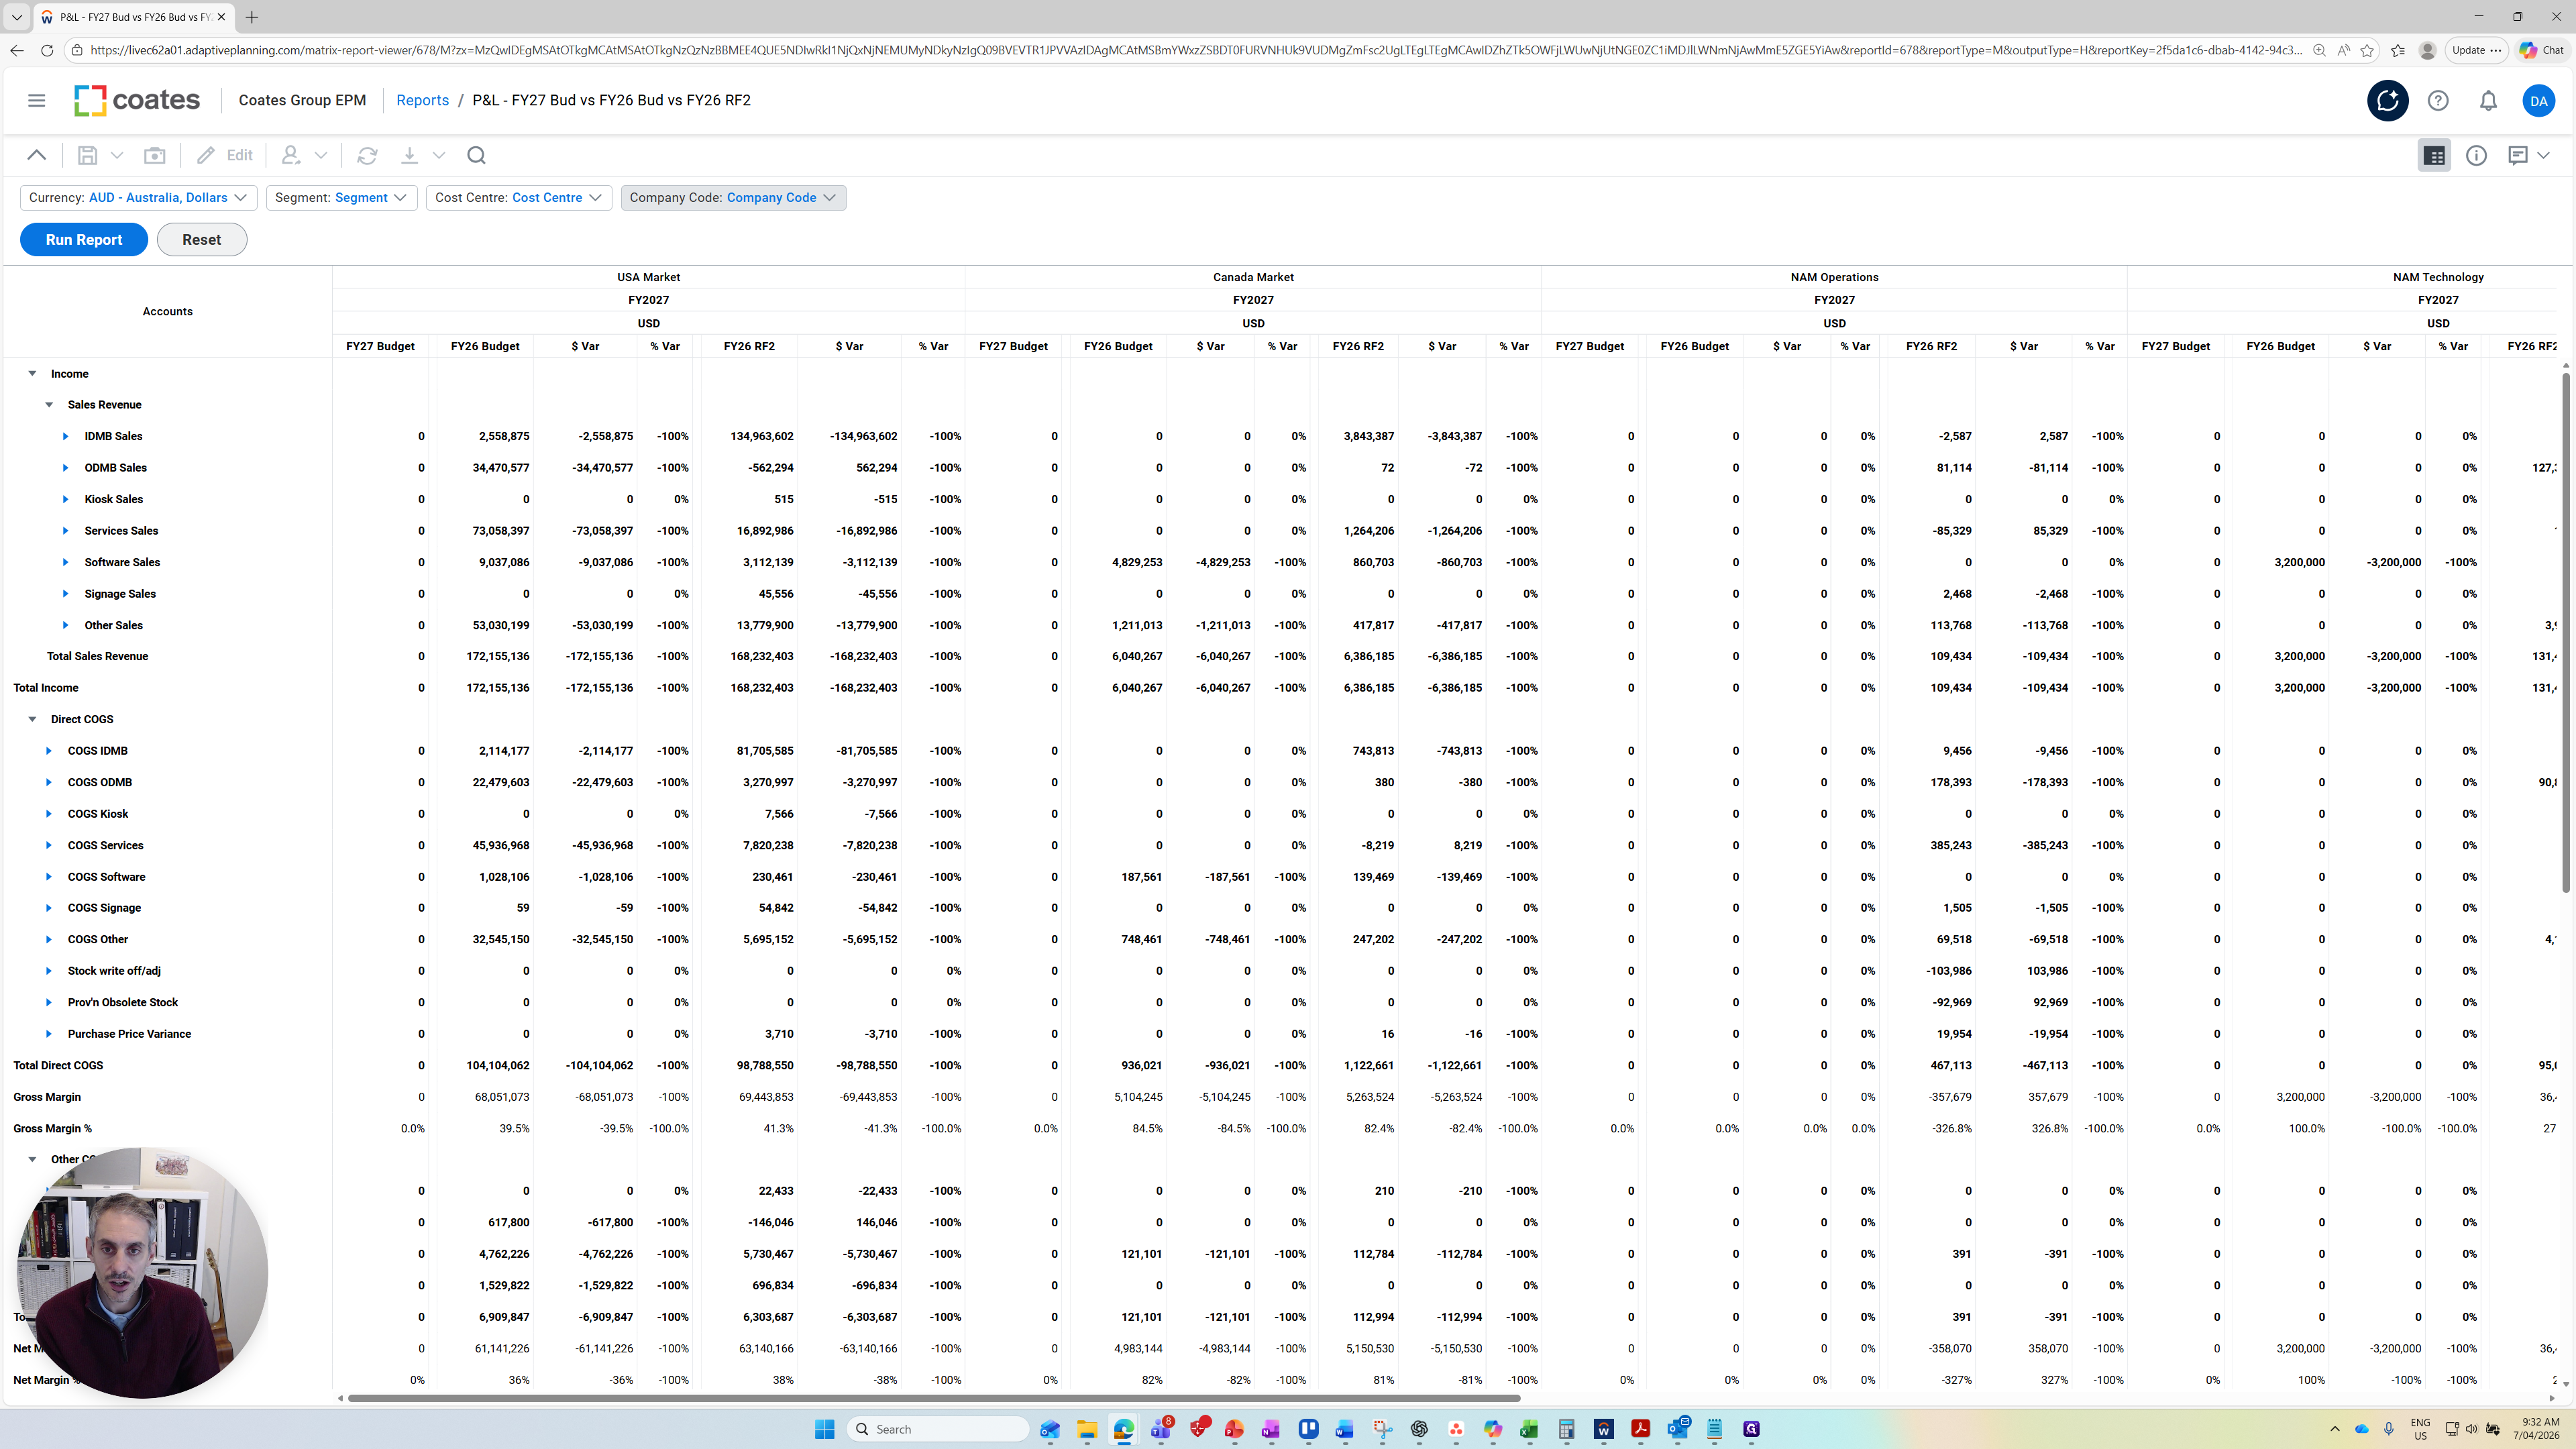
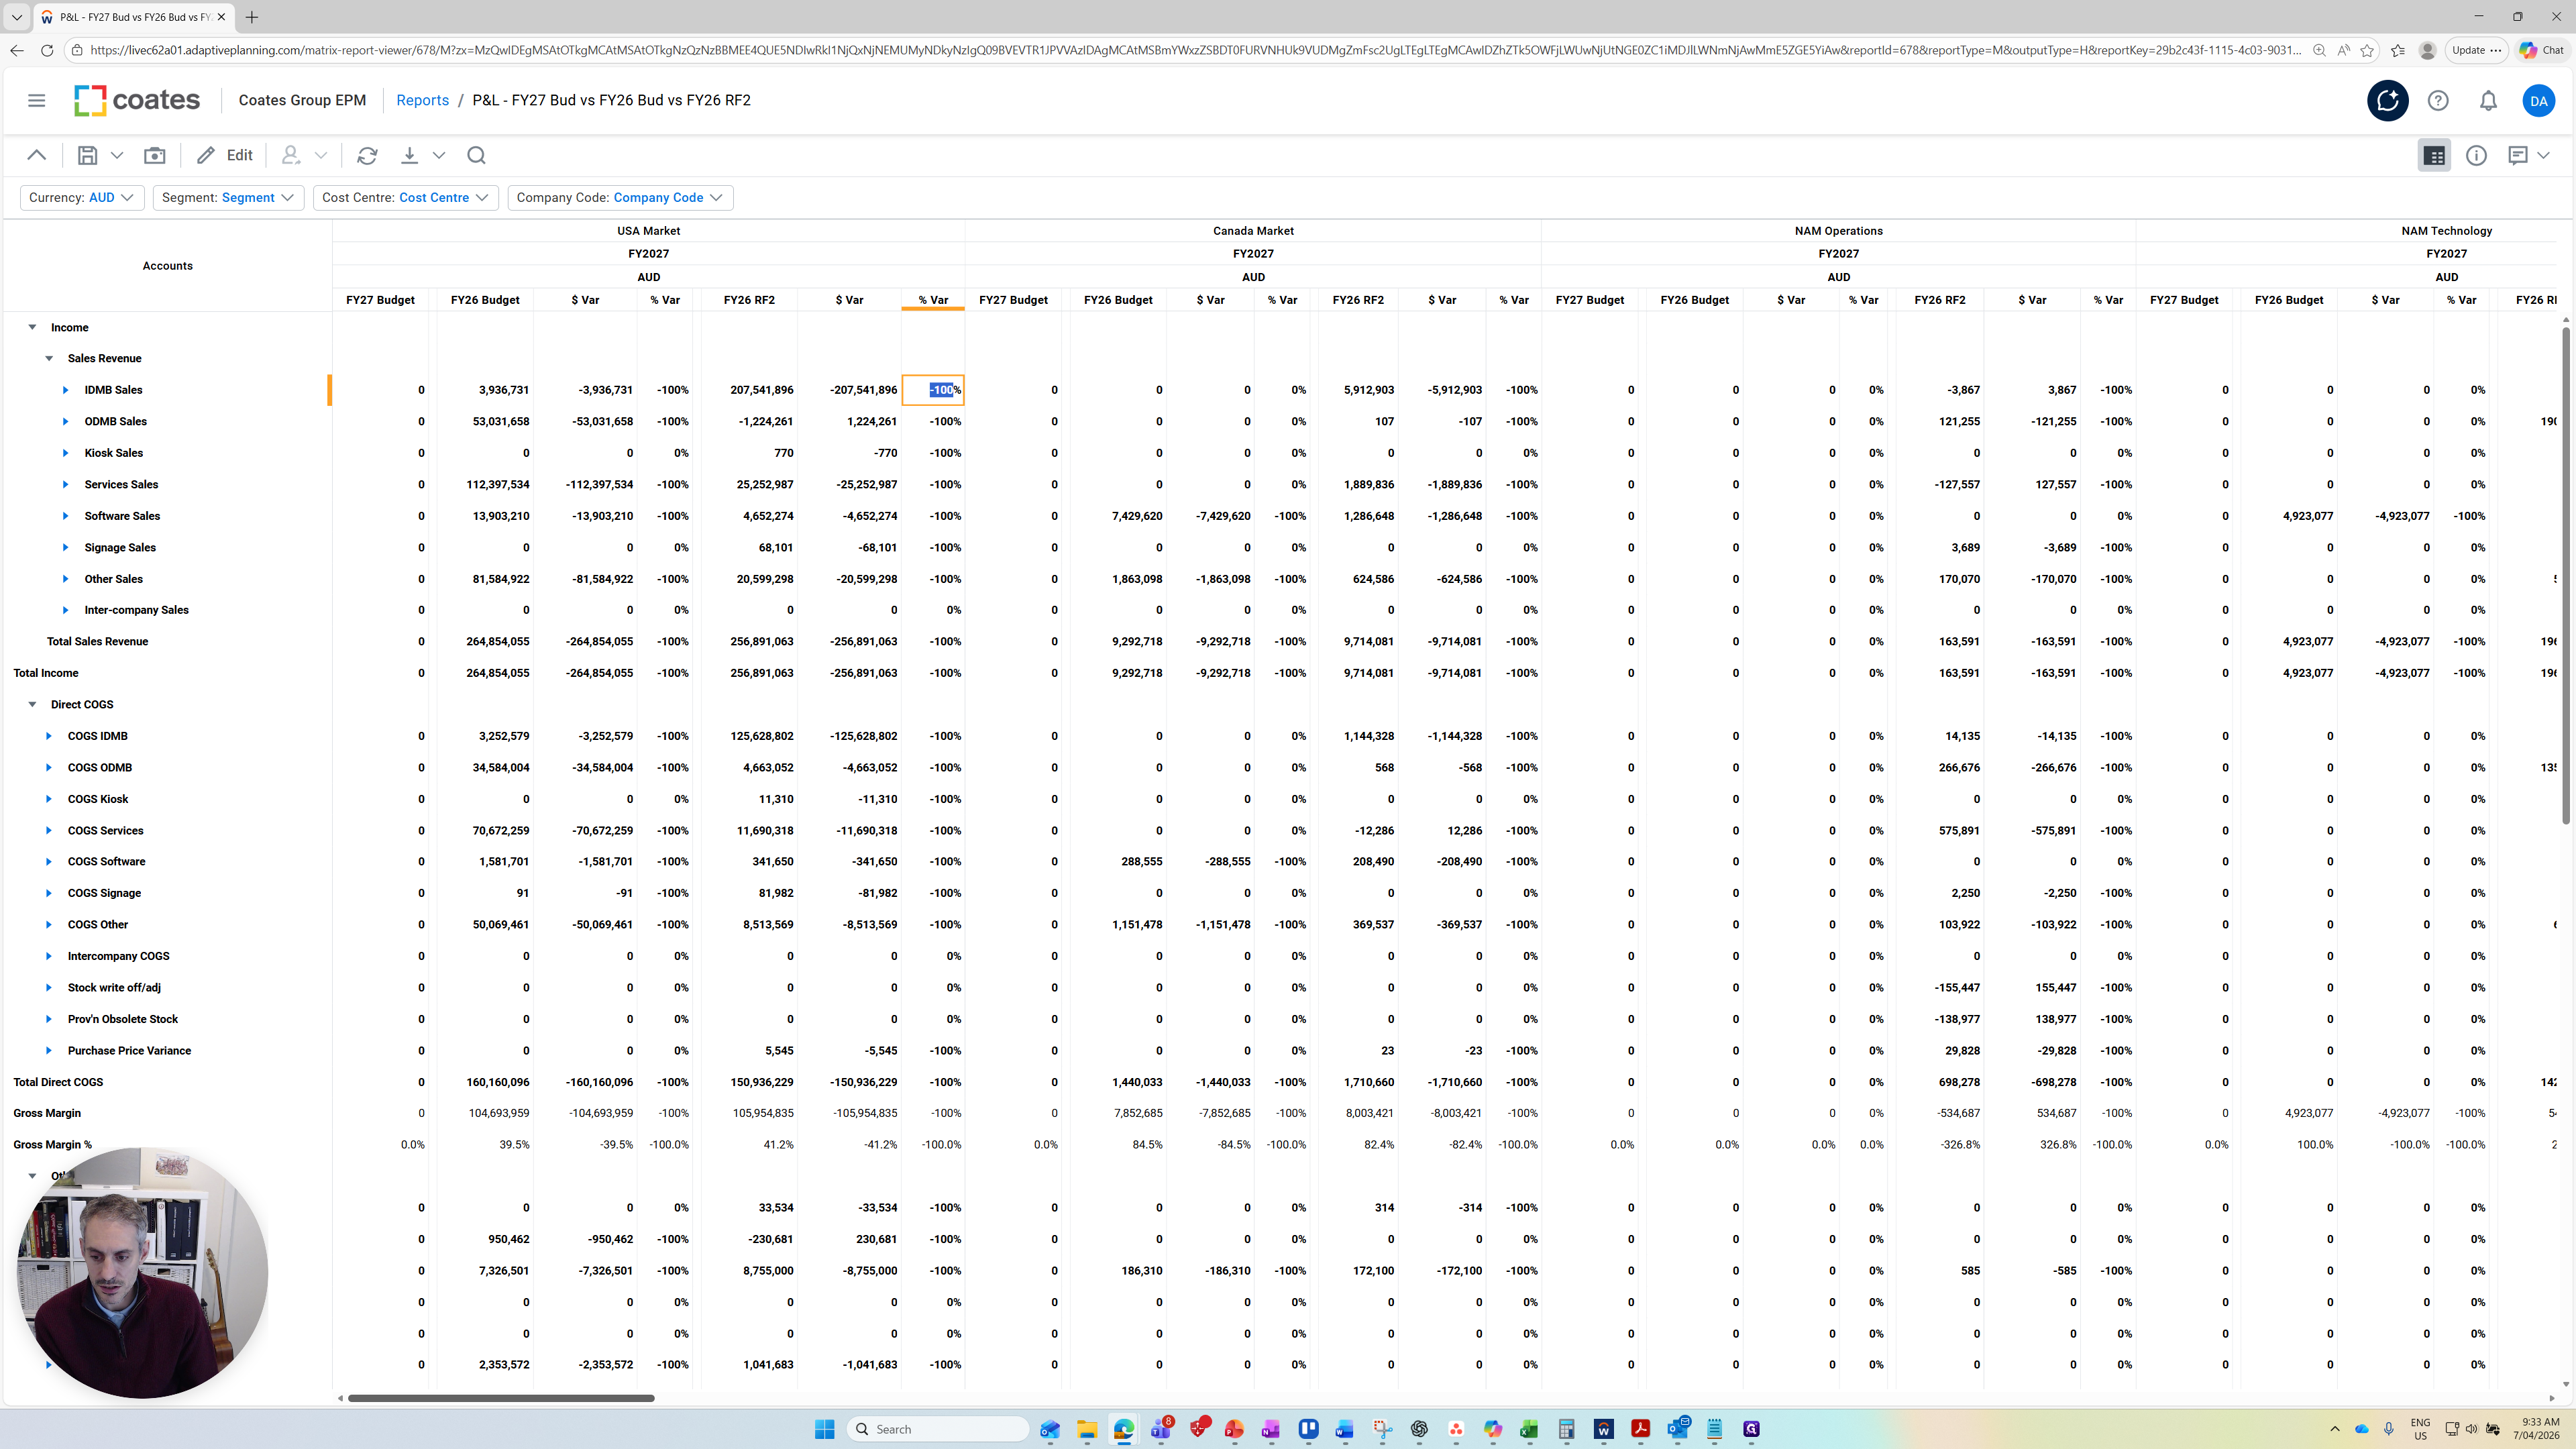
All the numbers have been updated. Lets look at what is contained in this report.
The columns we have are FY27 Budget. At the moment, these are all zero because we haven't uploaded any budget values for income yet.
We have the FY26 Budget column, the dollar variance, which is the difference between the FY27 Budget and the FY26 Budget, and the percentage variance.
We also have the FY26 RF2 (Reforecast Number 2), prepared in January. We are comparing the FY27 Budget to the FY26 RF2. This shows the variance in dollars and the percentage variances.

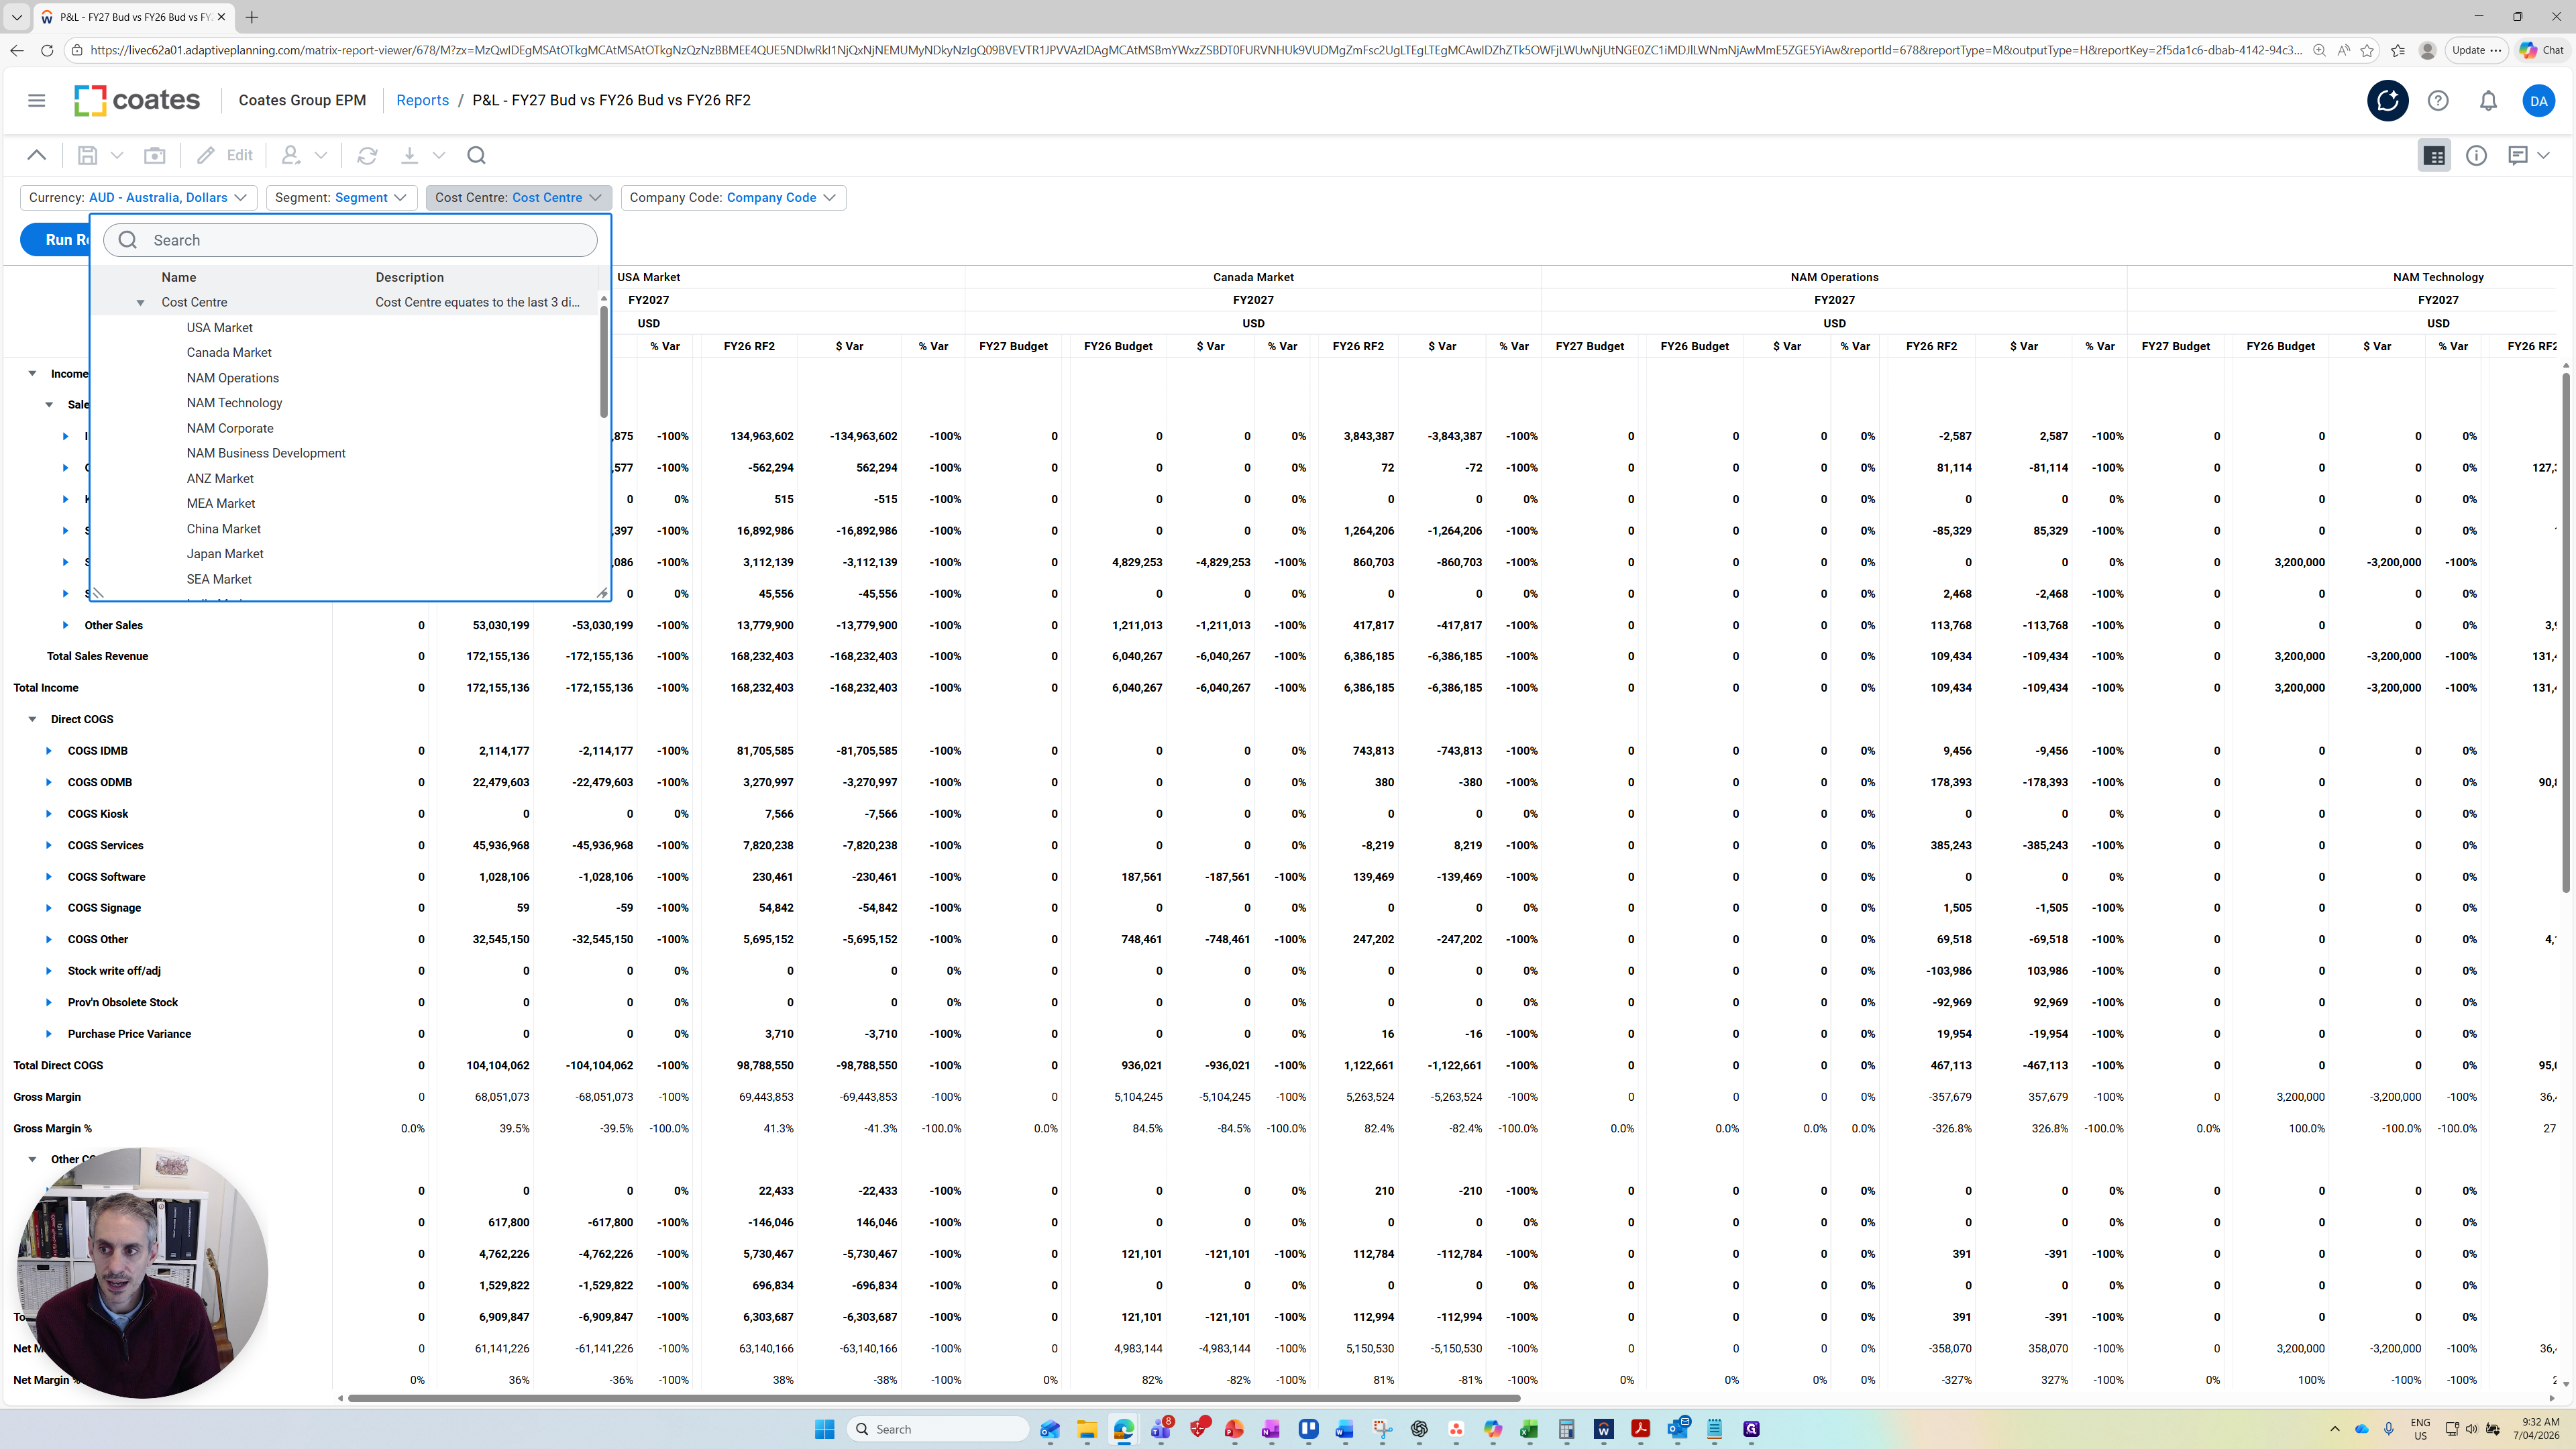
This format is consistently used in this report. You can see here that it's grouped by cost centers. If I scroll to the right, you'll see the cost centers are grouped.
There are different types of cost center roll-ups available if you choose to report on the segment.
This is the main report I recommend using. If I go back into Reports, here is a link to the traditional CFO report view used by finance, if you prefer to use that.

It exports this as an Excel file, and the values are on different tabs.
It's opening up now.
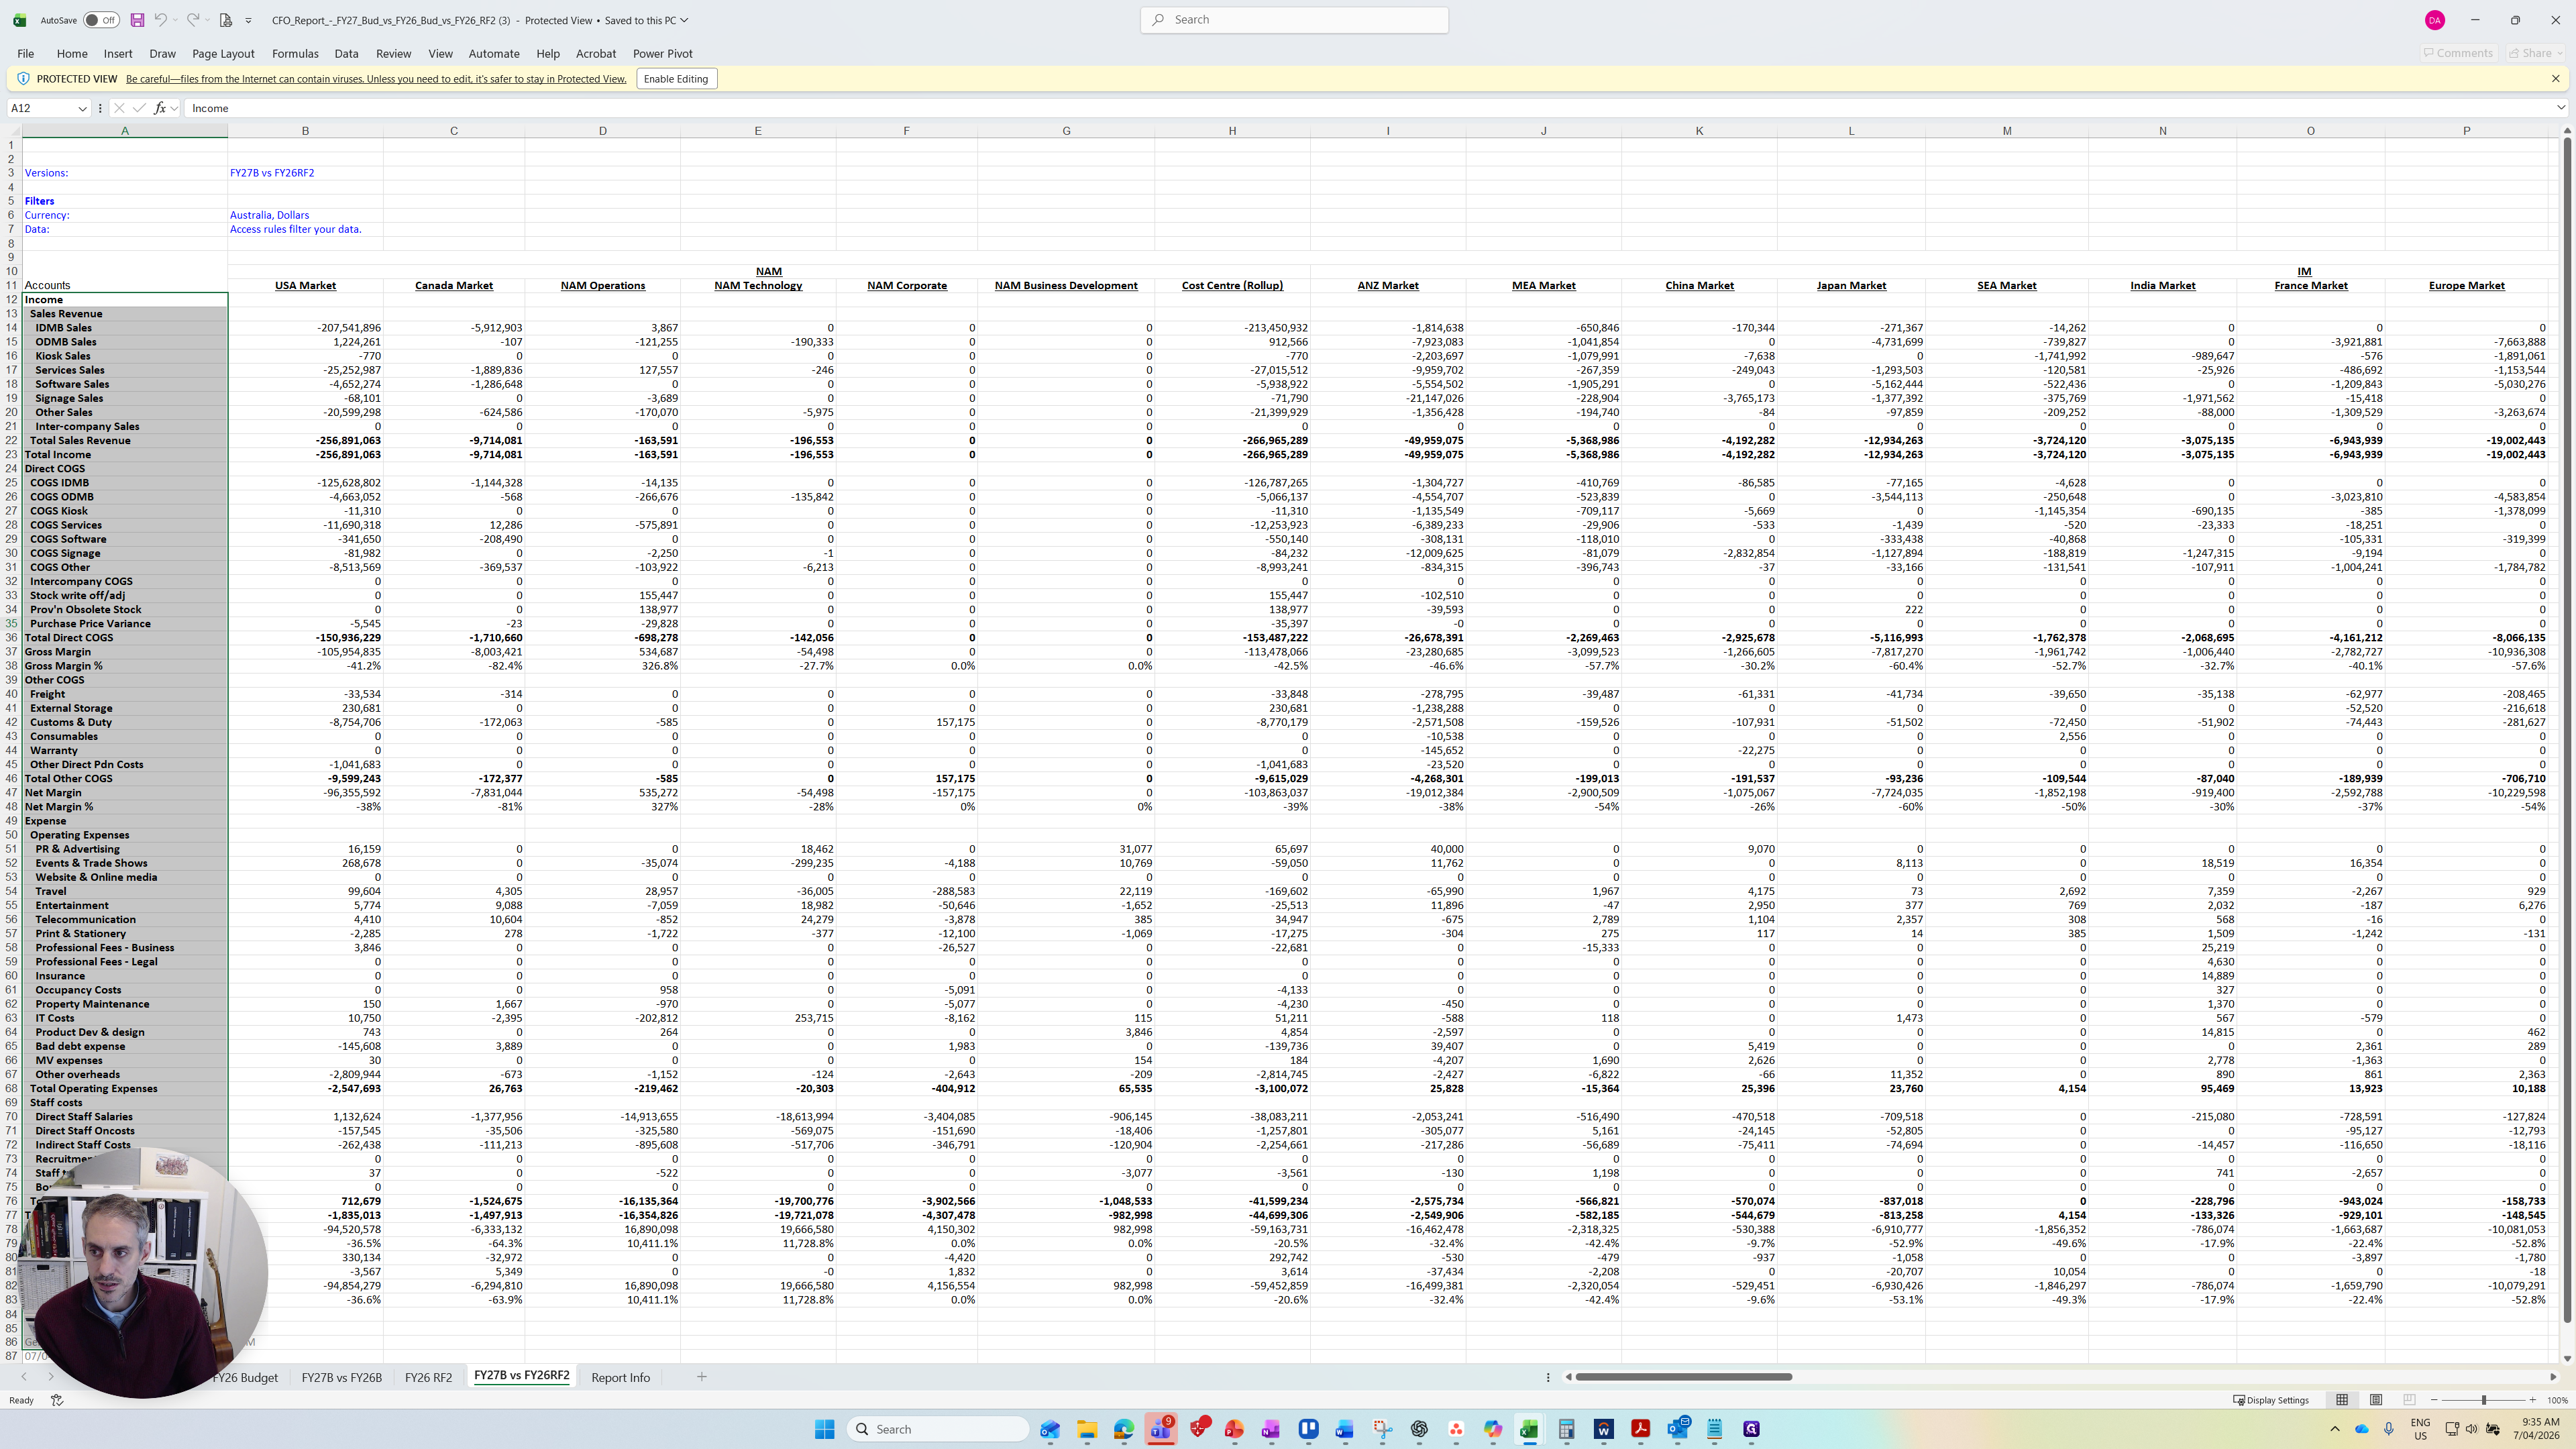
In the bottom corner, you can see different tabs for the FY27 Budget, FY26 Budget, the variance between them, and the Reforecast Two prepared in January, along with its variance.
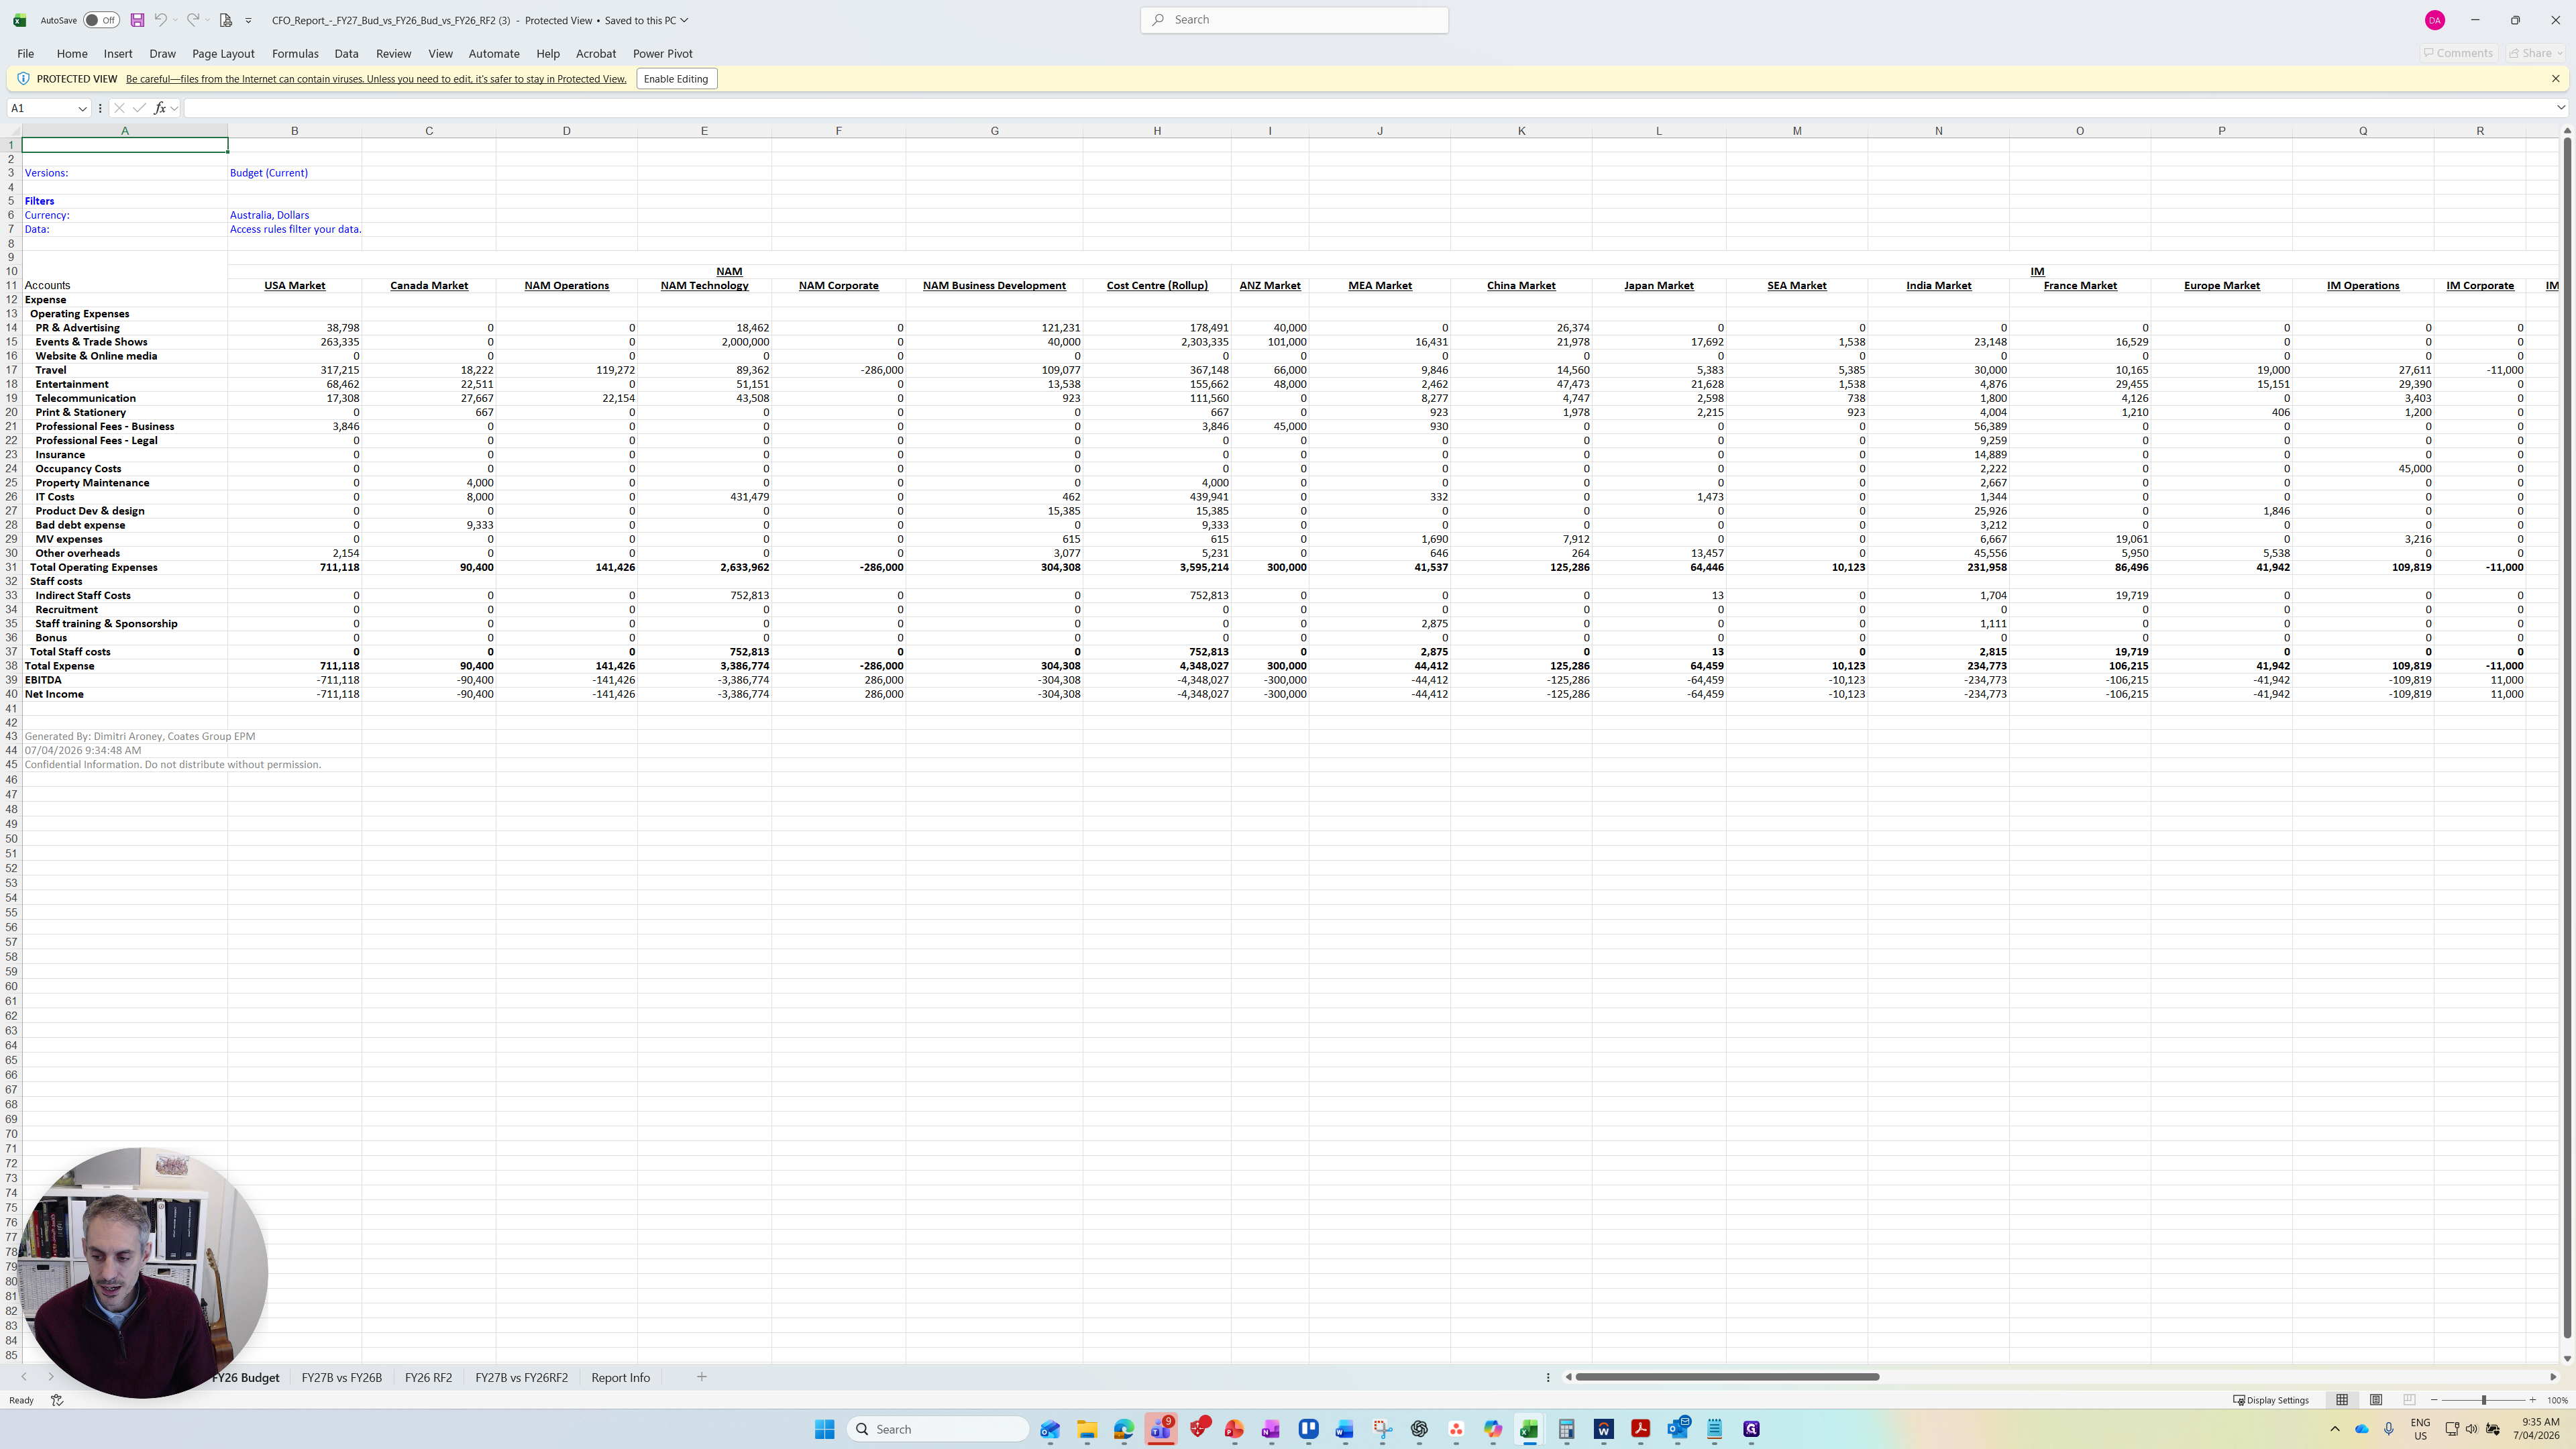
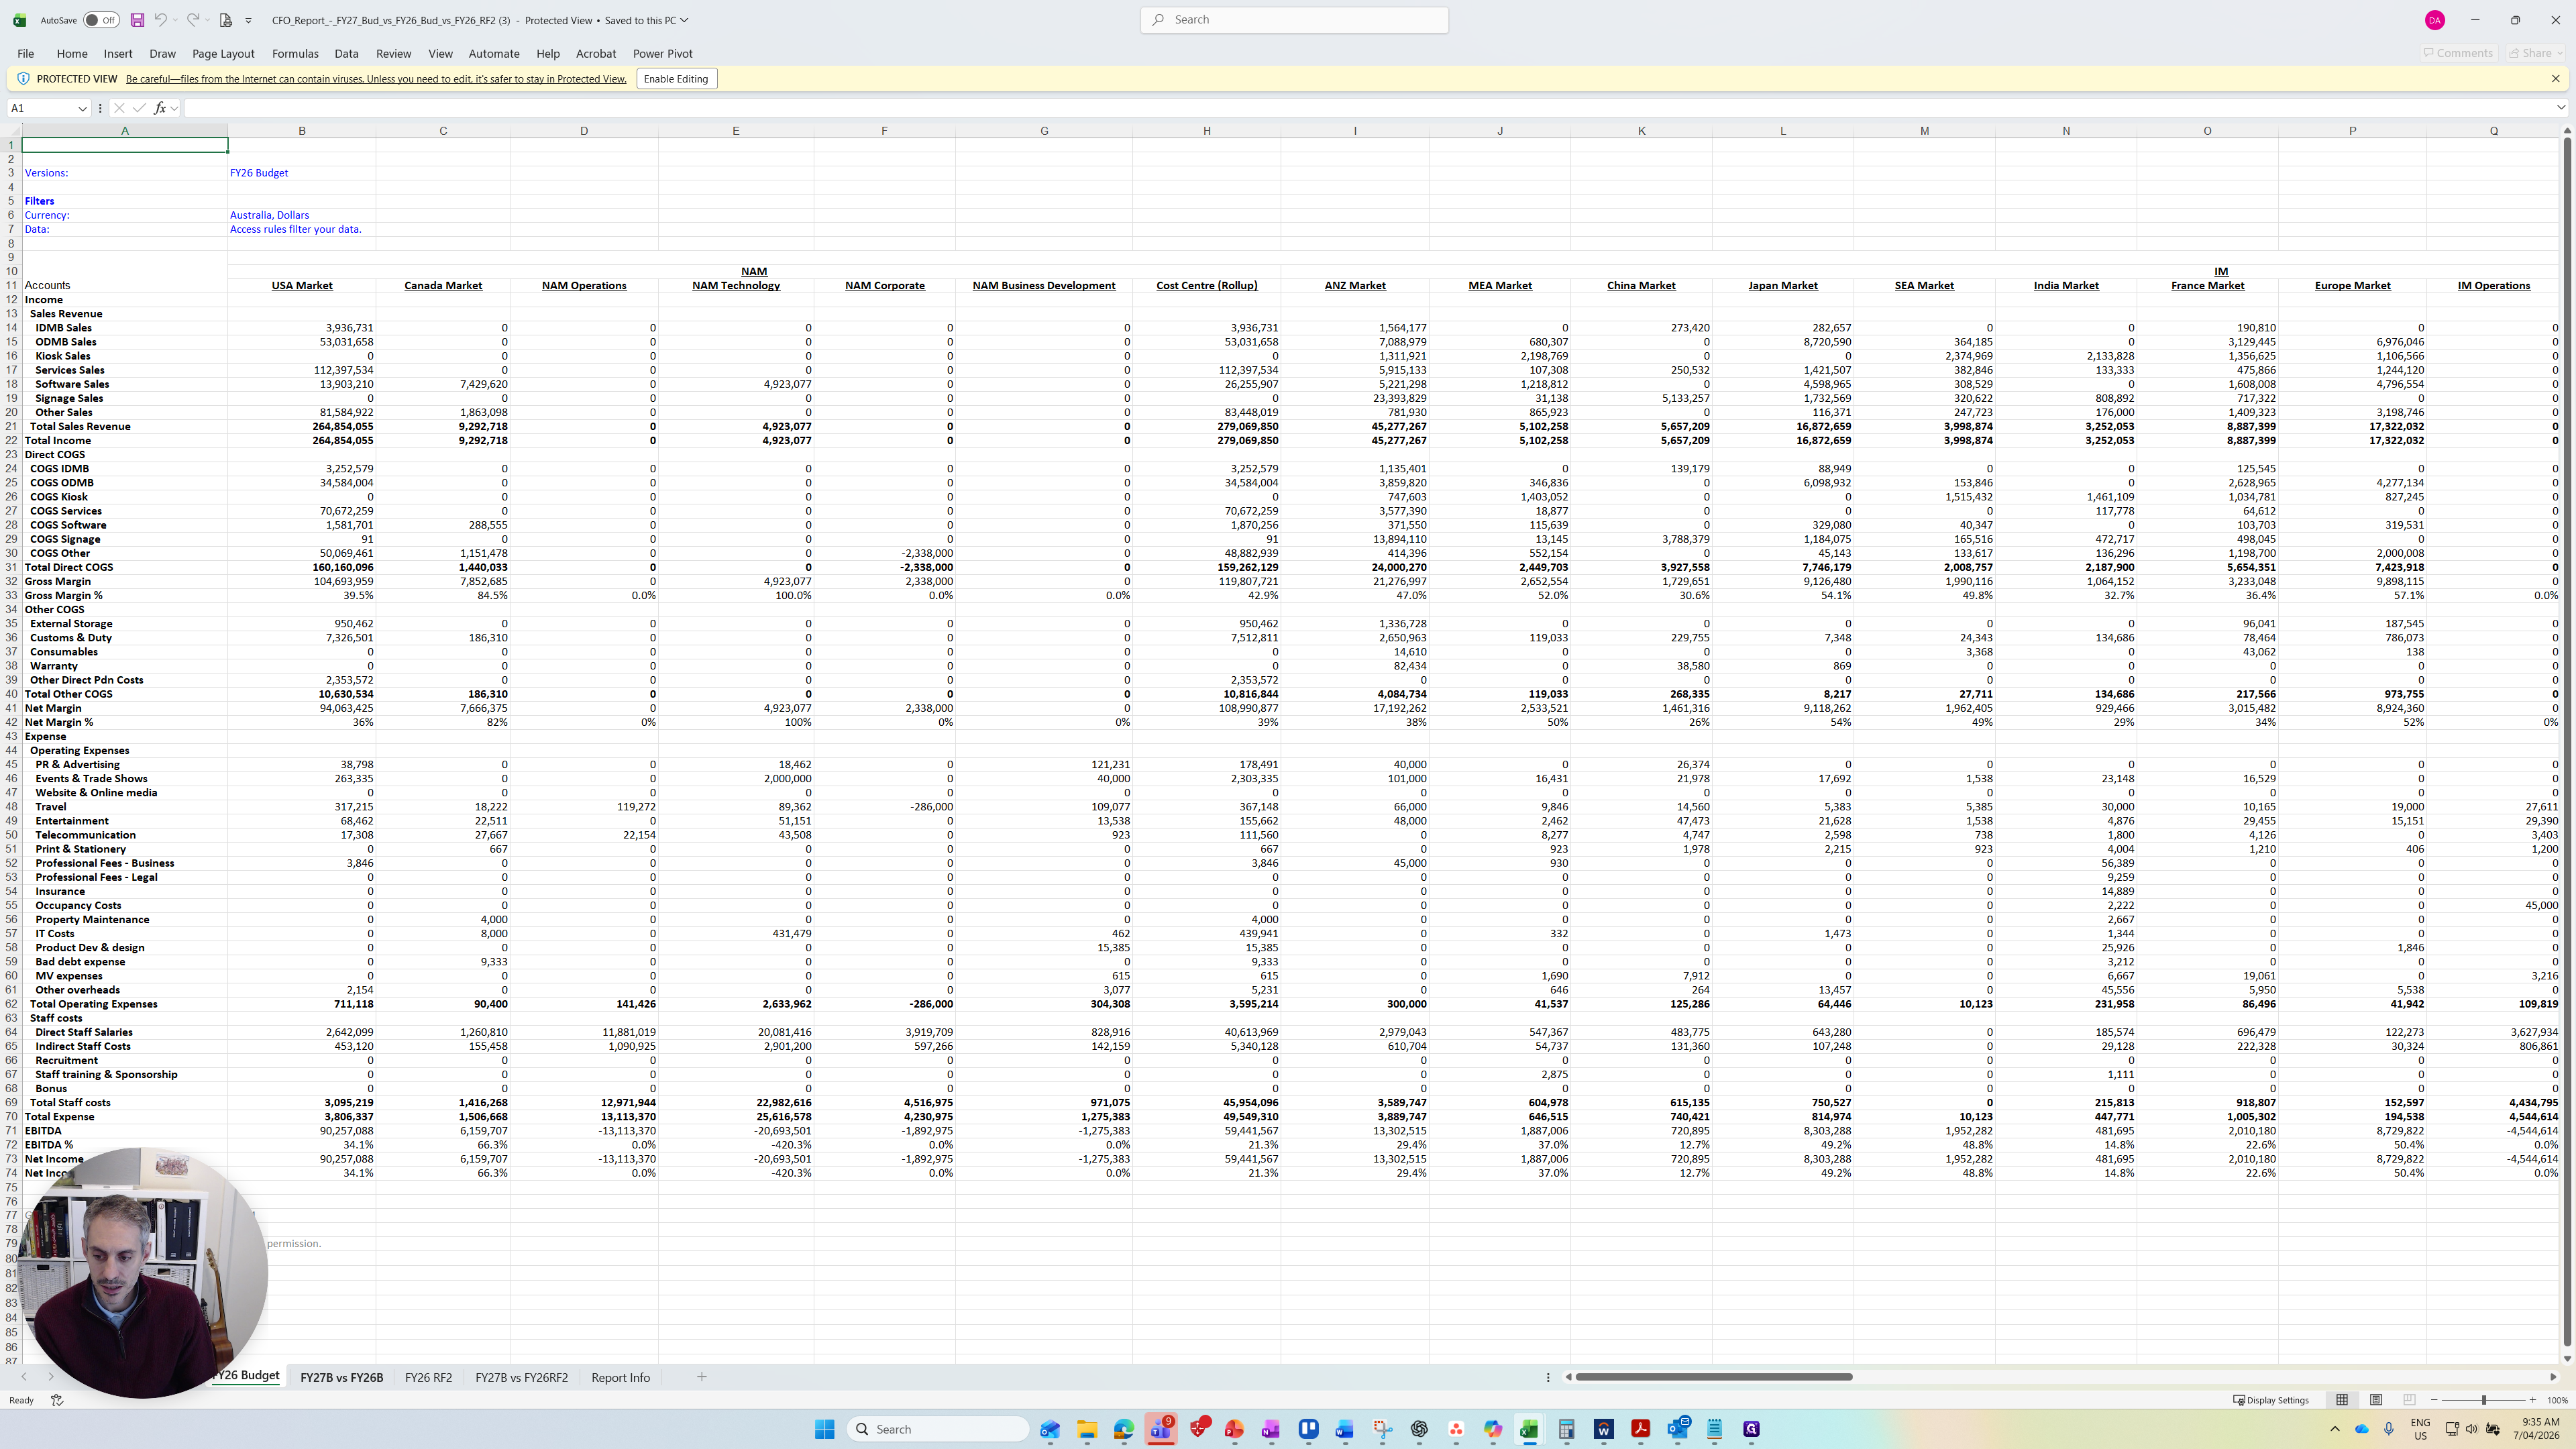
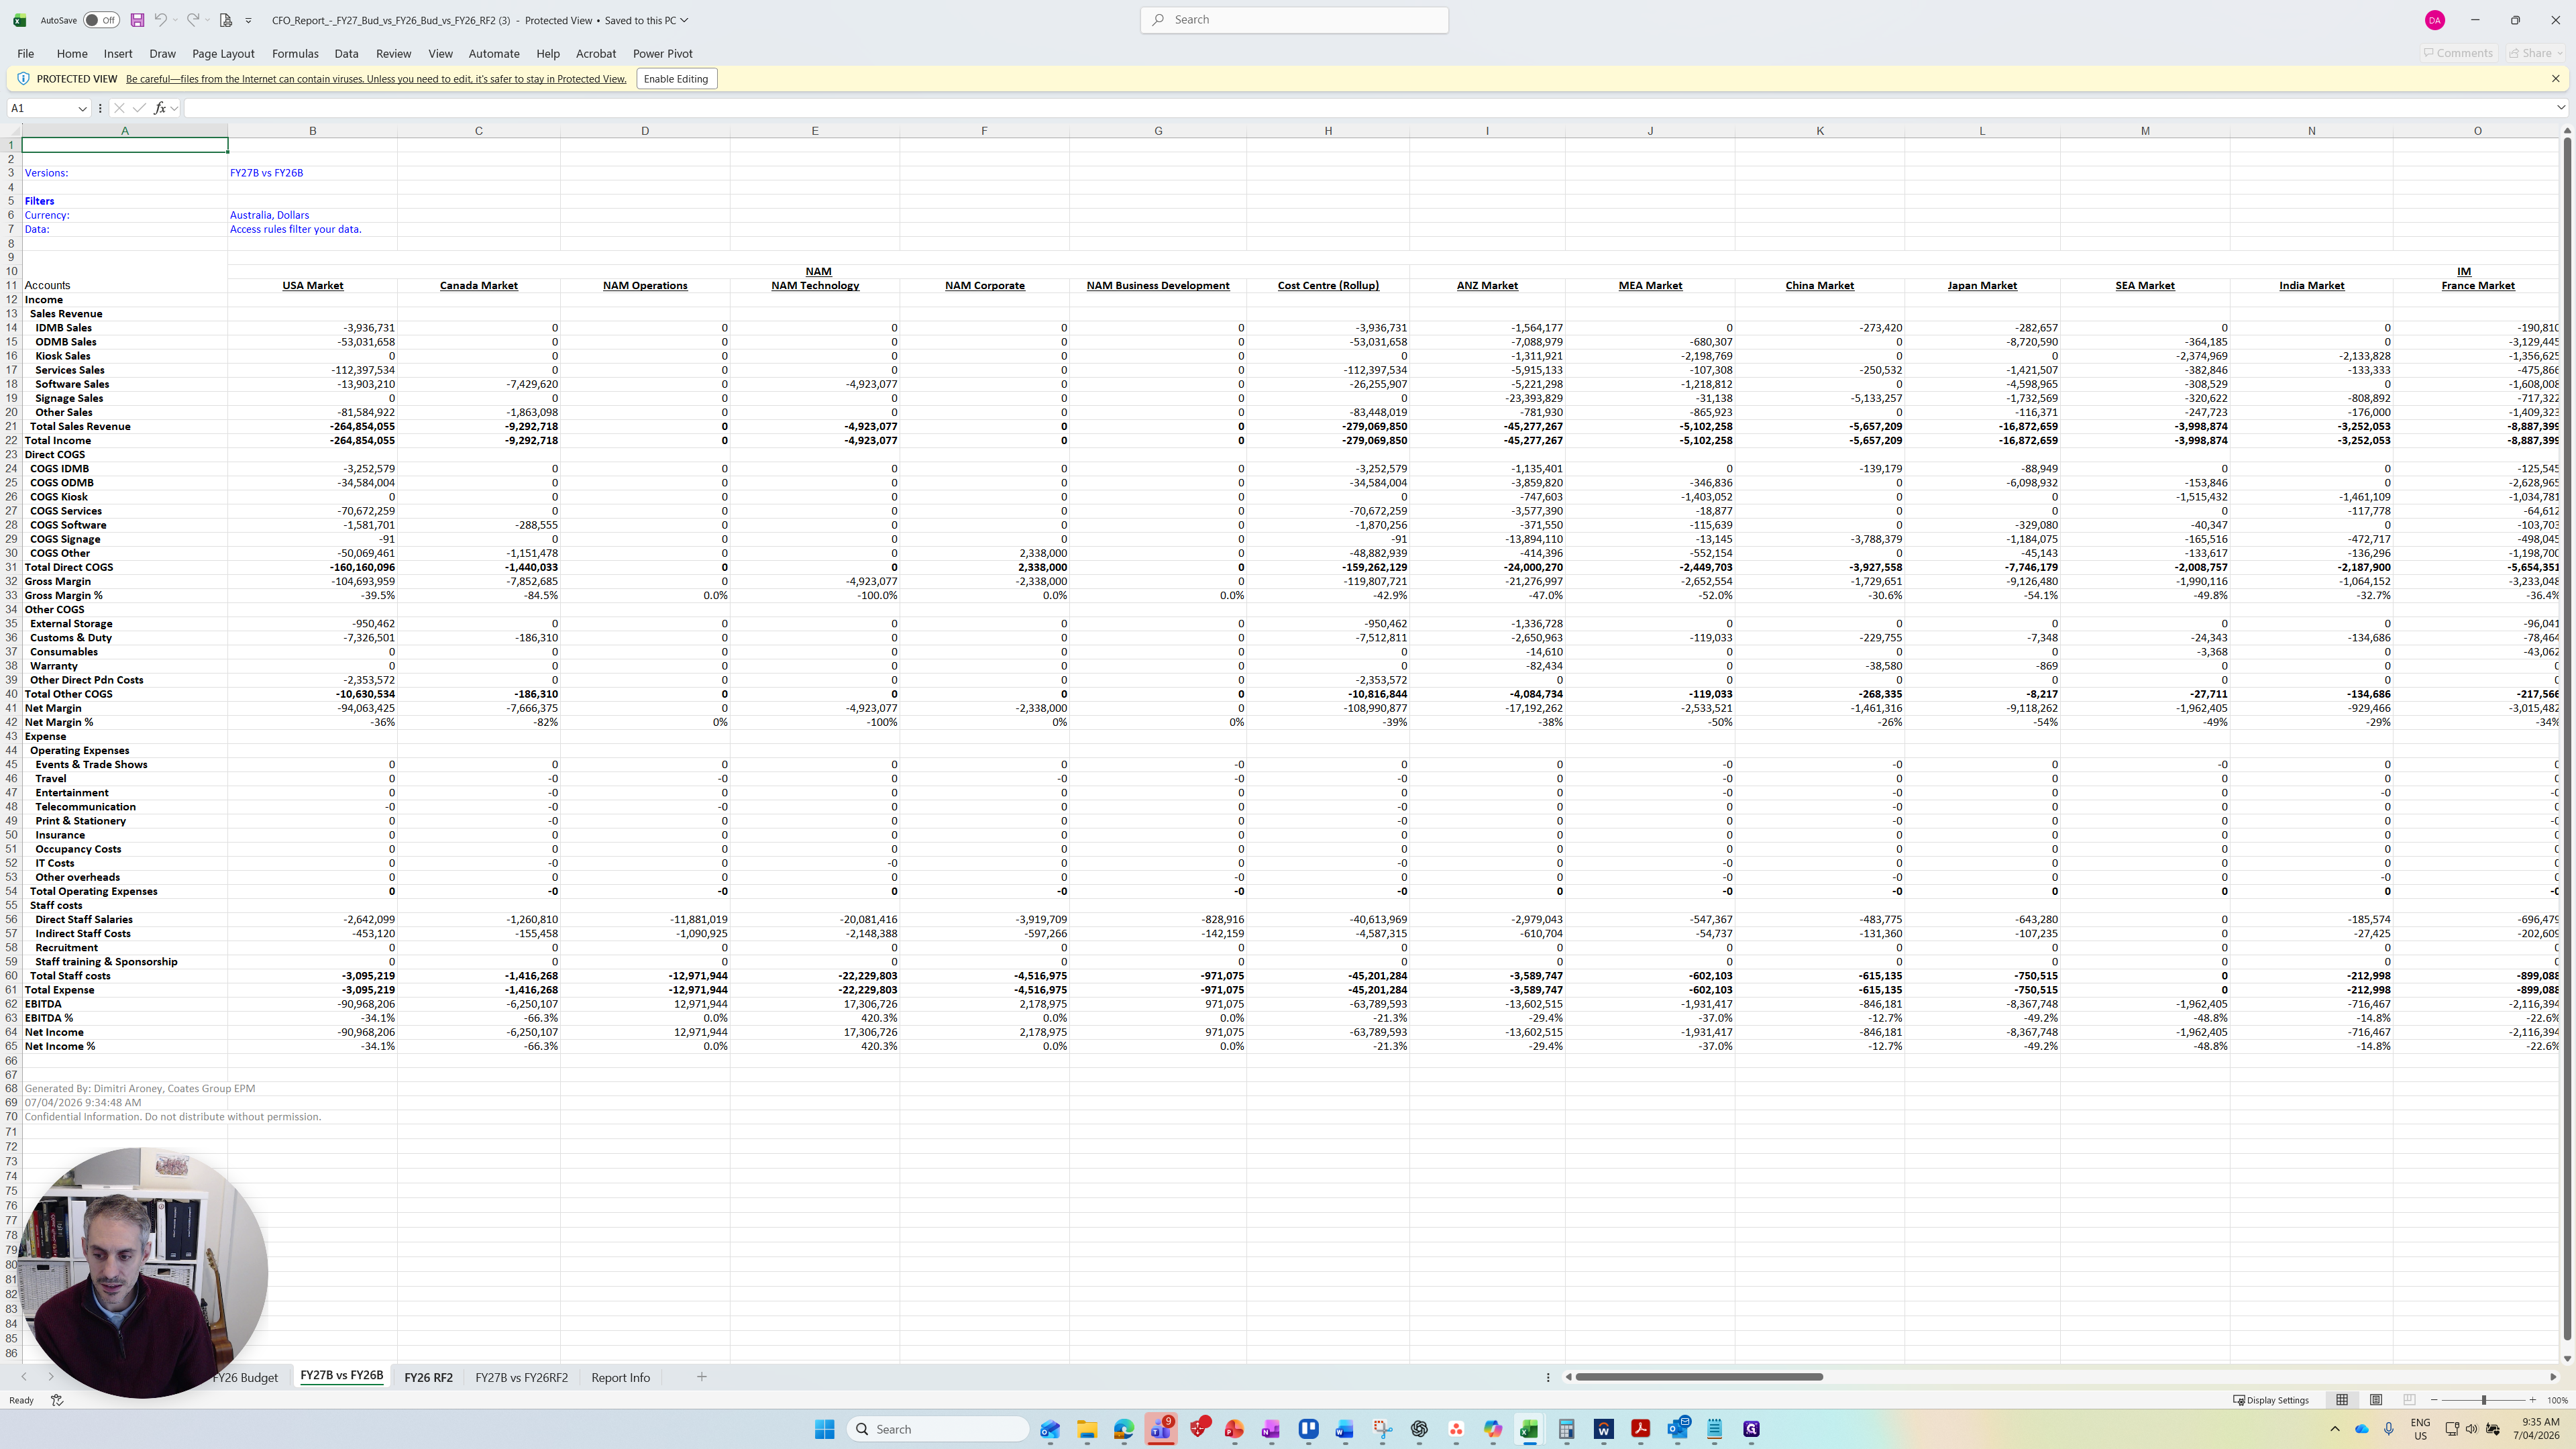
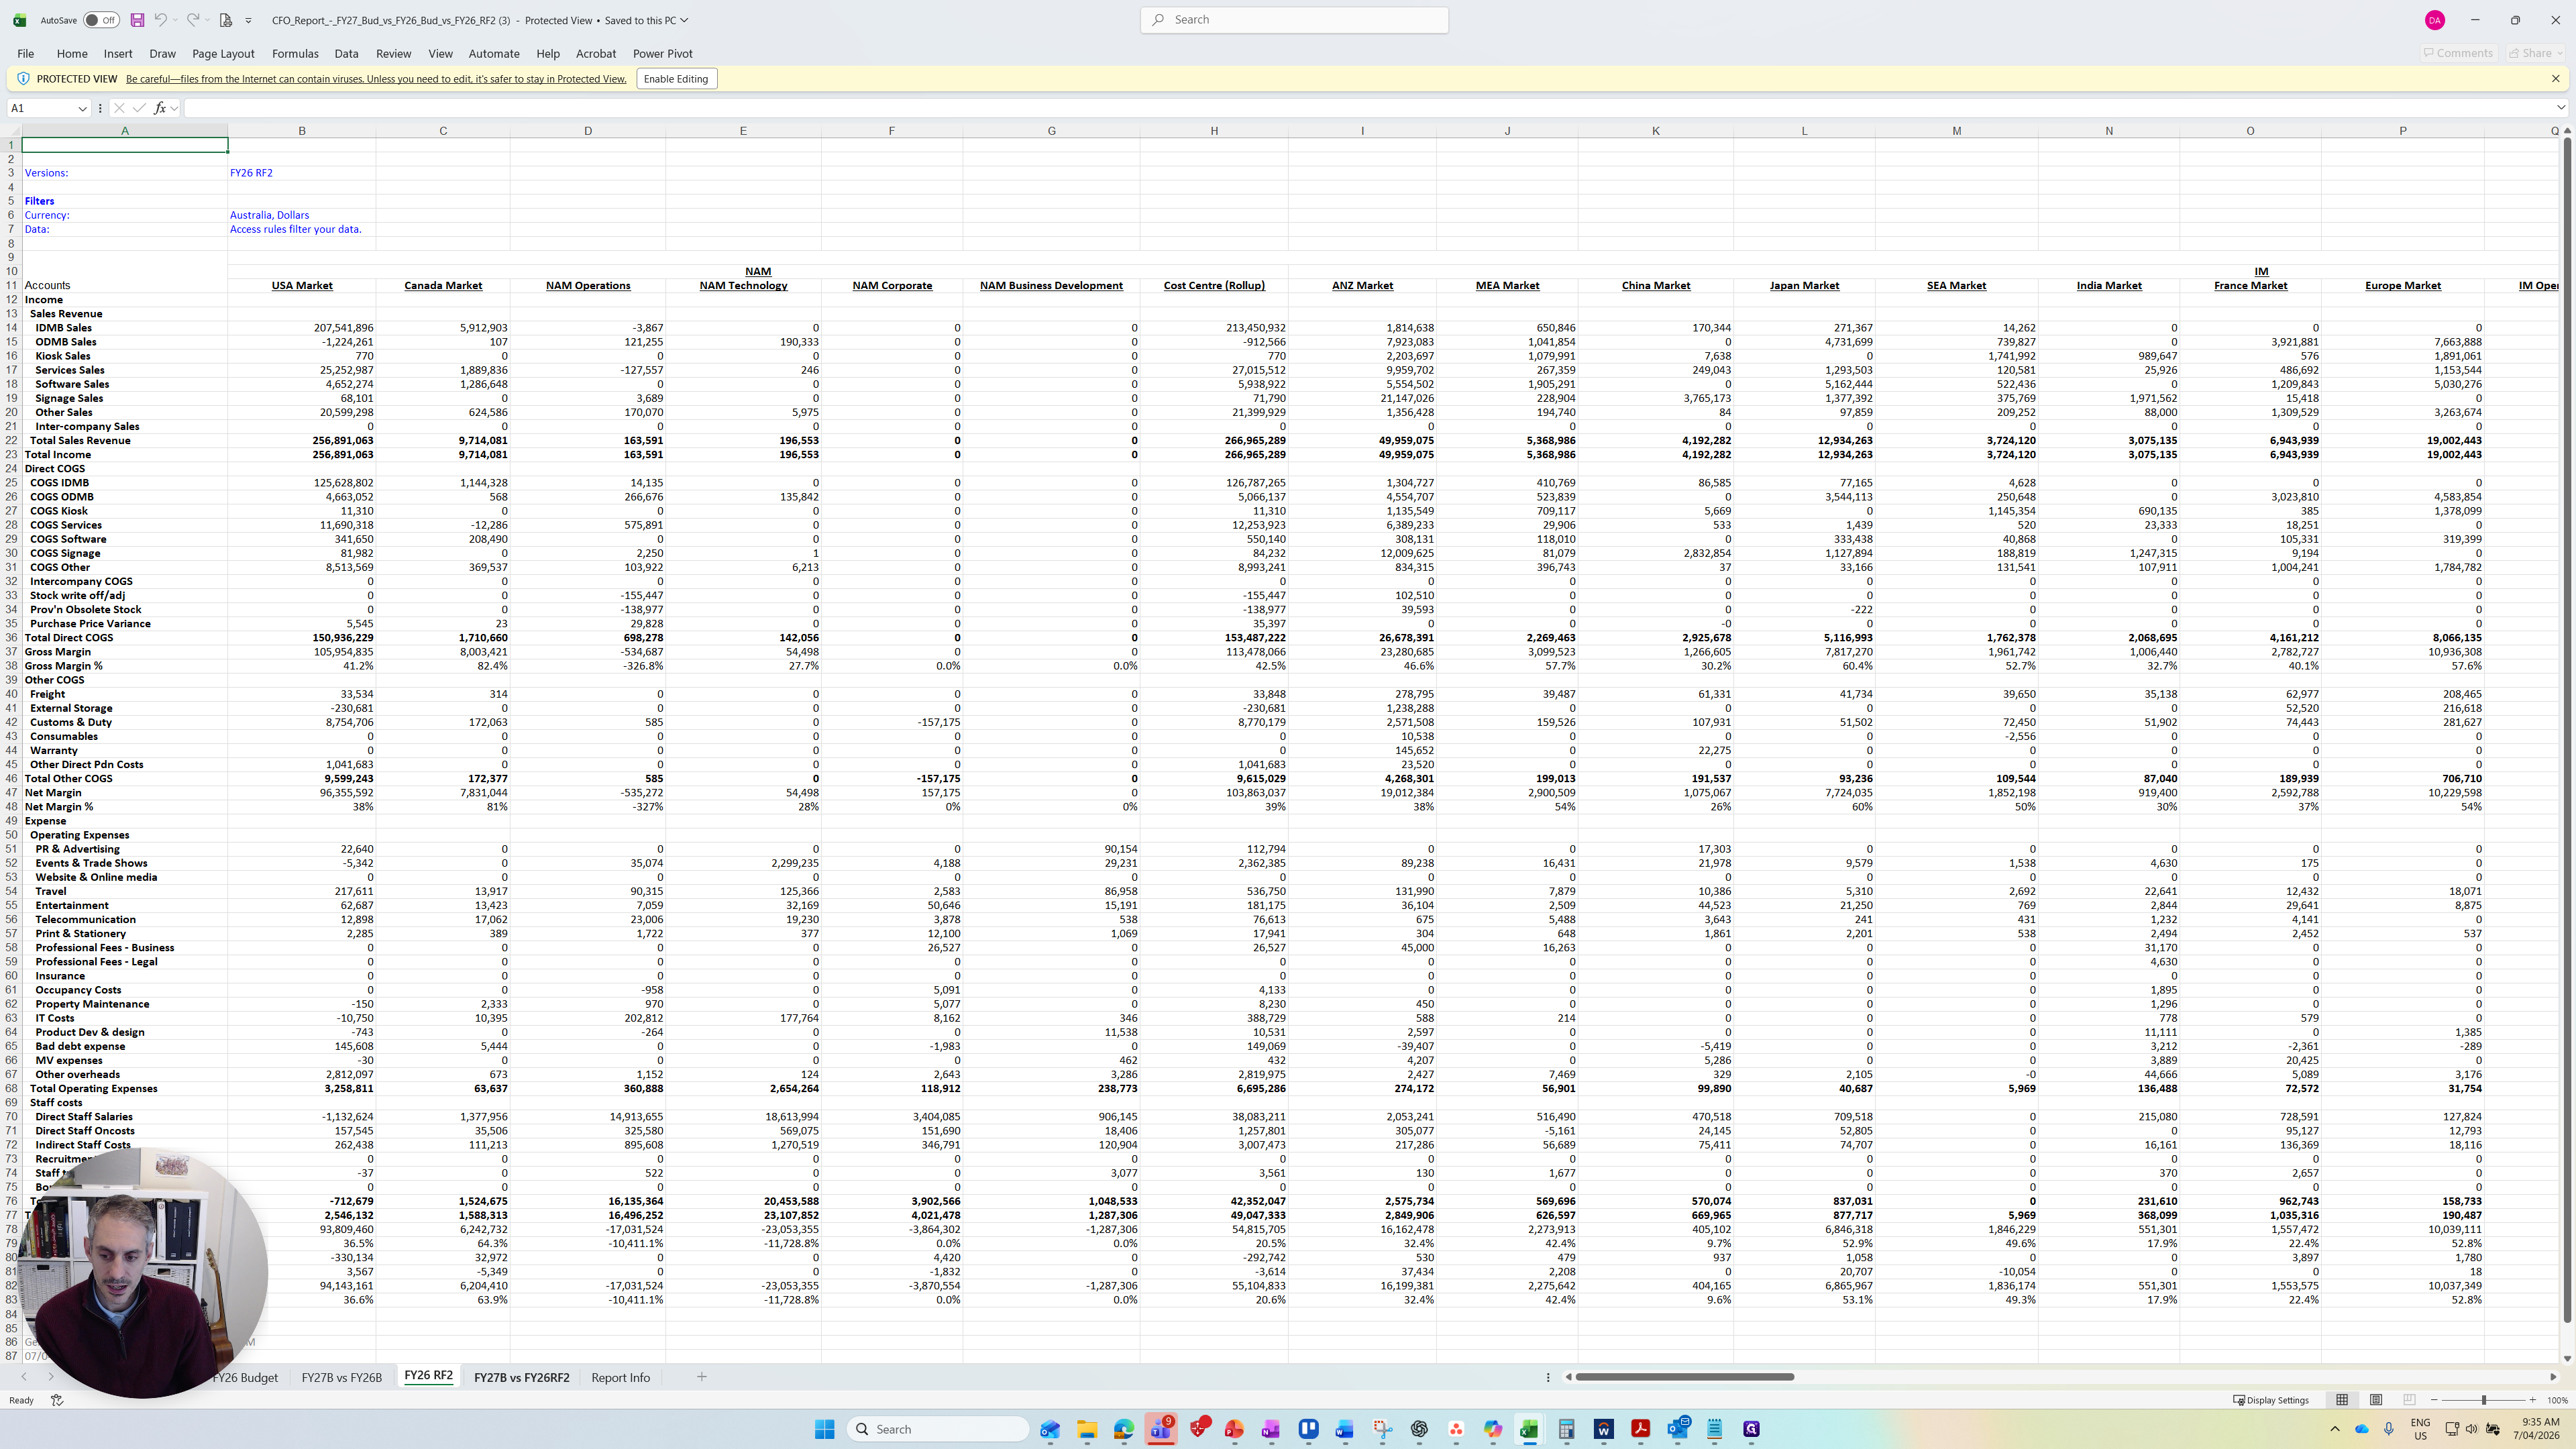
We have the same setup as the CFO report regarding the rows and types of accounts we are capturing. The layout of the segments and cost centers is also consistent.
The final report I want to show is the monthly P&L.