
How to Access the Genie Dashboard and Monitor Completed Assessments
Learn how to access the Genie dashboard, monitor your completed assessments, filter by date and assessor, and export performance data. Step-by-step guide for assessors using Genie.
In this guide, we'll learn how to access the Genie dashboard and monitor the assessments you have performed. You will see how to filter results by date and assessor, view performance statistics for agents, and export the data for further review.
This process helps you track your progress and ensure you meet assessment targets.
Let's get started
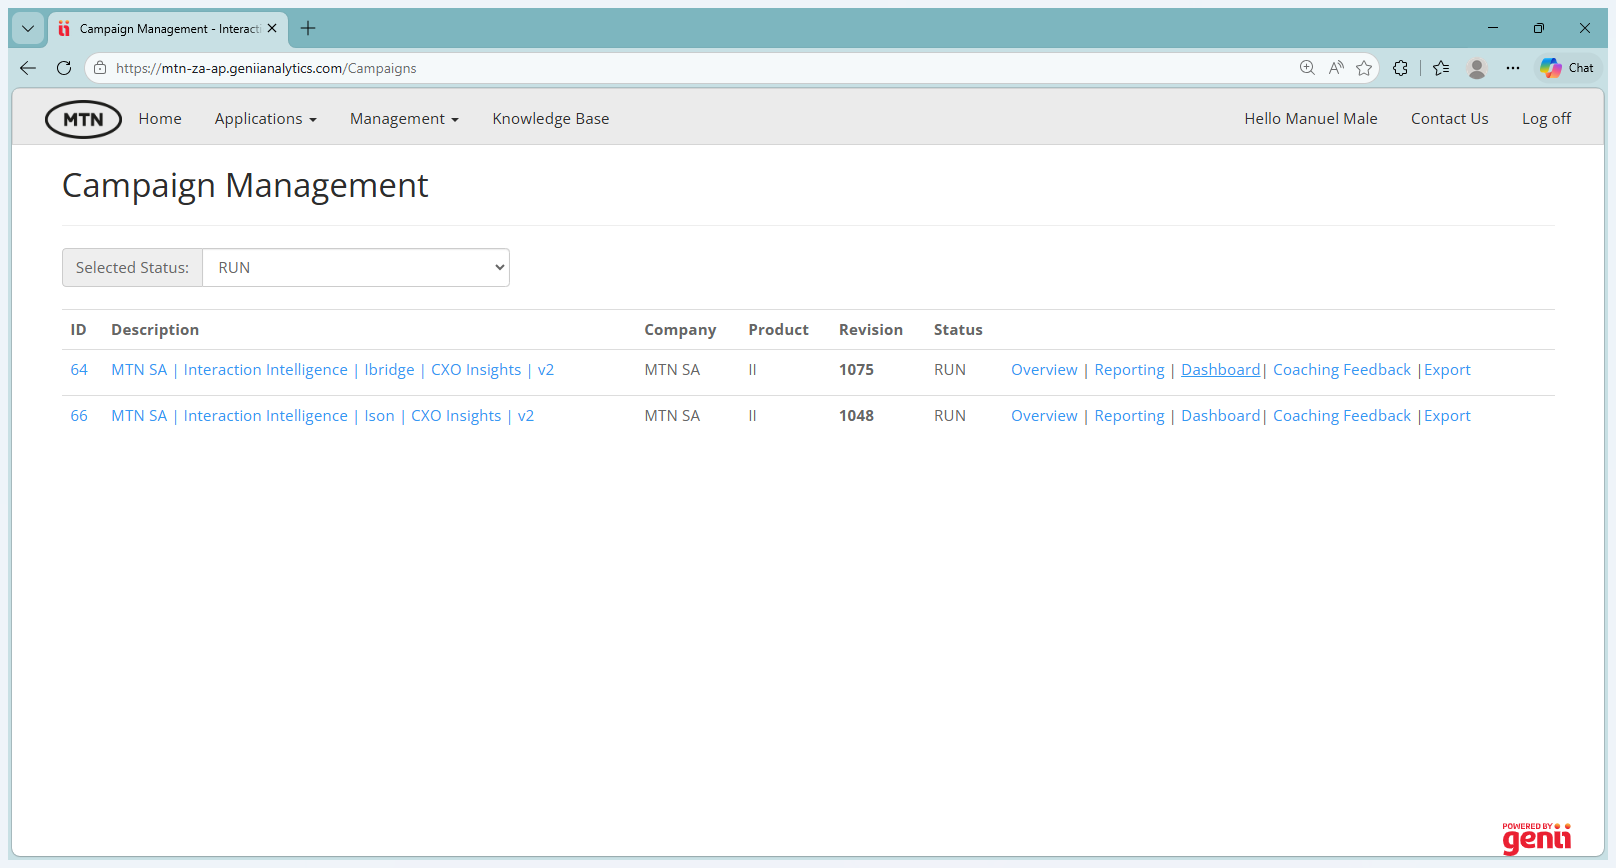
Hello, everyone. This quick guide shows you how to access the dashboard and monitor your completed assessments. After logging into Genie, you will see your home screen. First, click on your Management tab. It will open Campaigns Management.
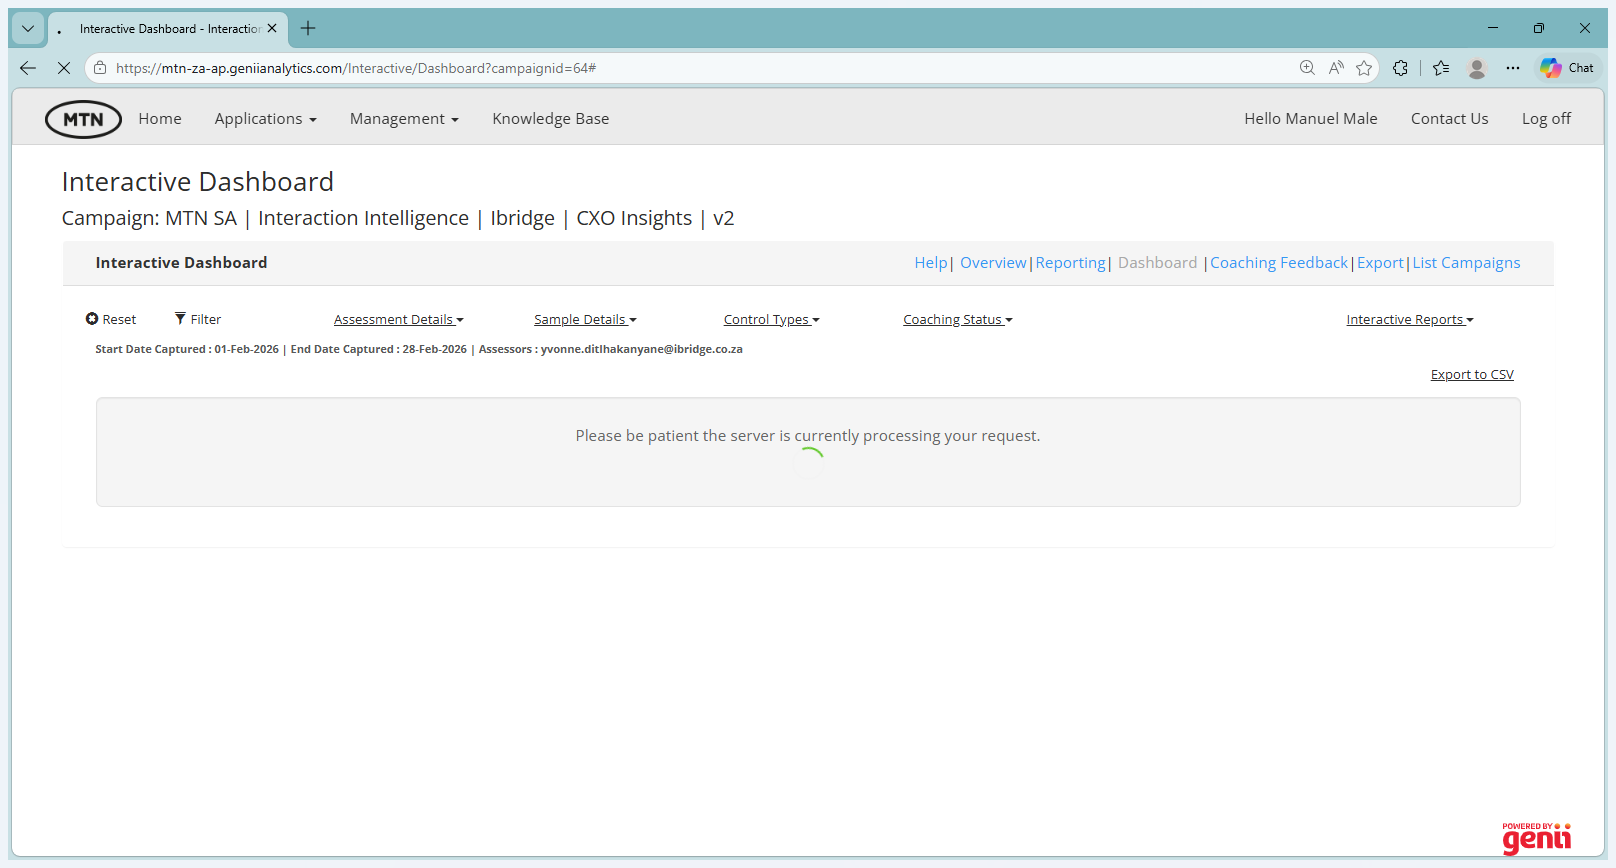
Once you select that, it will take you to the two campaigns currently available on Genie. One is for iBridge and the other is for iSign. We are interested in the iBridge one. Once you are on this screen, select Dashboard.
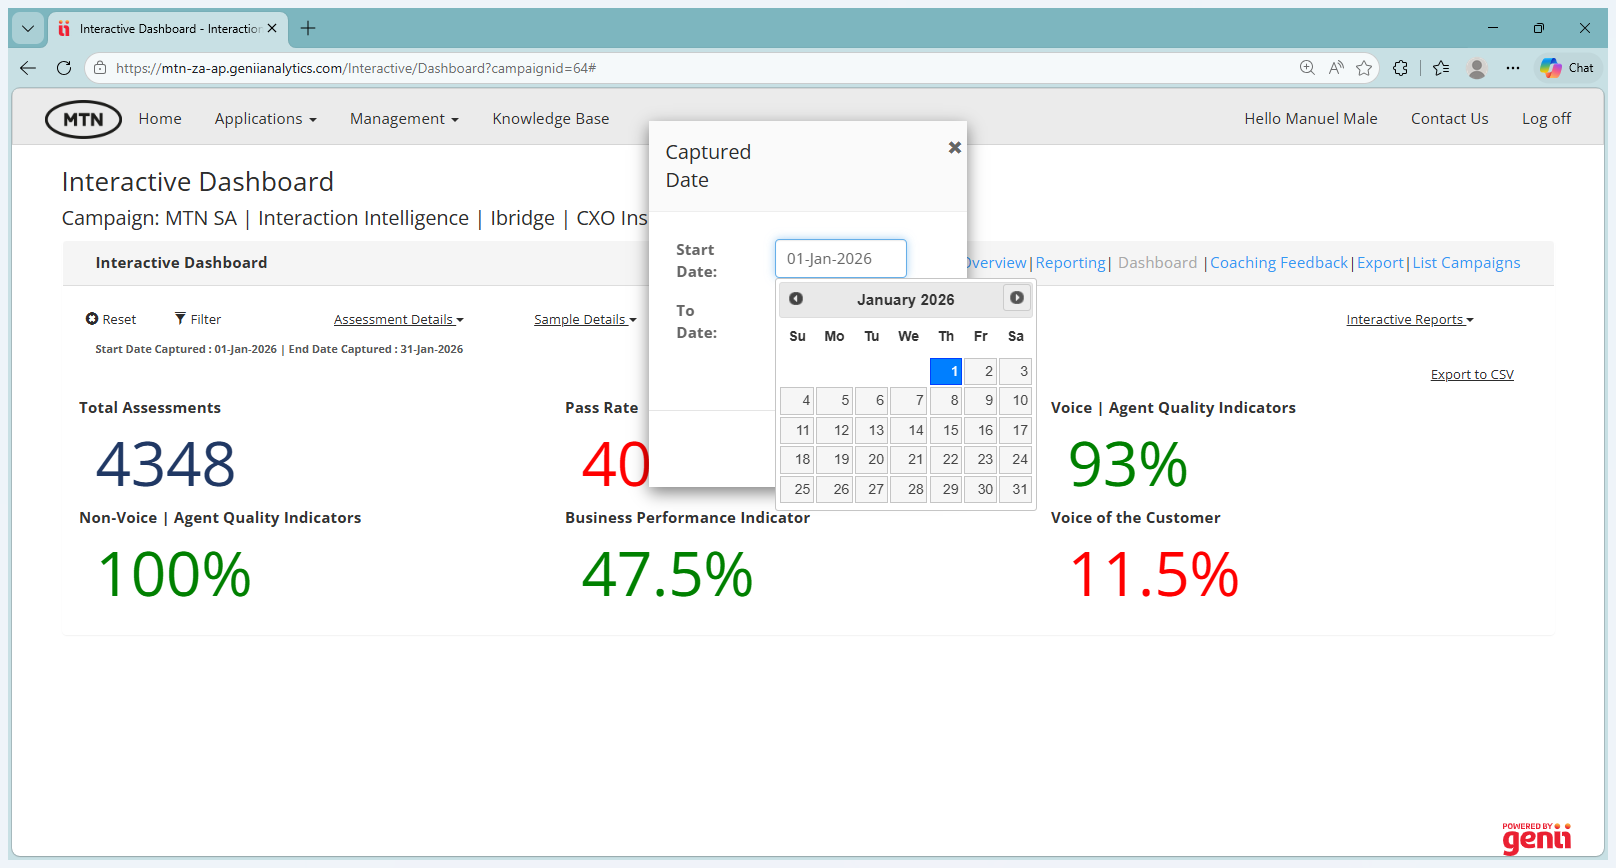
Genie is sometimes slow. It may take a few seconds. Just give it some time. This screen provides an overview of the statistics, showing how many evaluations have been performed and the pass rate. This is taking longer than anticipated.
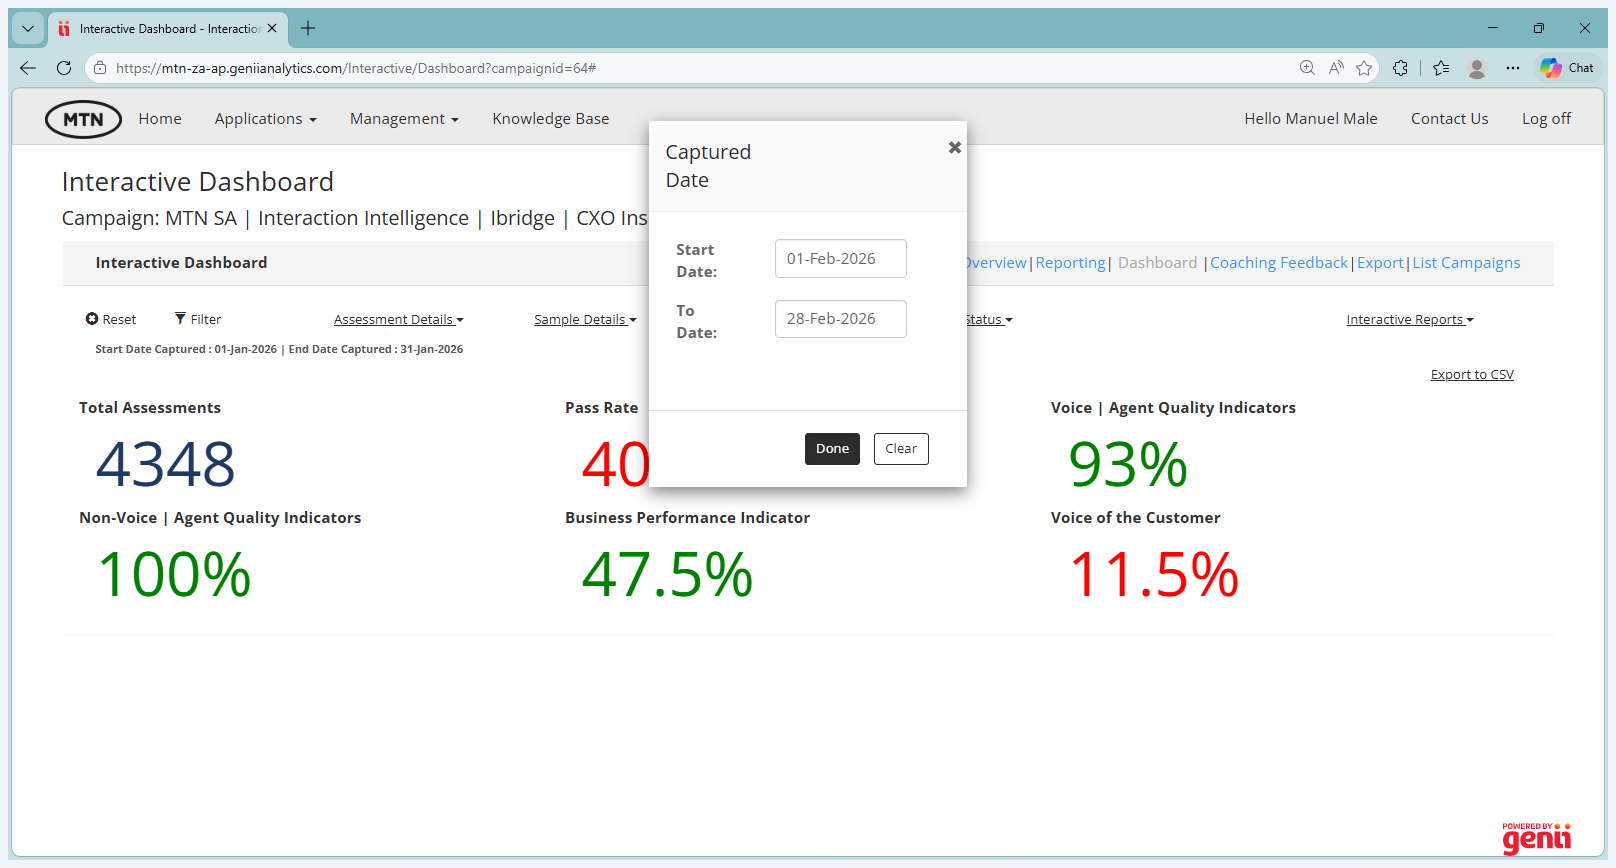
The next step is to filter for the date range you want to monitor.

Let's take, in this case, from the first of February until the end of February.
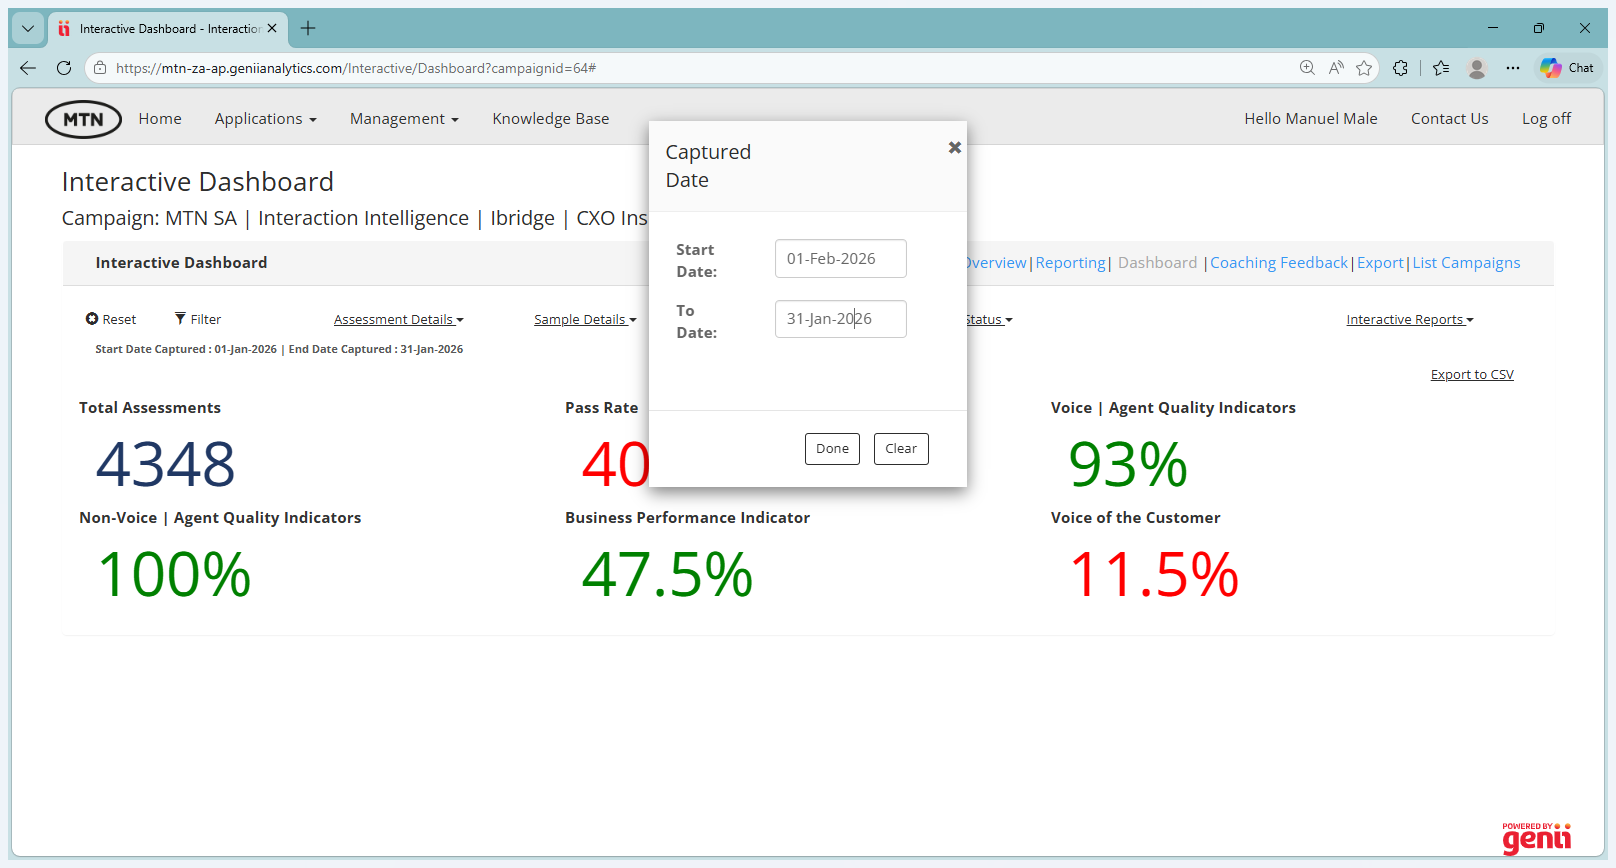
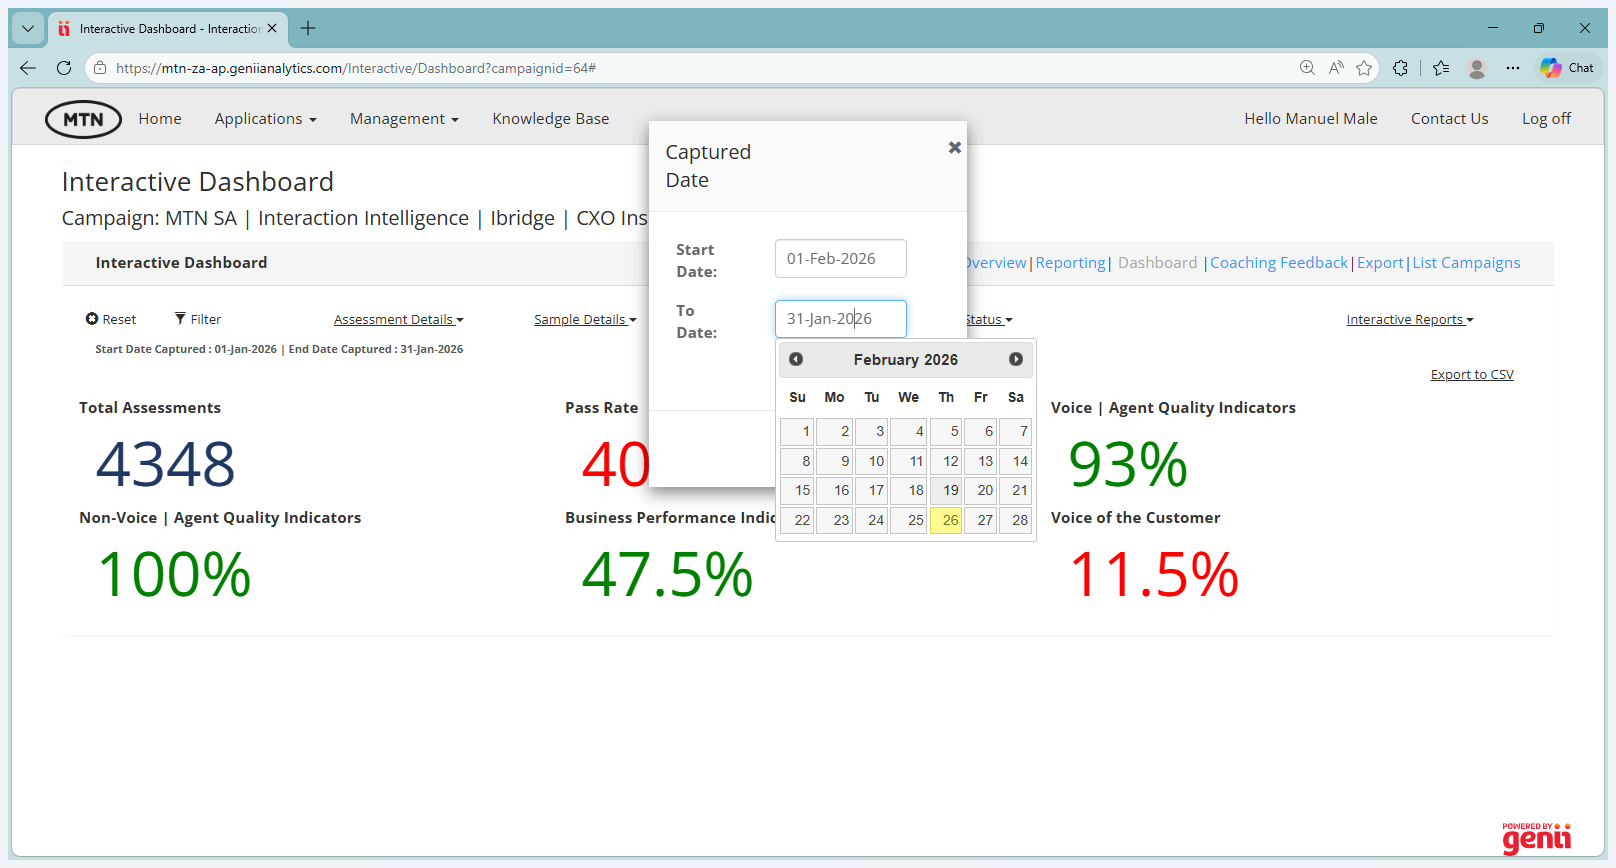
Today is the 26th, but if you keep it up until the end of the month, all the evaluations will be captured live.

Once you select your date, as an assessor, the next step is to filter out your name in the assessment details tab. Then you go to the assessors. Here's an example.
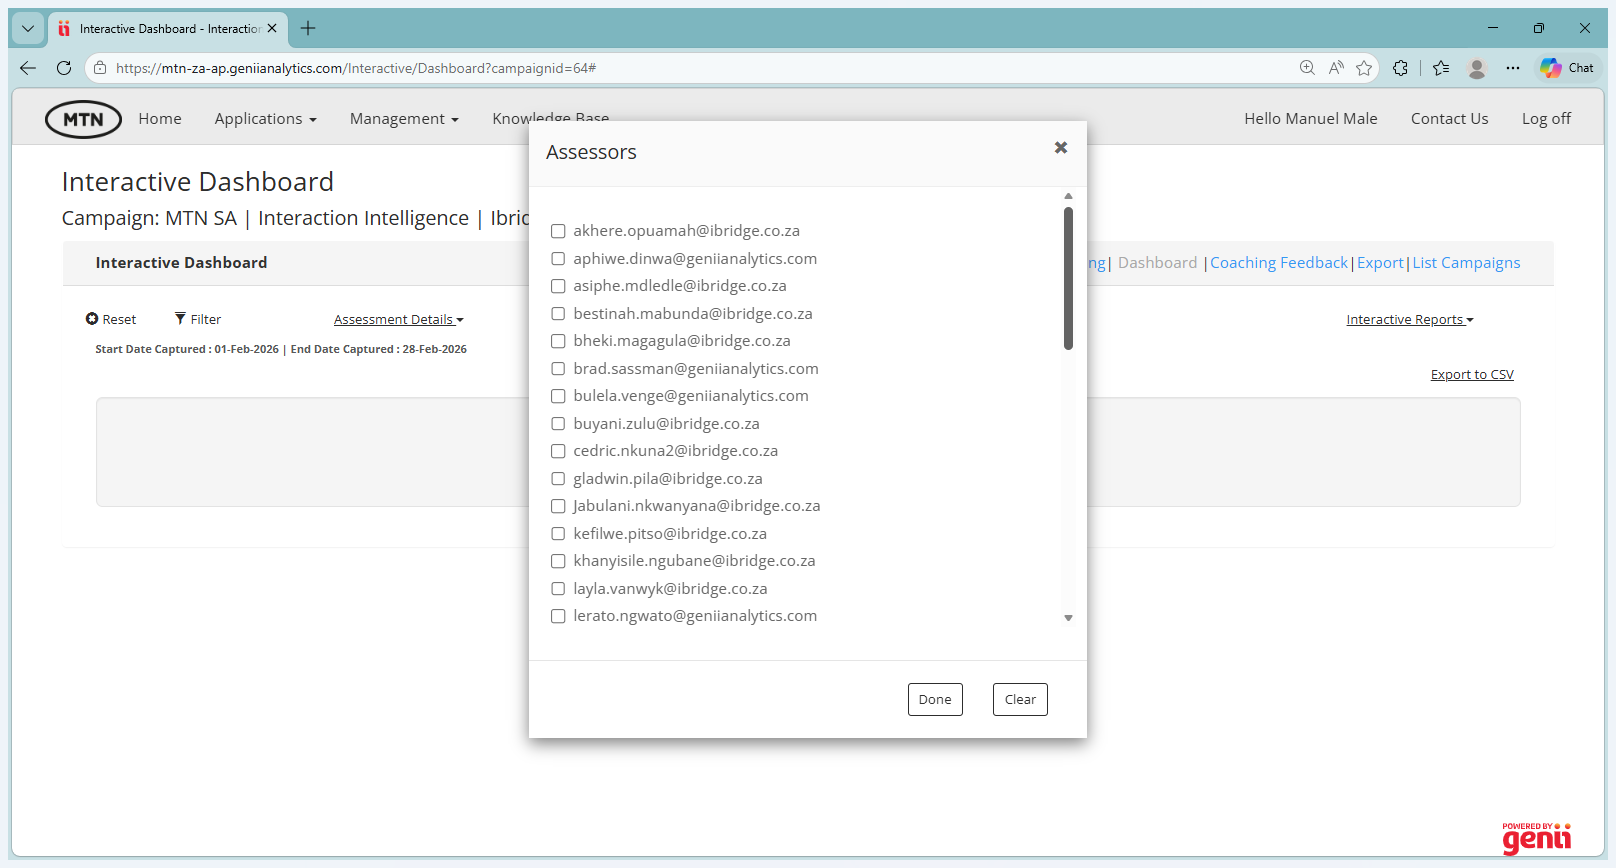
Select Ivy's name.
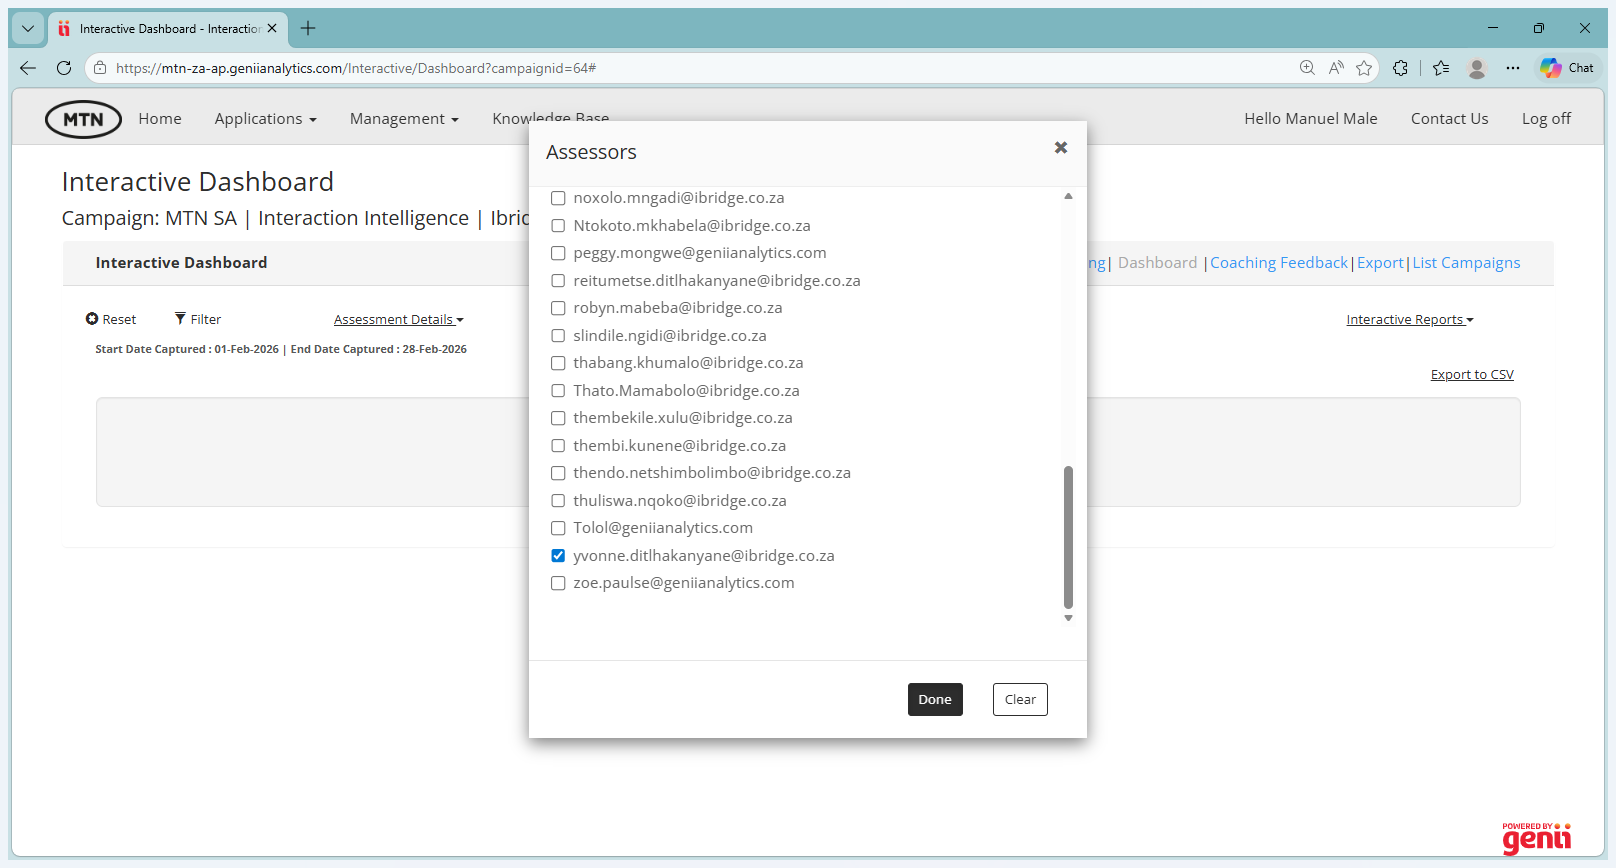
This should filter out only the work assessed by Ivy. Next, go to Interactive Reports and select Performance Tracker.
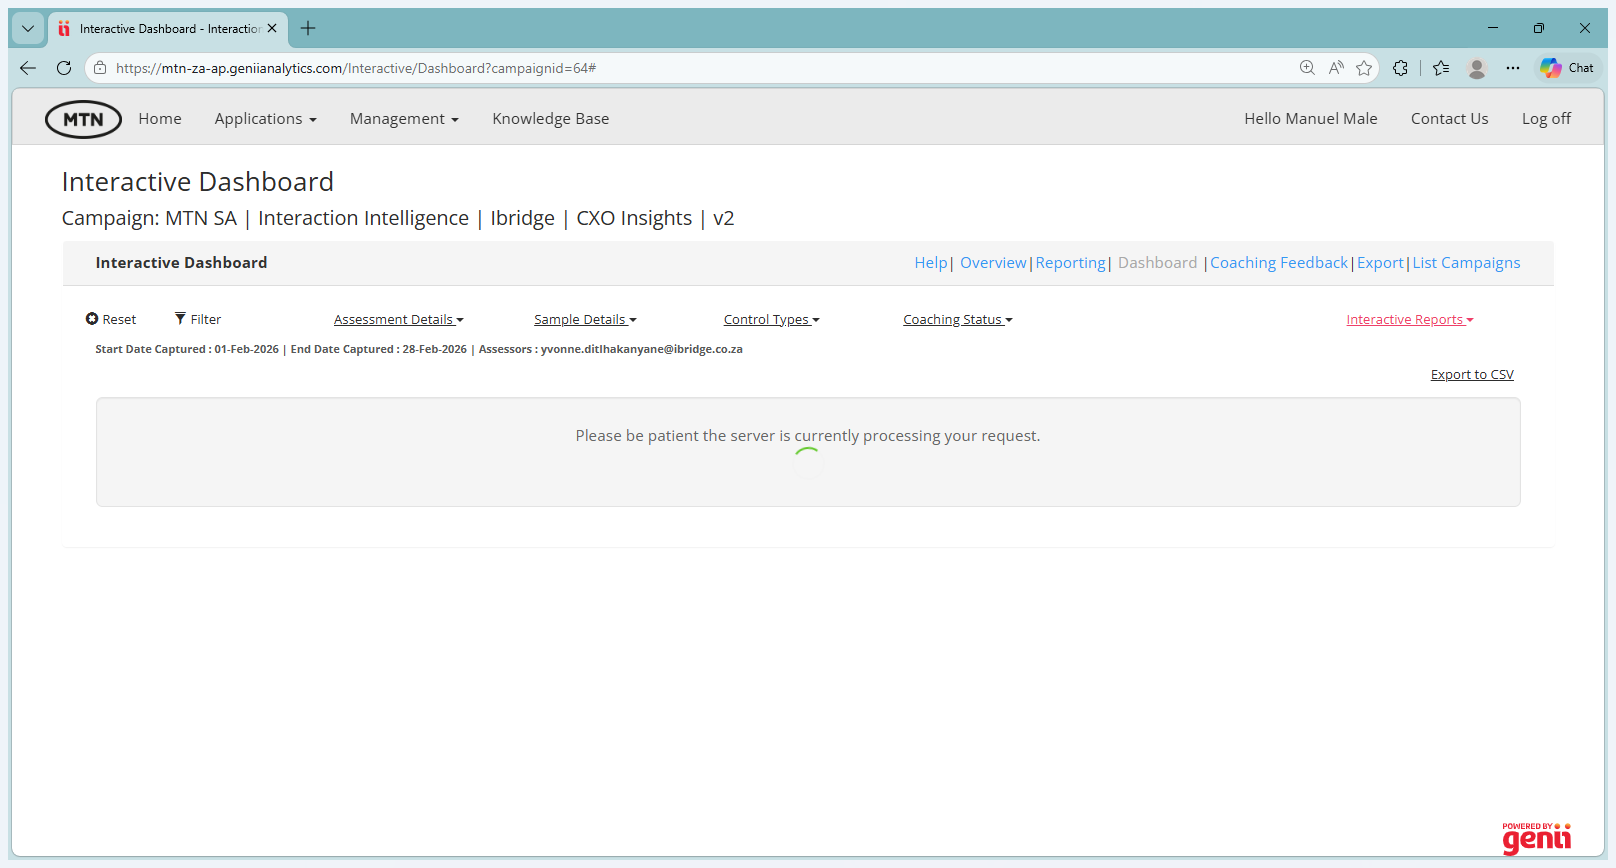
Once you select Performance Tracker, a tabular dashboard will appear showing statistics per team, per CCM, per supervisor, and per agent. You are interested in the agent view at the bottom. This view shows how many evaluations you have completed for an agent and how many are still outstanding, compared to the target of four per agent. If I'm Ivy, I know I've only completed one assessment for Amahle, Andiswa, and Anele. These are nesting agents. I have done five for Bukhosi, four for Charlotte, for Delisihle, Glory Motaung, Agnes, and Gaogelo. I now know I need to do one each to reach the target for them. For Sanele and Simphiwe, I need to do an additional four each.
That's how you can monitor. Lastly, you can export this table into Excel or CSV if you prefer viewing it in a spreadsheet. Then, go to the agent's name to perform further assessments. That's it. ""