
How to: Analyse Stock Inventory and Sales Trends in Toucan
Learn how to navigate the Toucan Sales Analytics Stock portal to filter stock tables, view detailed order patterns, and export product trends.
Introduction
The Stock portal is used to analyse current product inventory and historical sales performance. Primarily used by sales leadership, you can filter stock tables, view detailed product trends, and export your findings for external reporting. It is one of the core hubs within Toucan Sales Analytics and is driven by your ERP data.
Filter and Customize the Stock Table
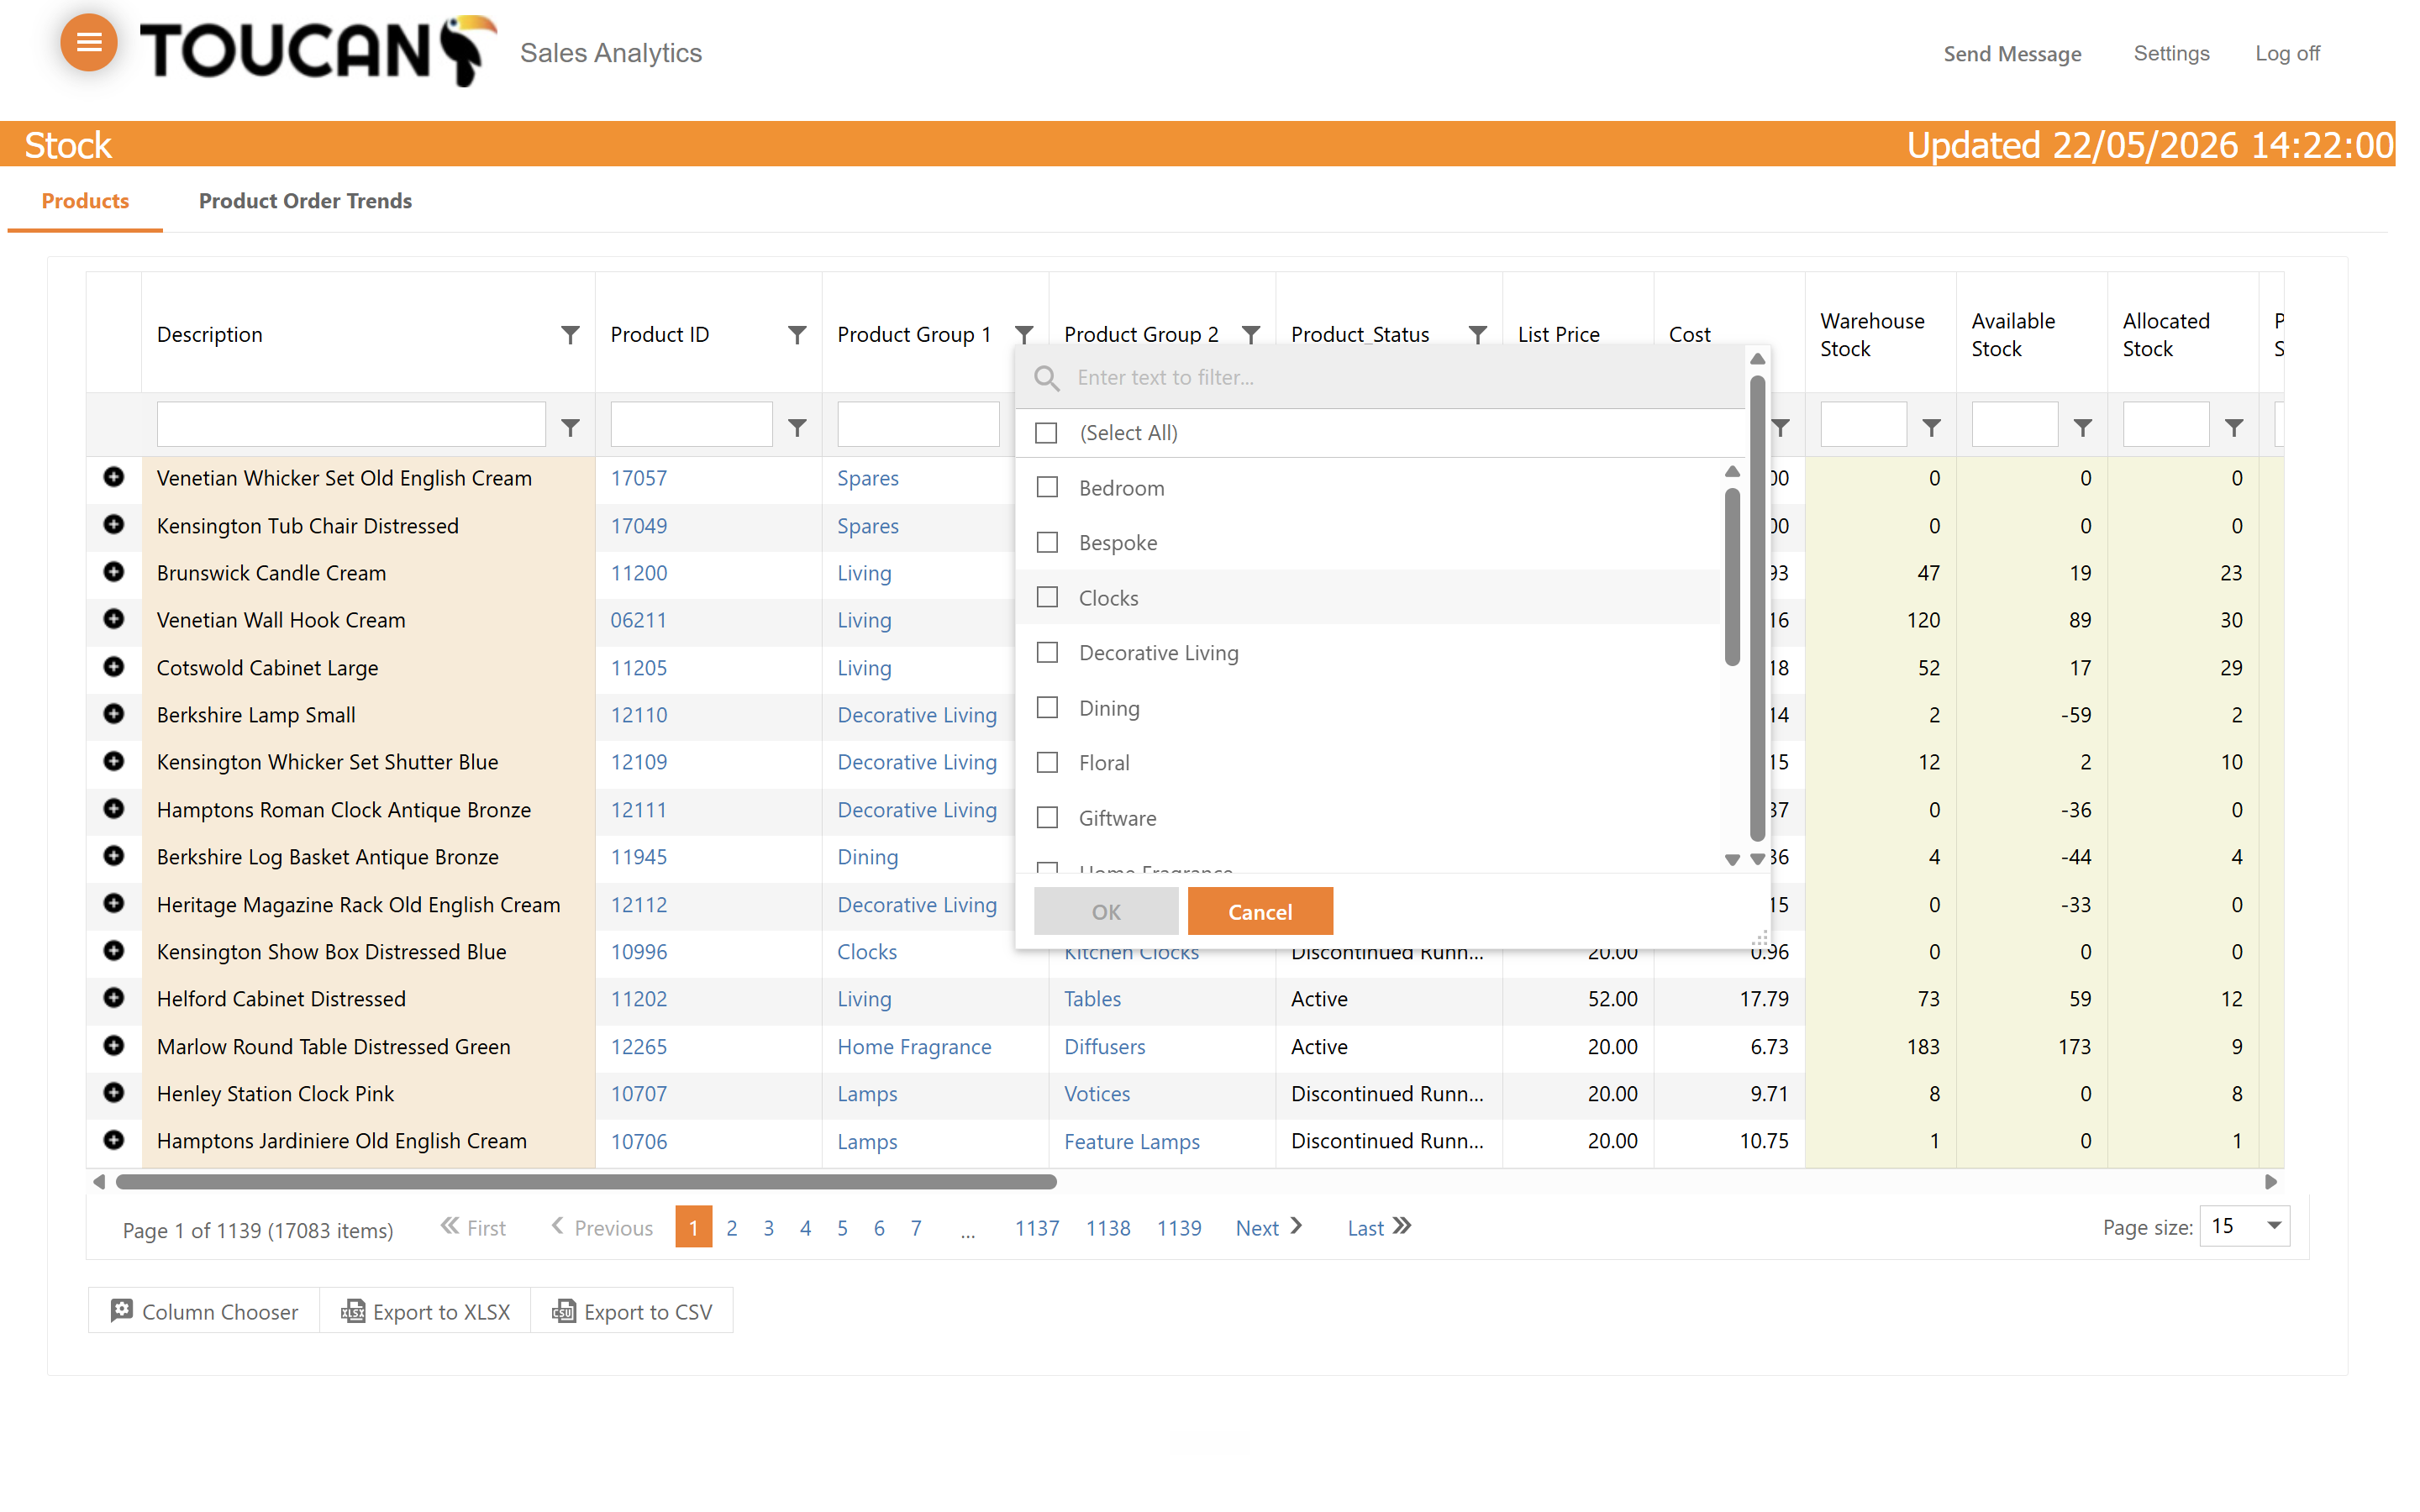
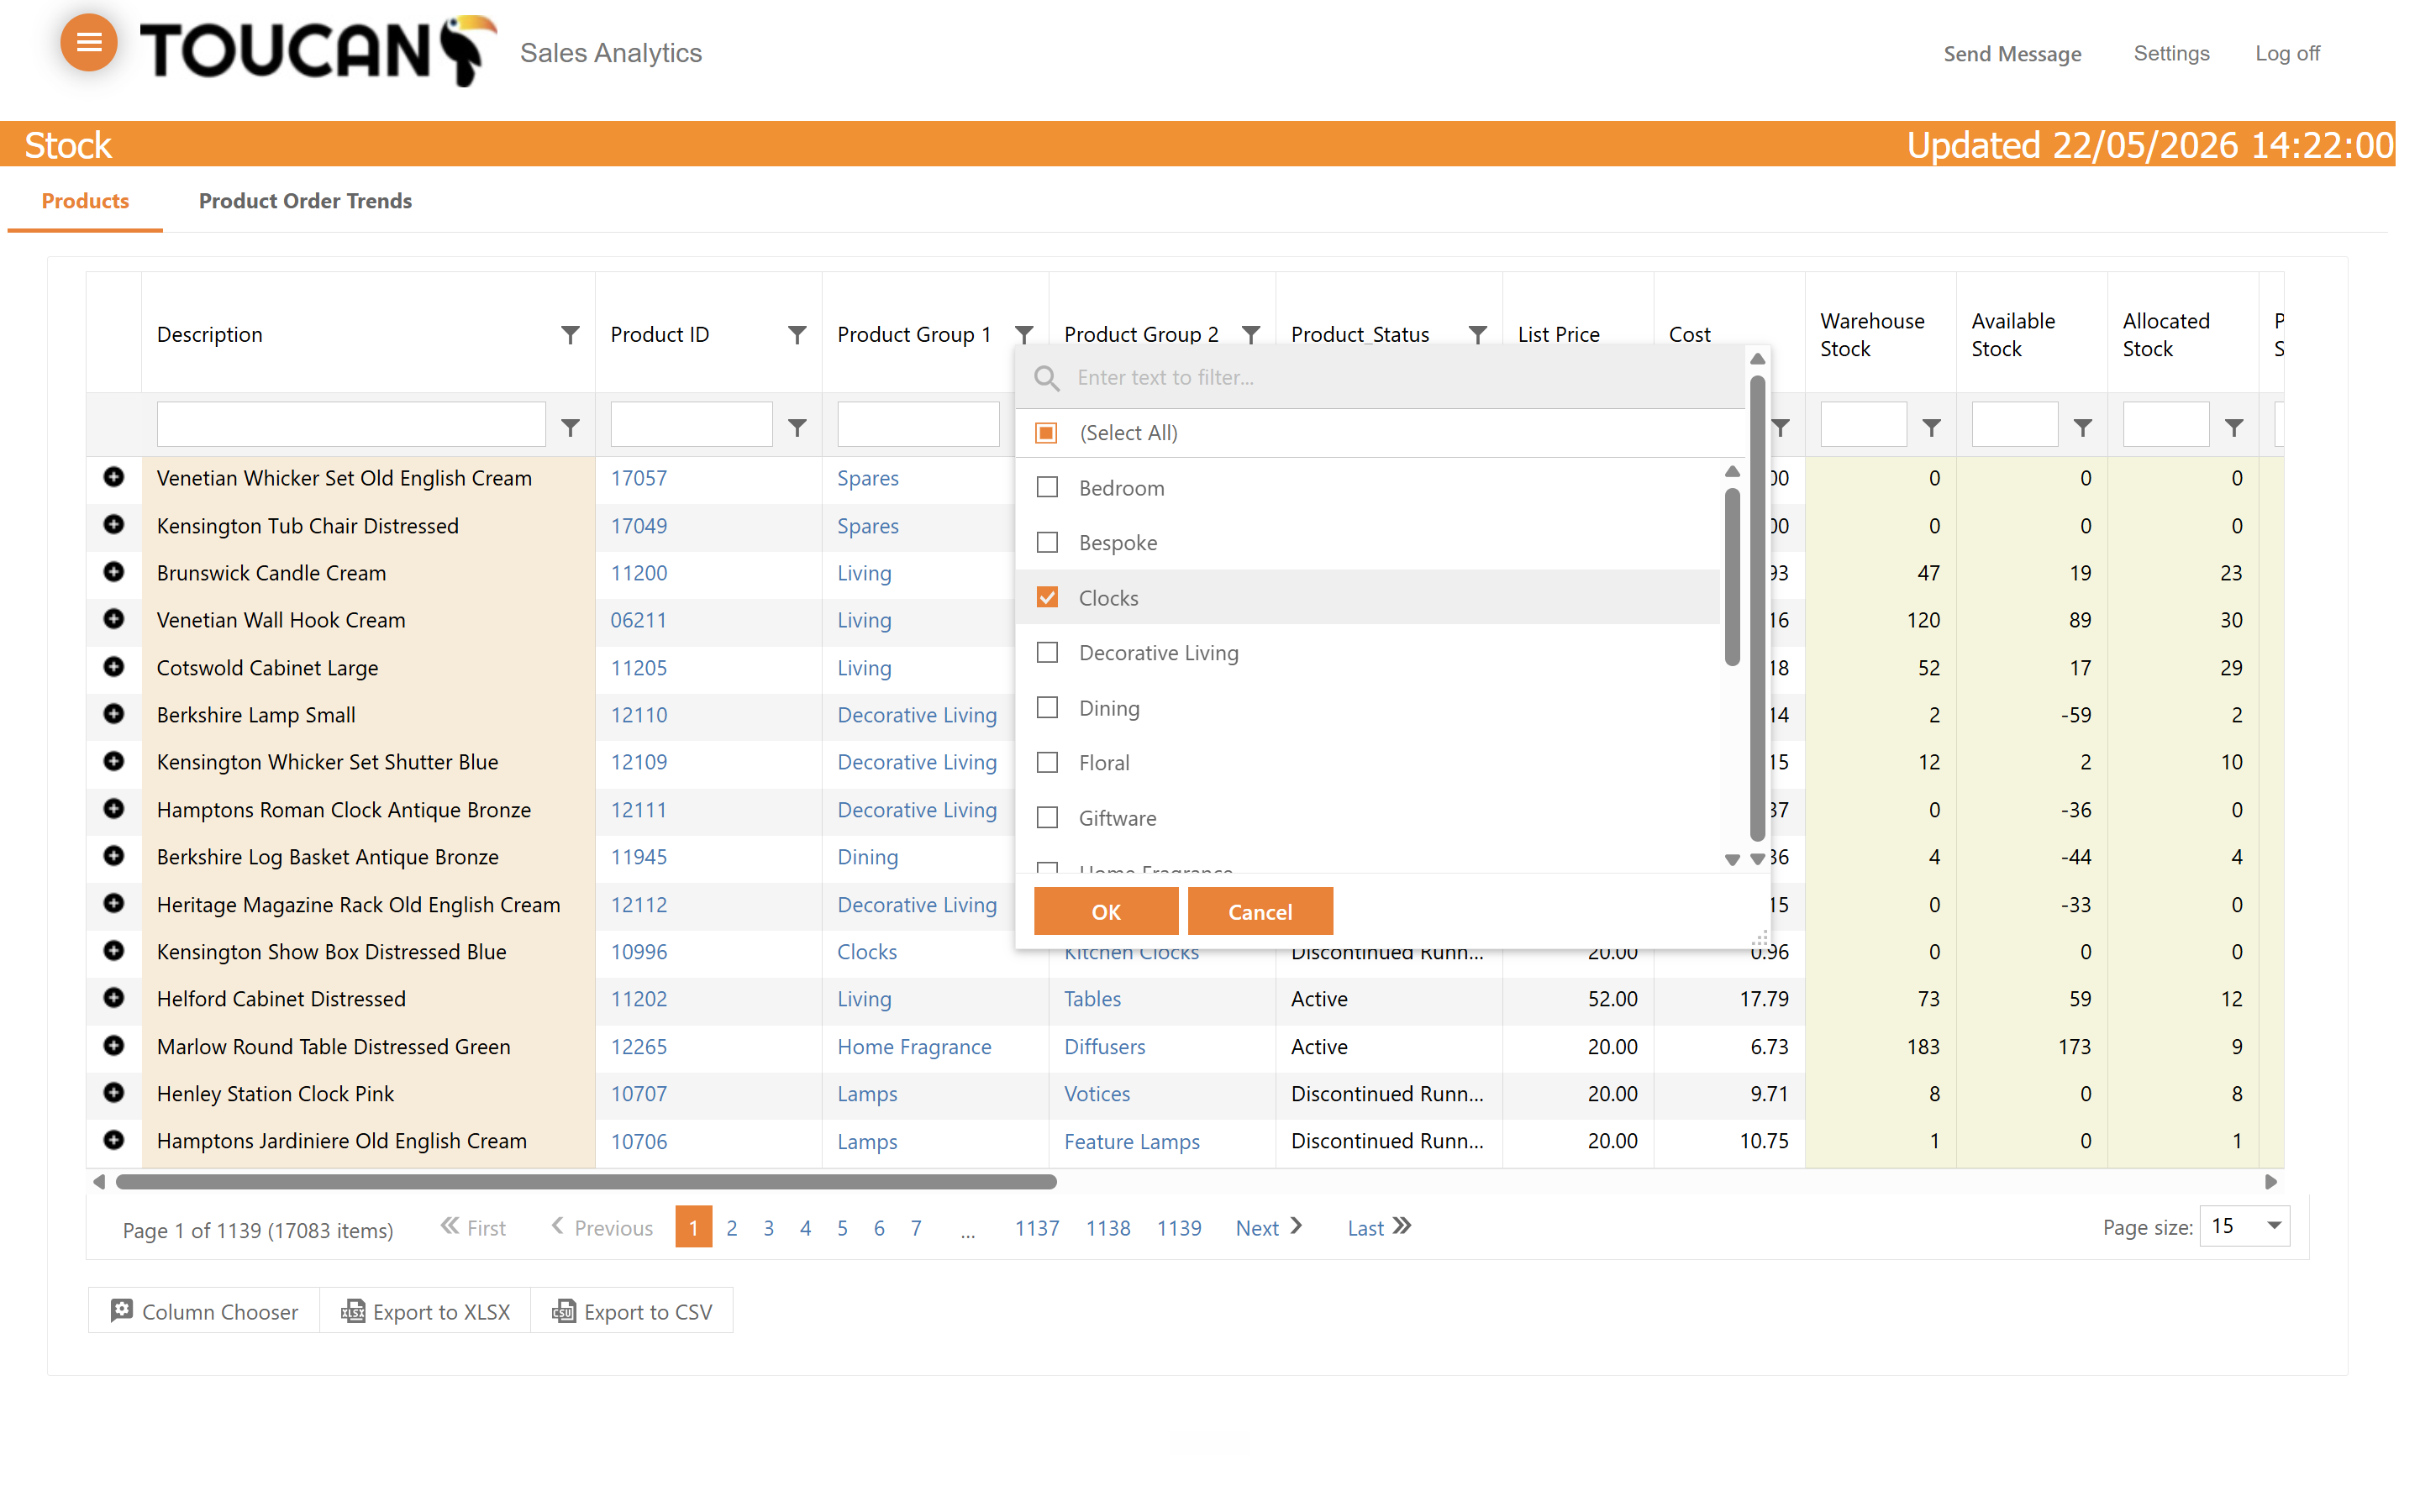
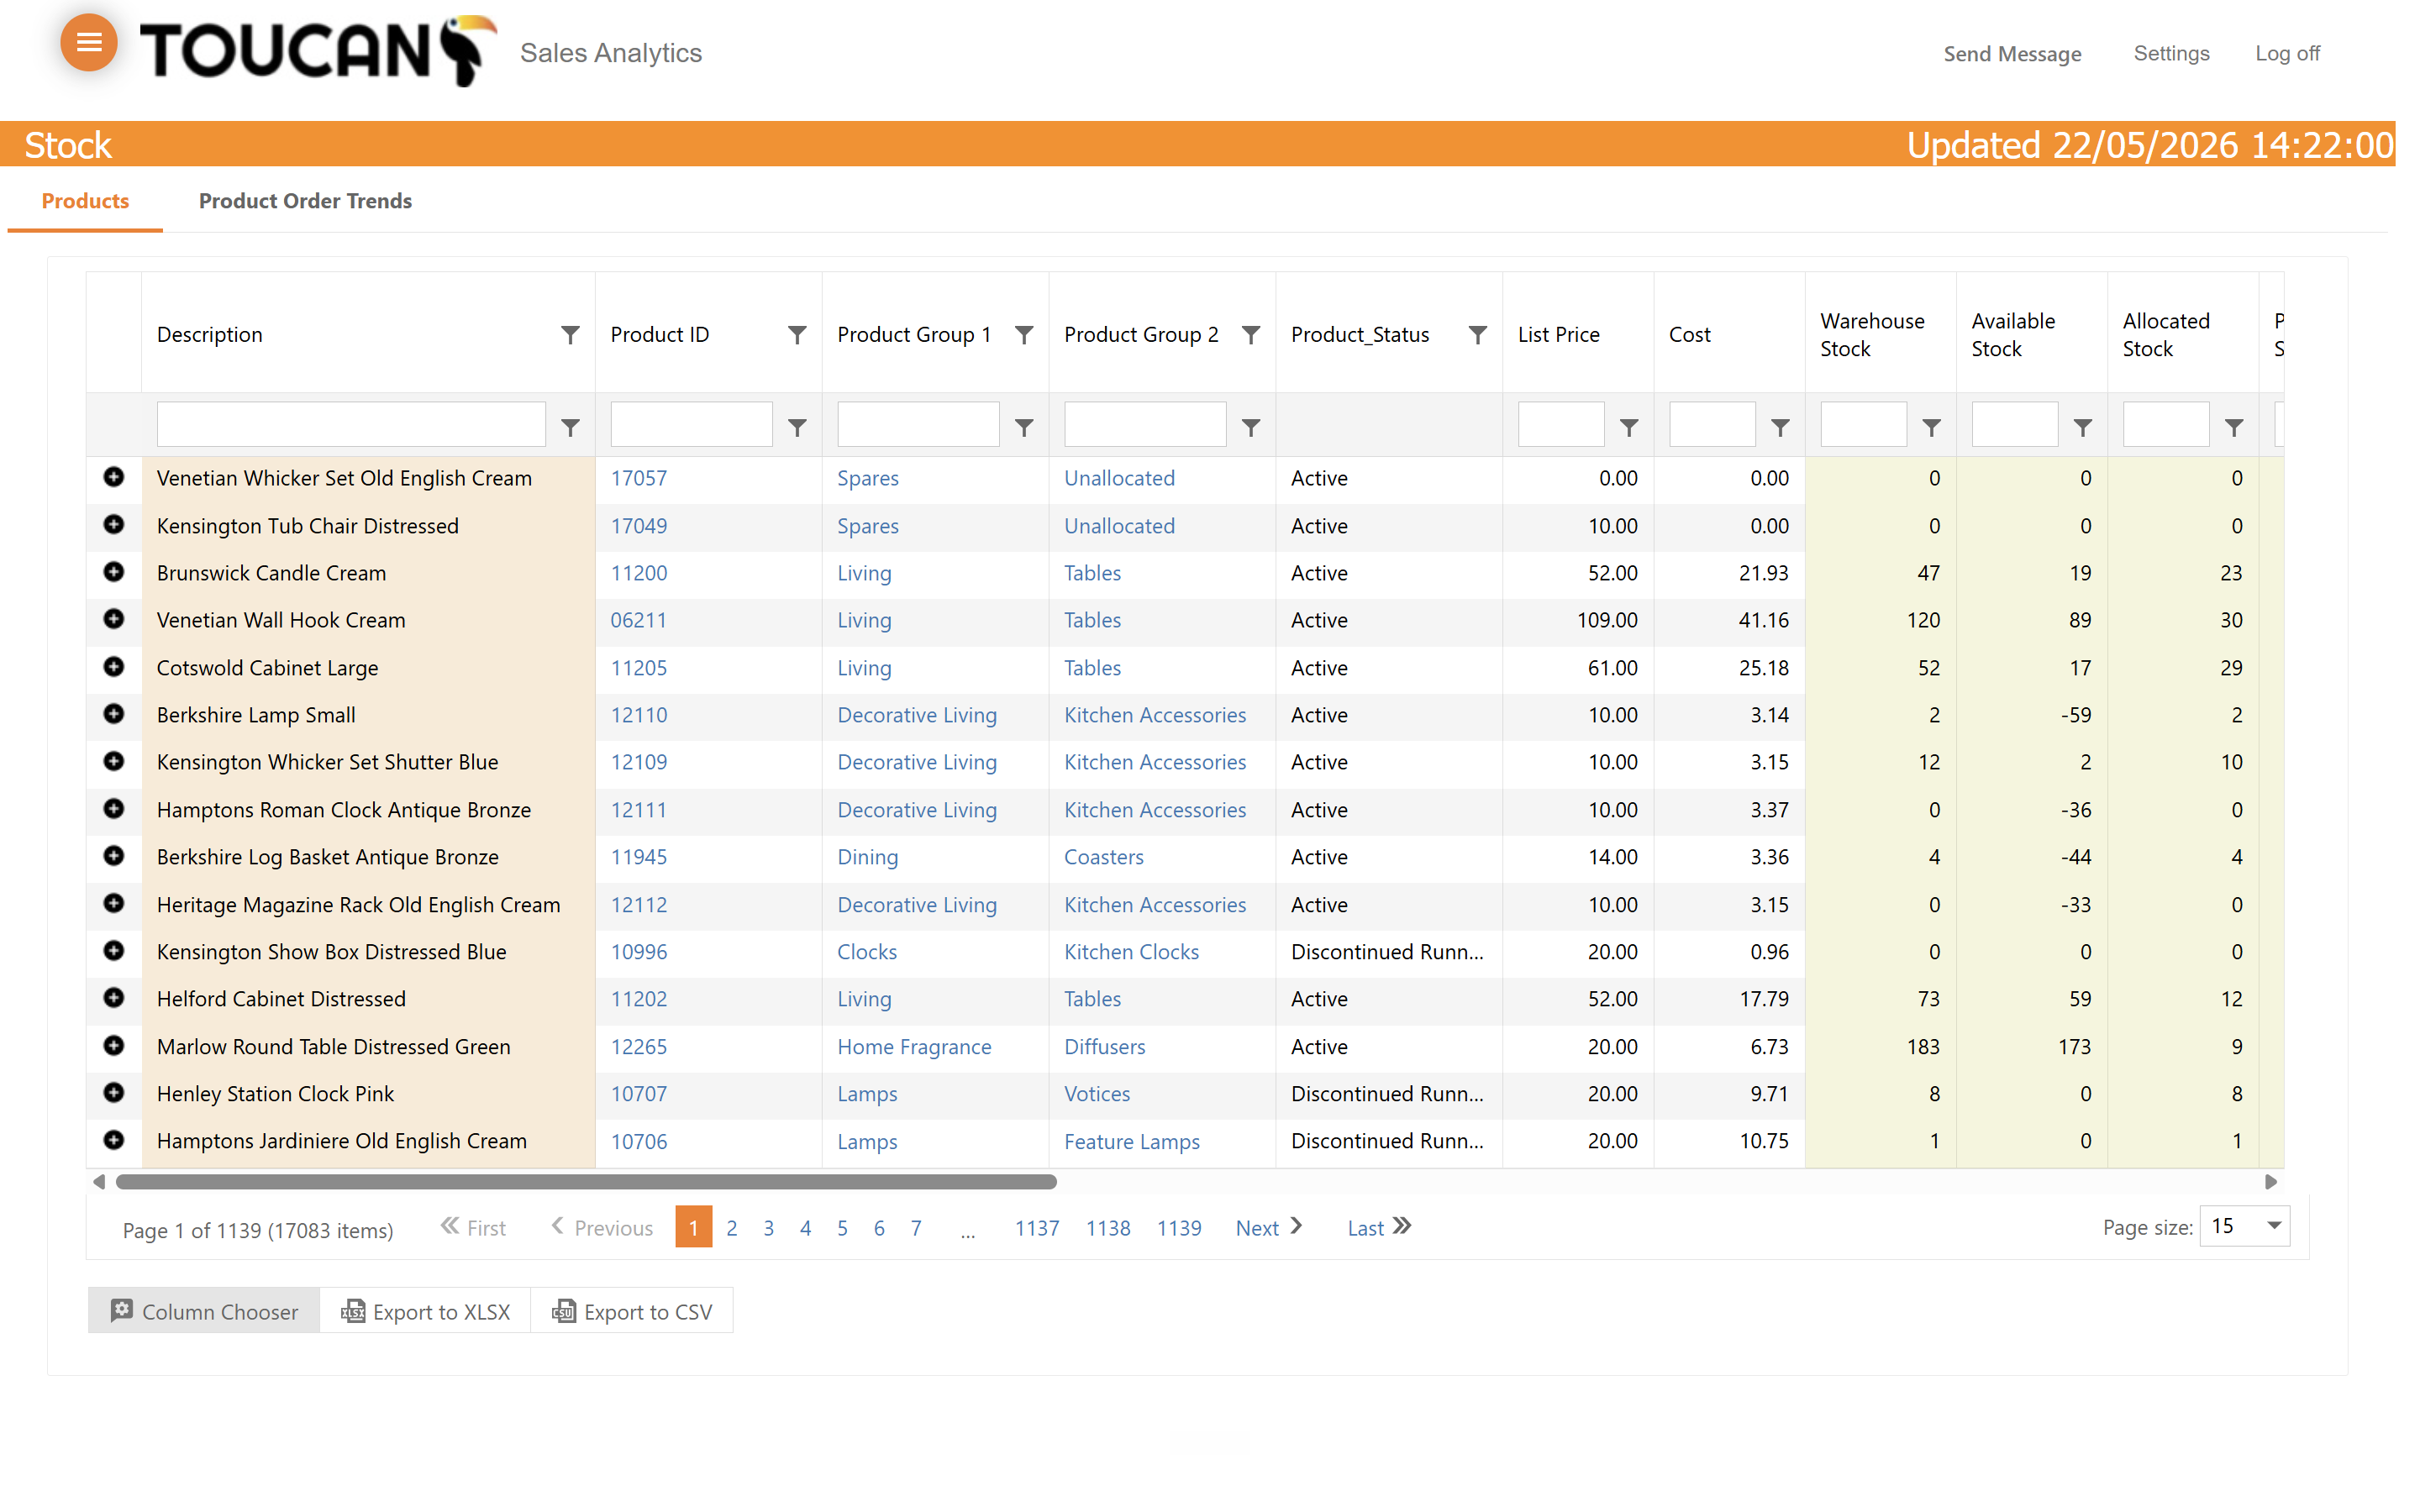
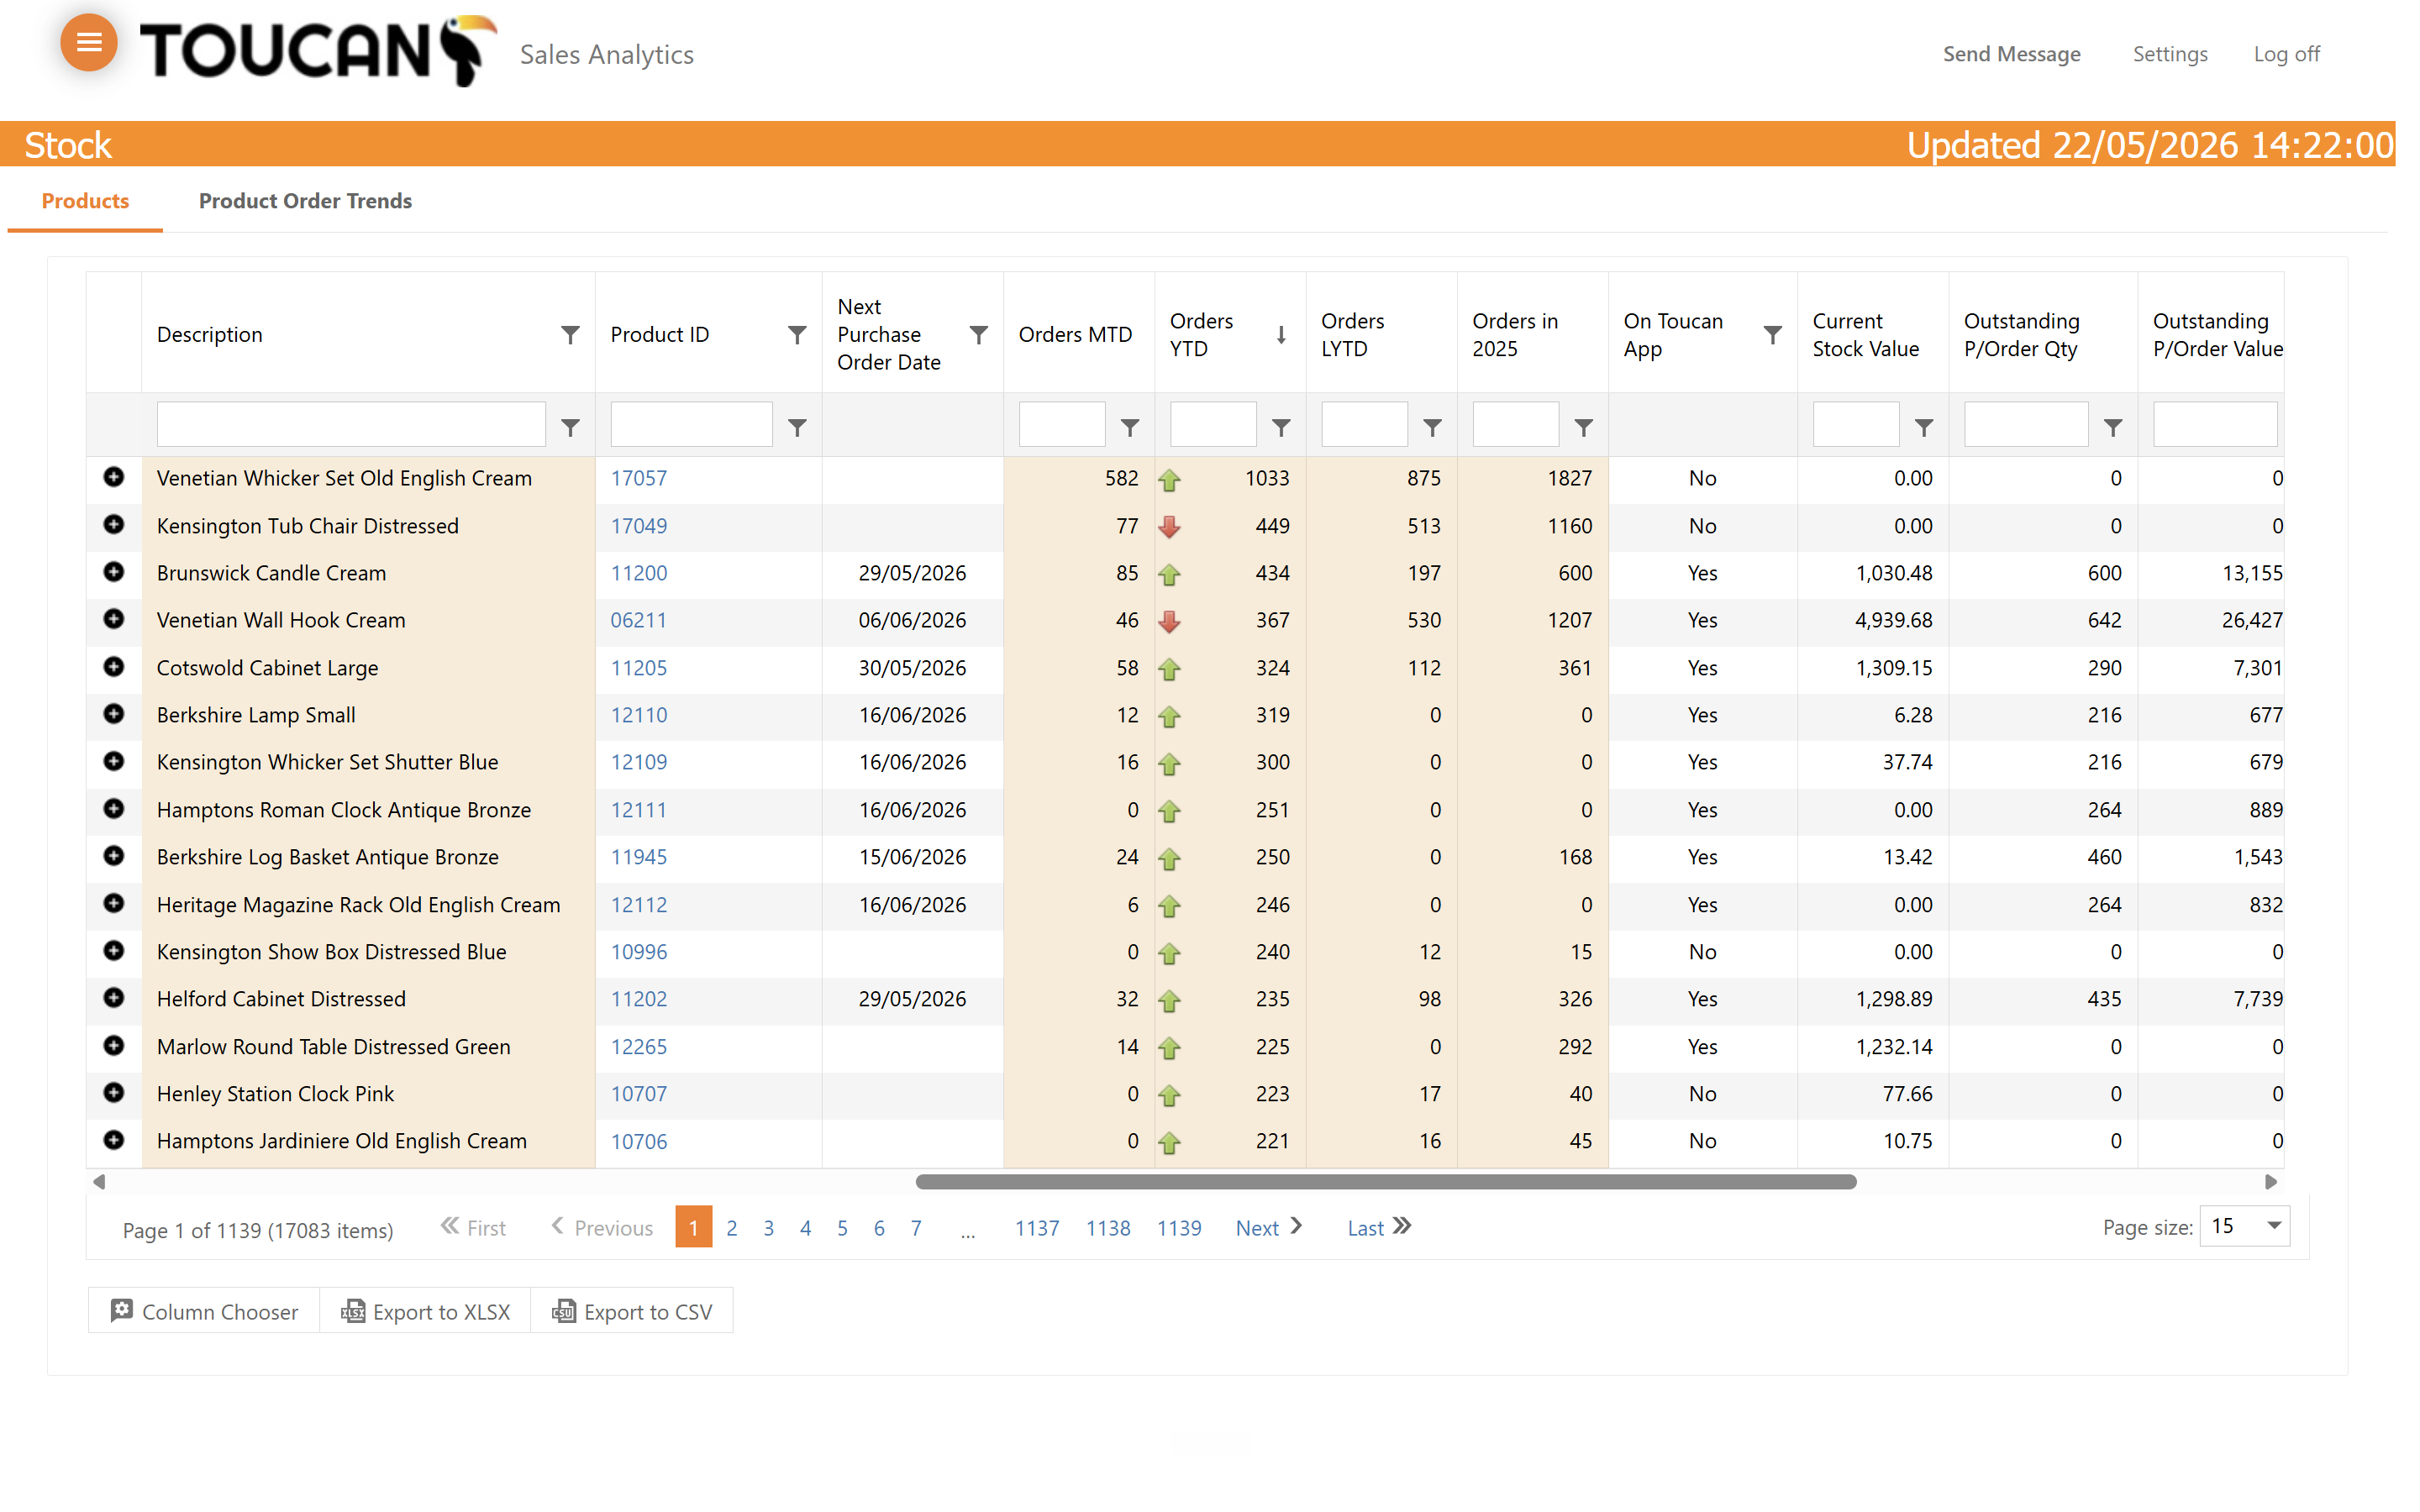
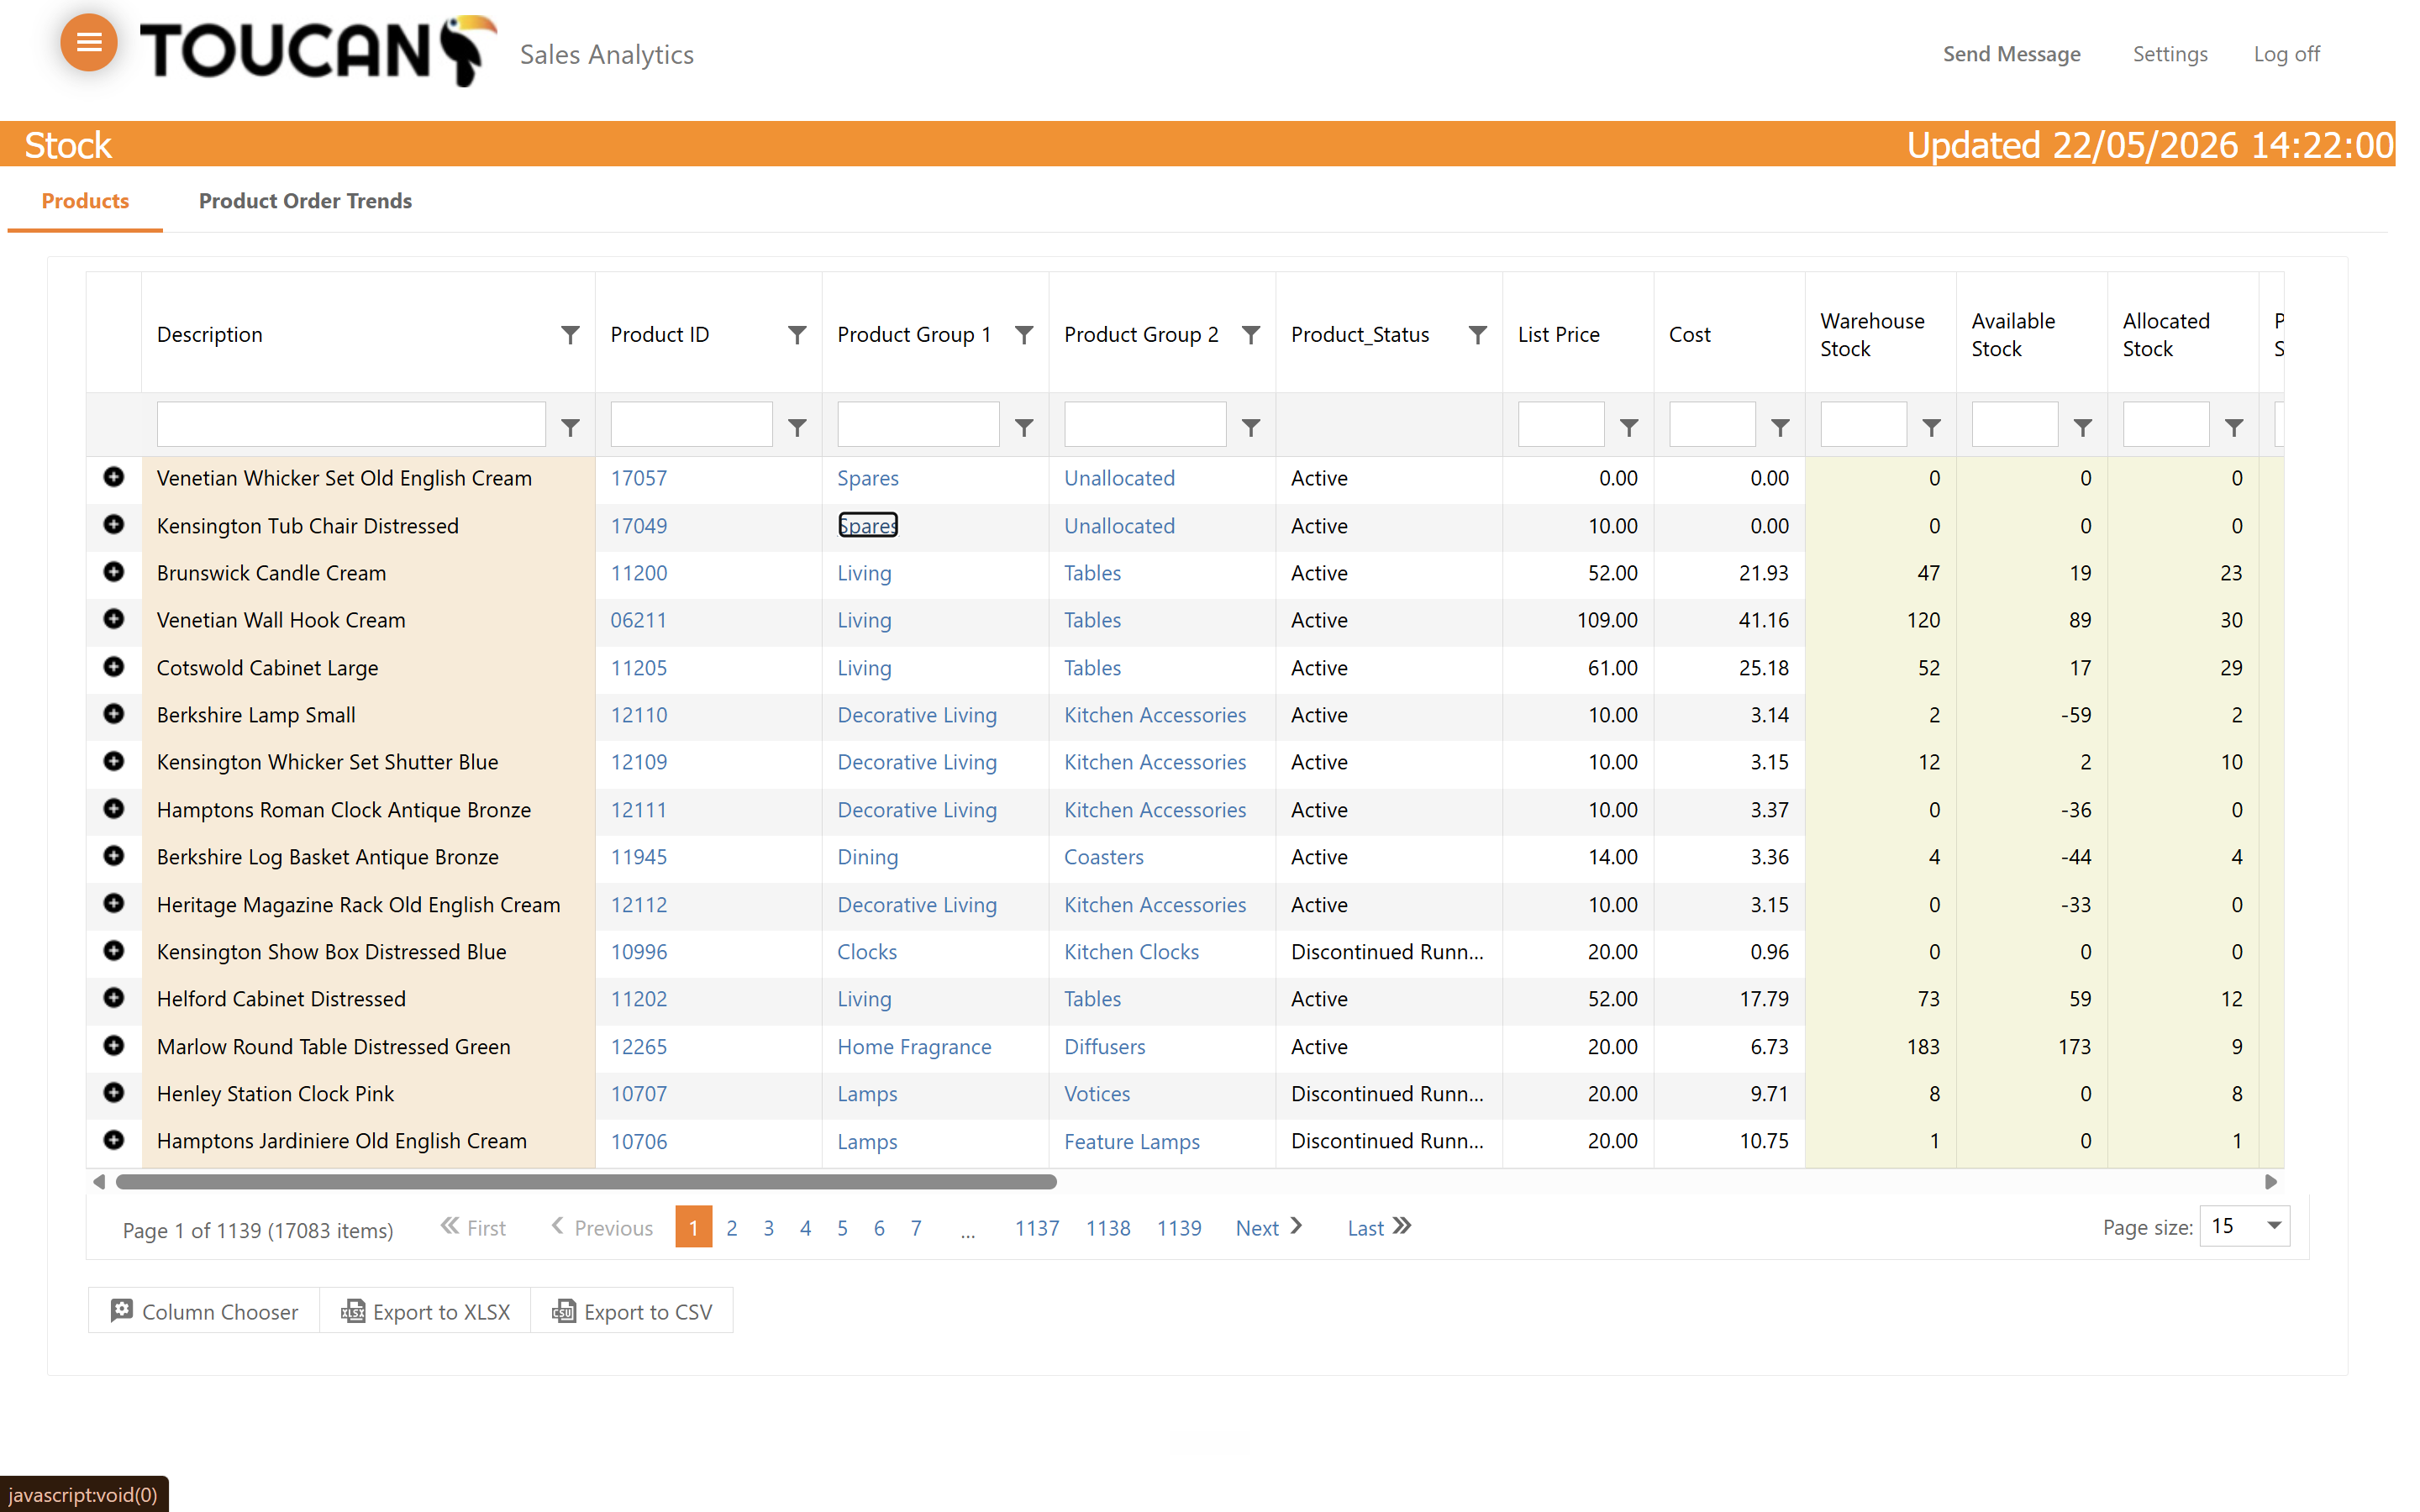
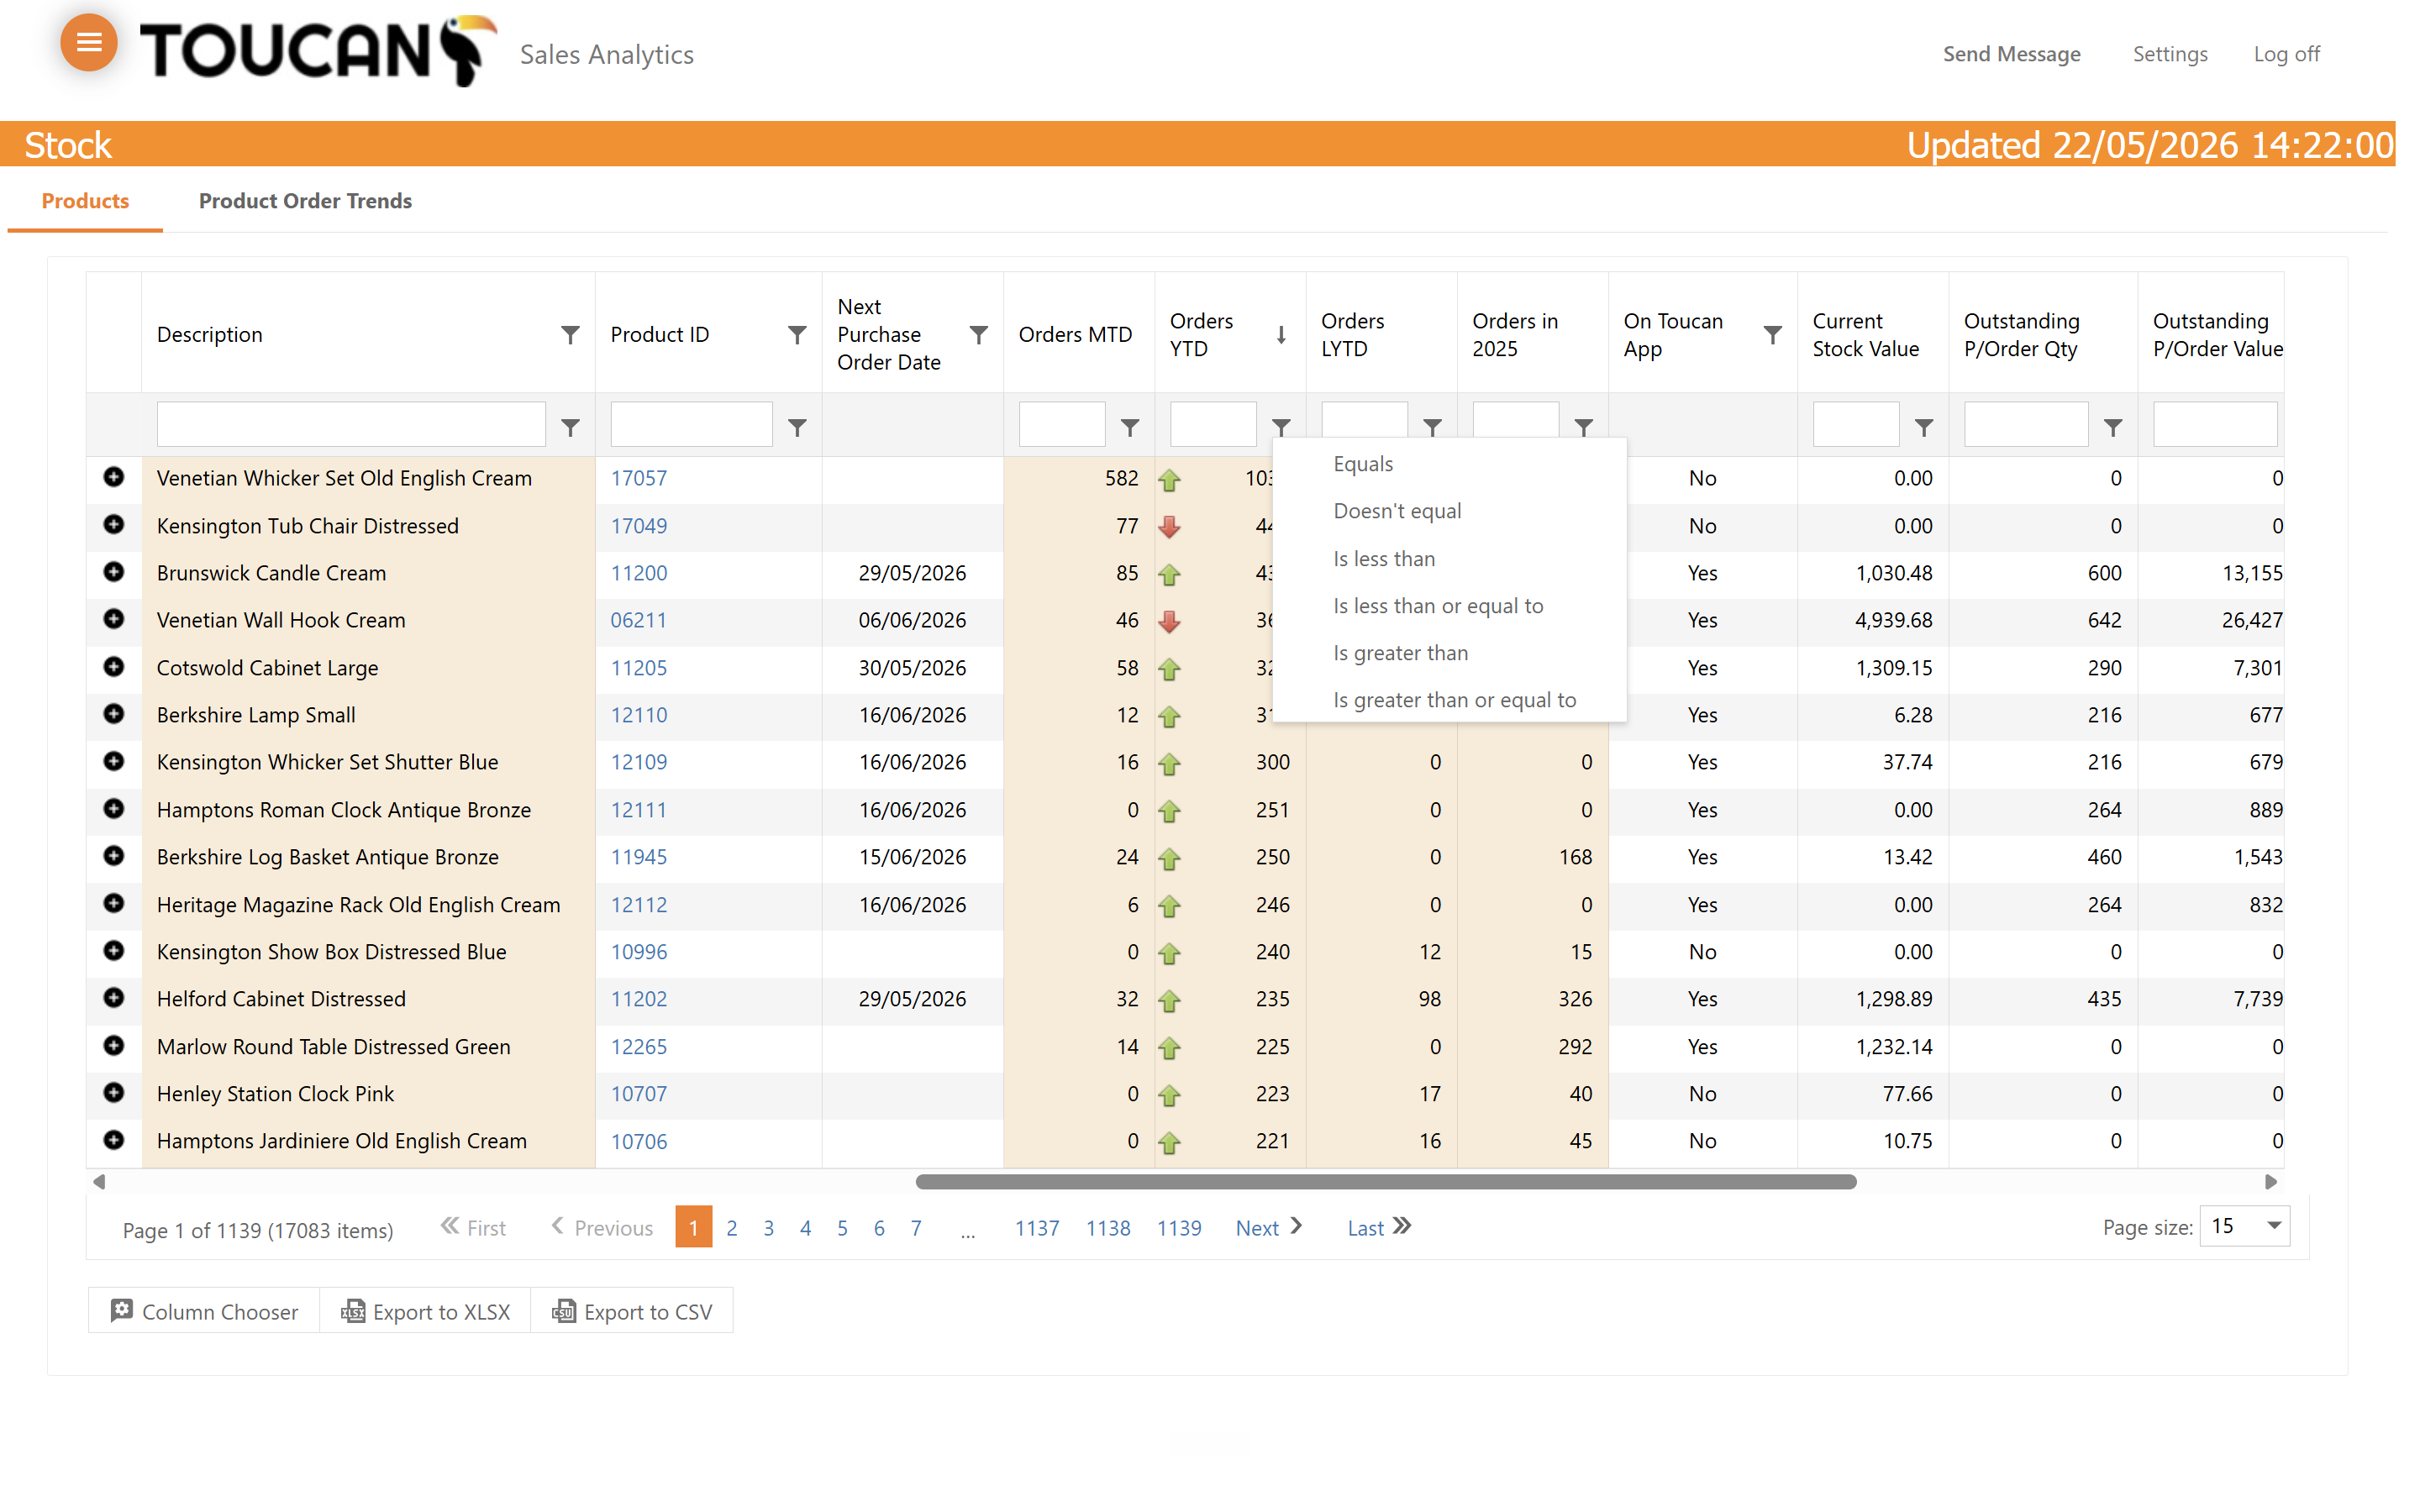
Before diving into specific products, optimise your main inventory view by filtering categories and selecting the most relevant data columns. There are many columns to choose from for filtering. If a column header has a filter icon, select this to open the dropdown menu. If a column heading is just text, clicking the heading will sort the list from ascending to descending based on prefernces.
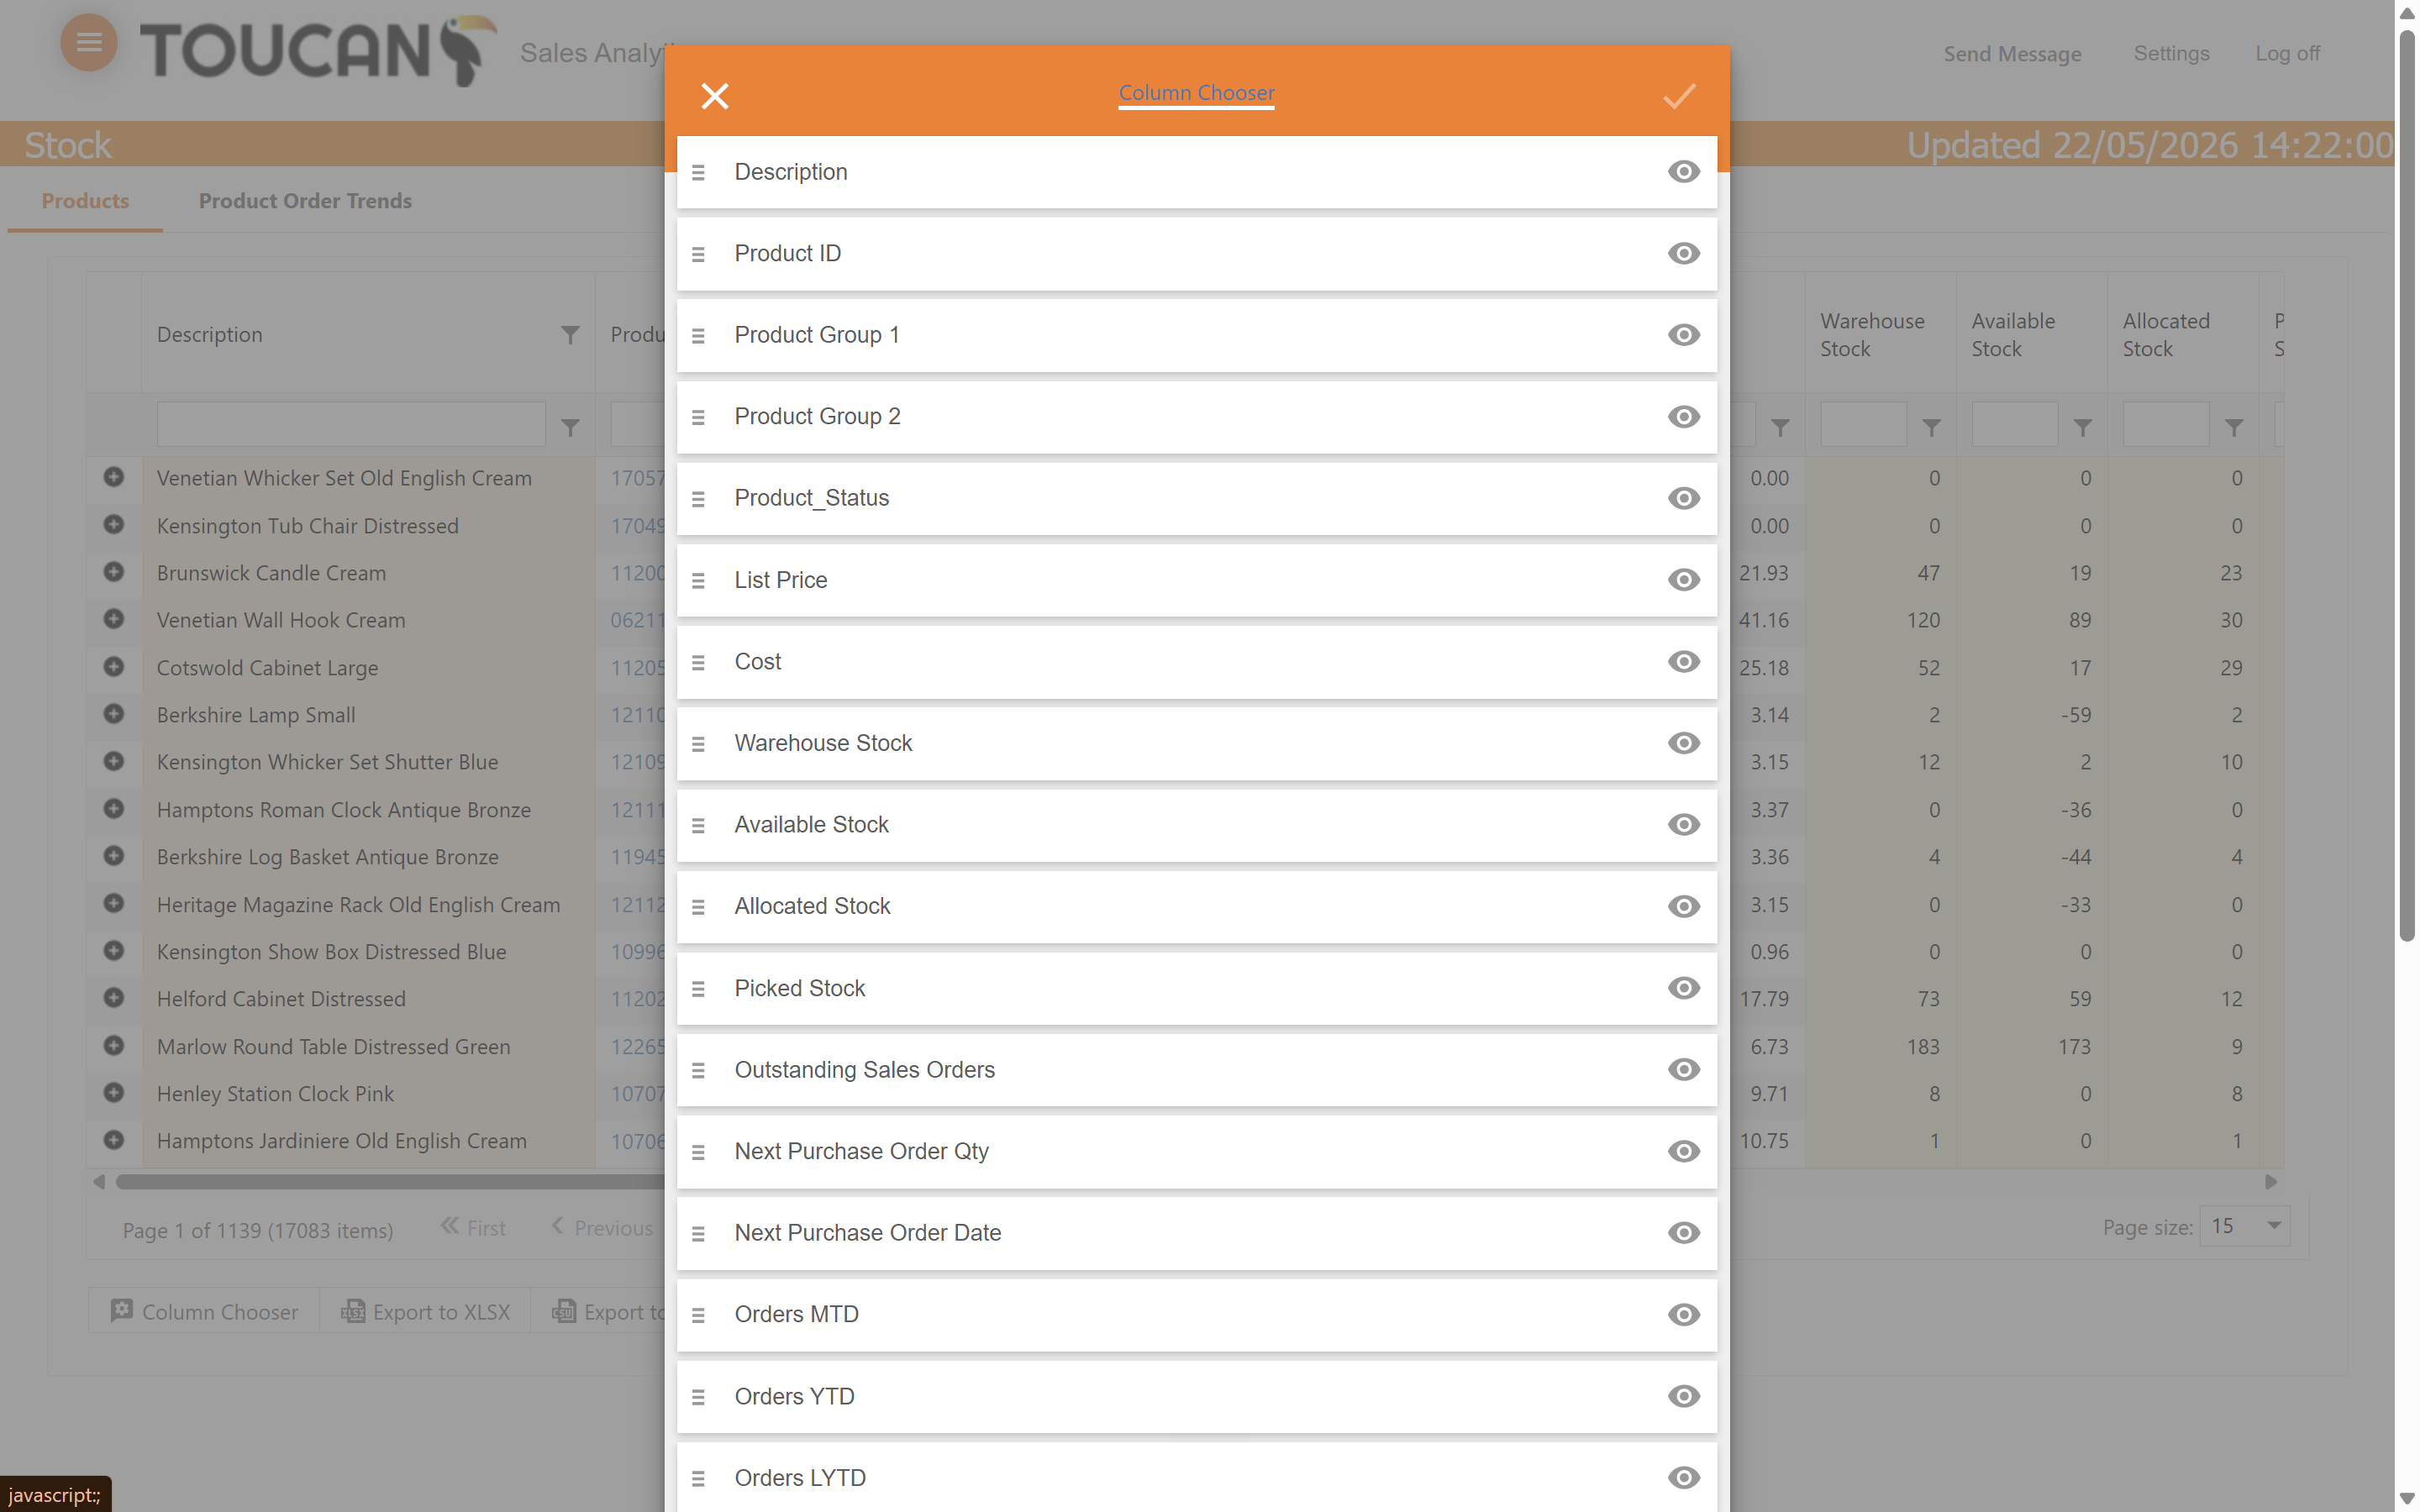
Need more visible data, or need to minimise how much you see? Use the Column Chooser.
View Inline Product Details
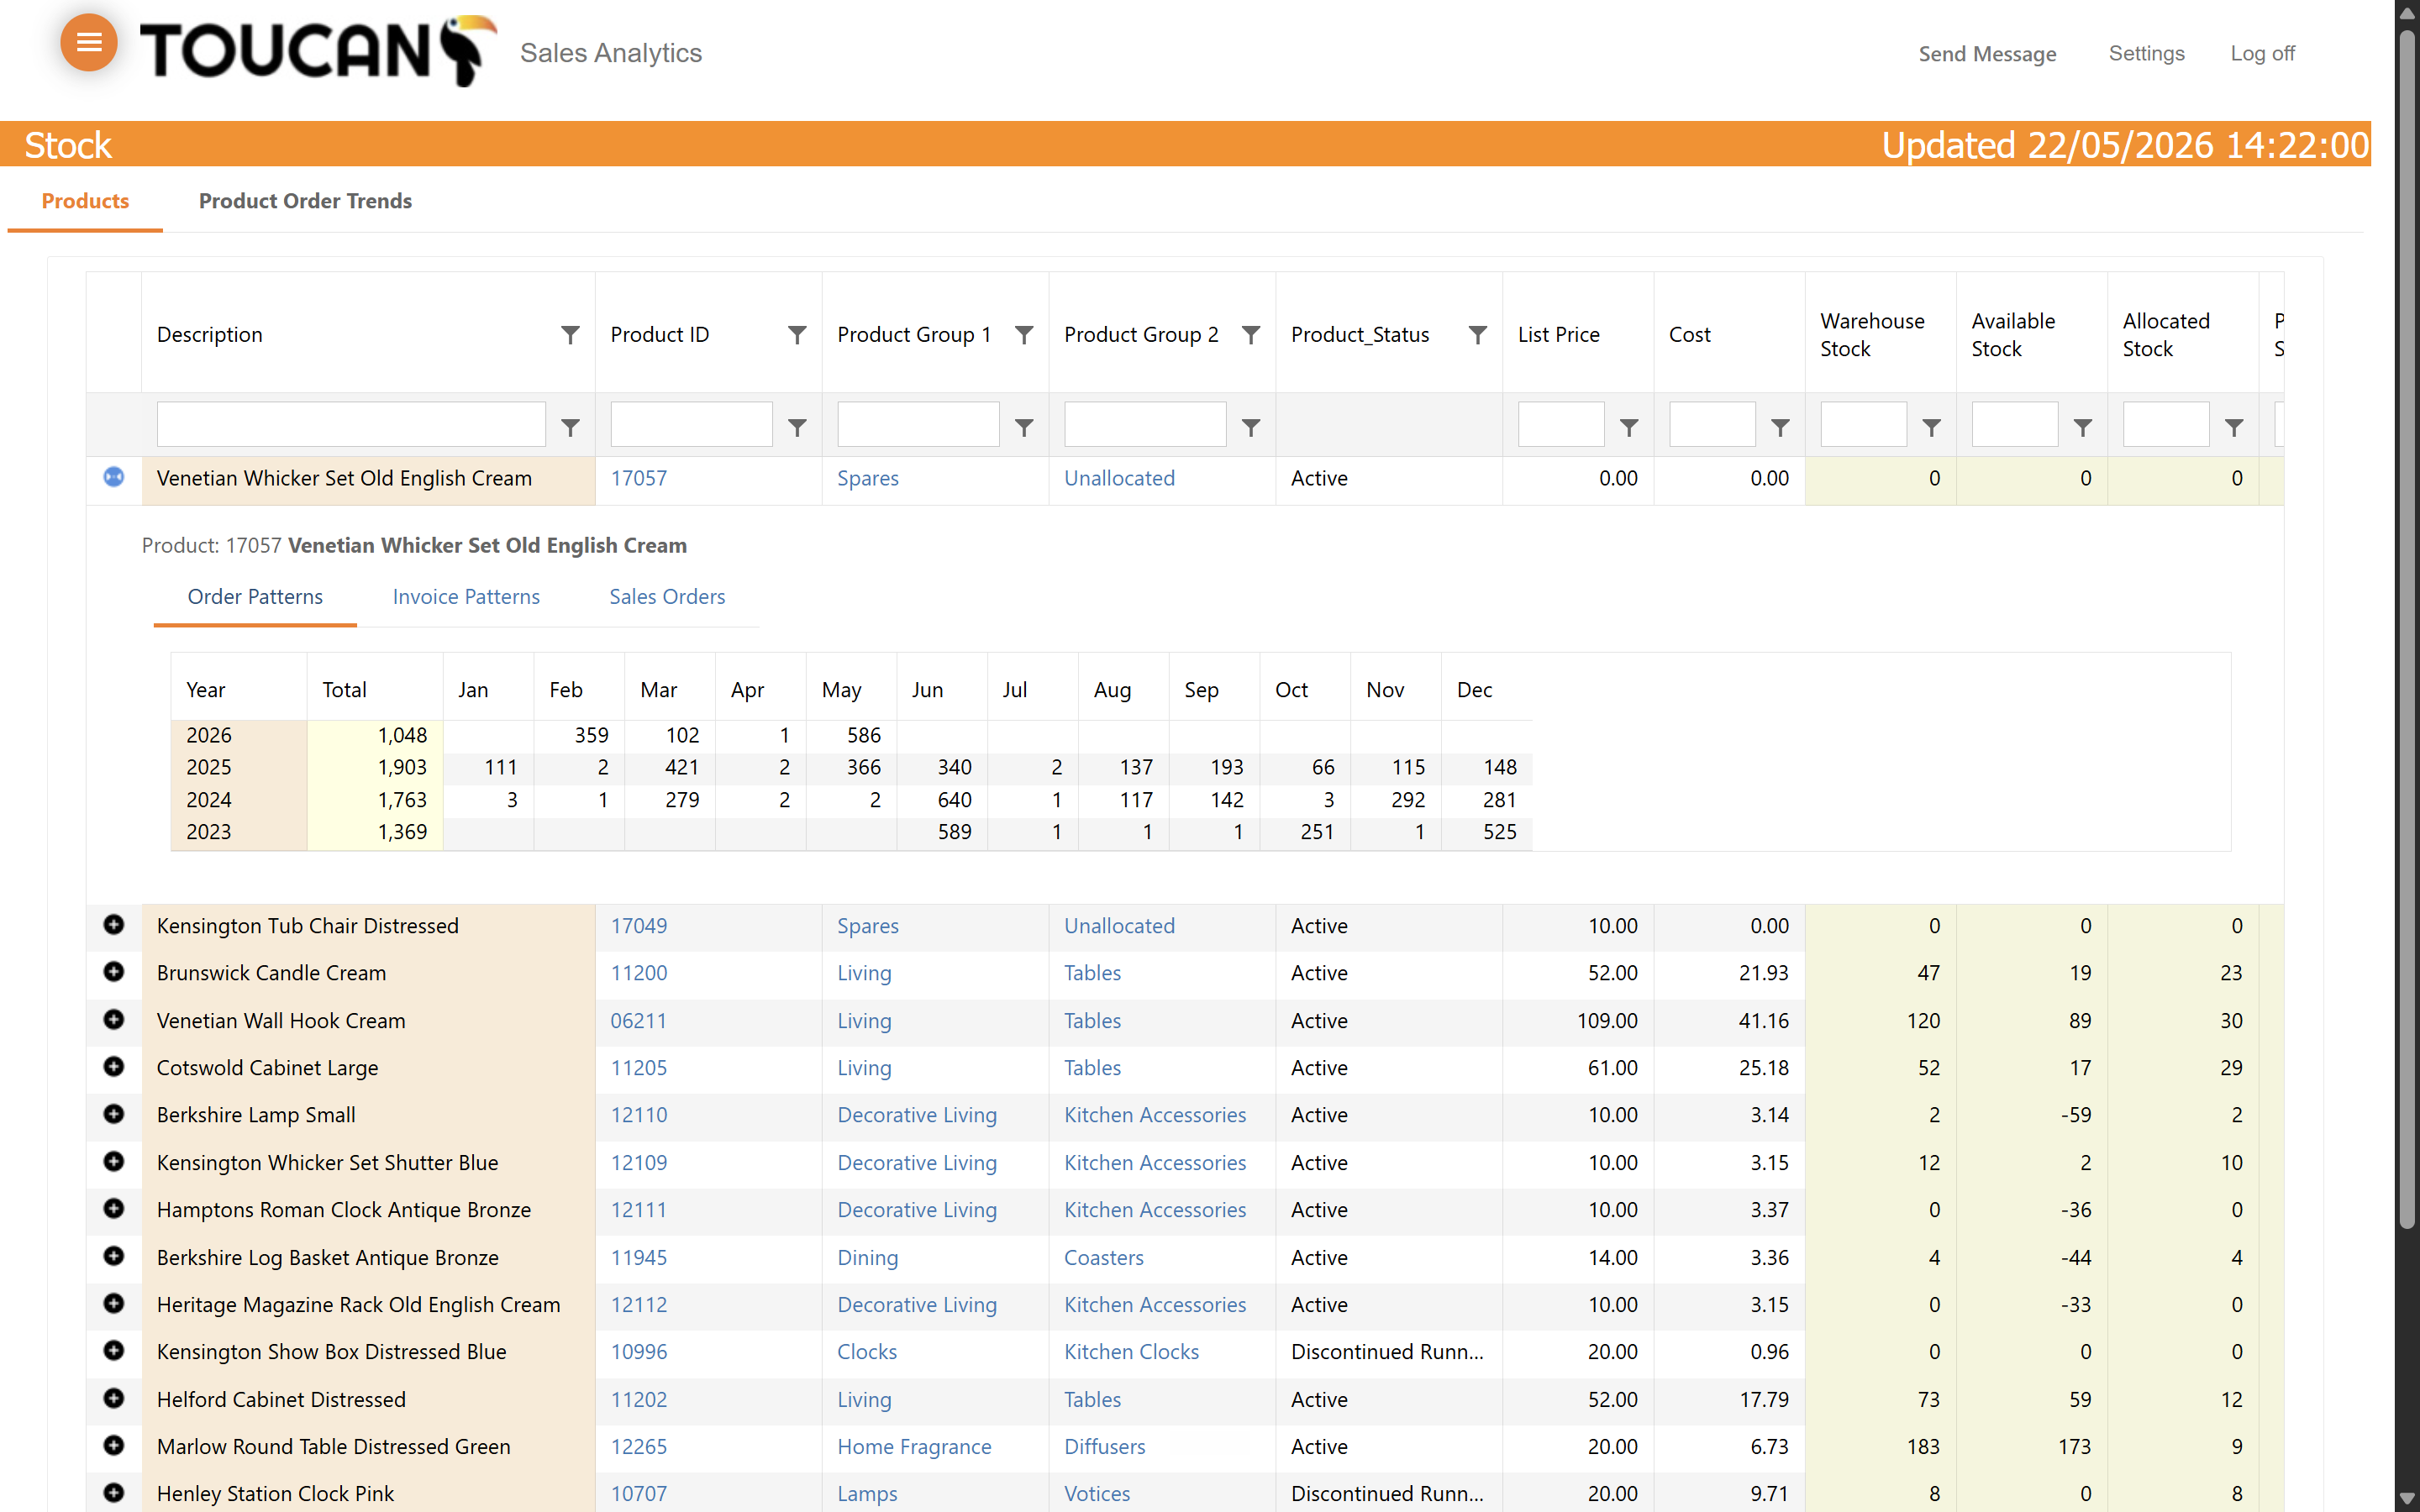
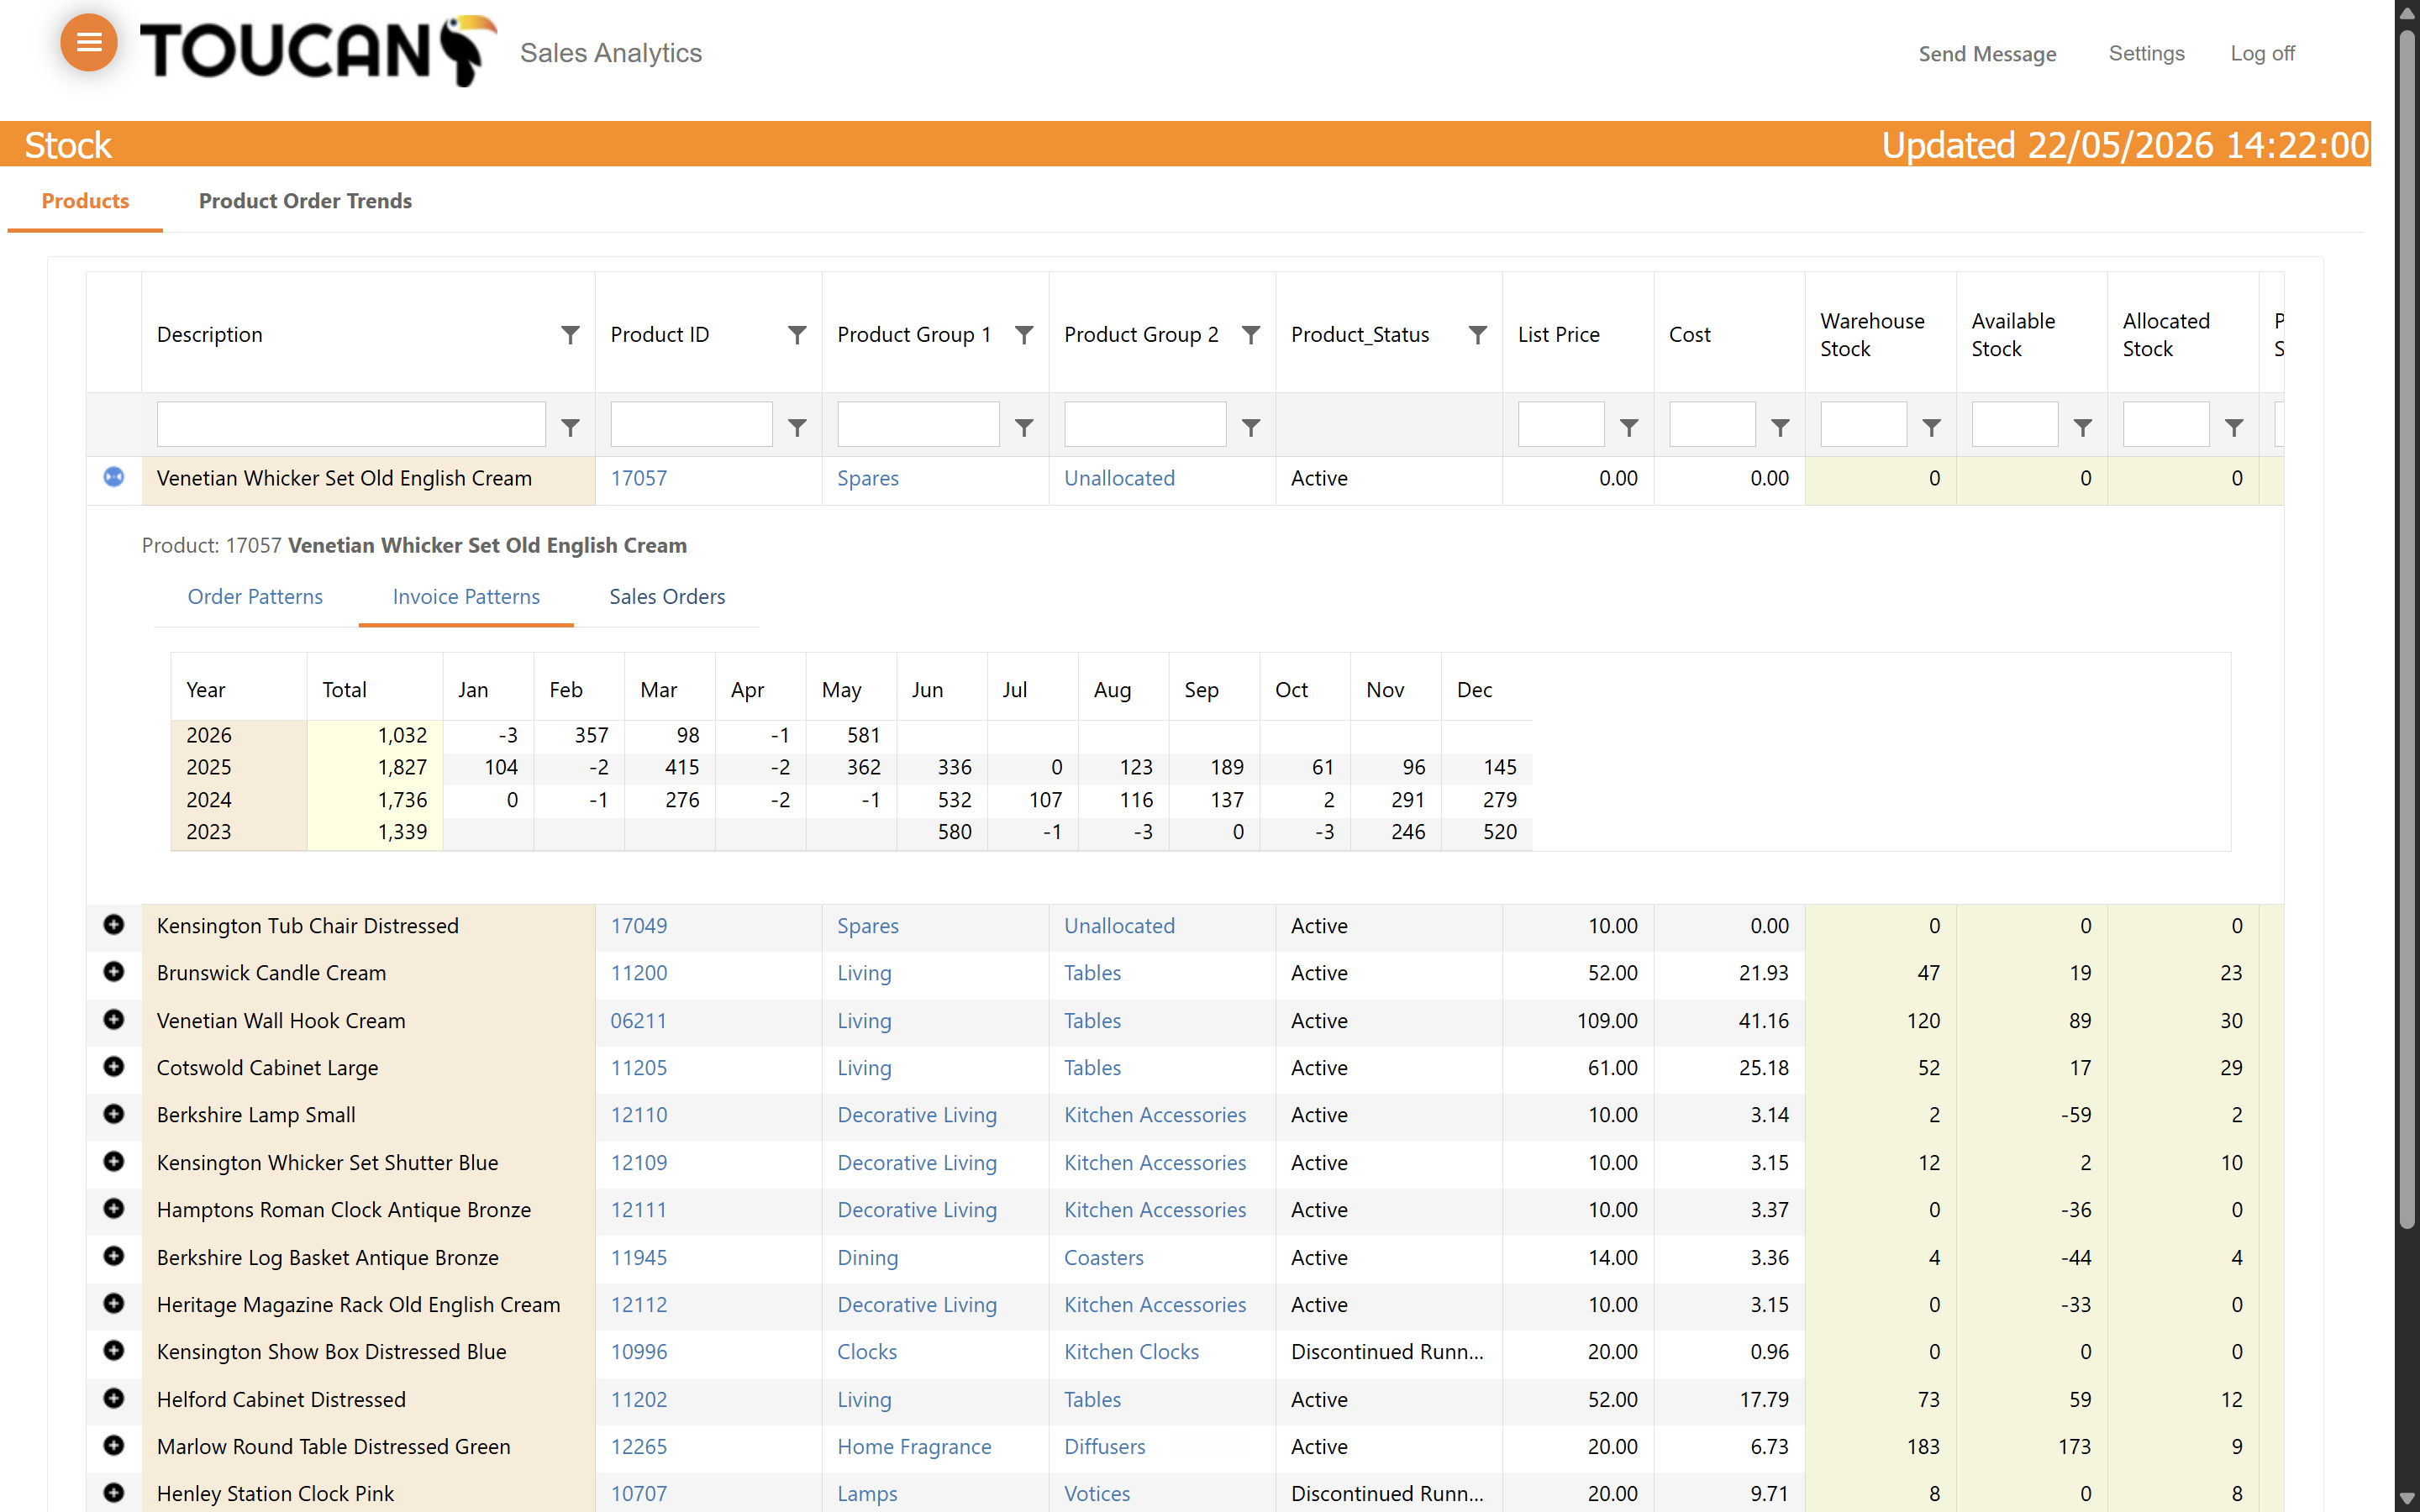
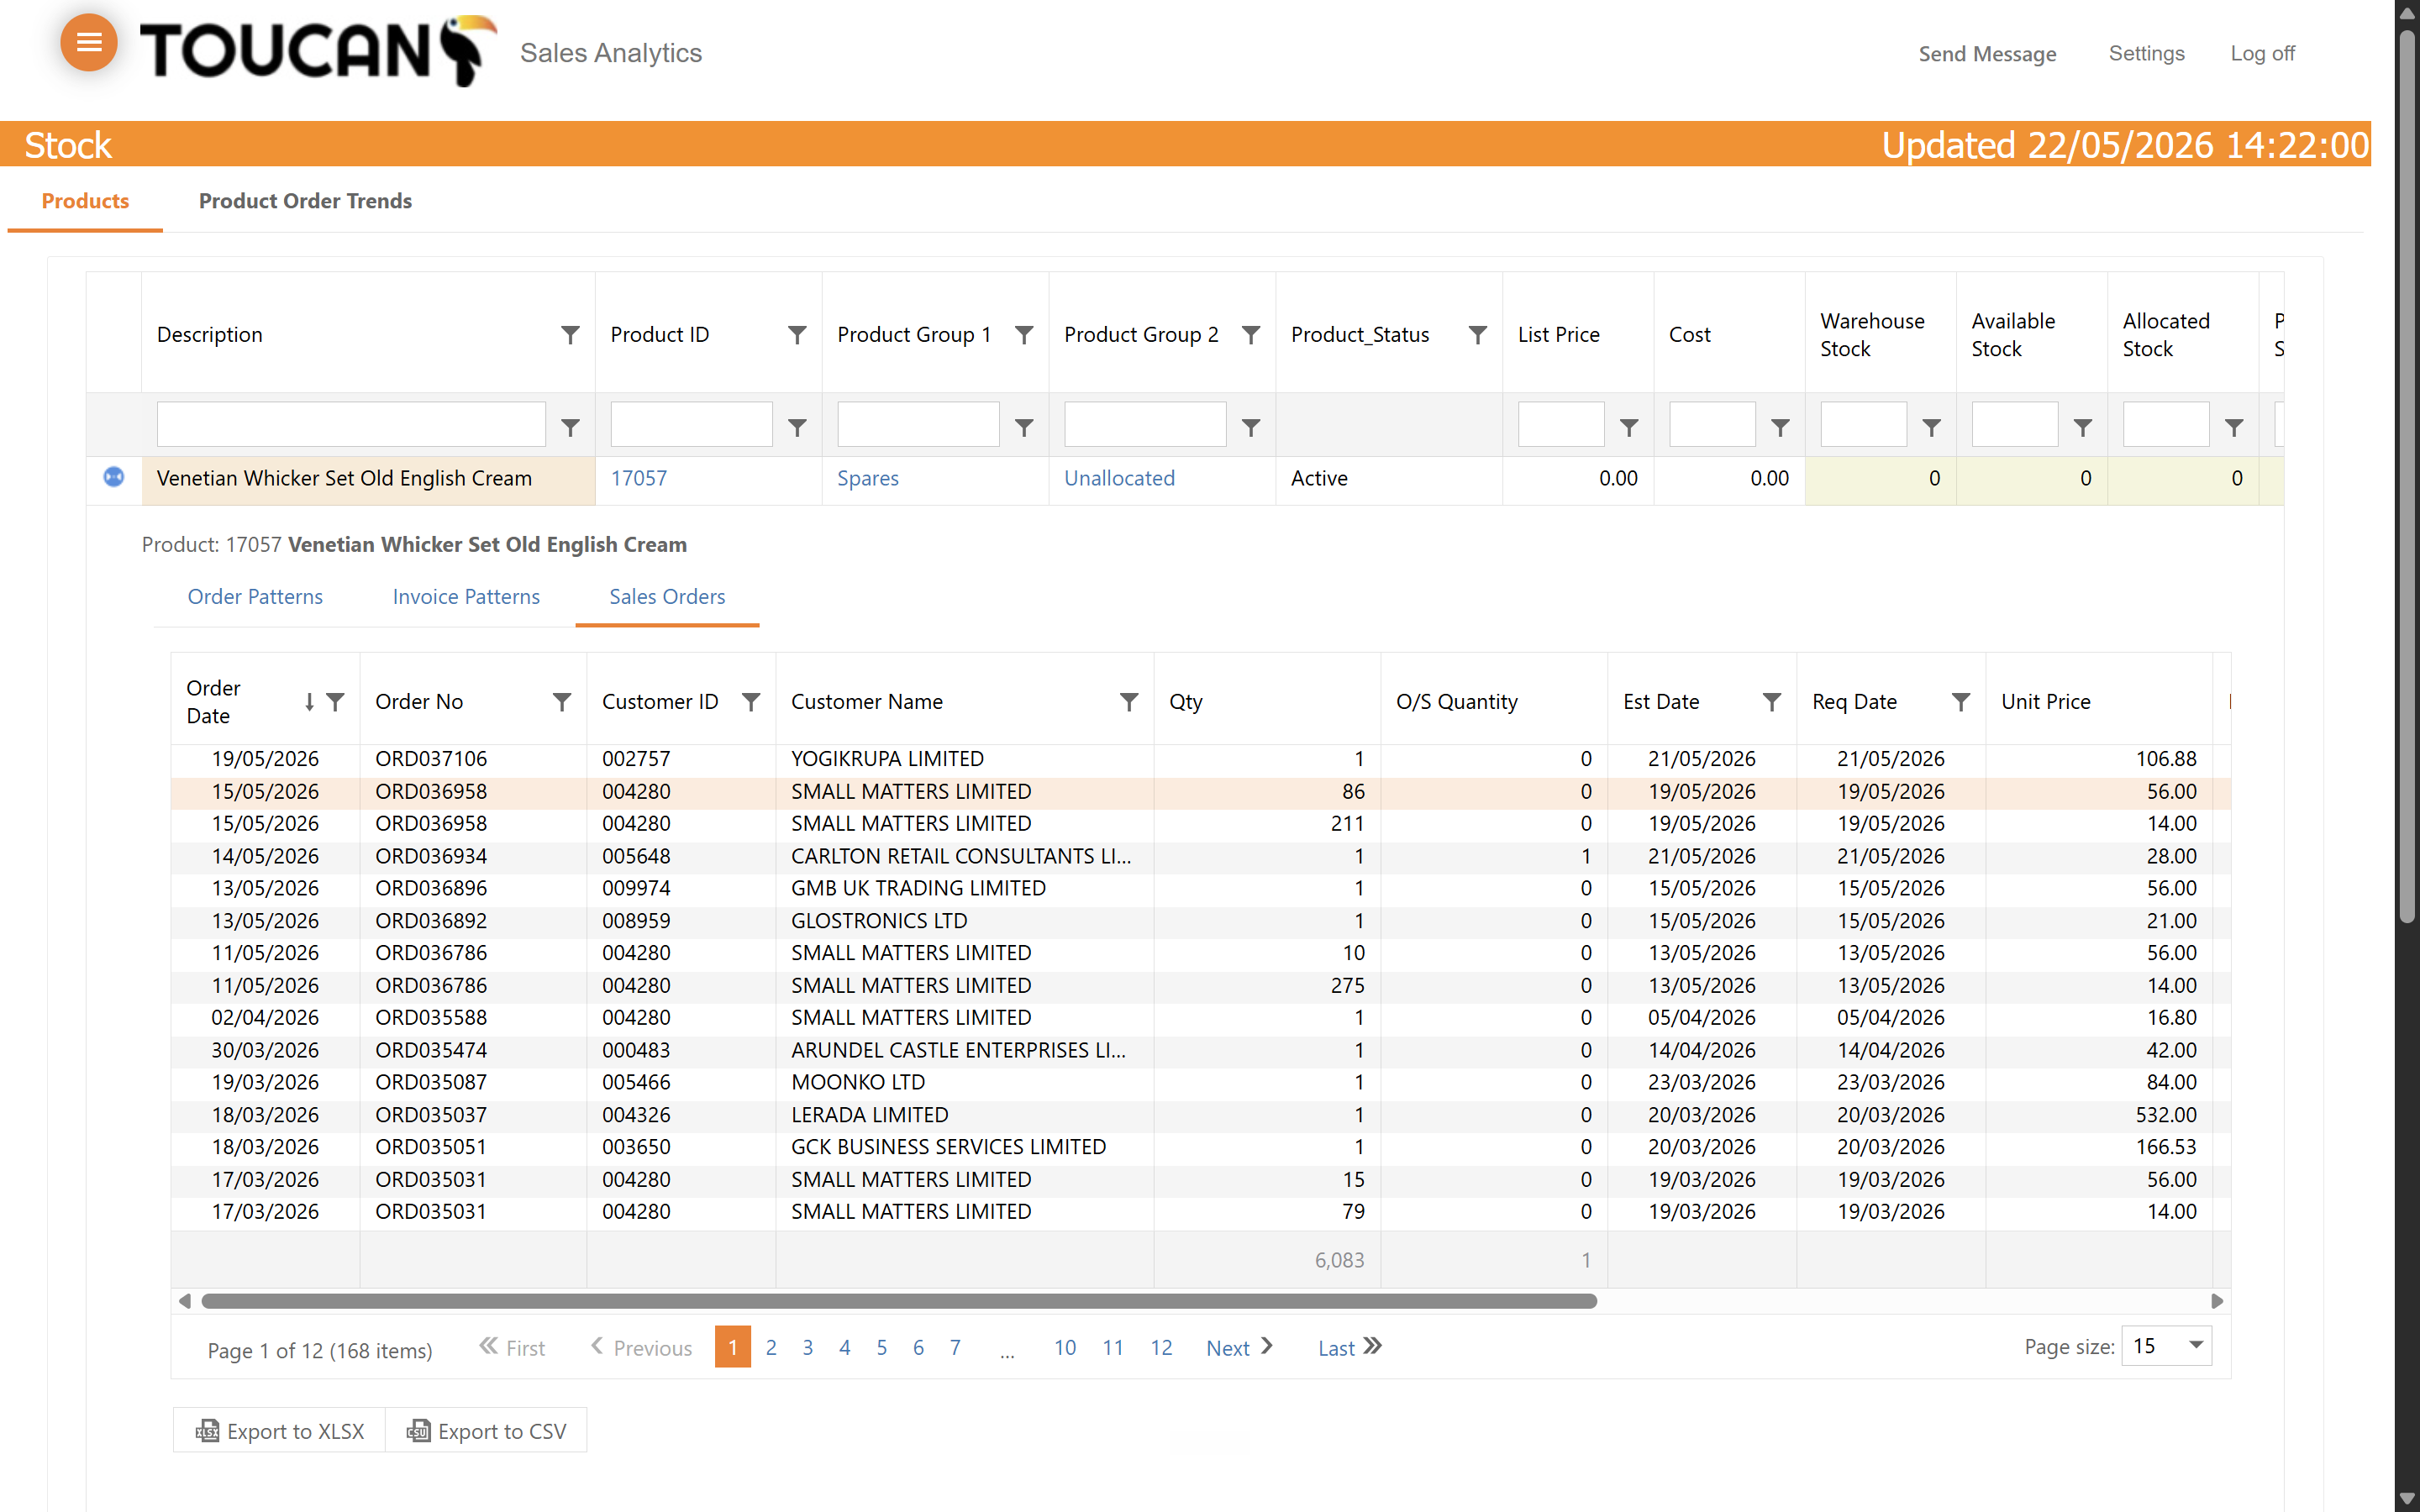
You can quickly view product-specific historical data without leaving the main table using row expansion. This reveals three primary inline datasets:
View Mode | Description |
|---|---|
Order Patterns | Displays a monthly order trend chart for historical years. |
Invoice Patterns | Reveals a detailed monthly invoice pattern report. |
Sales Orders | Shows a sub-table detailing individual, localized sales orders. |
Navigate the Product Detail Modal
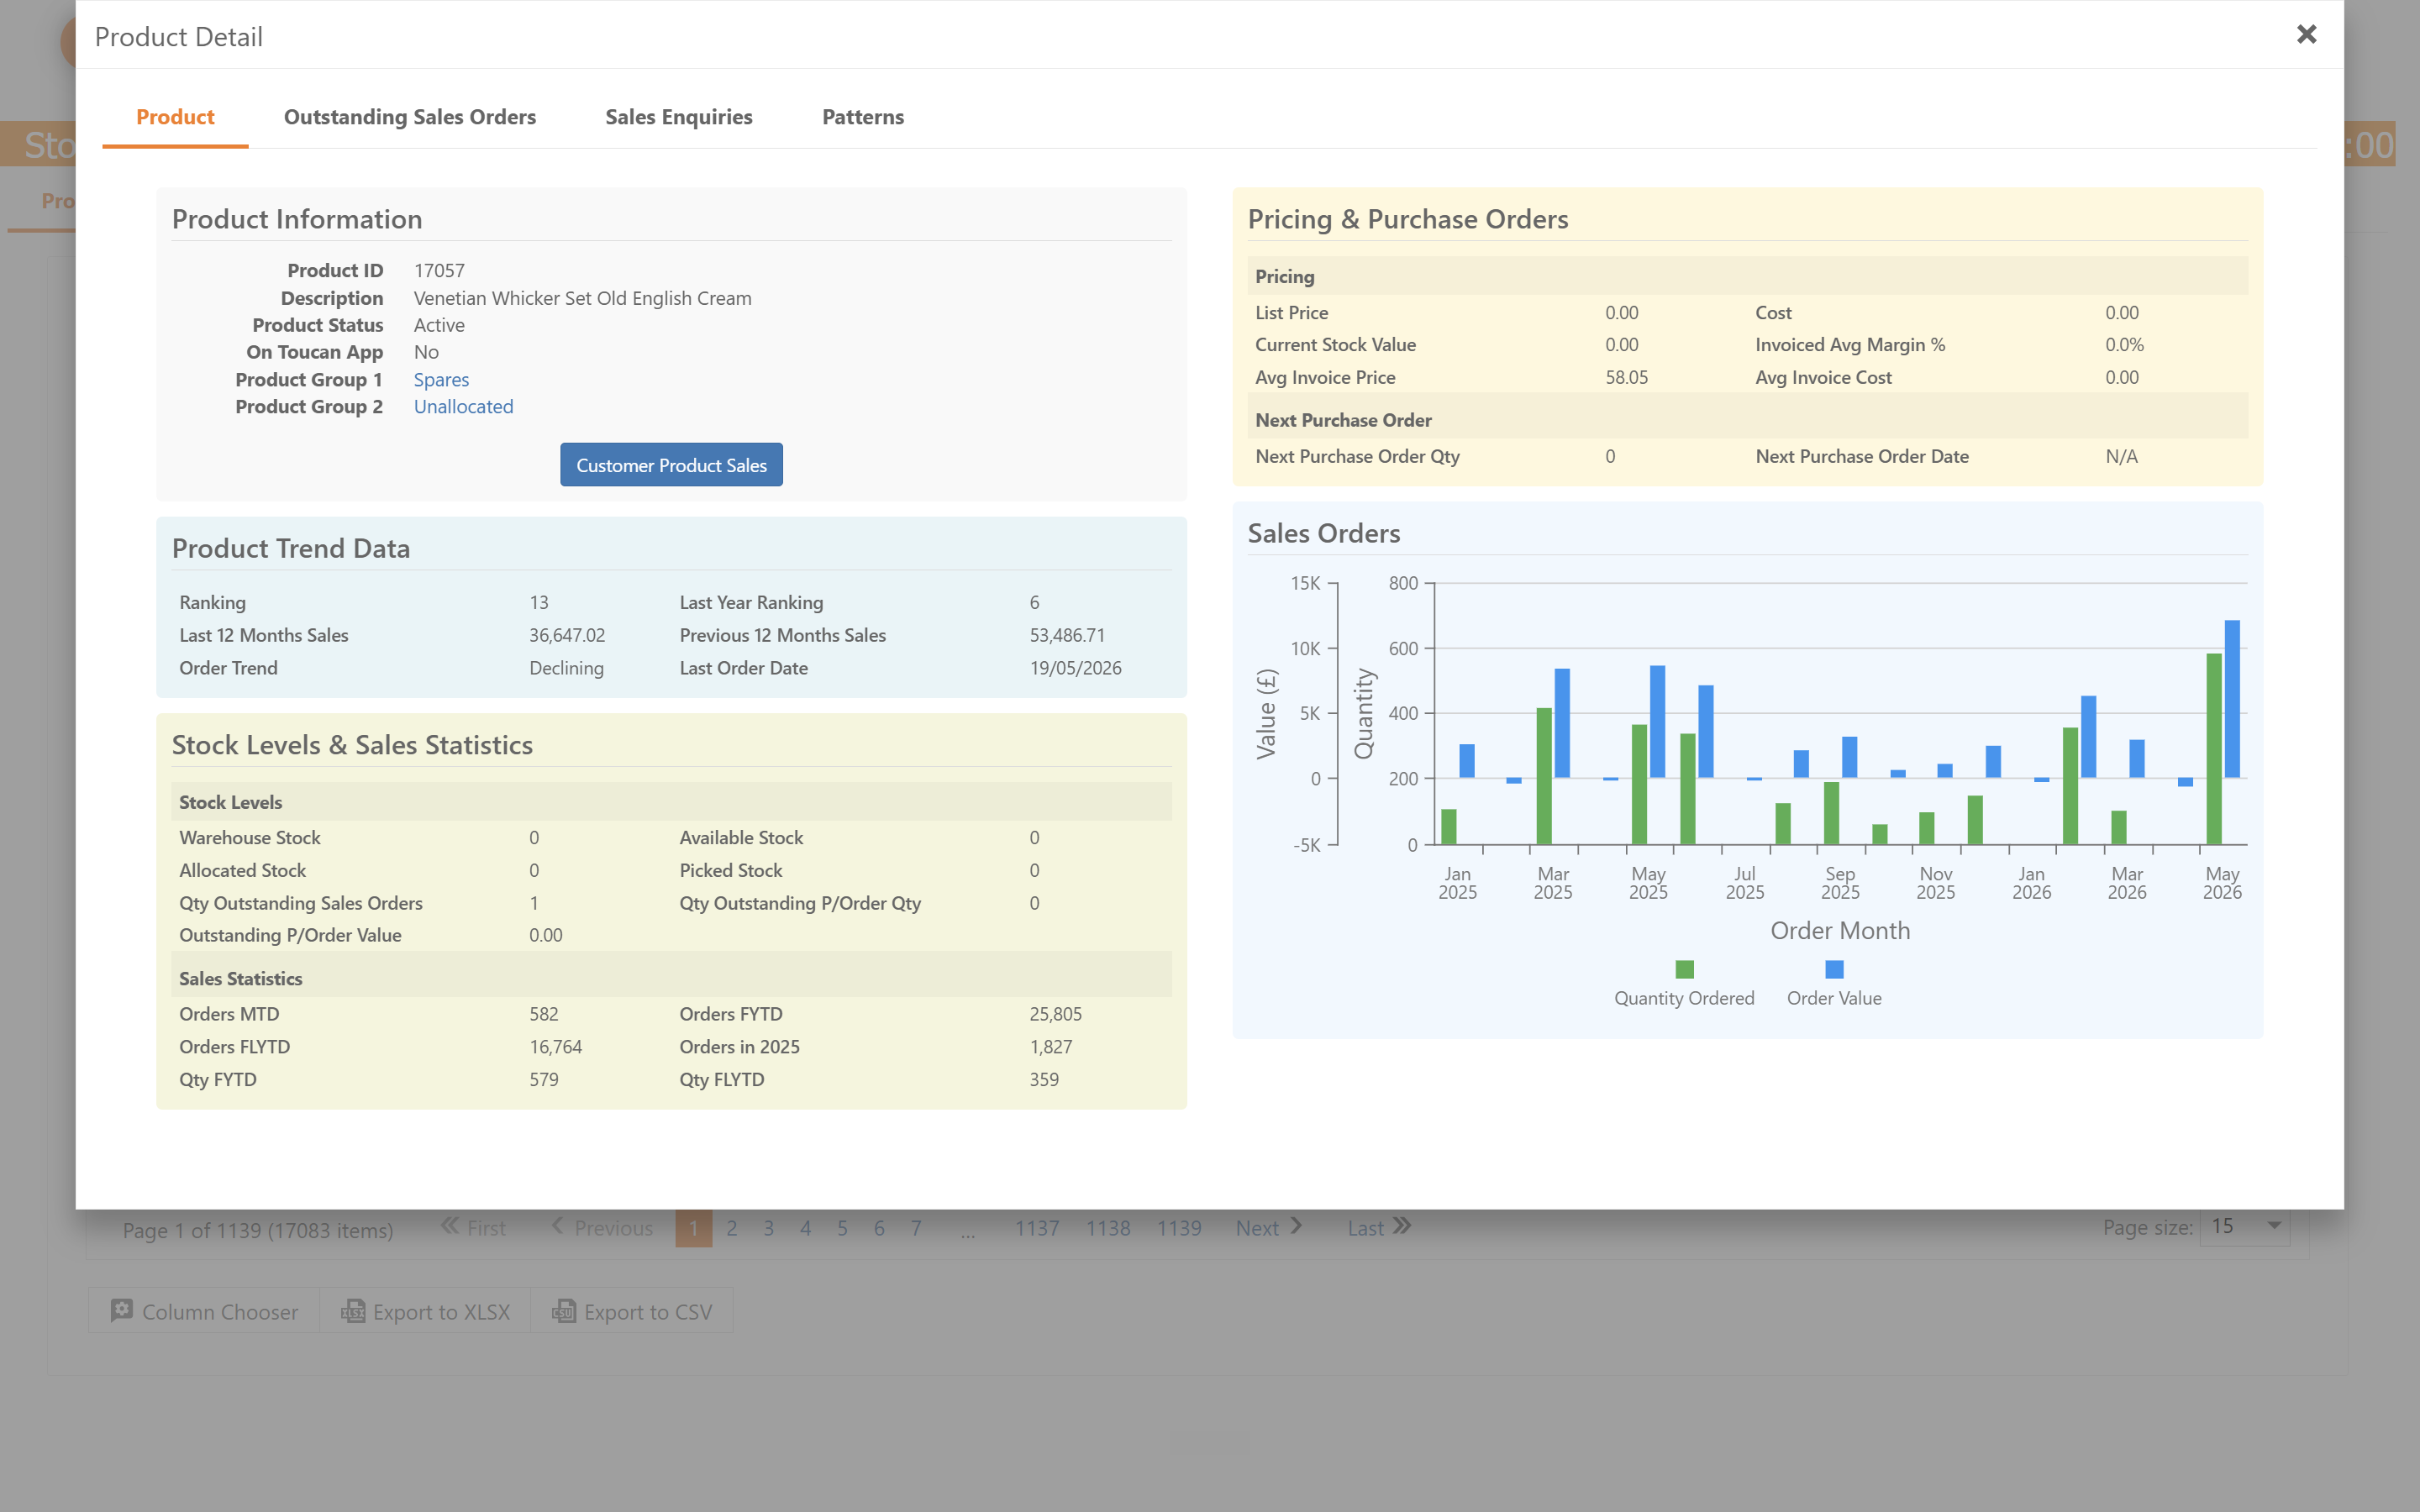
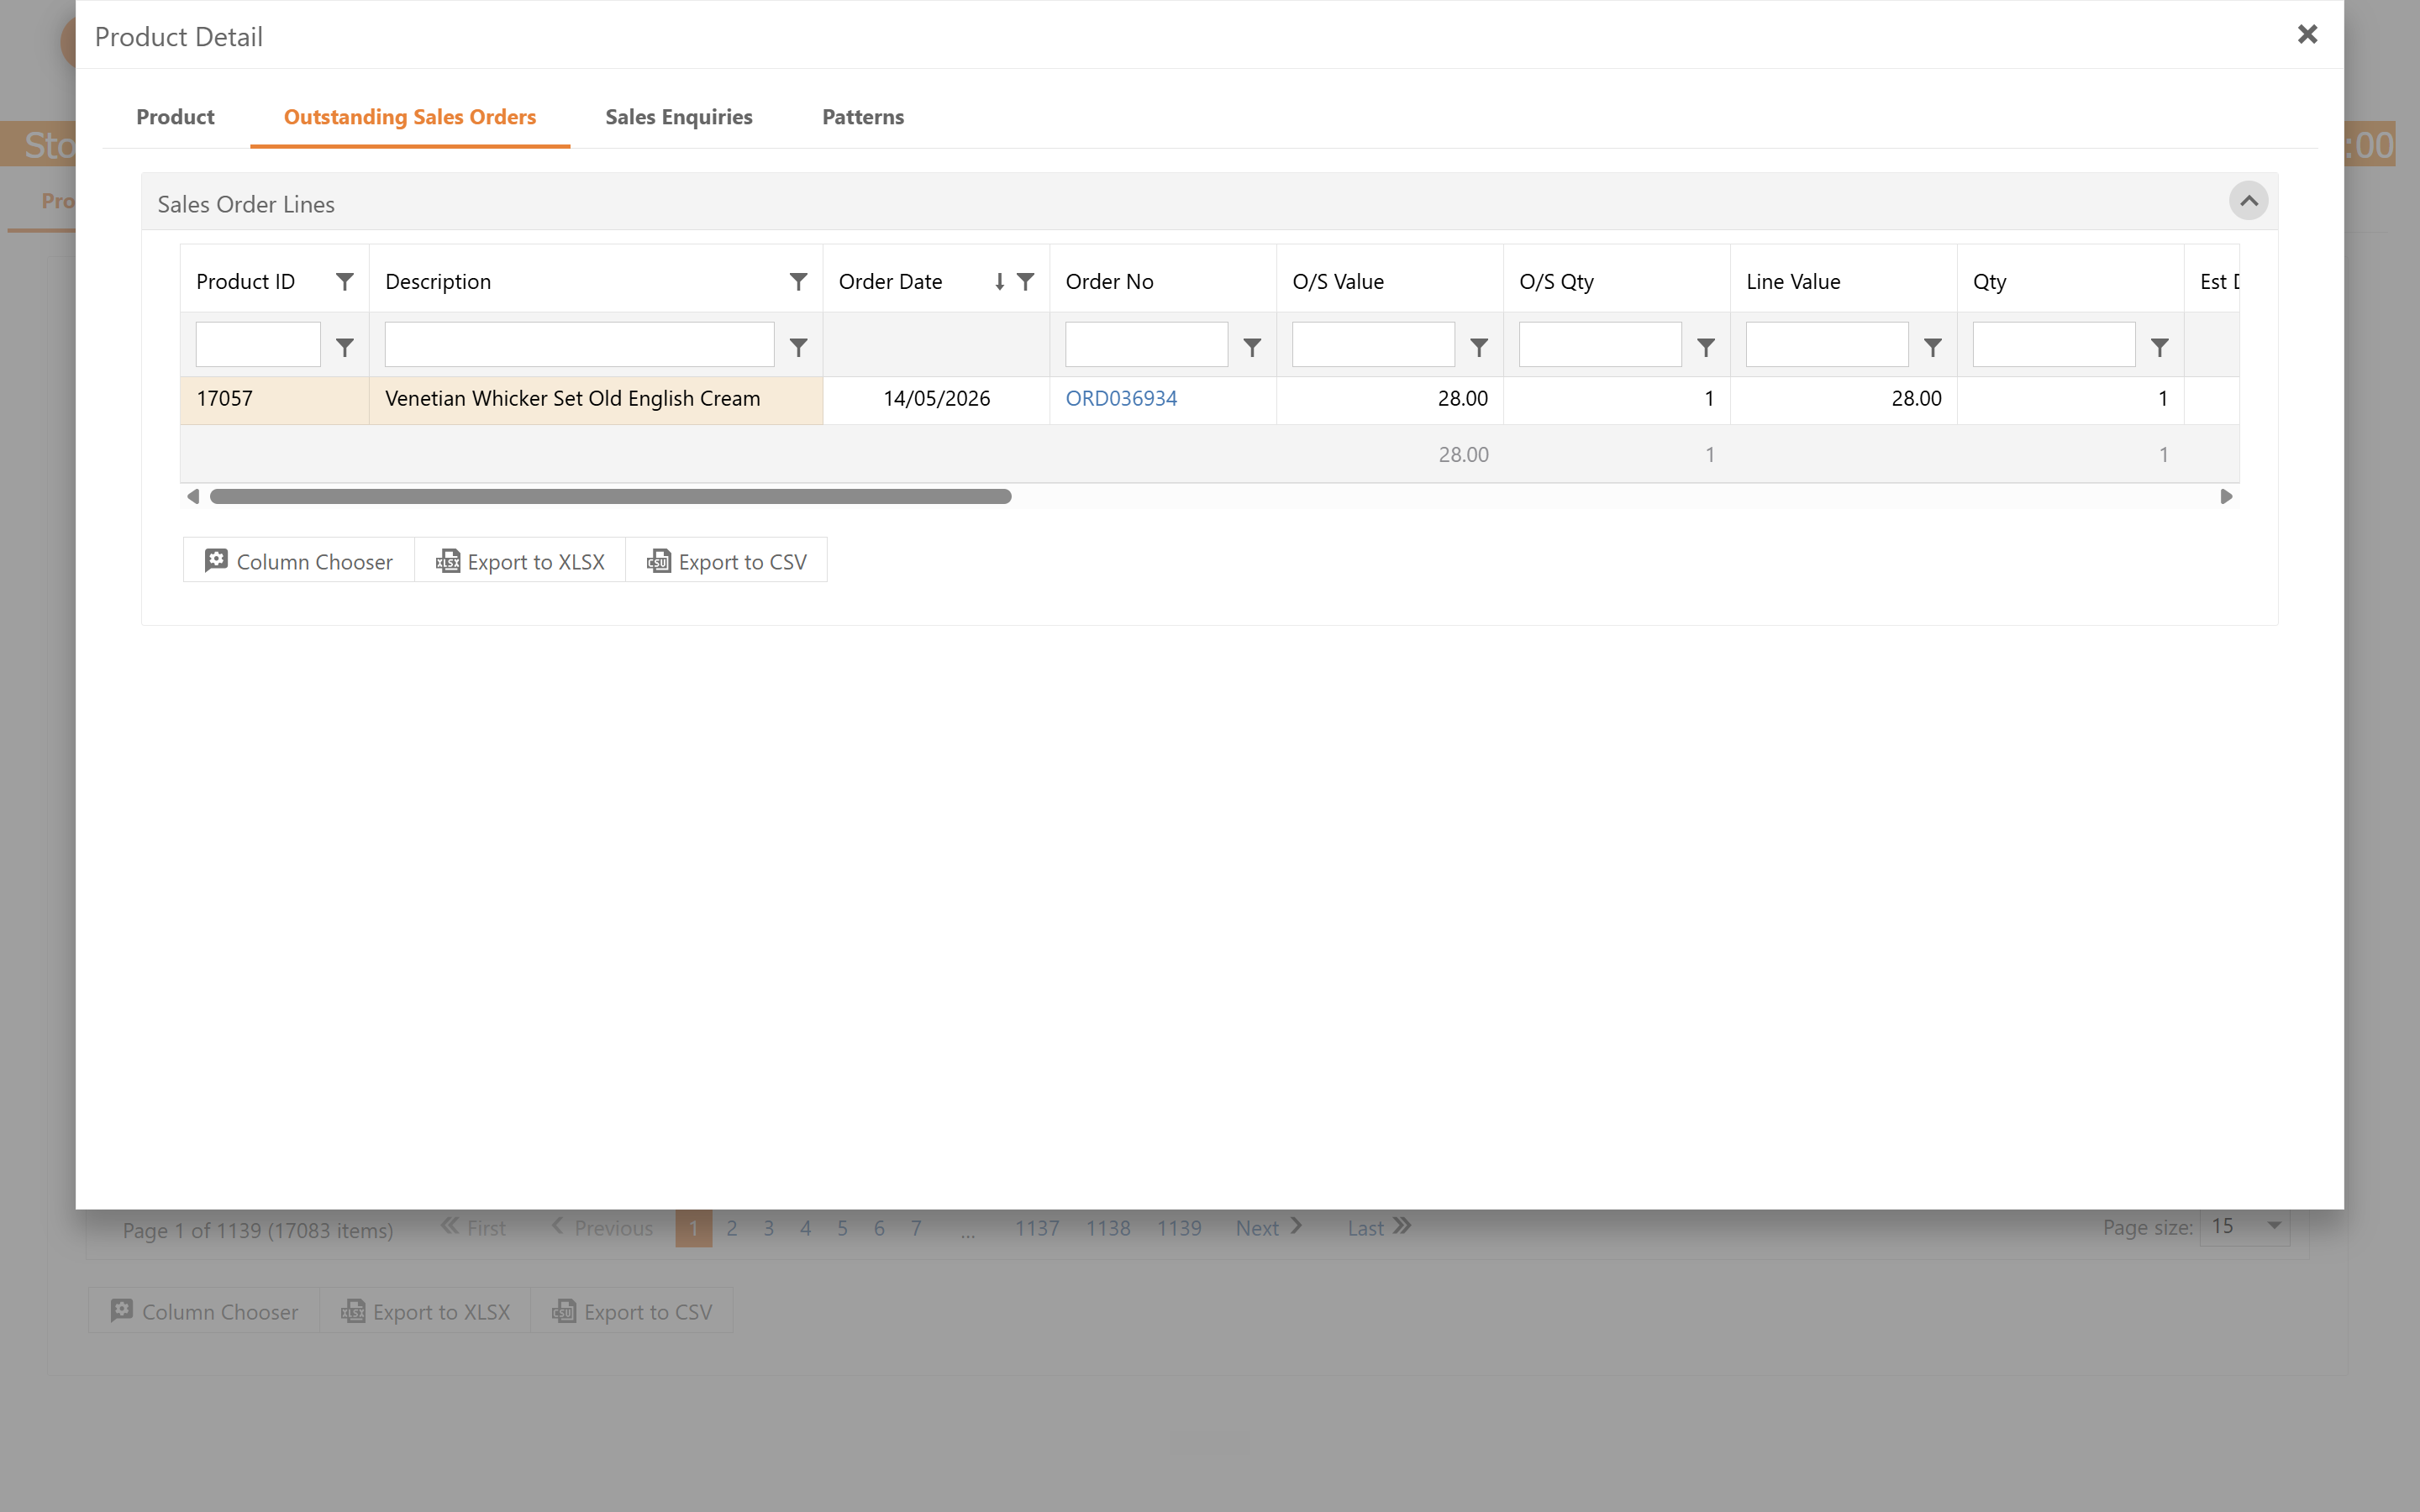
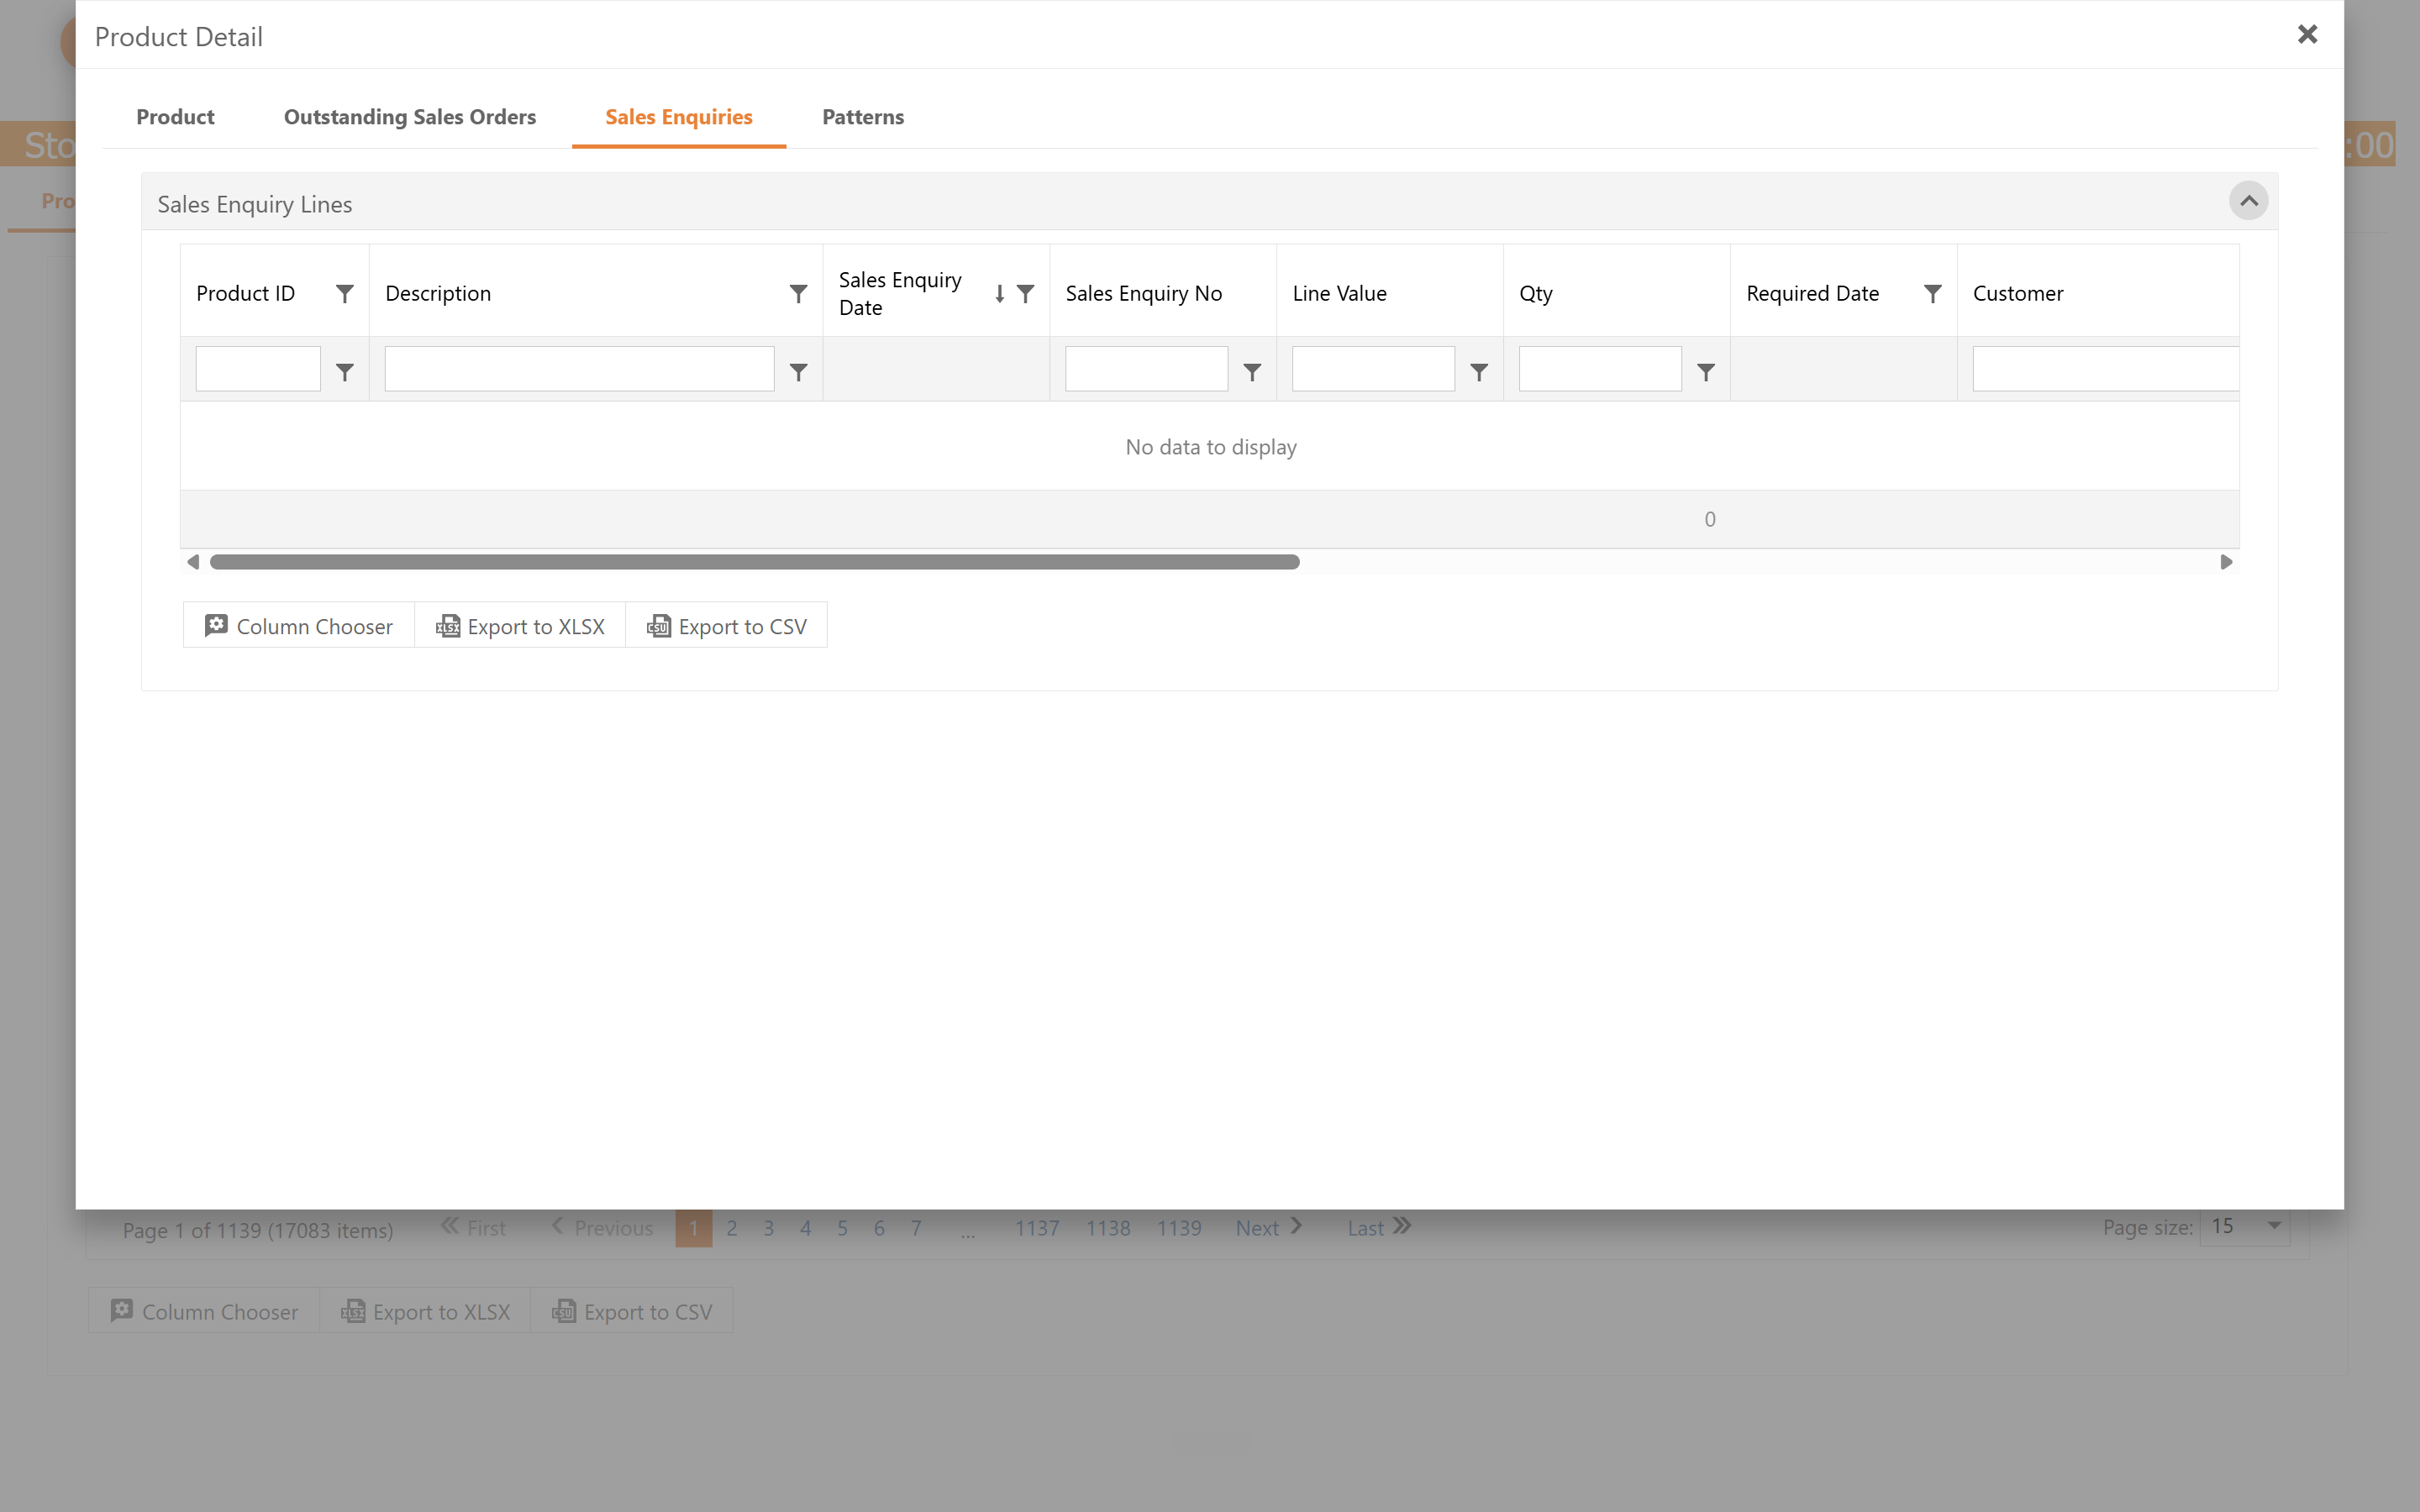
For a comprehensive look at a product's statistics, open the Product Detail modal. The modal organises metrics into several distinct tabs:
Detail Tab | Purpose |
|---|---|
Customer Product Sales | Highlights product information, pricing & purchase orders, product trend date, sales orders and stock levels. |
Outstanding Sales Orders | Displays a filtered table of pending order line items. |
Sales Enquiries | Shows any logged enquiries for this product. |
Patterns | Analyse order patterns and invoice patterns in one clear view. |
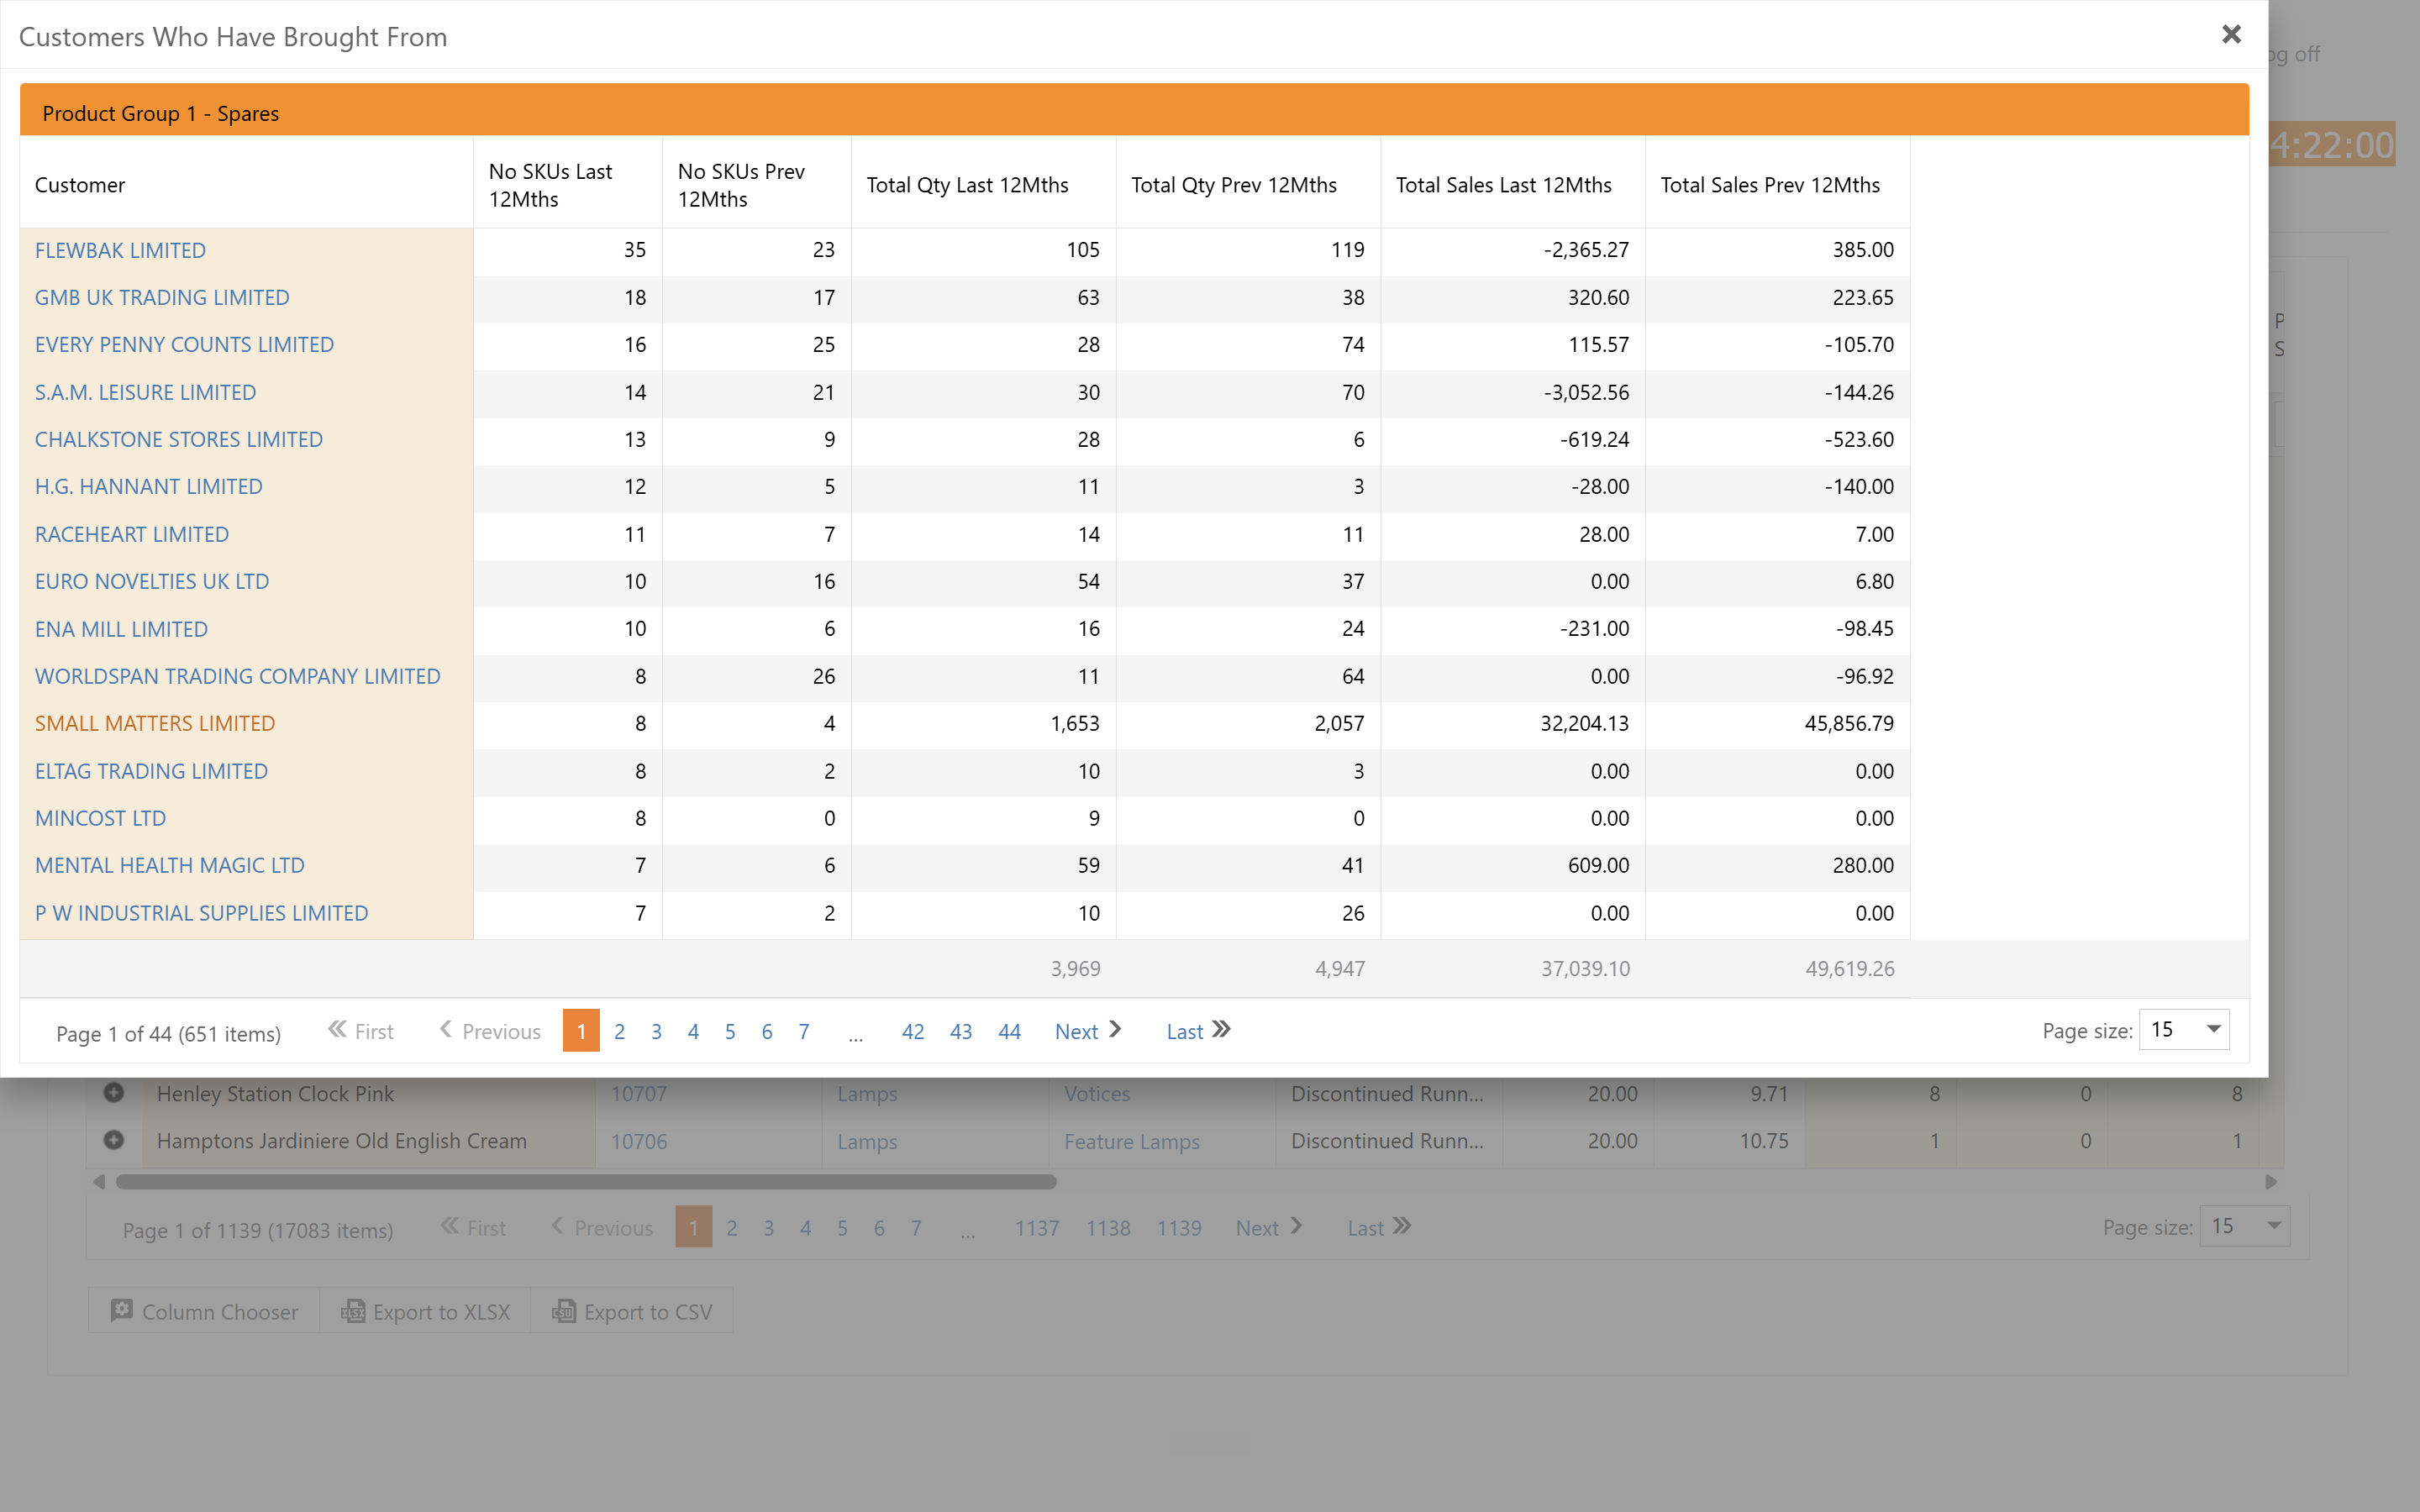
Analyse Customer Purchase Data
If you need to view customers who have placed orders for specific product groups, click one of the categories from this table.
Review Product Order Trends
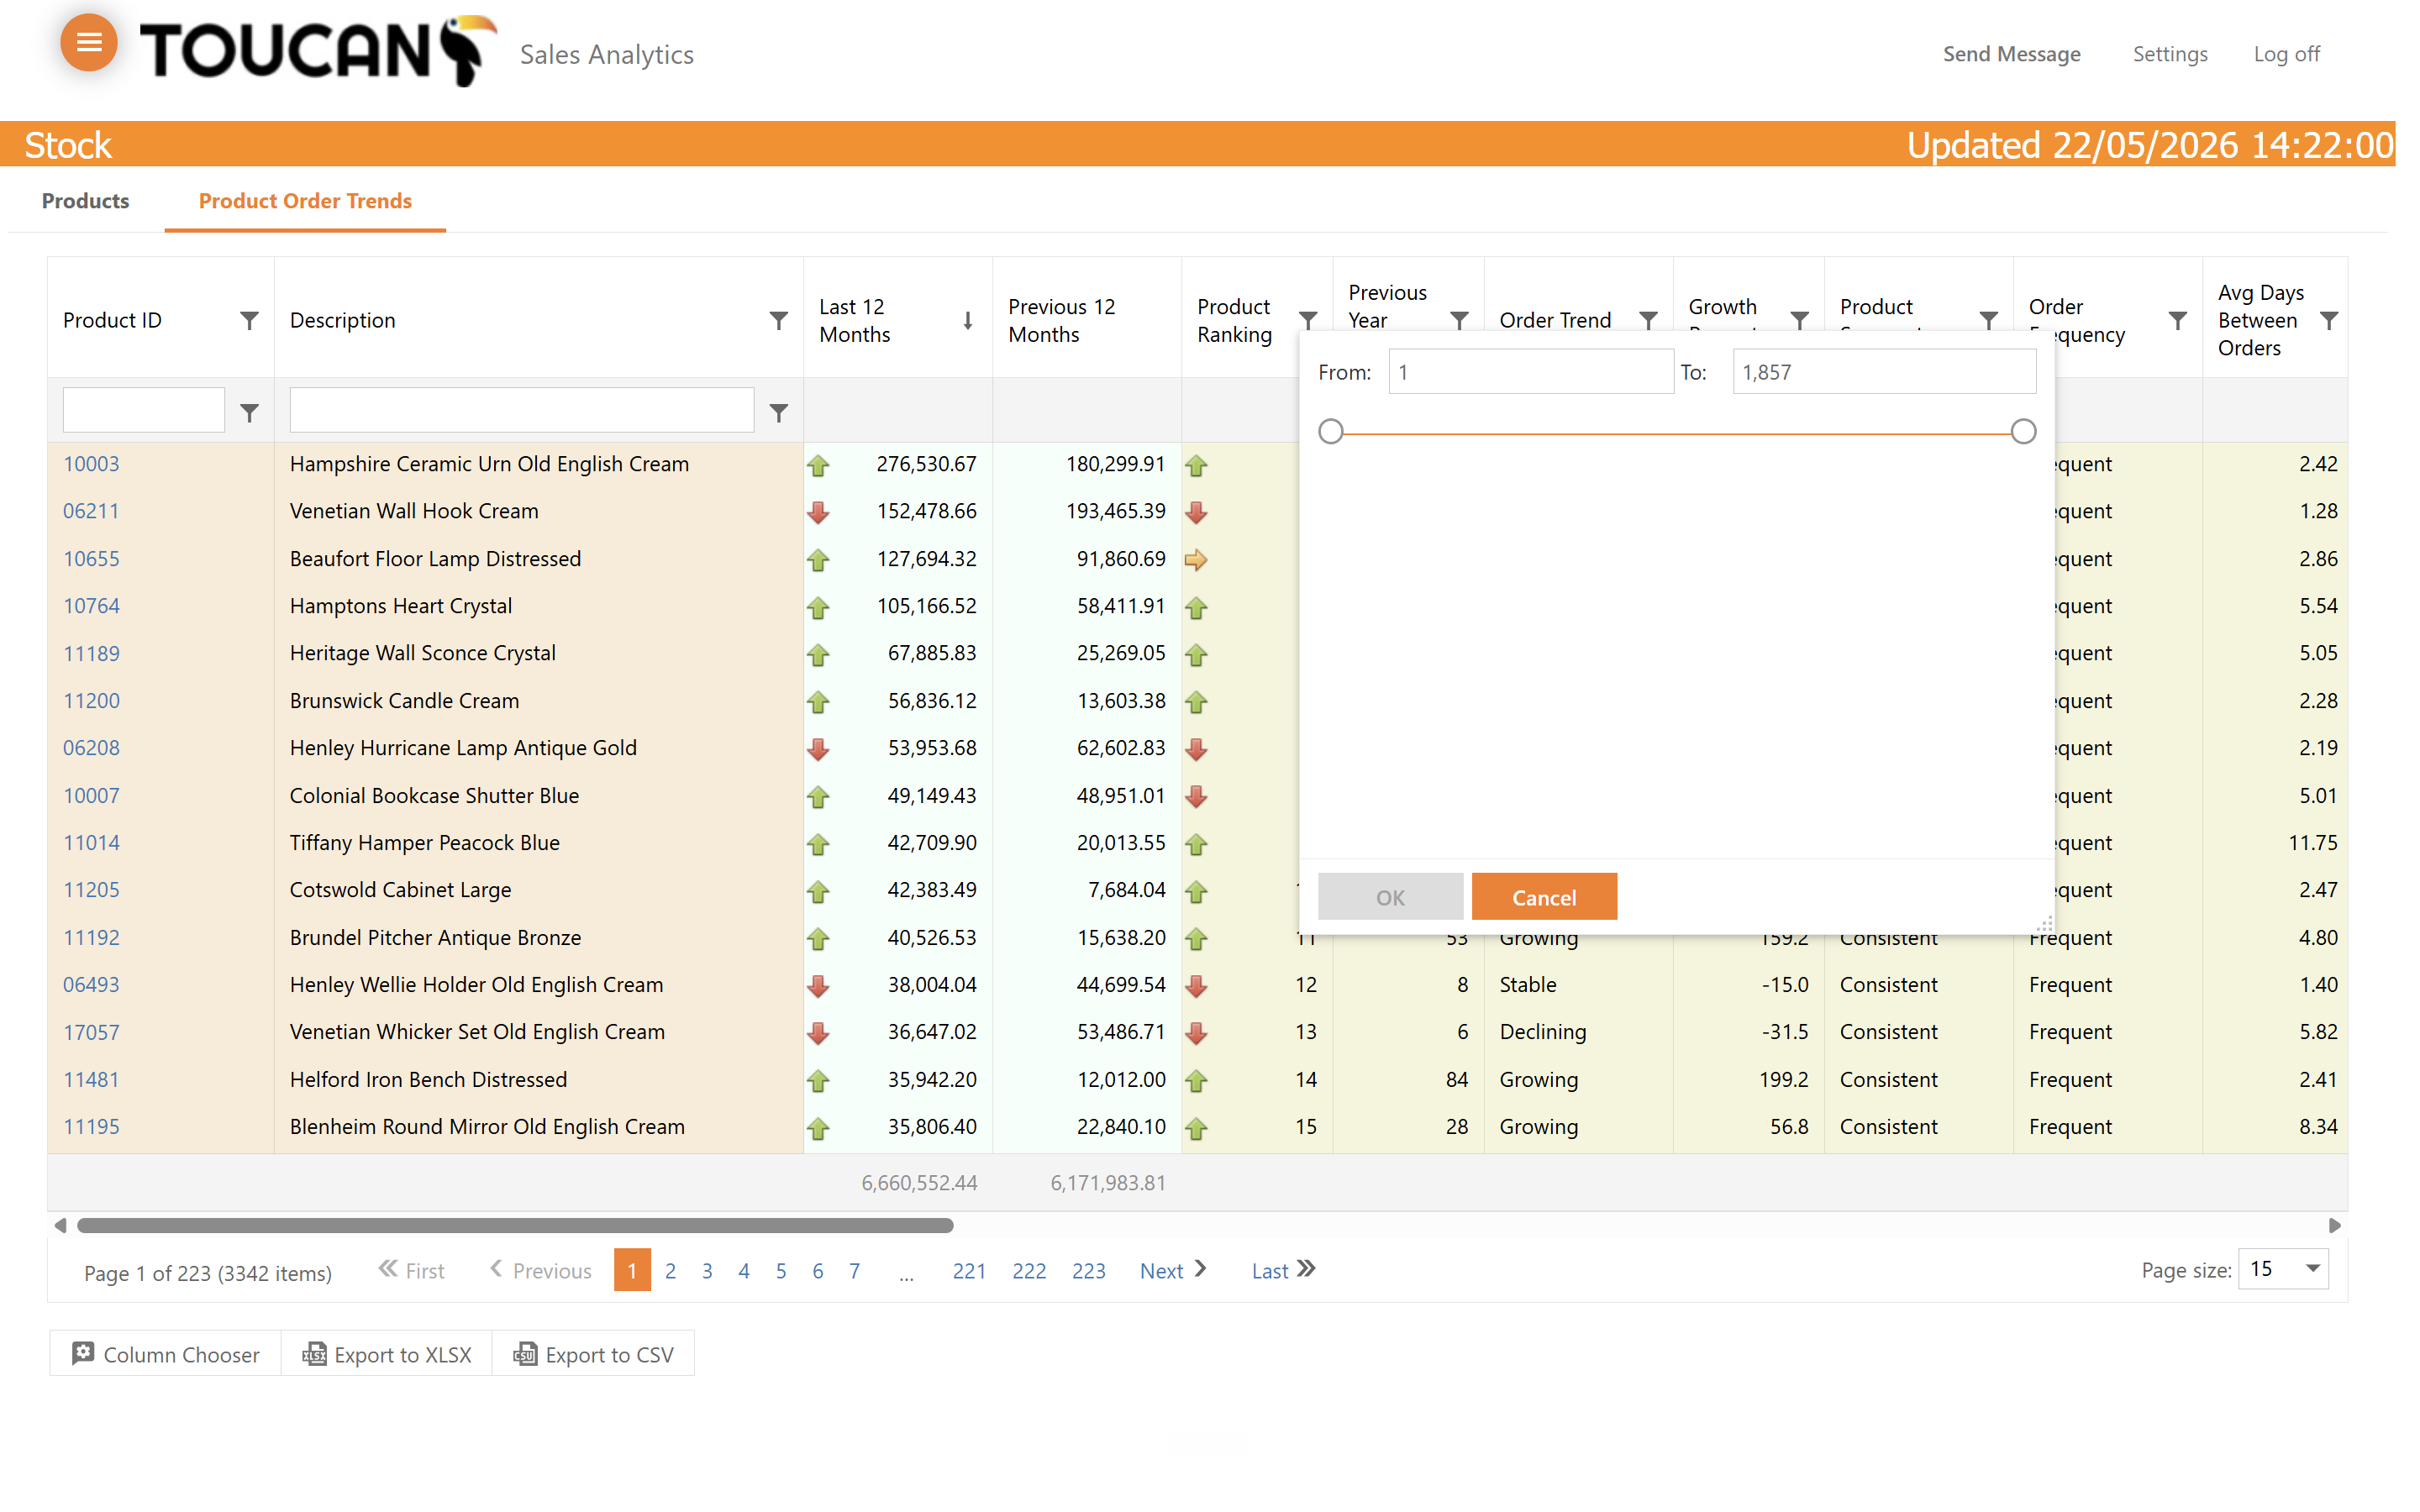
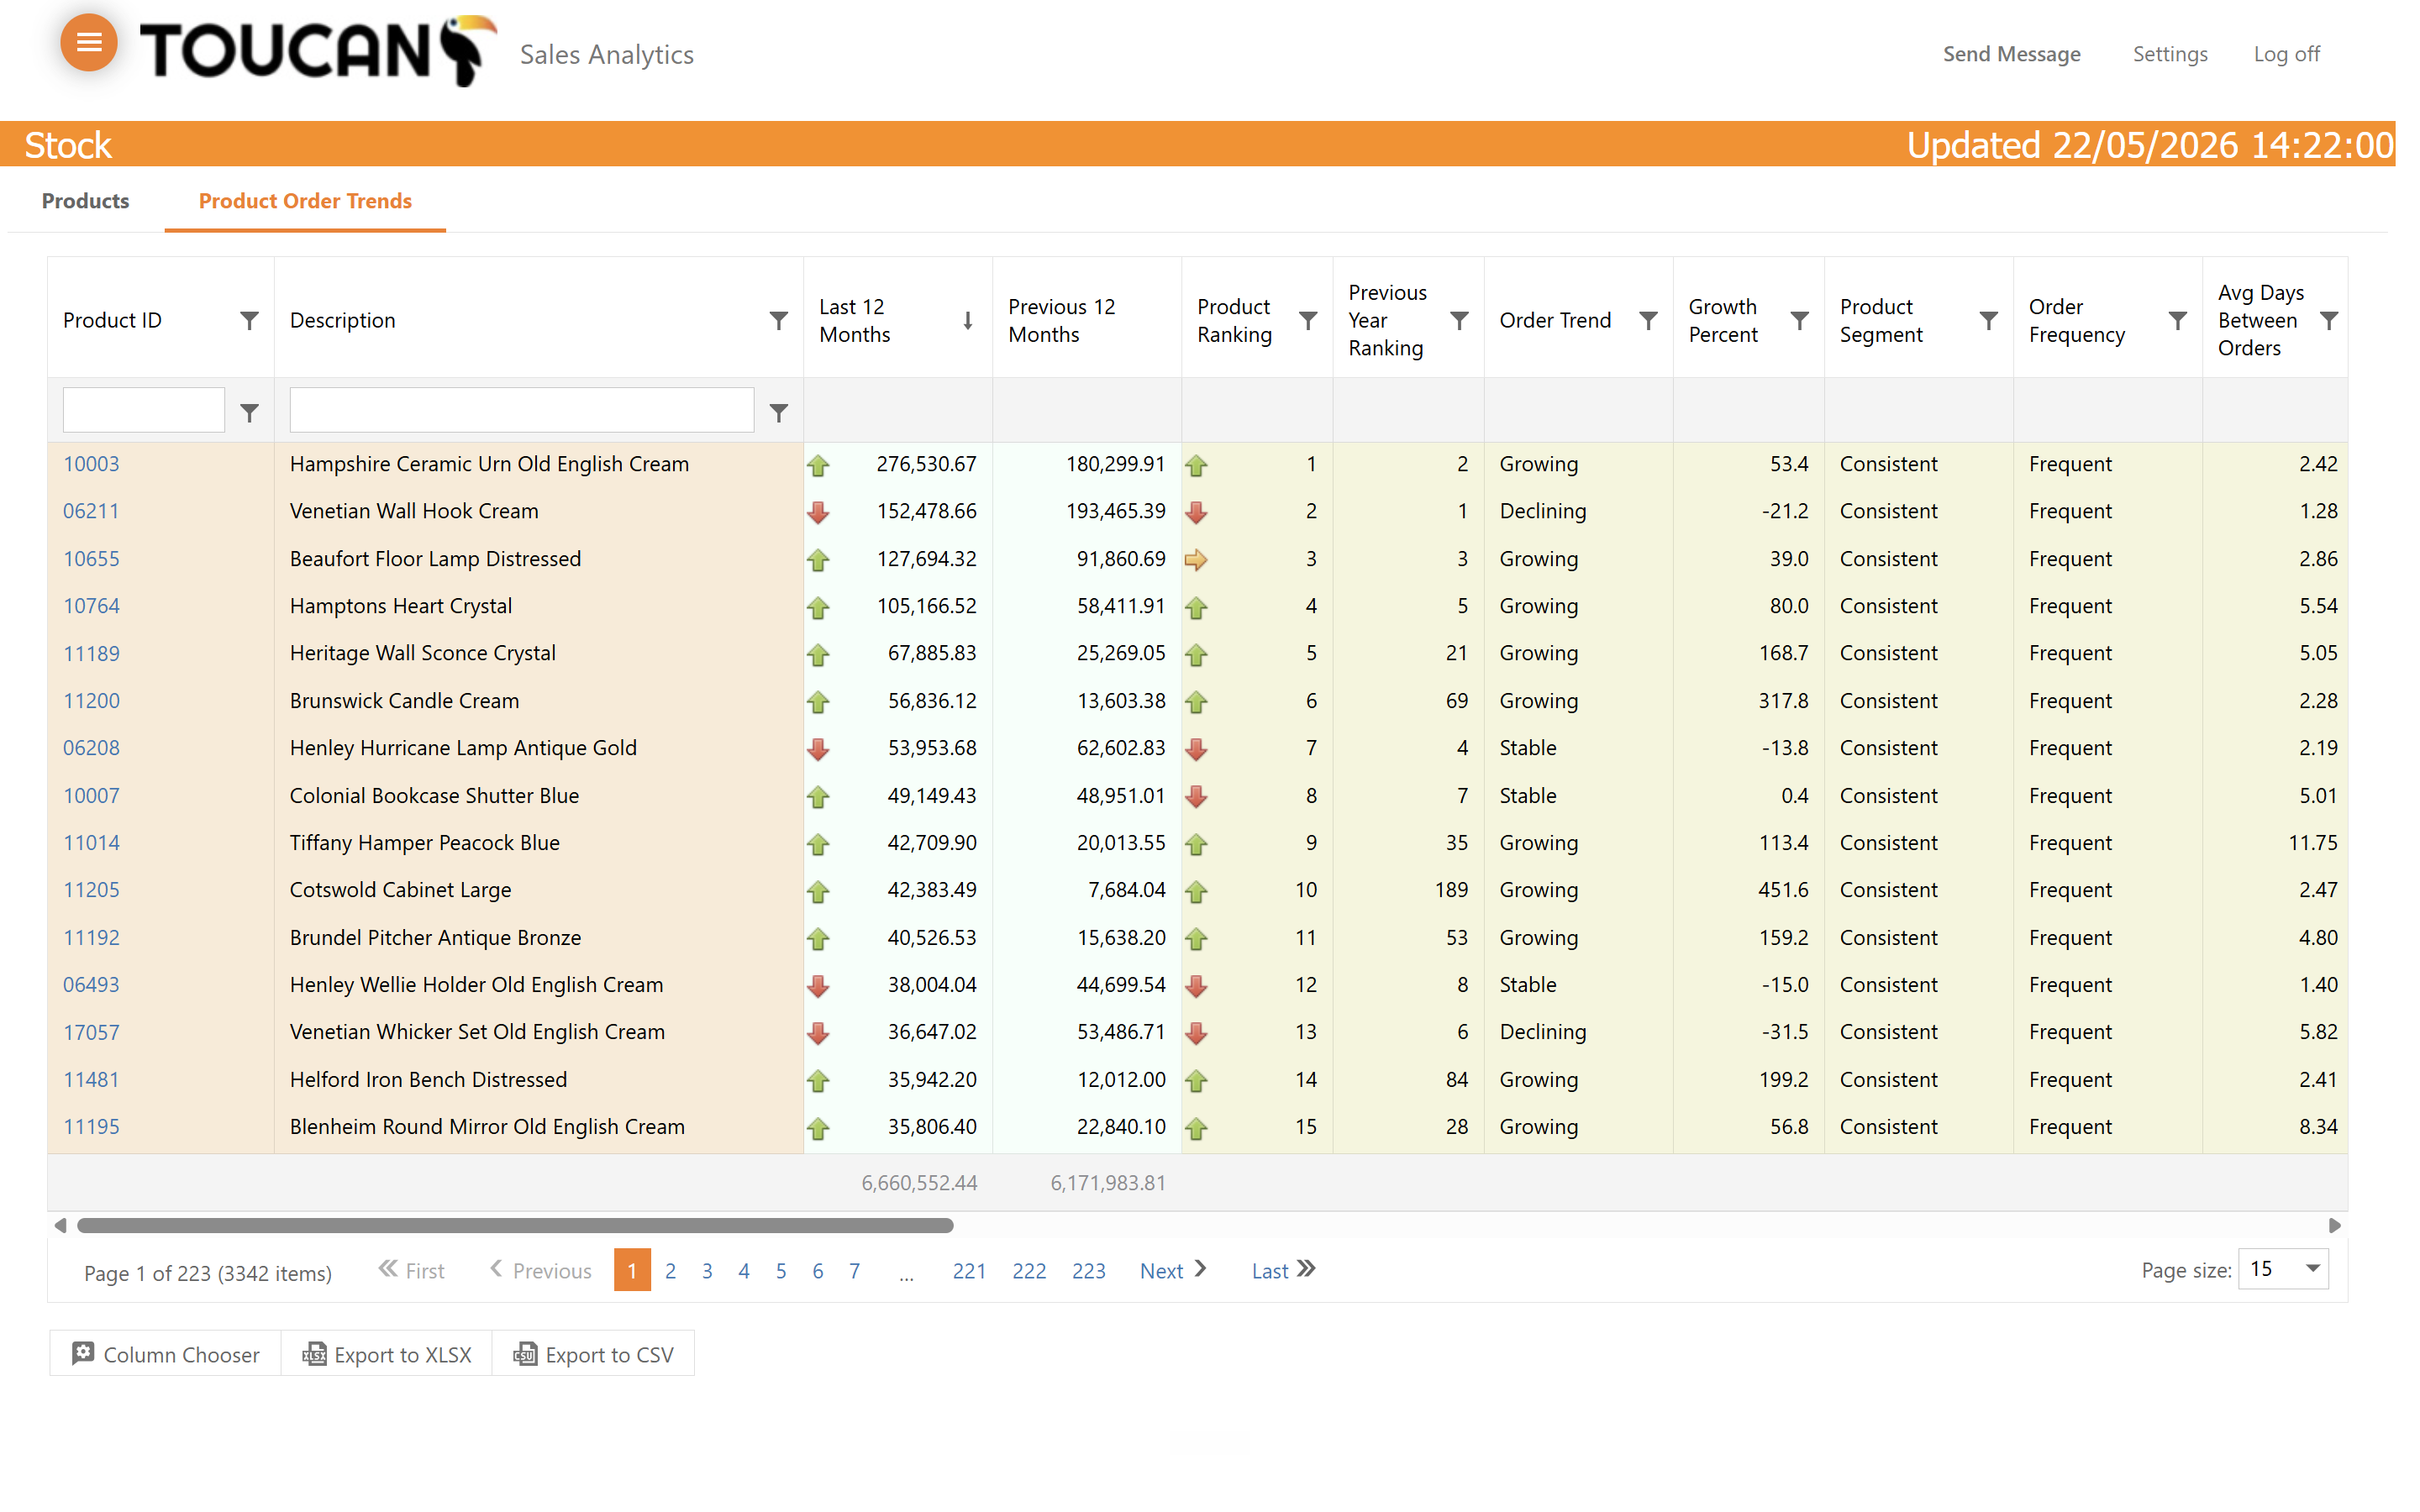
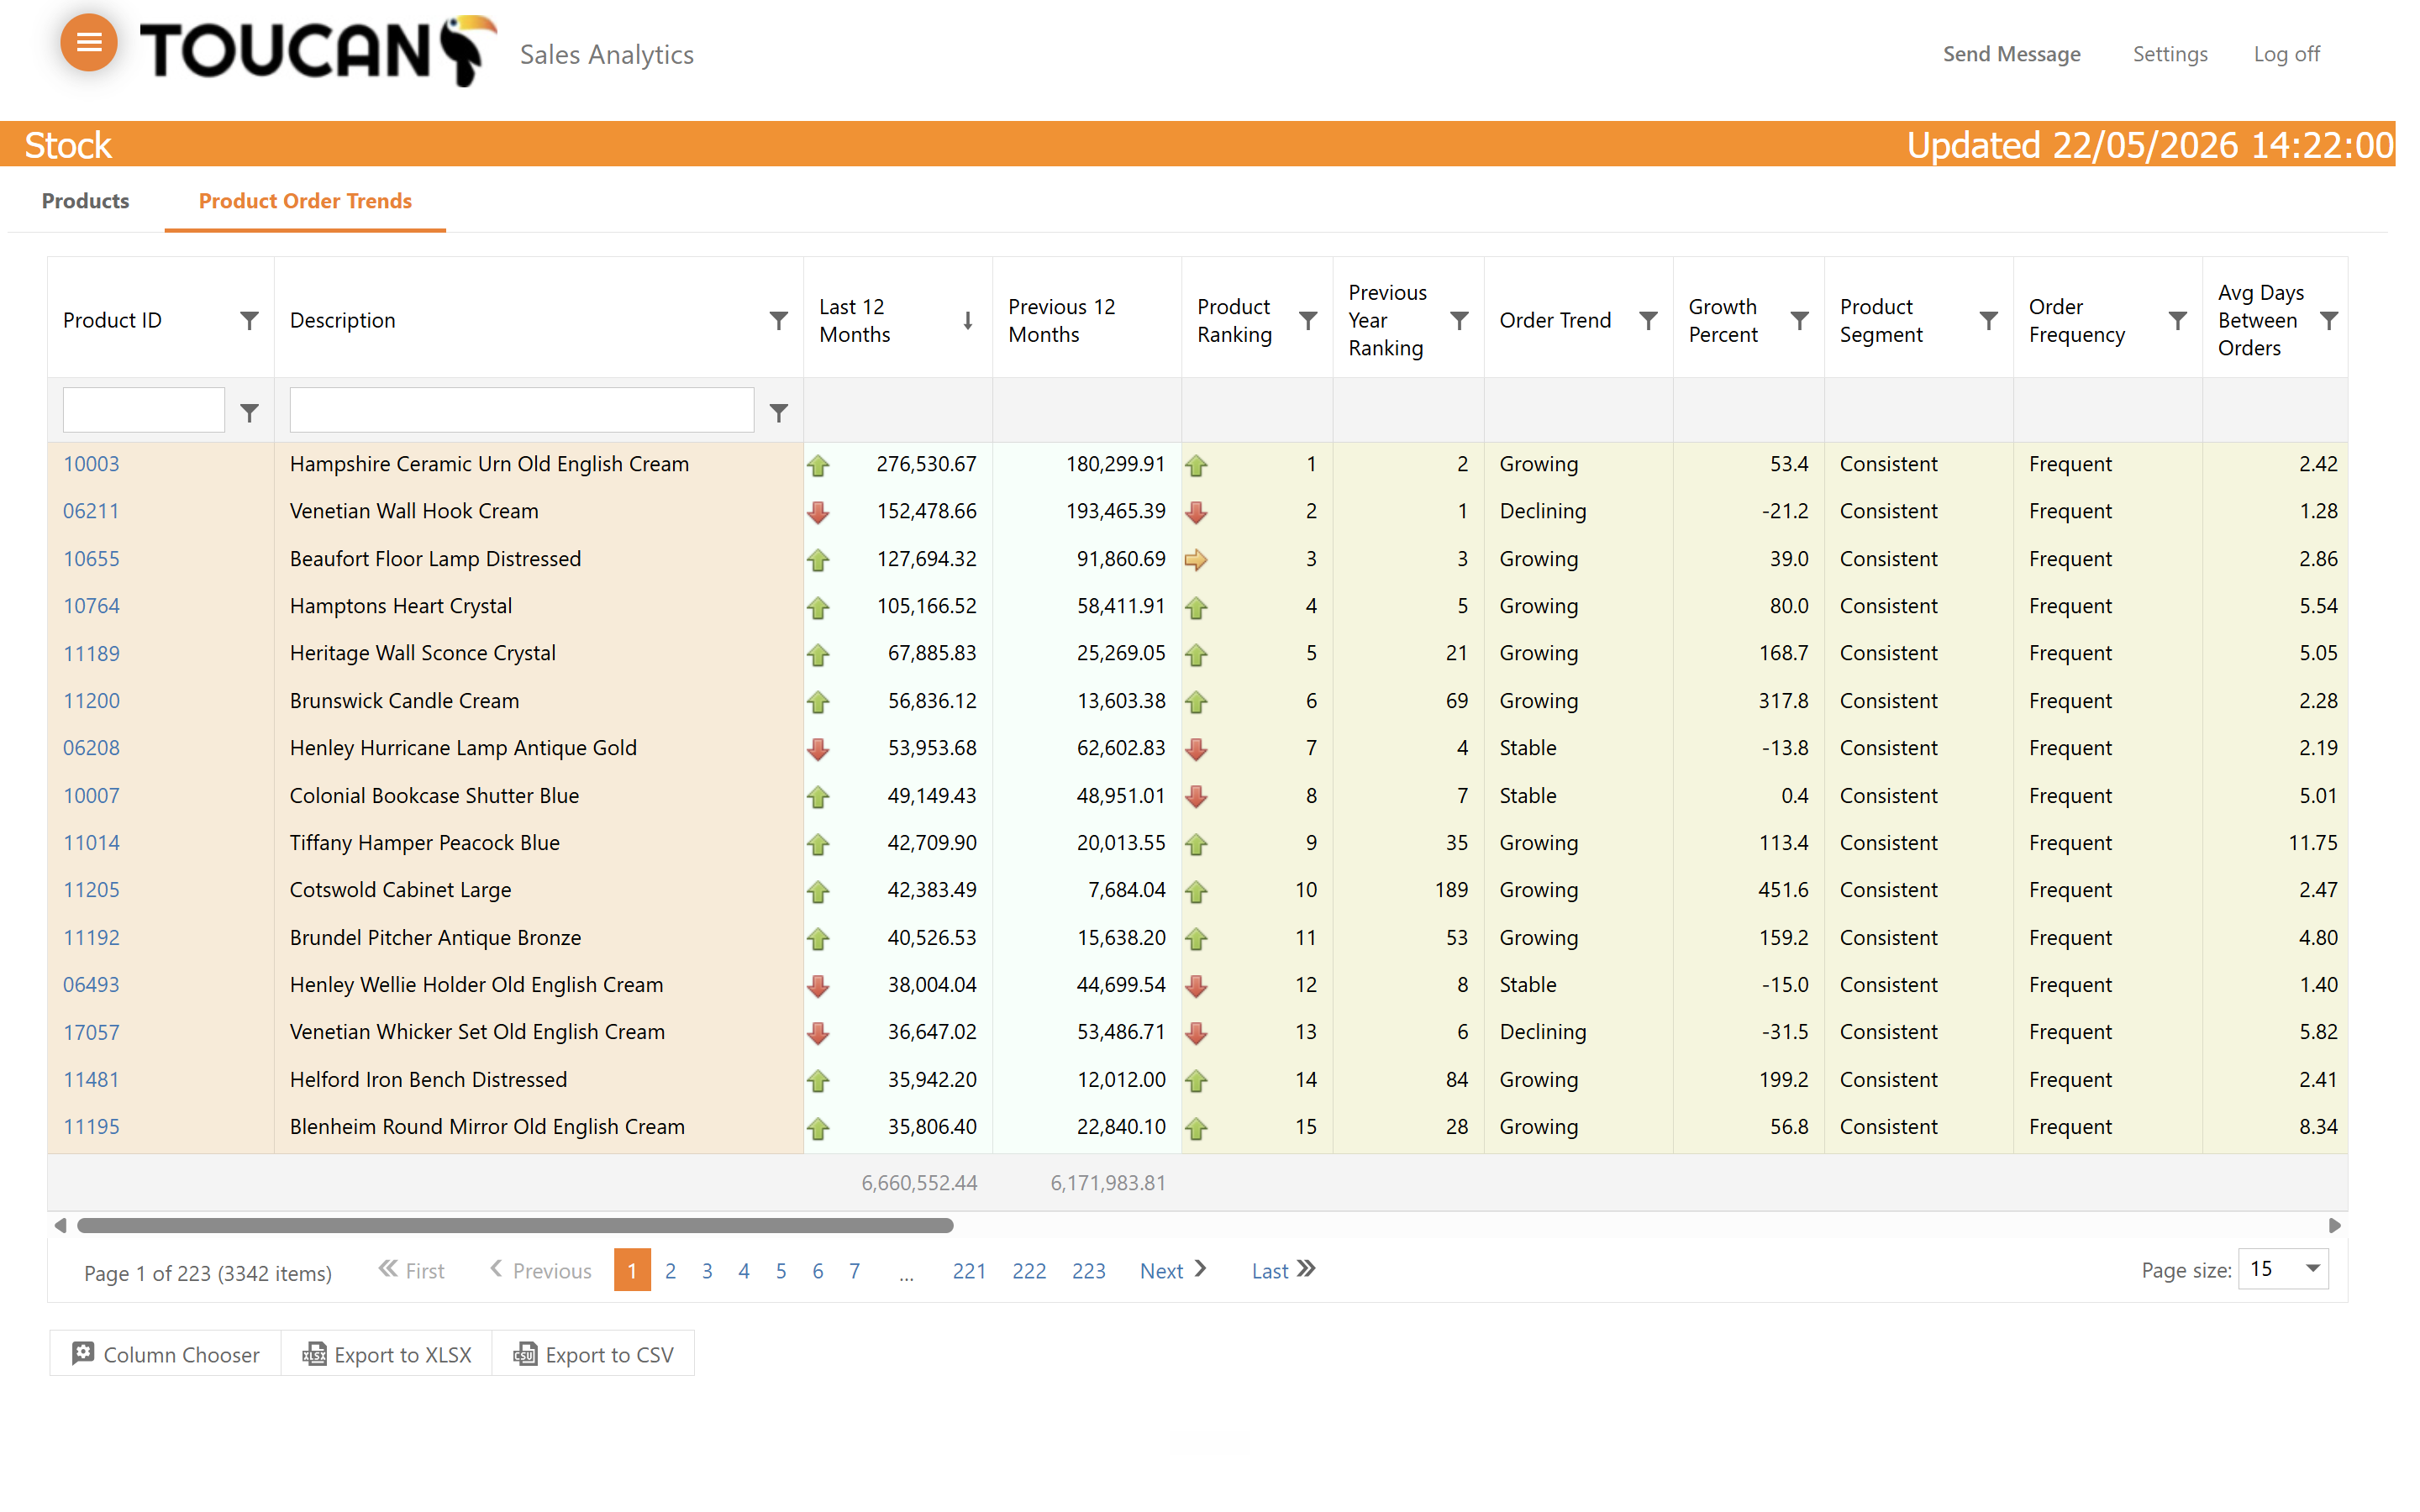
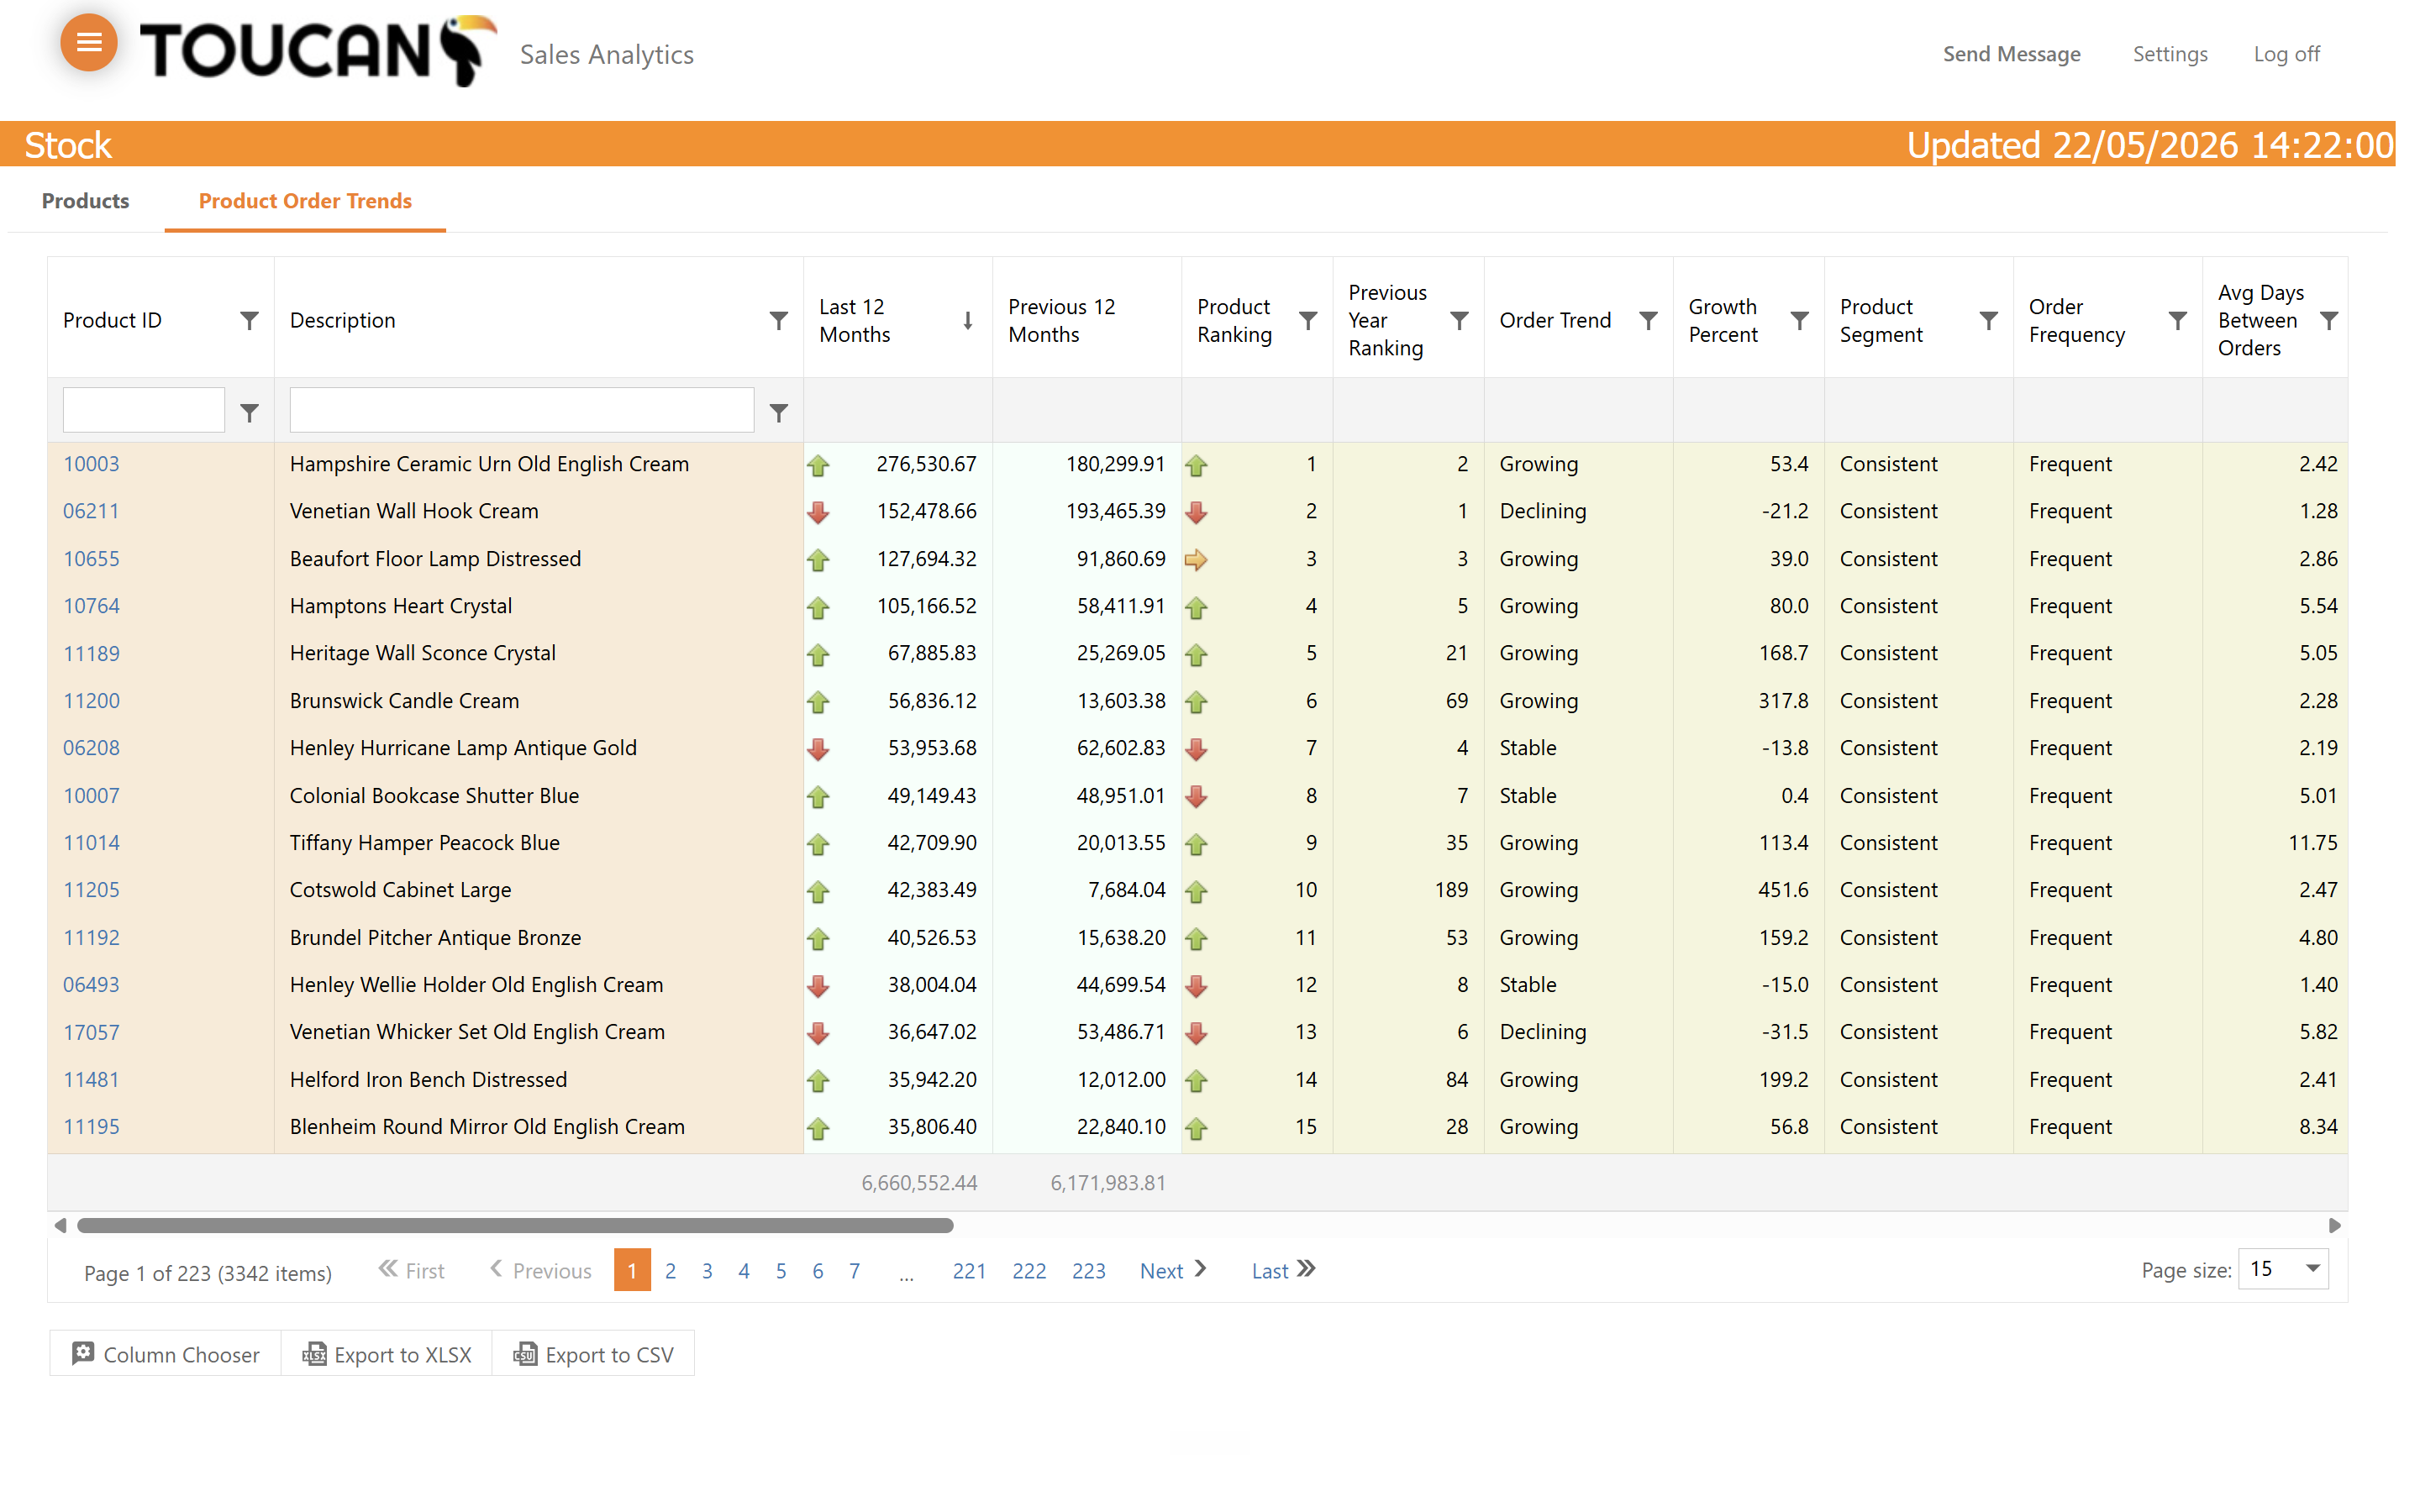
The Product Order Trends tab is useful for identifying historical trends and forecasting future order trends of every product you stock. The table is data-heavy but offers detailed filtering to find the product trends you require based on a mixture of metrics.
Q: How do I view historical data for specific months?
A: Open the Product Details modal and navigate to the Patterns tab, which breaks down both order and invoice histories by specific months and years.
Q: Can I customise which data columns are visible in the main table?
A: Yes. Click the "Column Chooser" button at the bottom of the table to open a checklist where you can toggle the visibility of individual columns based on your reporting needs.
Q: Why would I use the row expansion button instead of opening the product detail modal?
A: Expanding the row allows you to quickly preview order patterns and invoice tables without leaving your broader view of the overall inventory list.