
How to Analyze Customer Orders by Market and Order Channel
Learn how to gather and analyze customer order data from various markets using a step-by-step approach. This guide covers accessing reports, manipulating data, and identifying key customers.
In this guide, we'll learn how to extract and analyze order data from a report designed for different markets and order channels. Although the report is not specifically intended for this purpose, it can be adapted to meet your needs. You'll need a BWP login to access the report, after which you can select the desired months and market codes.
Once the data is extracted, we'll cover how to manipulate it in Microsoft Excel by copying it into a new file, adding column headings, and adjusting formats. We'll also create a pivot table to organize and analyze the data, allowing you to identify key customers and their order volumes.
Let's get started
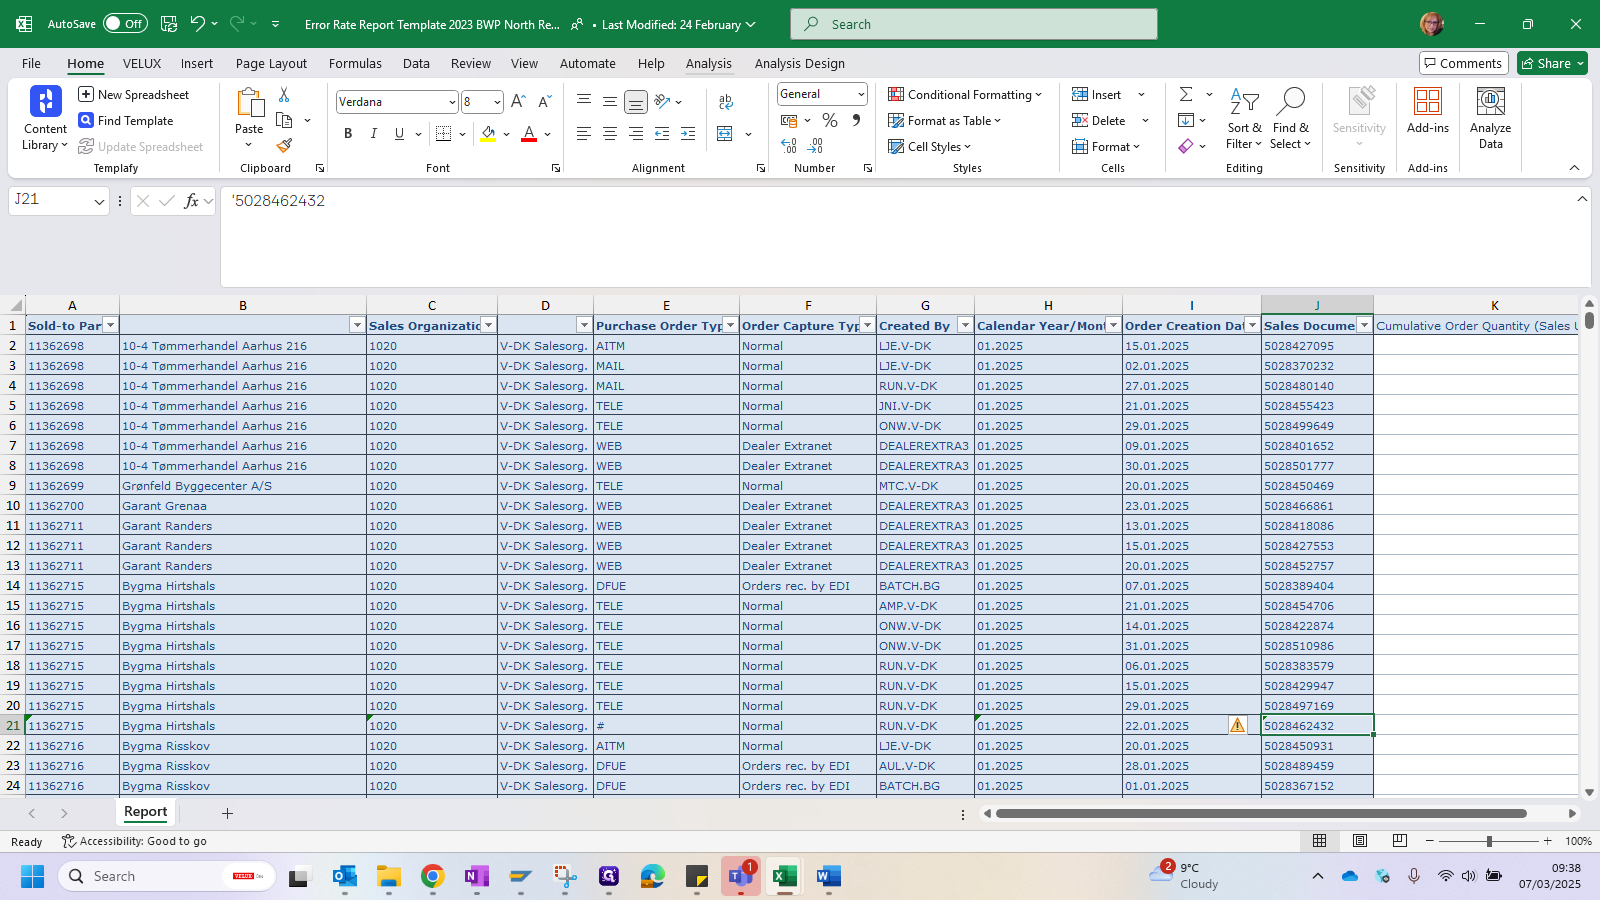
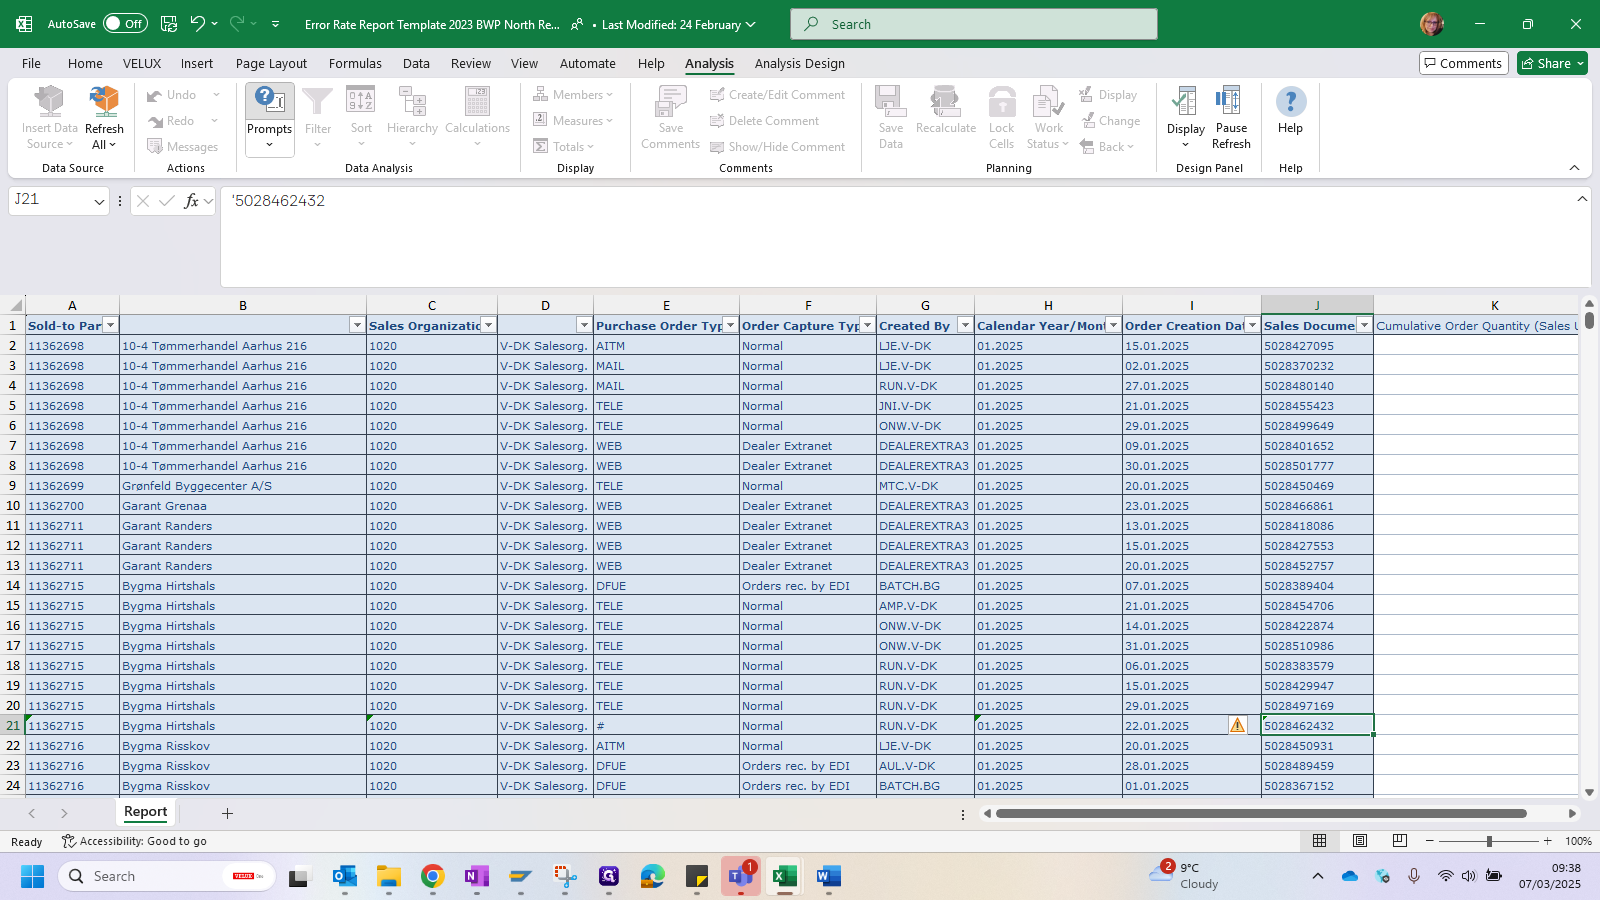
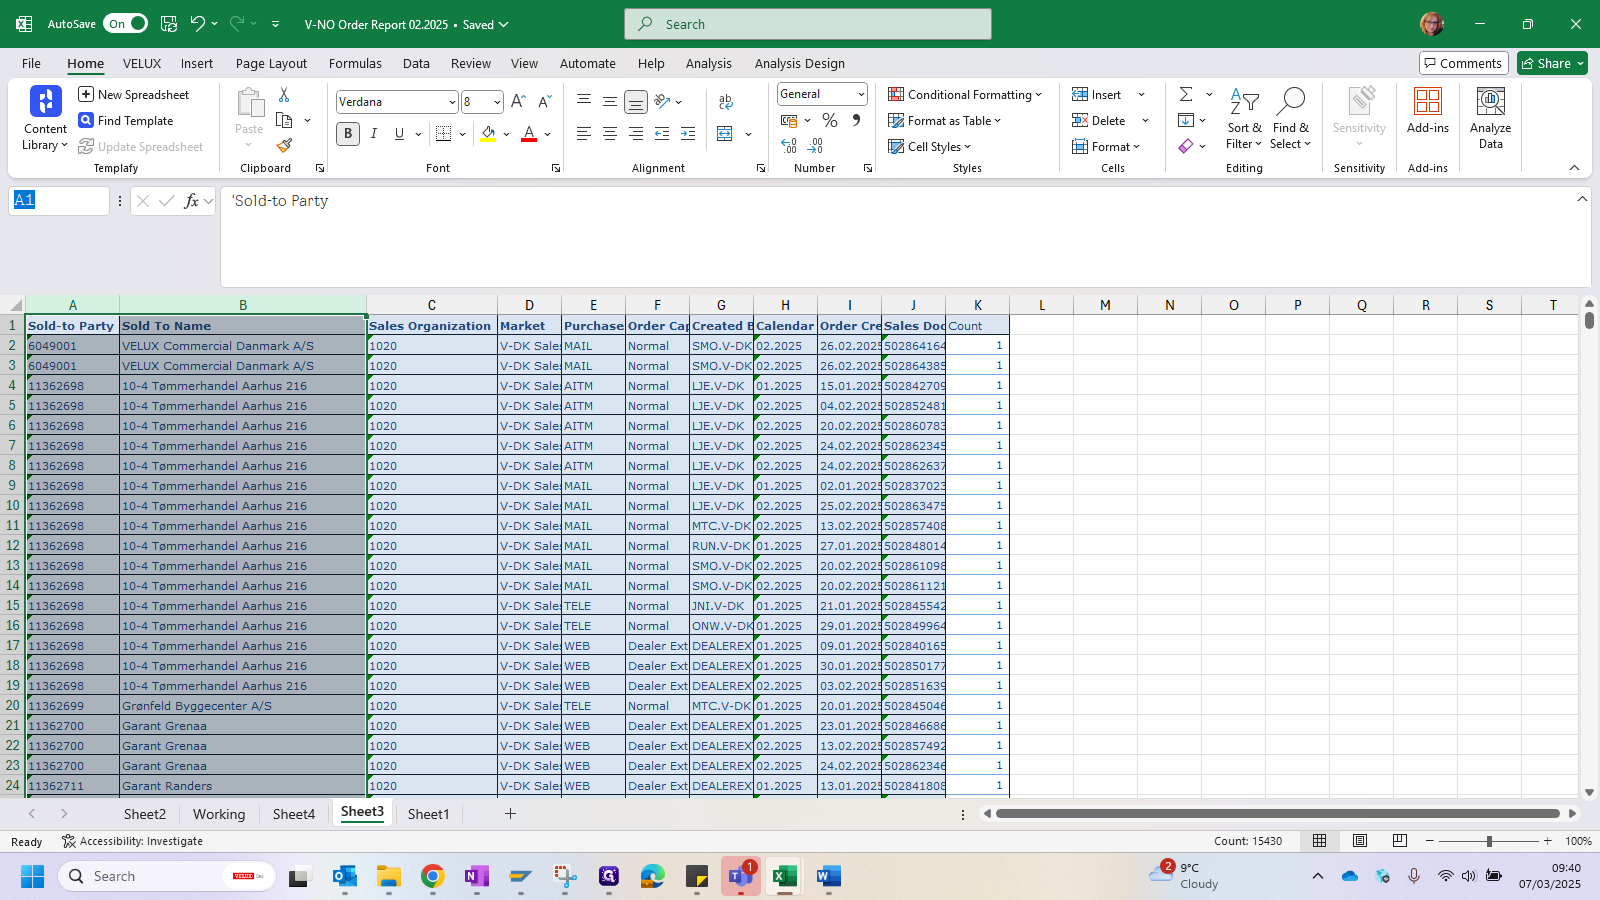
I use this report to gather data on customer orders from various markets by order channel. It's not specifically designed for your intended purpose, but it serves the same function. To use it, click on "Analysis" and then "Prompts."
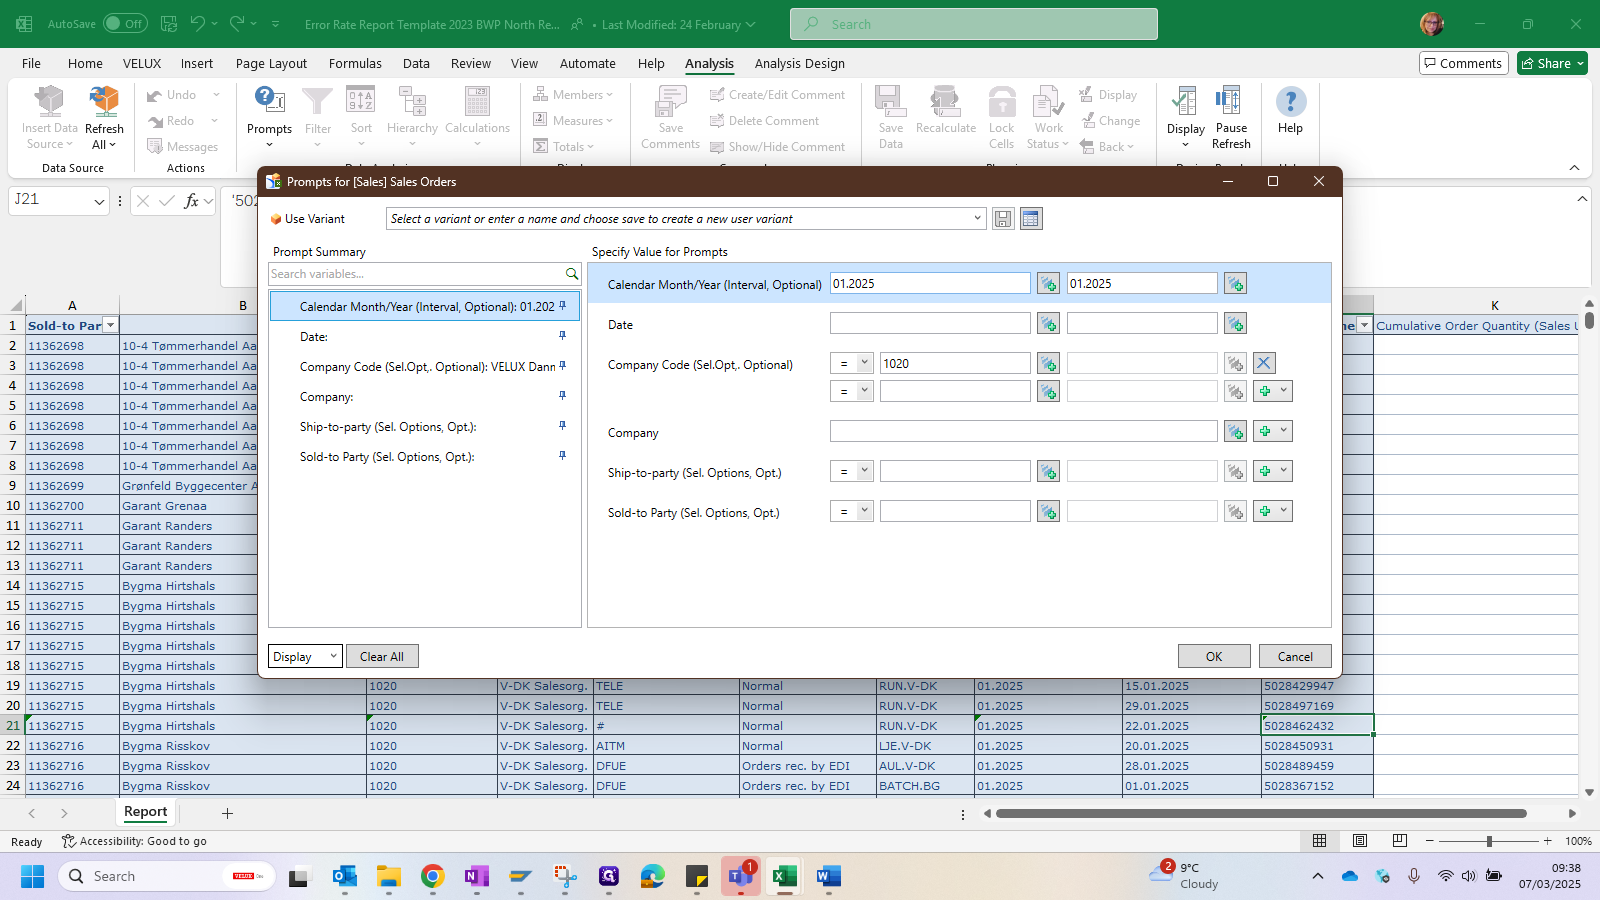
You need a BWP login to access it. If you haven't logged in yet, do so. Once logged in, you can select the months for which you want to pull reports and add them here, along with the company code for the market you're examining.


I will leave this set to Denmark, change the view to two months, and click OK.
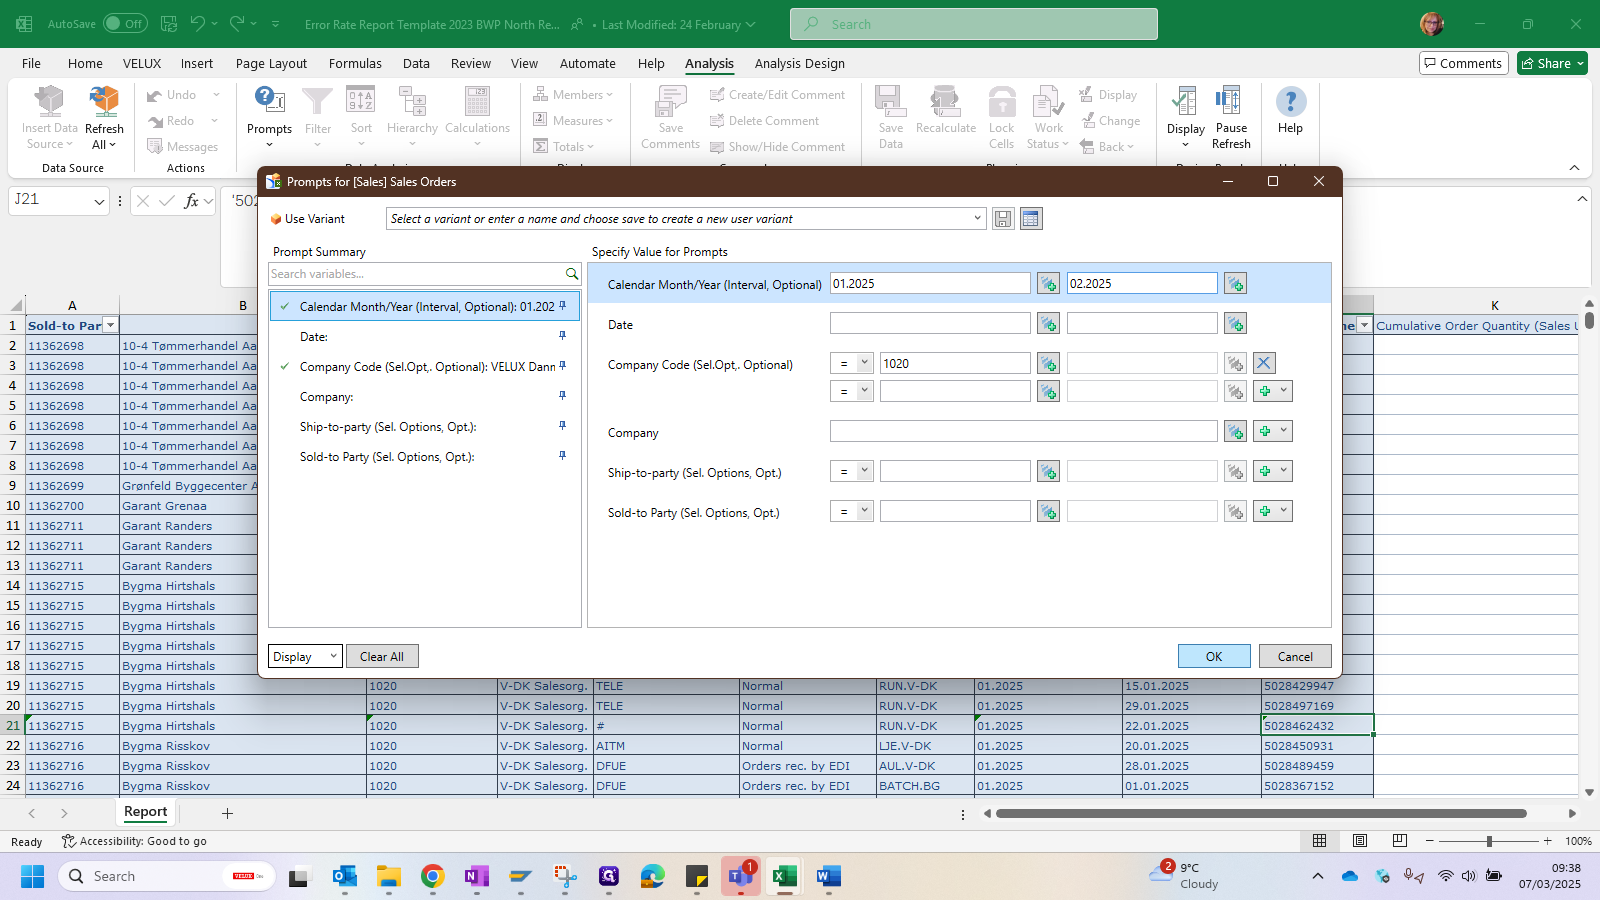
This will all update.
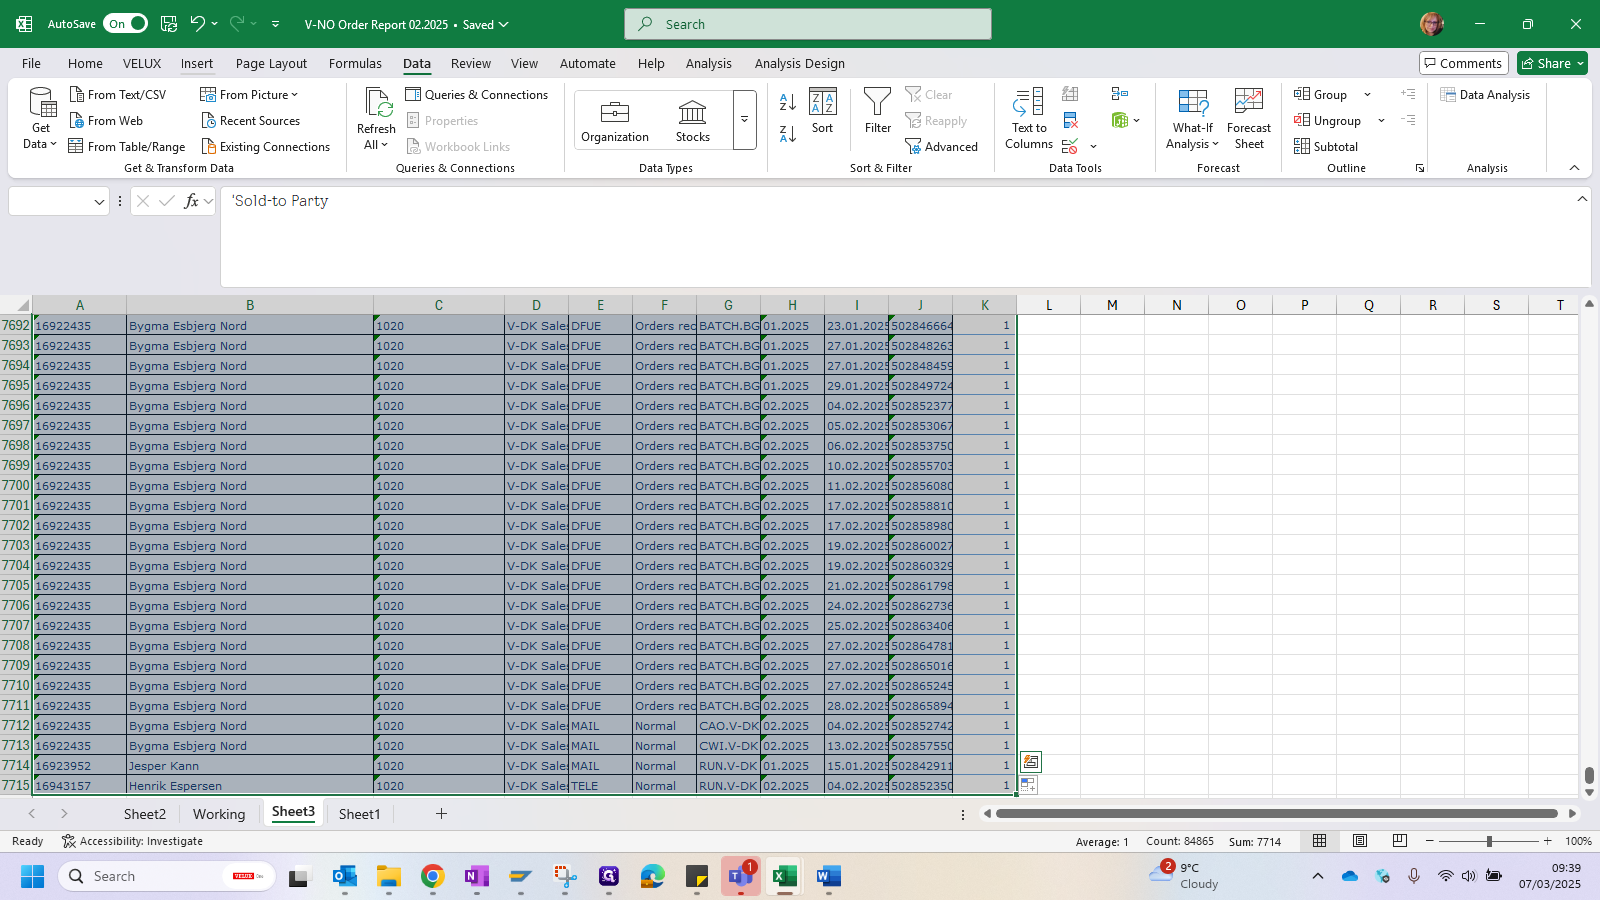
It's not easy to manipulate in the original file, so I always copy it and paste it into a different file to work on.
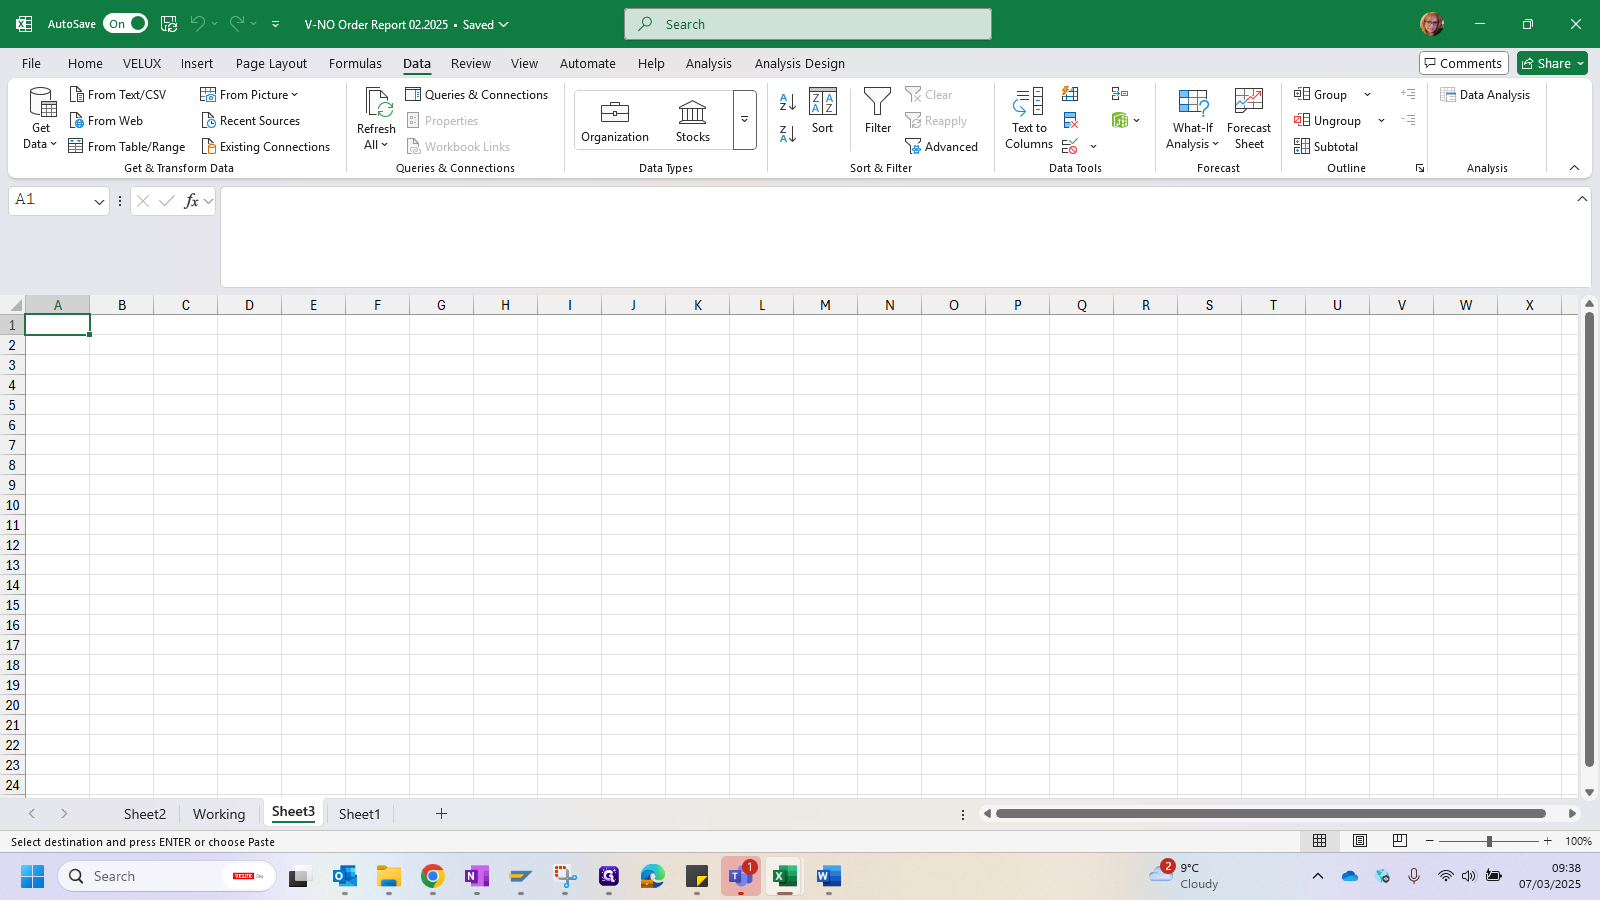
Two columns lack headings, so I add them so that I can create a pivot table.
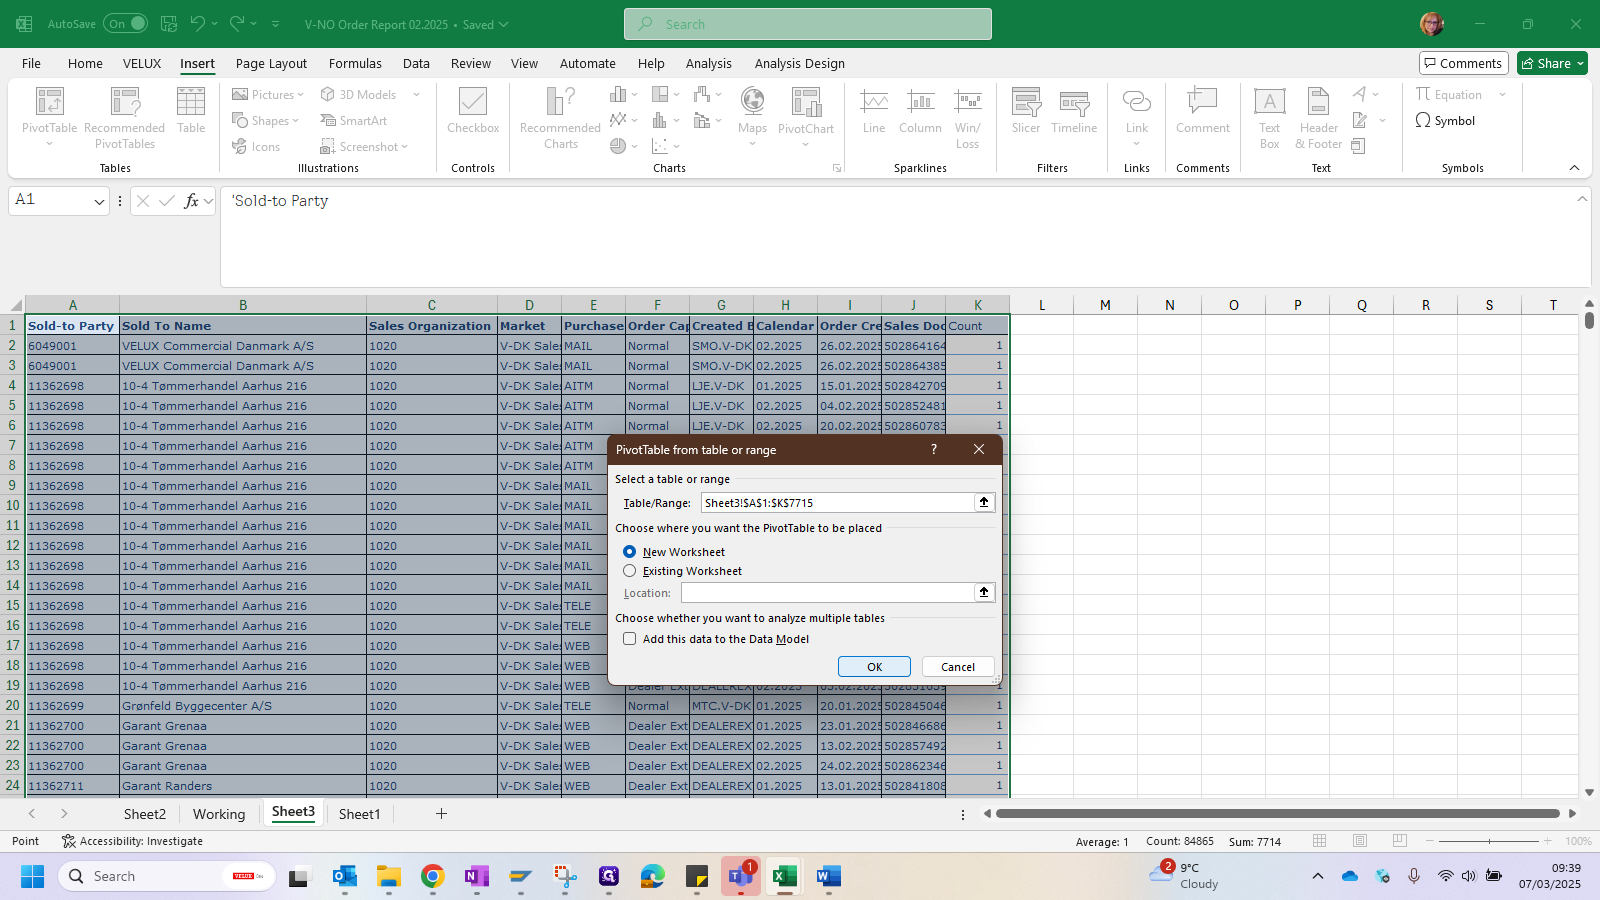
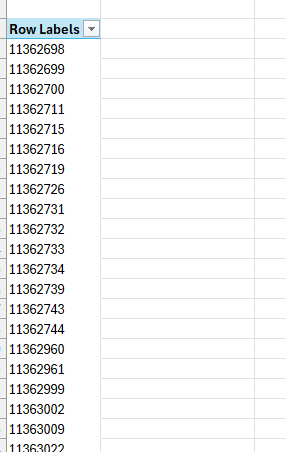
Highlight everything and insert a pivot table.

Here, I can include the account numbers and the order count.
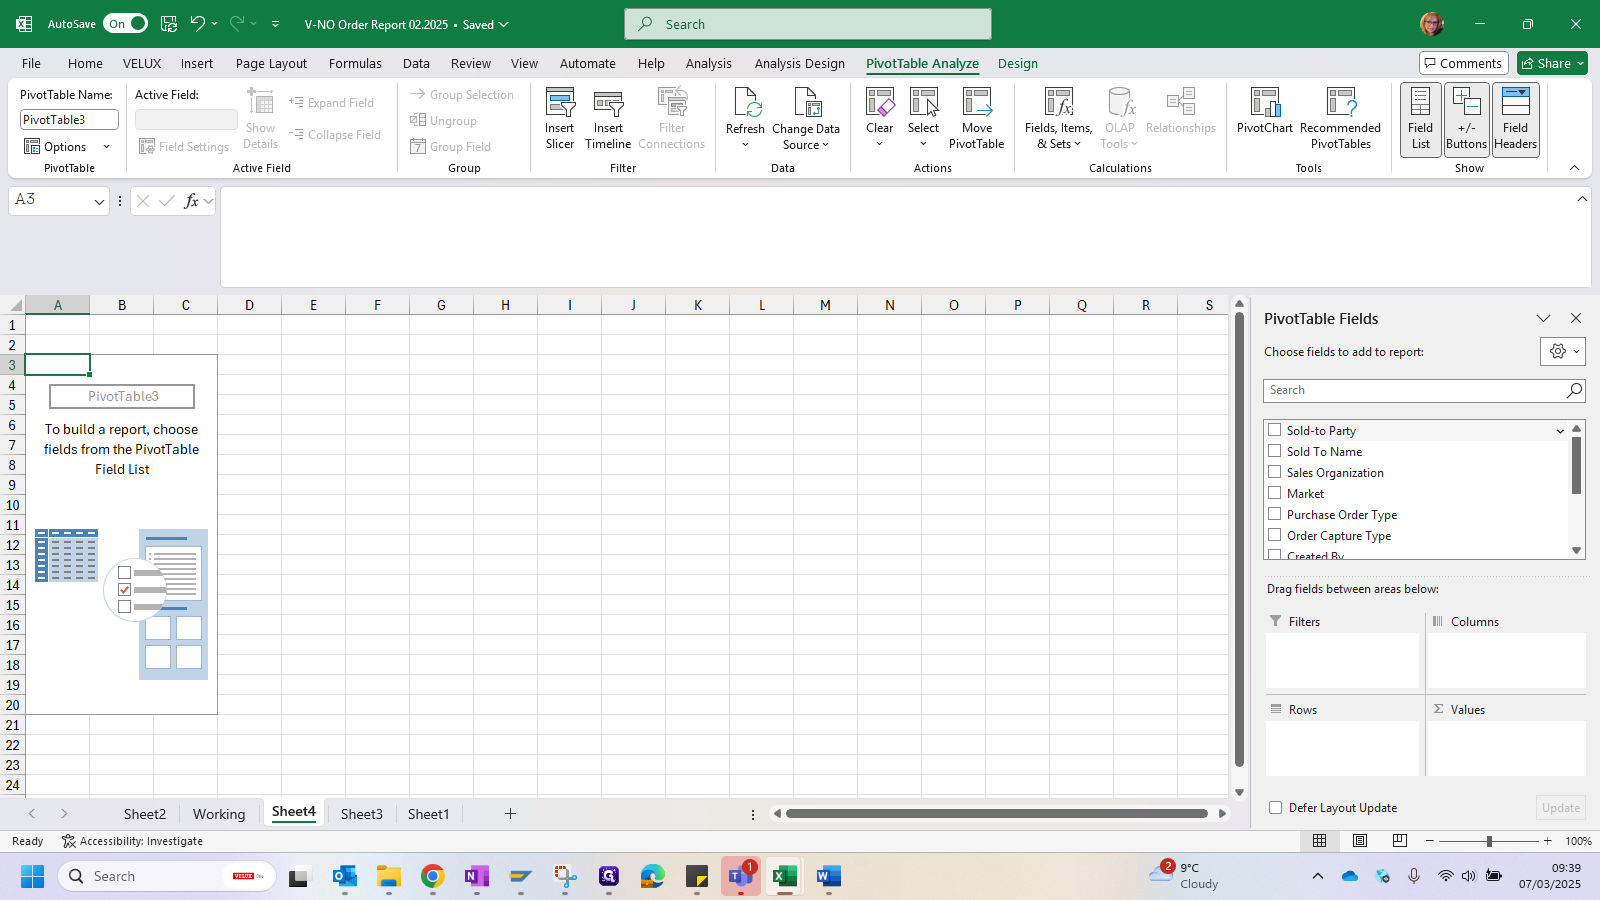
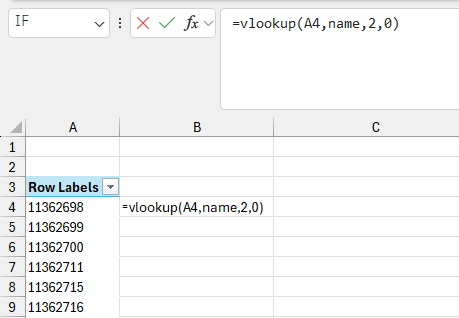
I then want to pull in the customer's name from the original file
I will highlight the 1st two columns.
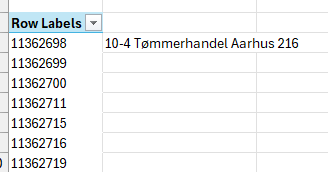
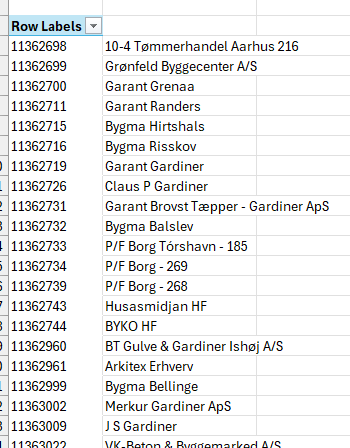
That will give you the account numbers and names that have ordered during the period you chose.
Avoid running the report for too many months at once, as it can become quite large depending on the market. In smaller markets, running a six-month report should be fine without any issues.