
How to Check Your Customer Stats in Grafana: Step-by-Step Guide
Learn how to check customer statistics in Grafana, including accessing the 6.0 support dashboard, finding customer GUIDs, and analyzing message archiving and sync status. Follow this guide for efficient customer data monitoring.
In this guide, we'll learn how to check your customer statistics in Grafana. We will cover how to access the Grafana dashboard, authenticate with Okta, and locate your customer using the List of Customers and the 6.0 support dashboard. You will also learn how to find and use the customer GUID, review recent activity, and adjust the data range to see different time periods.
Let's get started
How to check your customer stats in Grafana. To do this, open a browser and go to grafana.prod.proofpointarchiving.net.
You should authenticate with Okta.
Once you arrive here, most of the work will be done in the 6.0 support dashboard, the customer list, and possibly MIPs. If you are unsure whether your client is using version 6.0, check the customer list. In the UI, under Dashboards, click List of Customers. Check each data center.
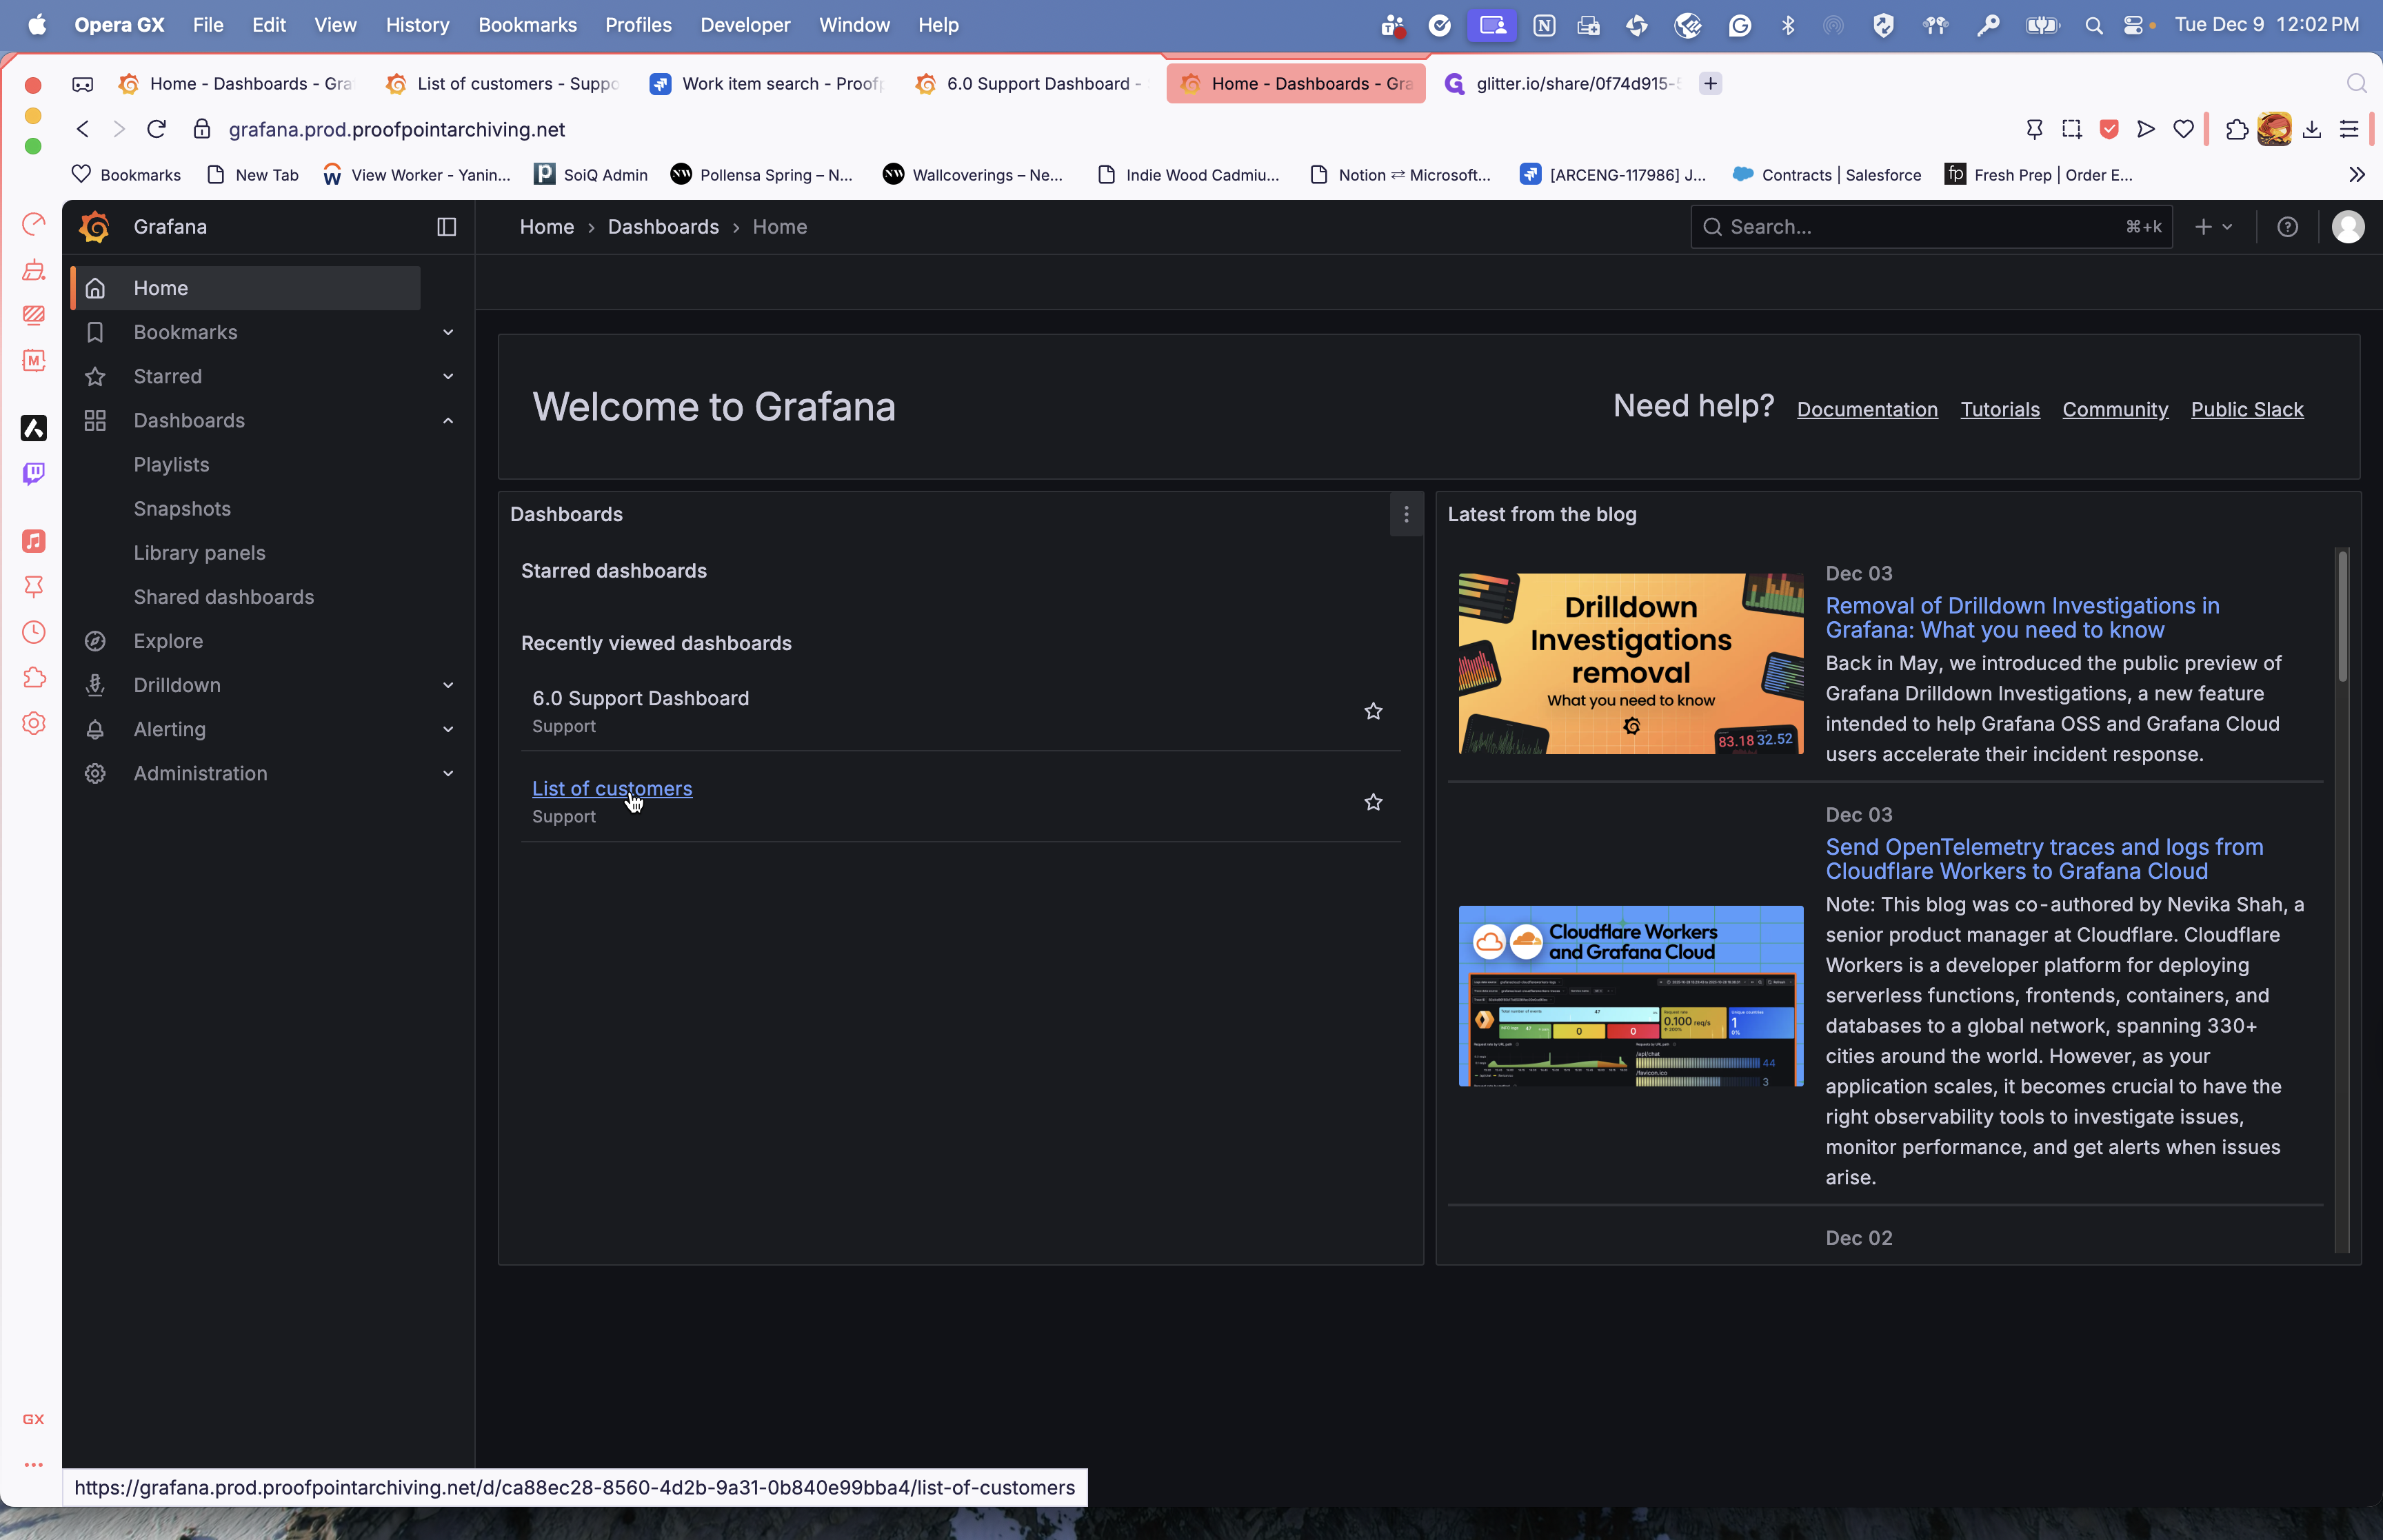
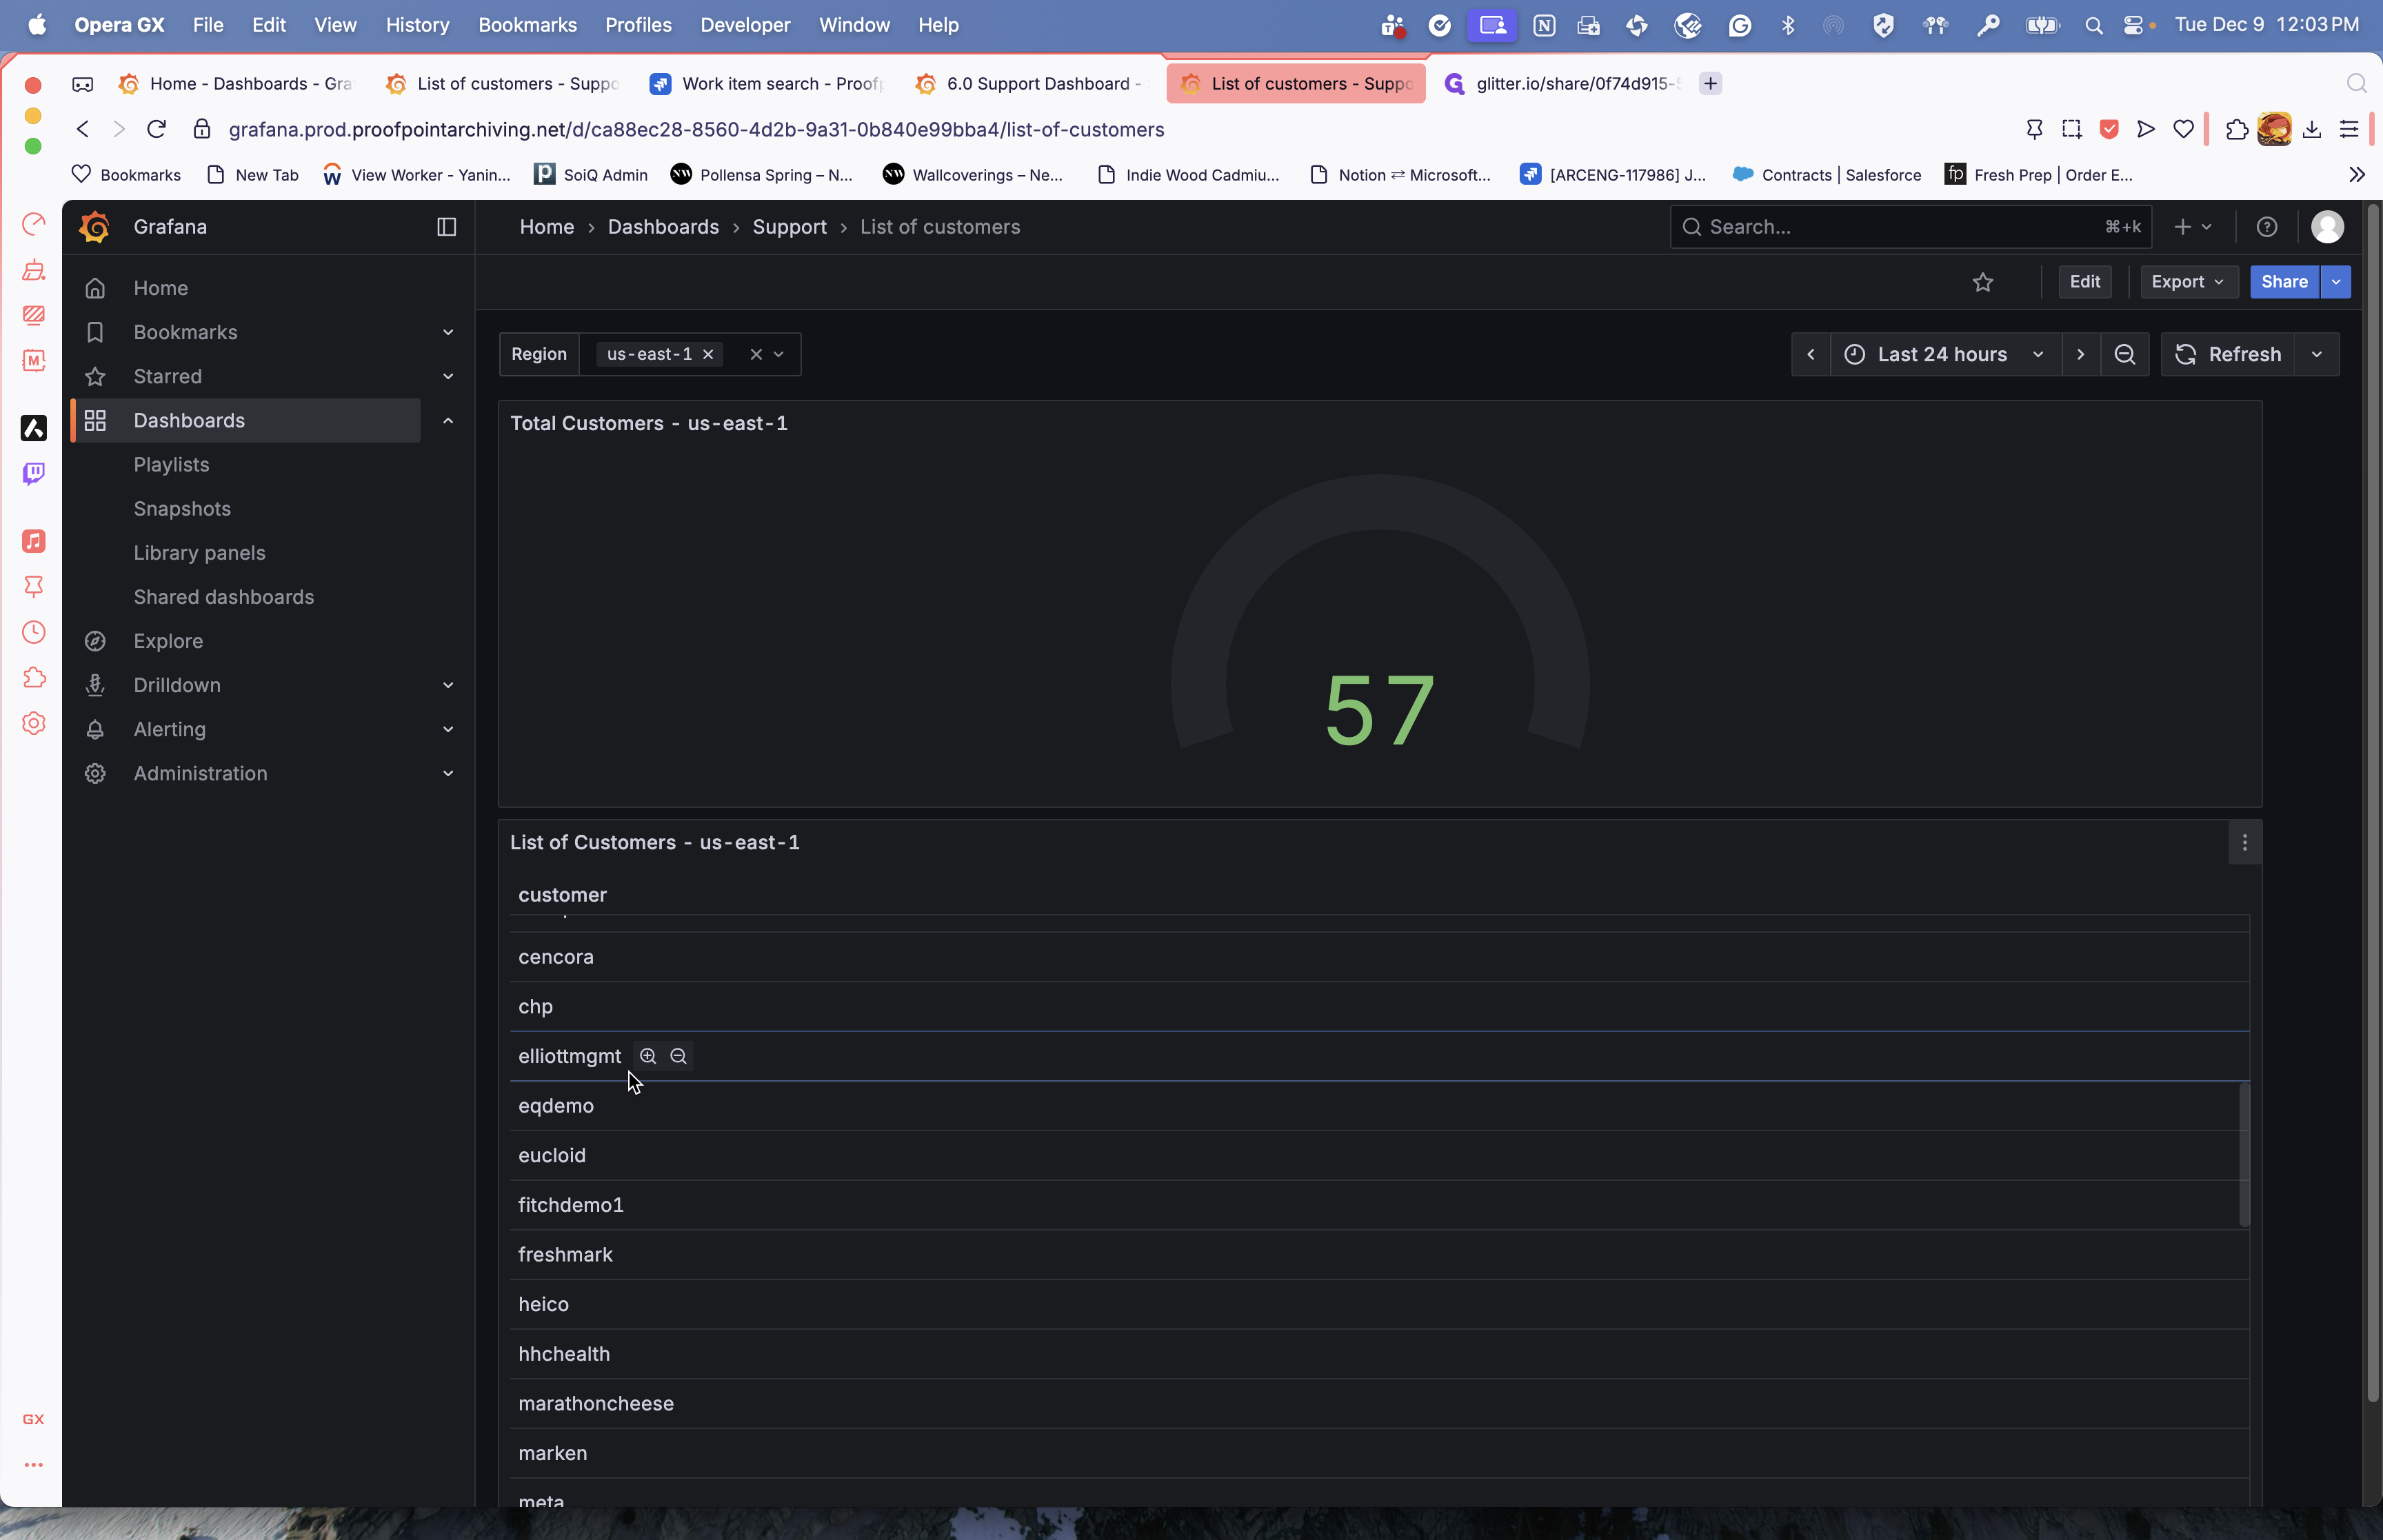
Most of our clients are in us-east-1.
Scroll until you find your customer. For example, my name is Elliot. Elliot Management appears here. We know they are 6.0.
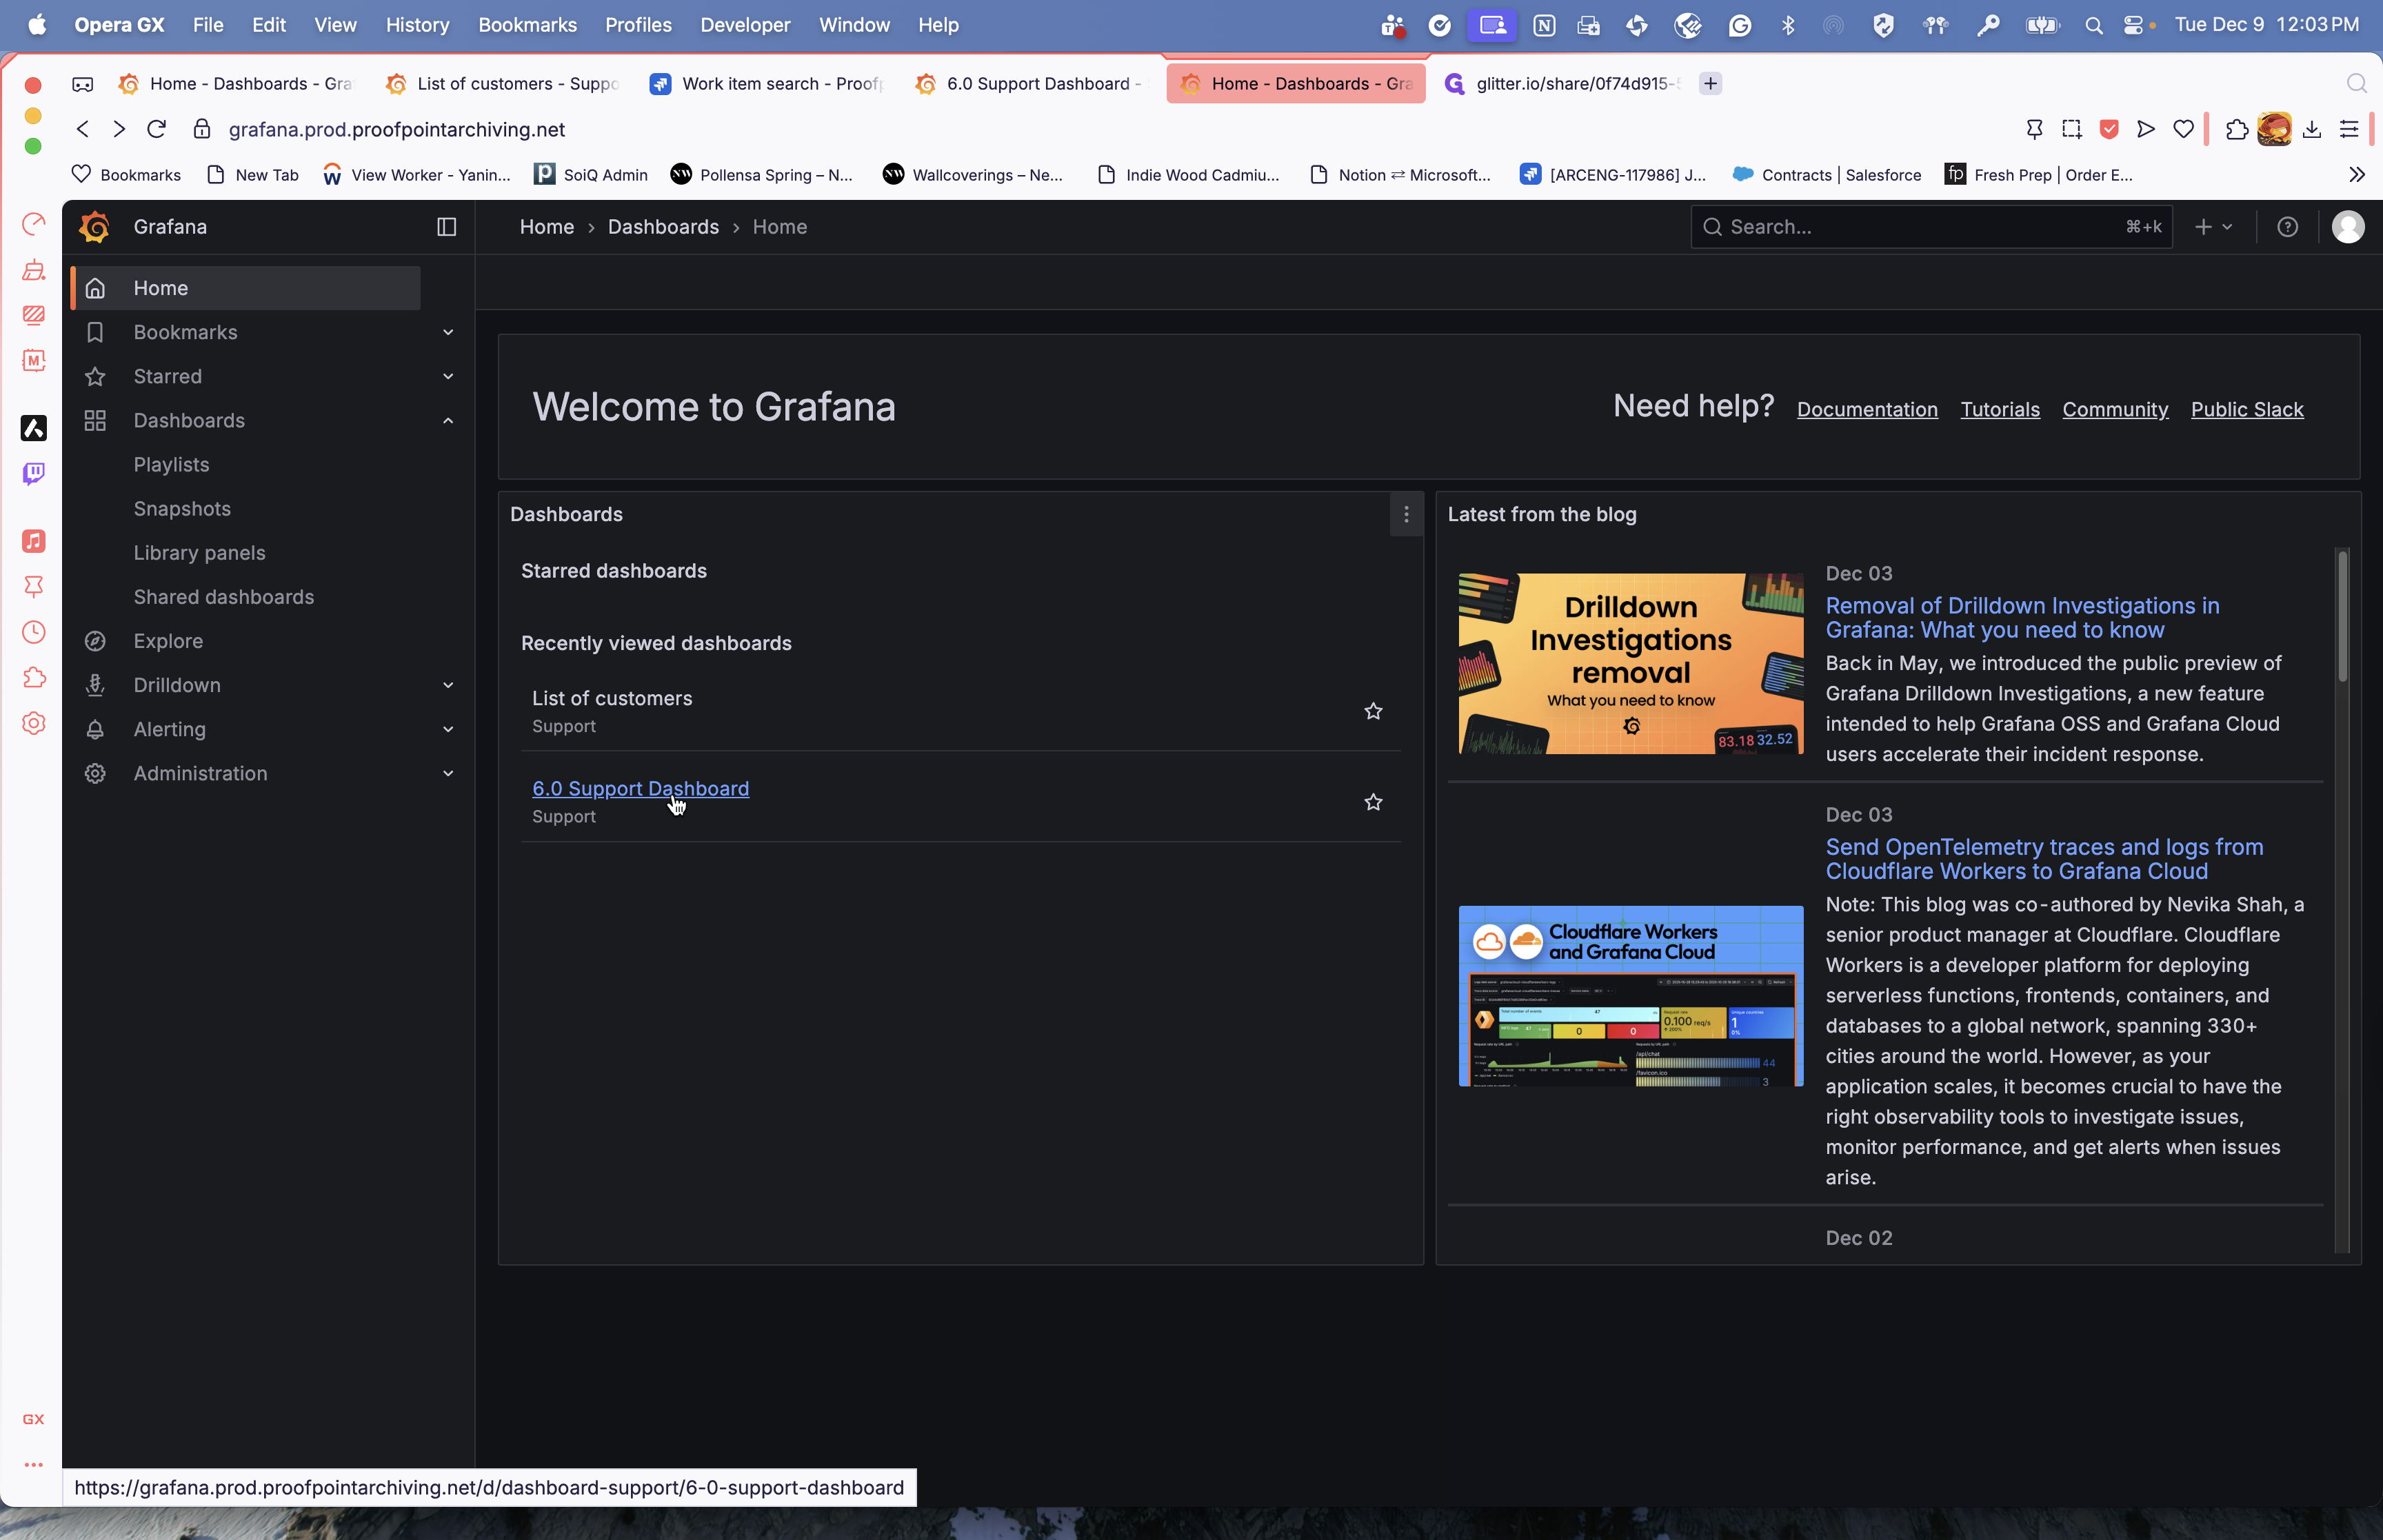
Next, return to your list of dashboards. Open the 6.0 support dashboard.
The 6.0 support dashboard does not search for clients by name, but by GUID. If you don't know your client's GUID, you can check a Jira ticket.
You can search by customer name or space GUID. I'll use this as an example. Here, you can see PrimAmerica is my customer name, followed by a space and the GUID.
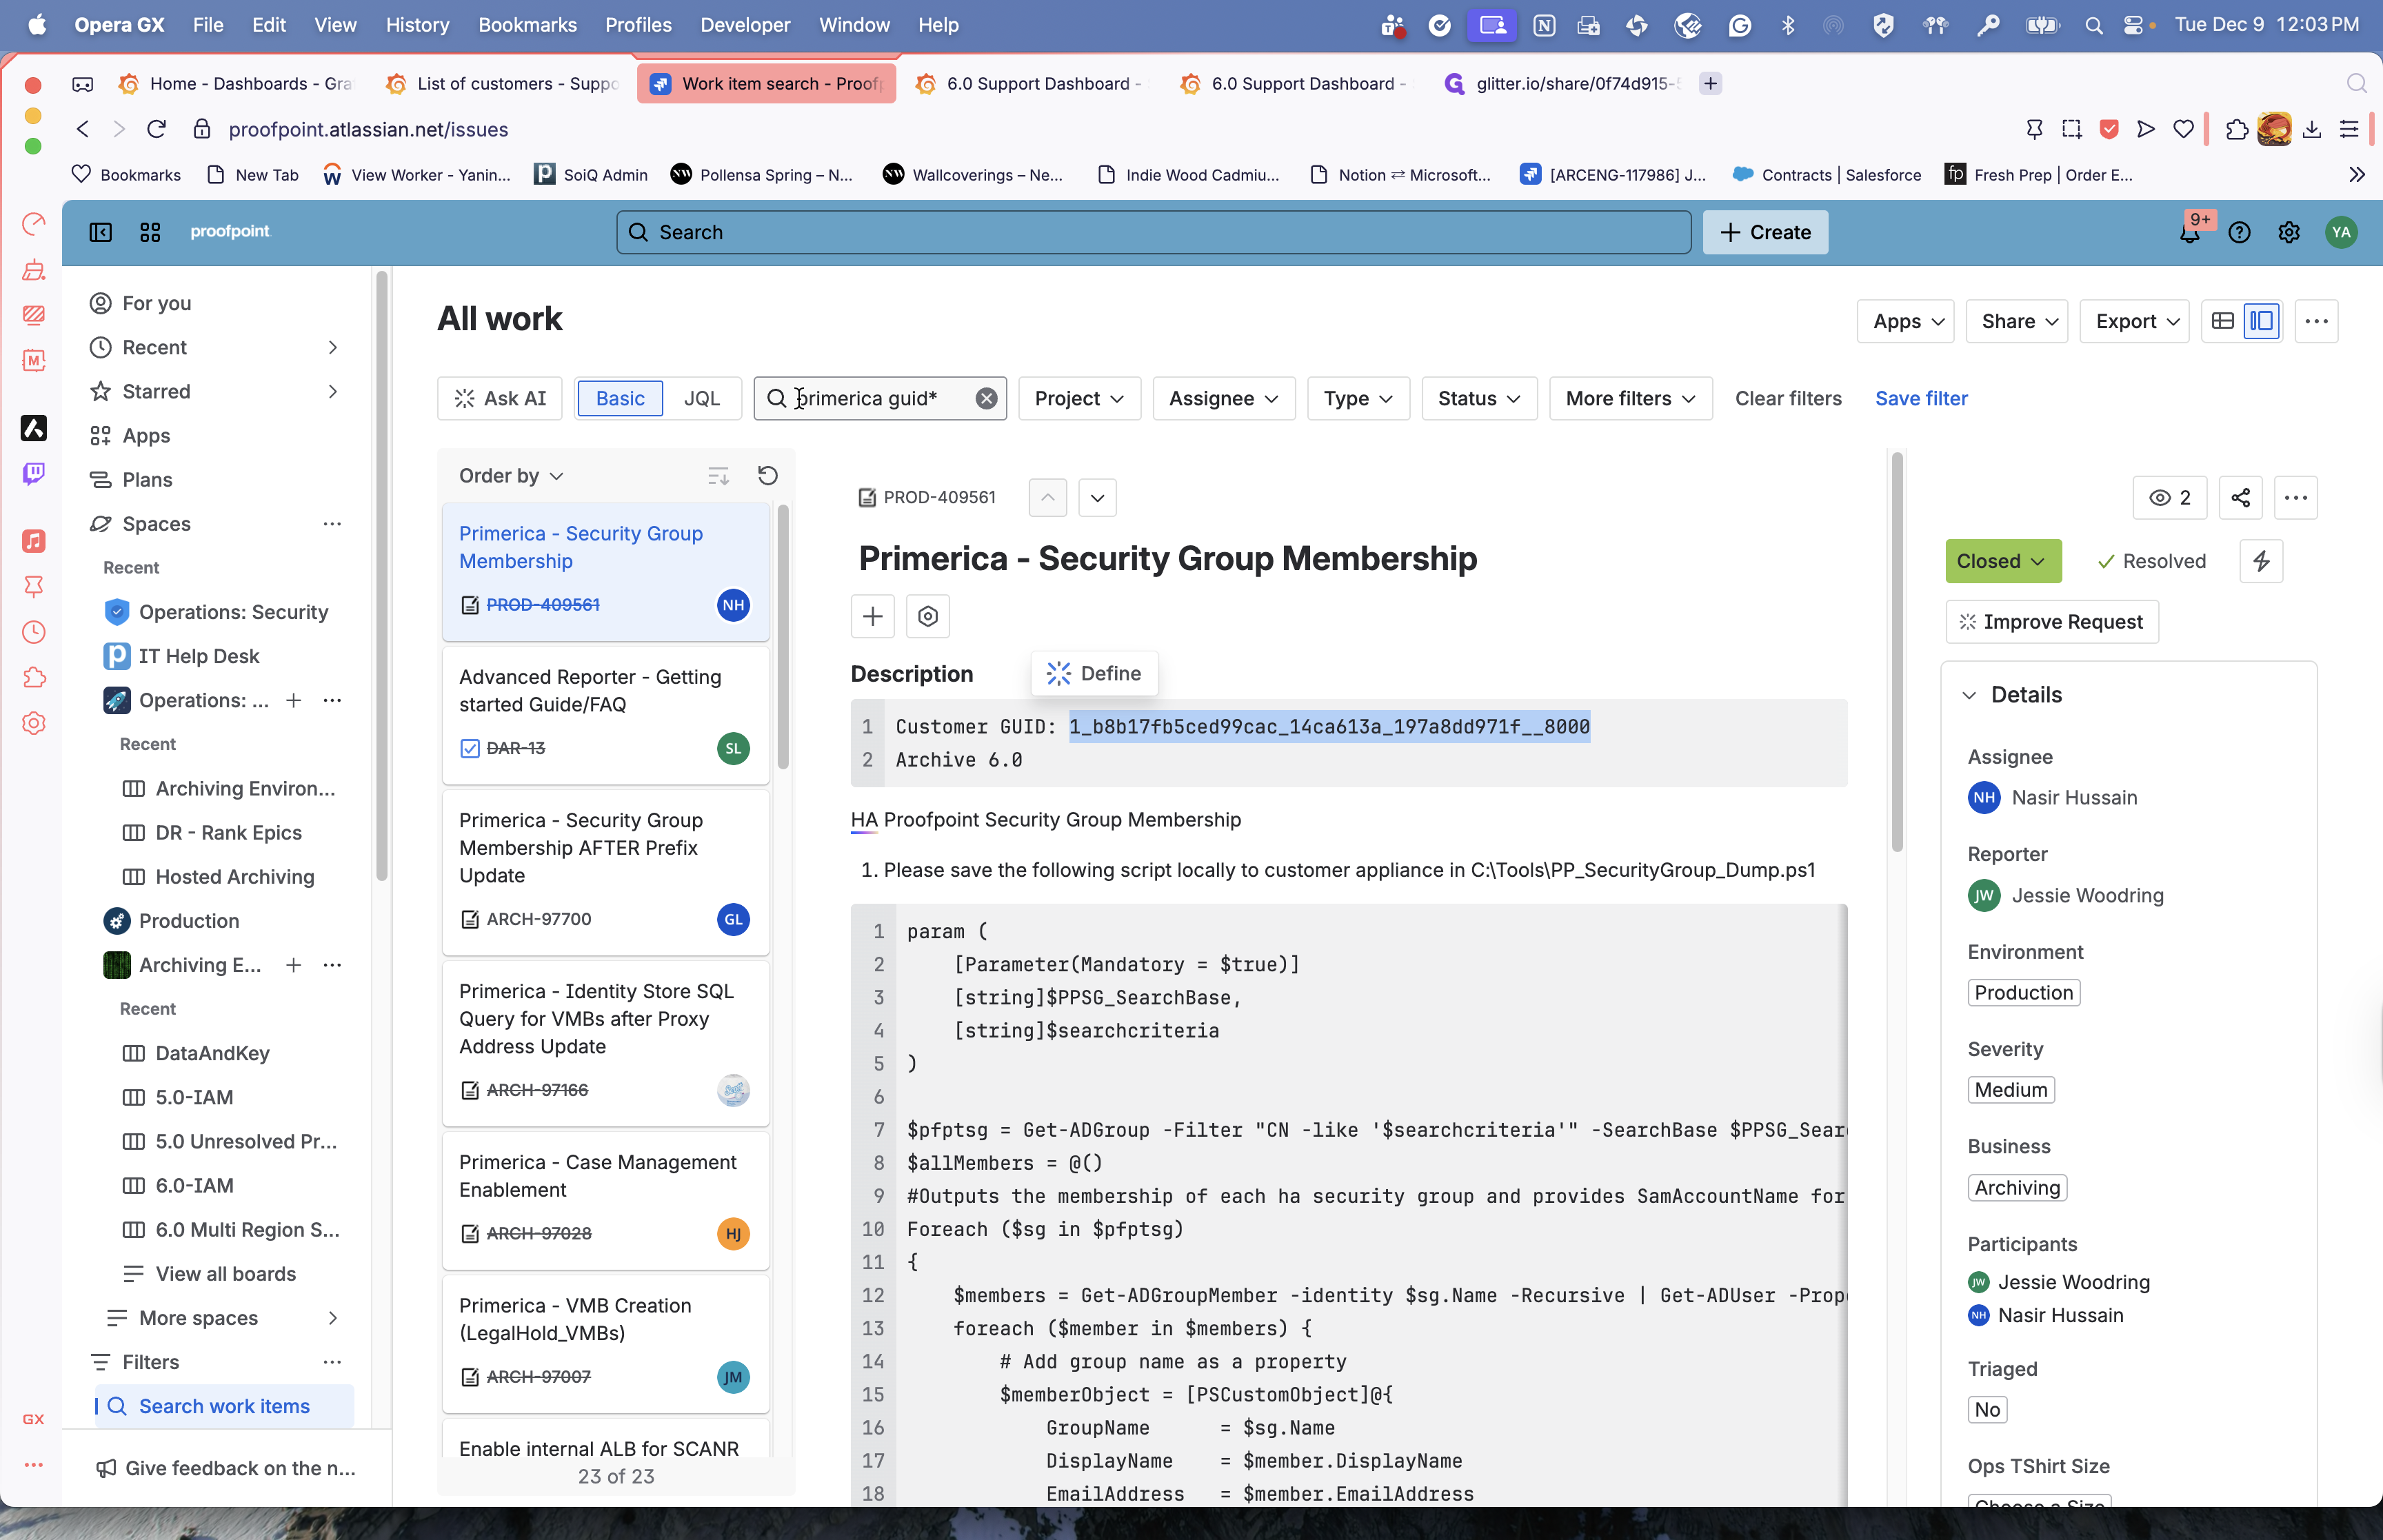
I found a ticket and you capture the customer GUID.
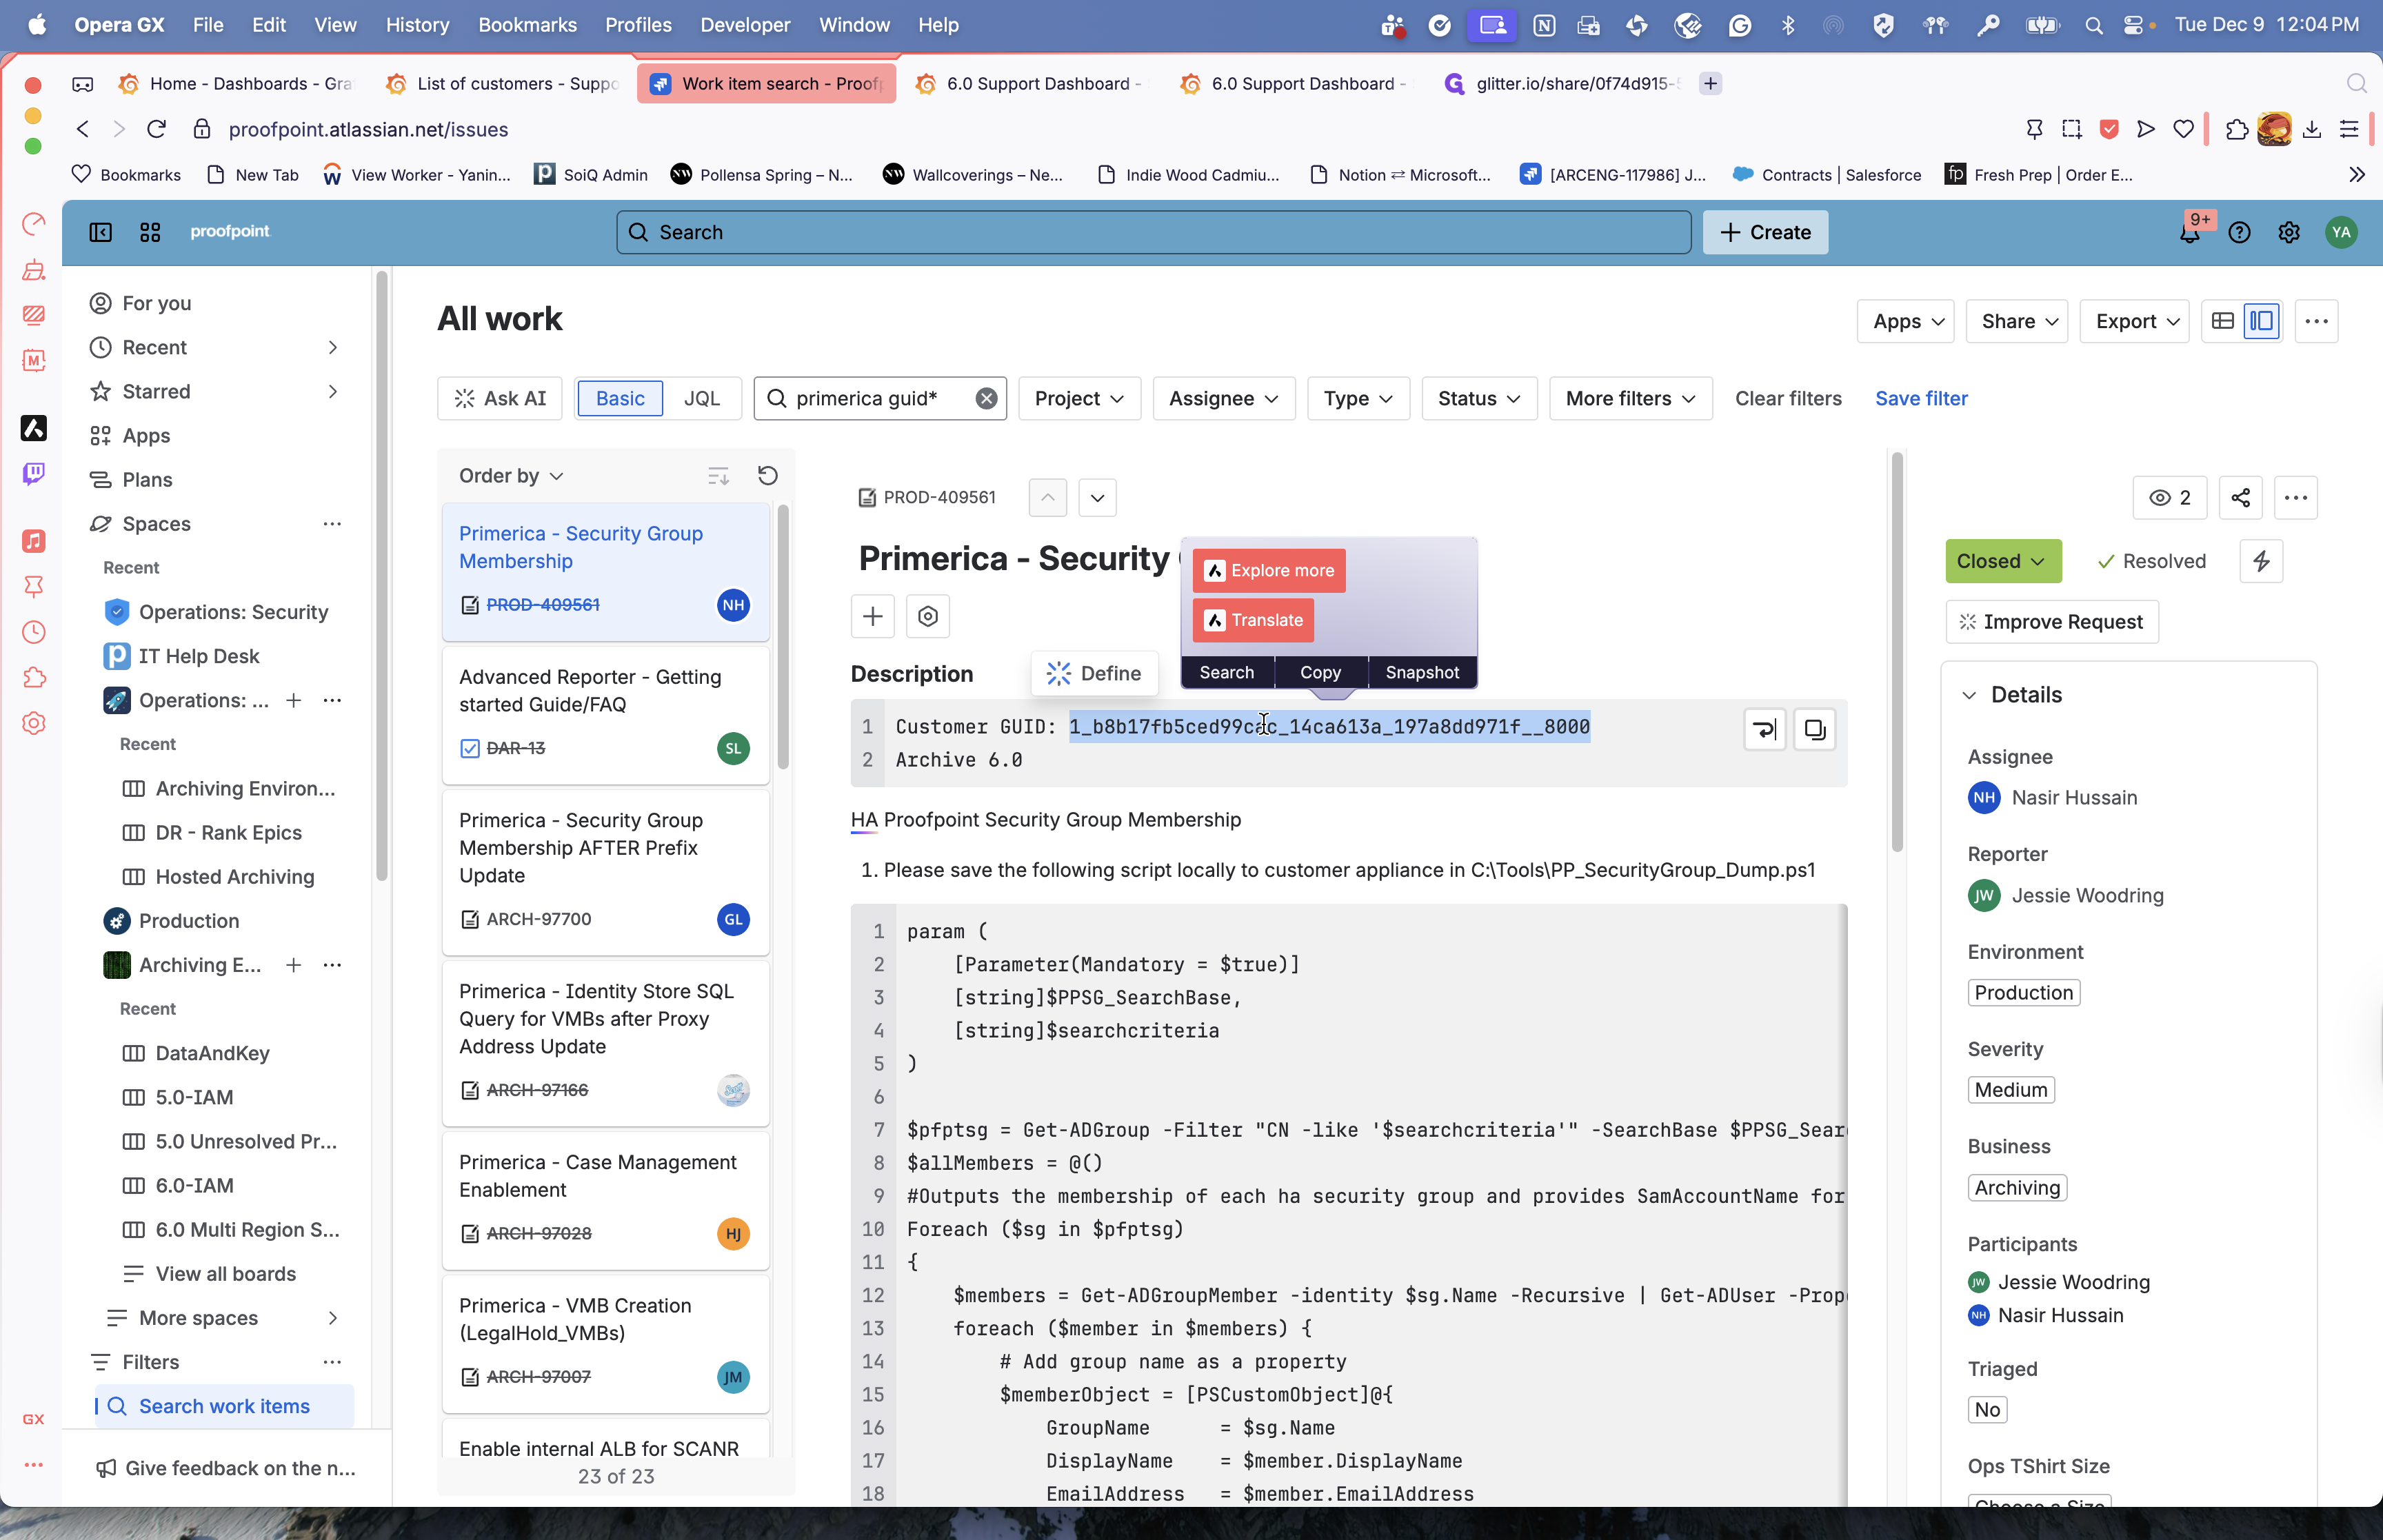
I can select this GUID, copy it, then go to the 6.0 dashboard and paste it into the customer field.
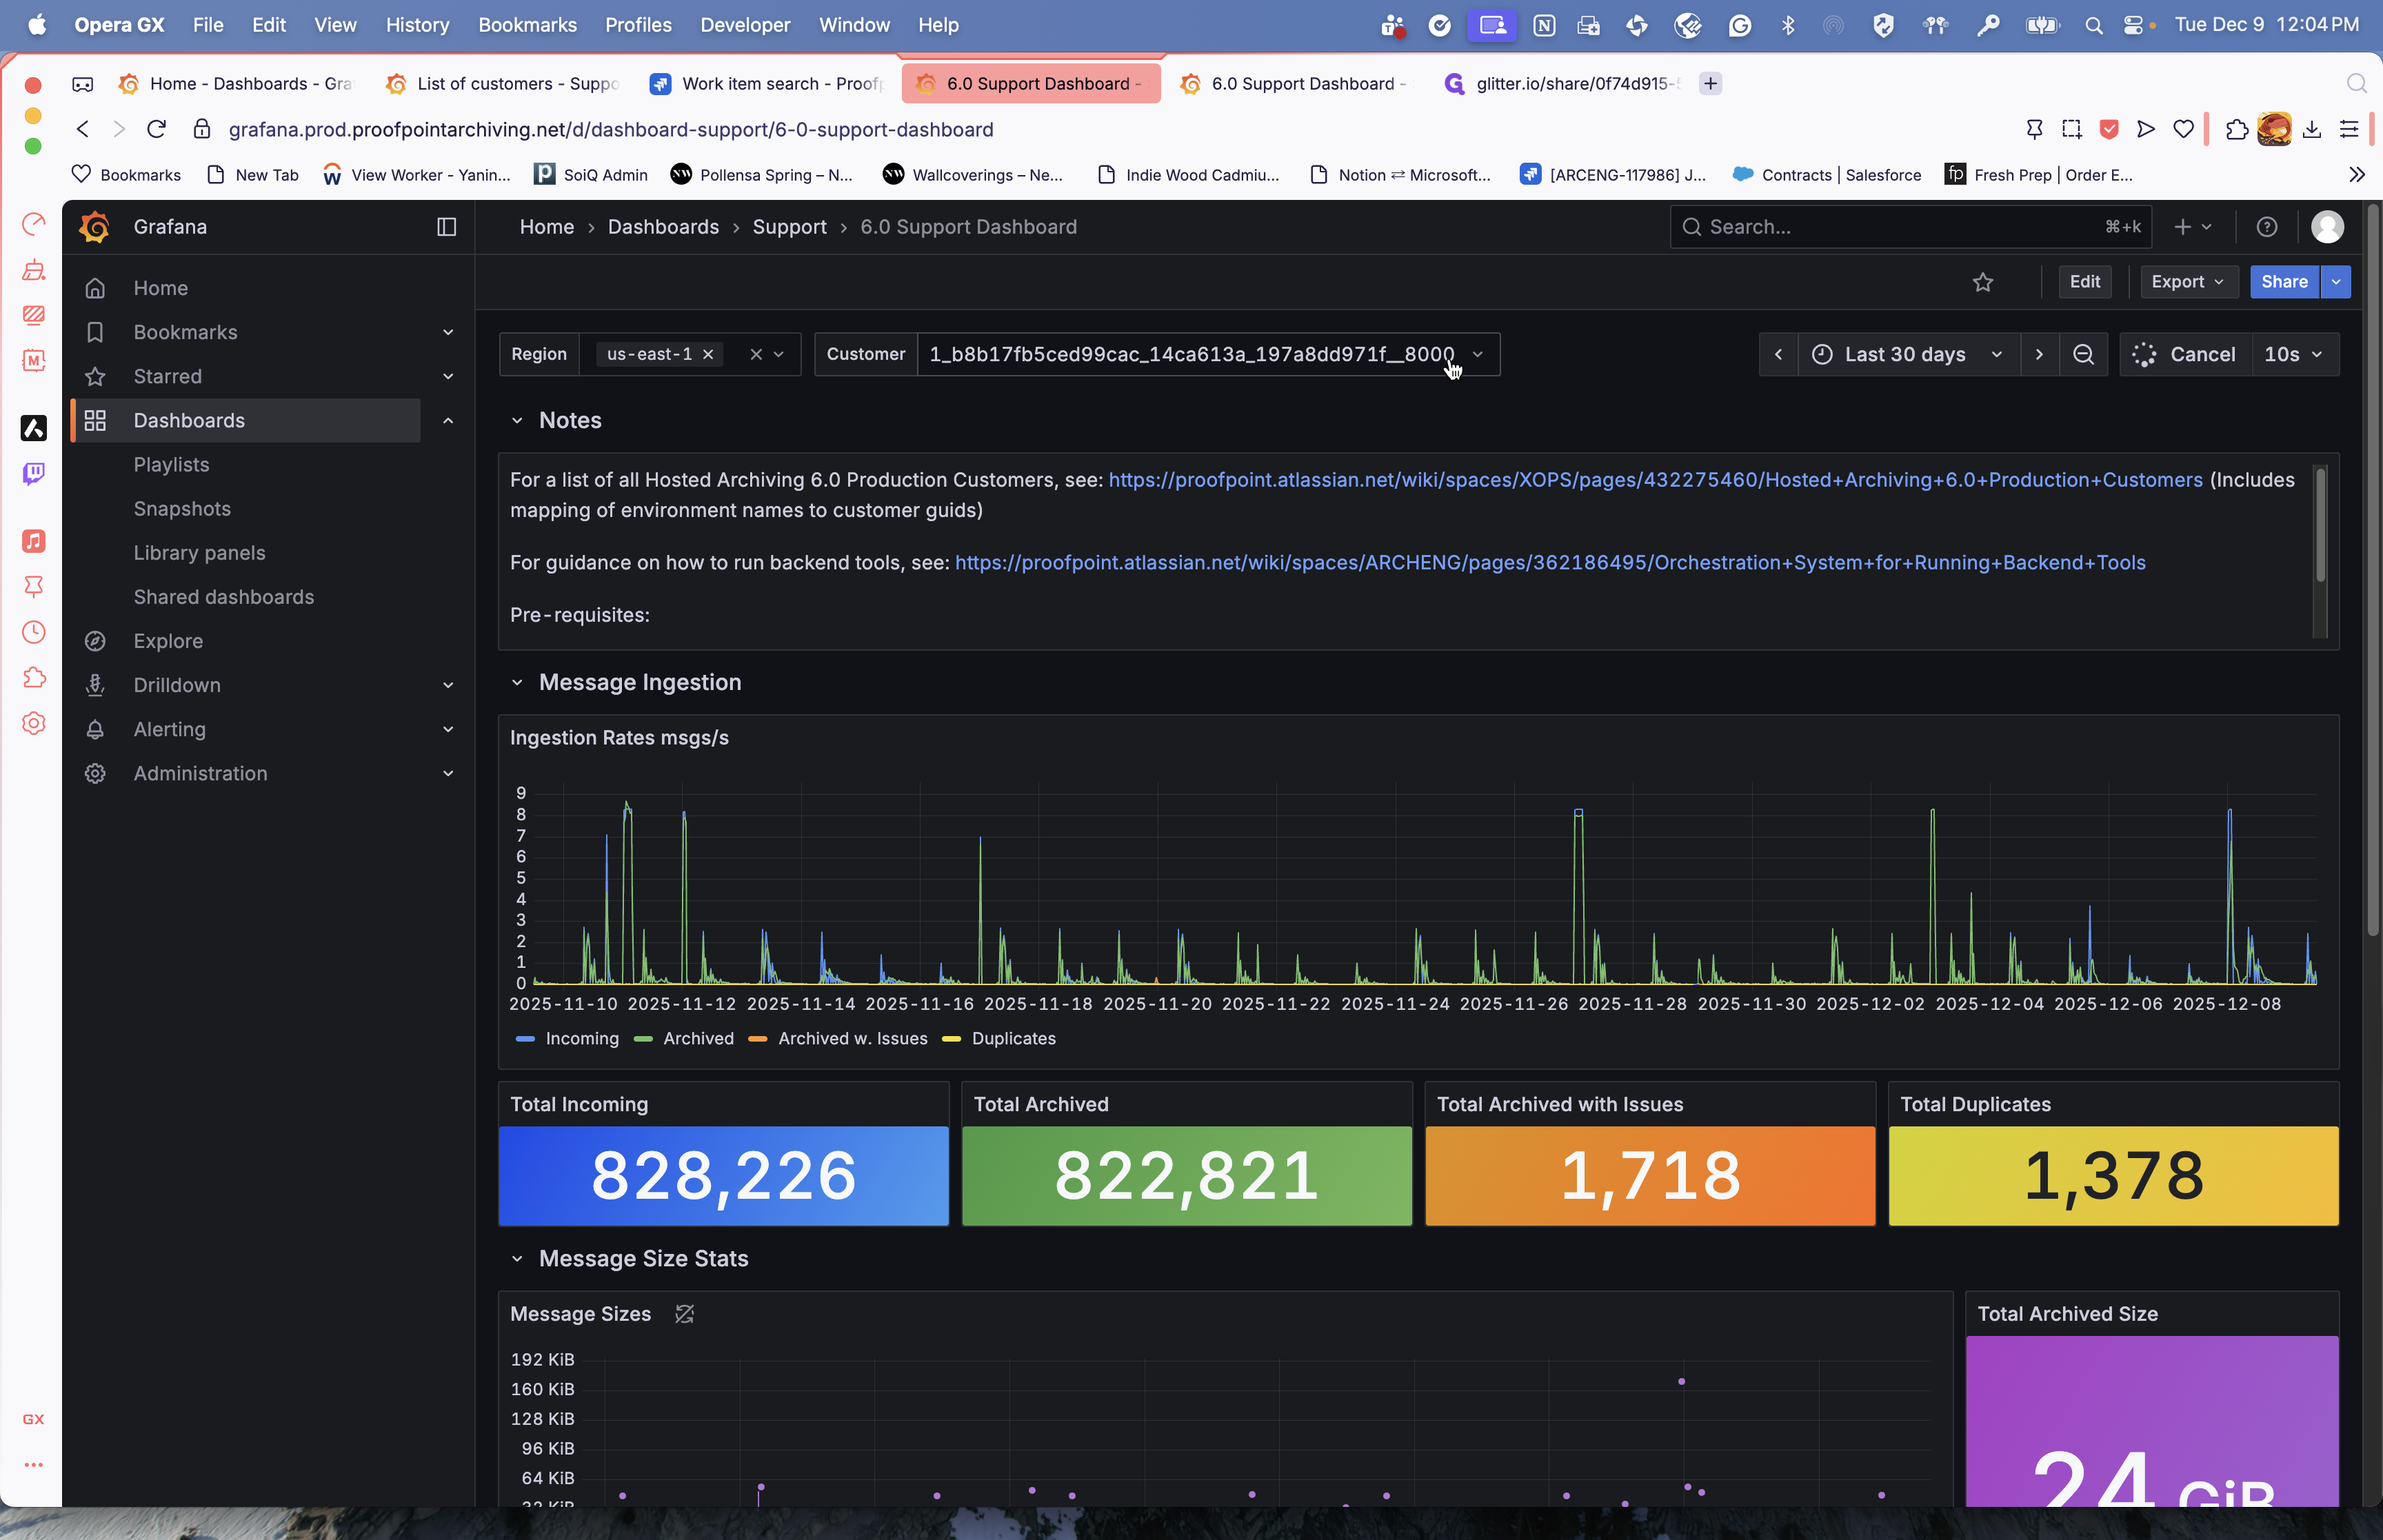
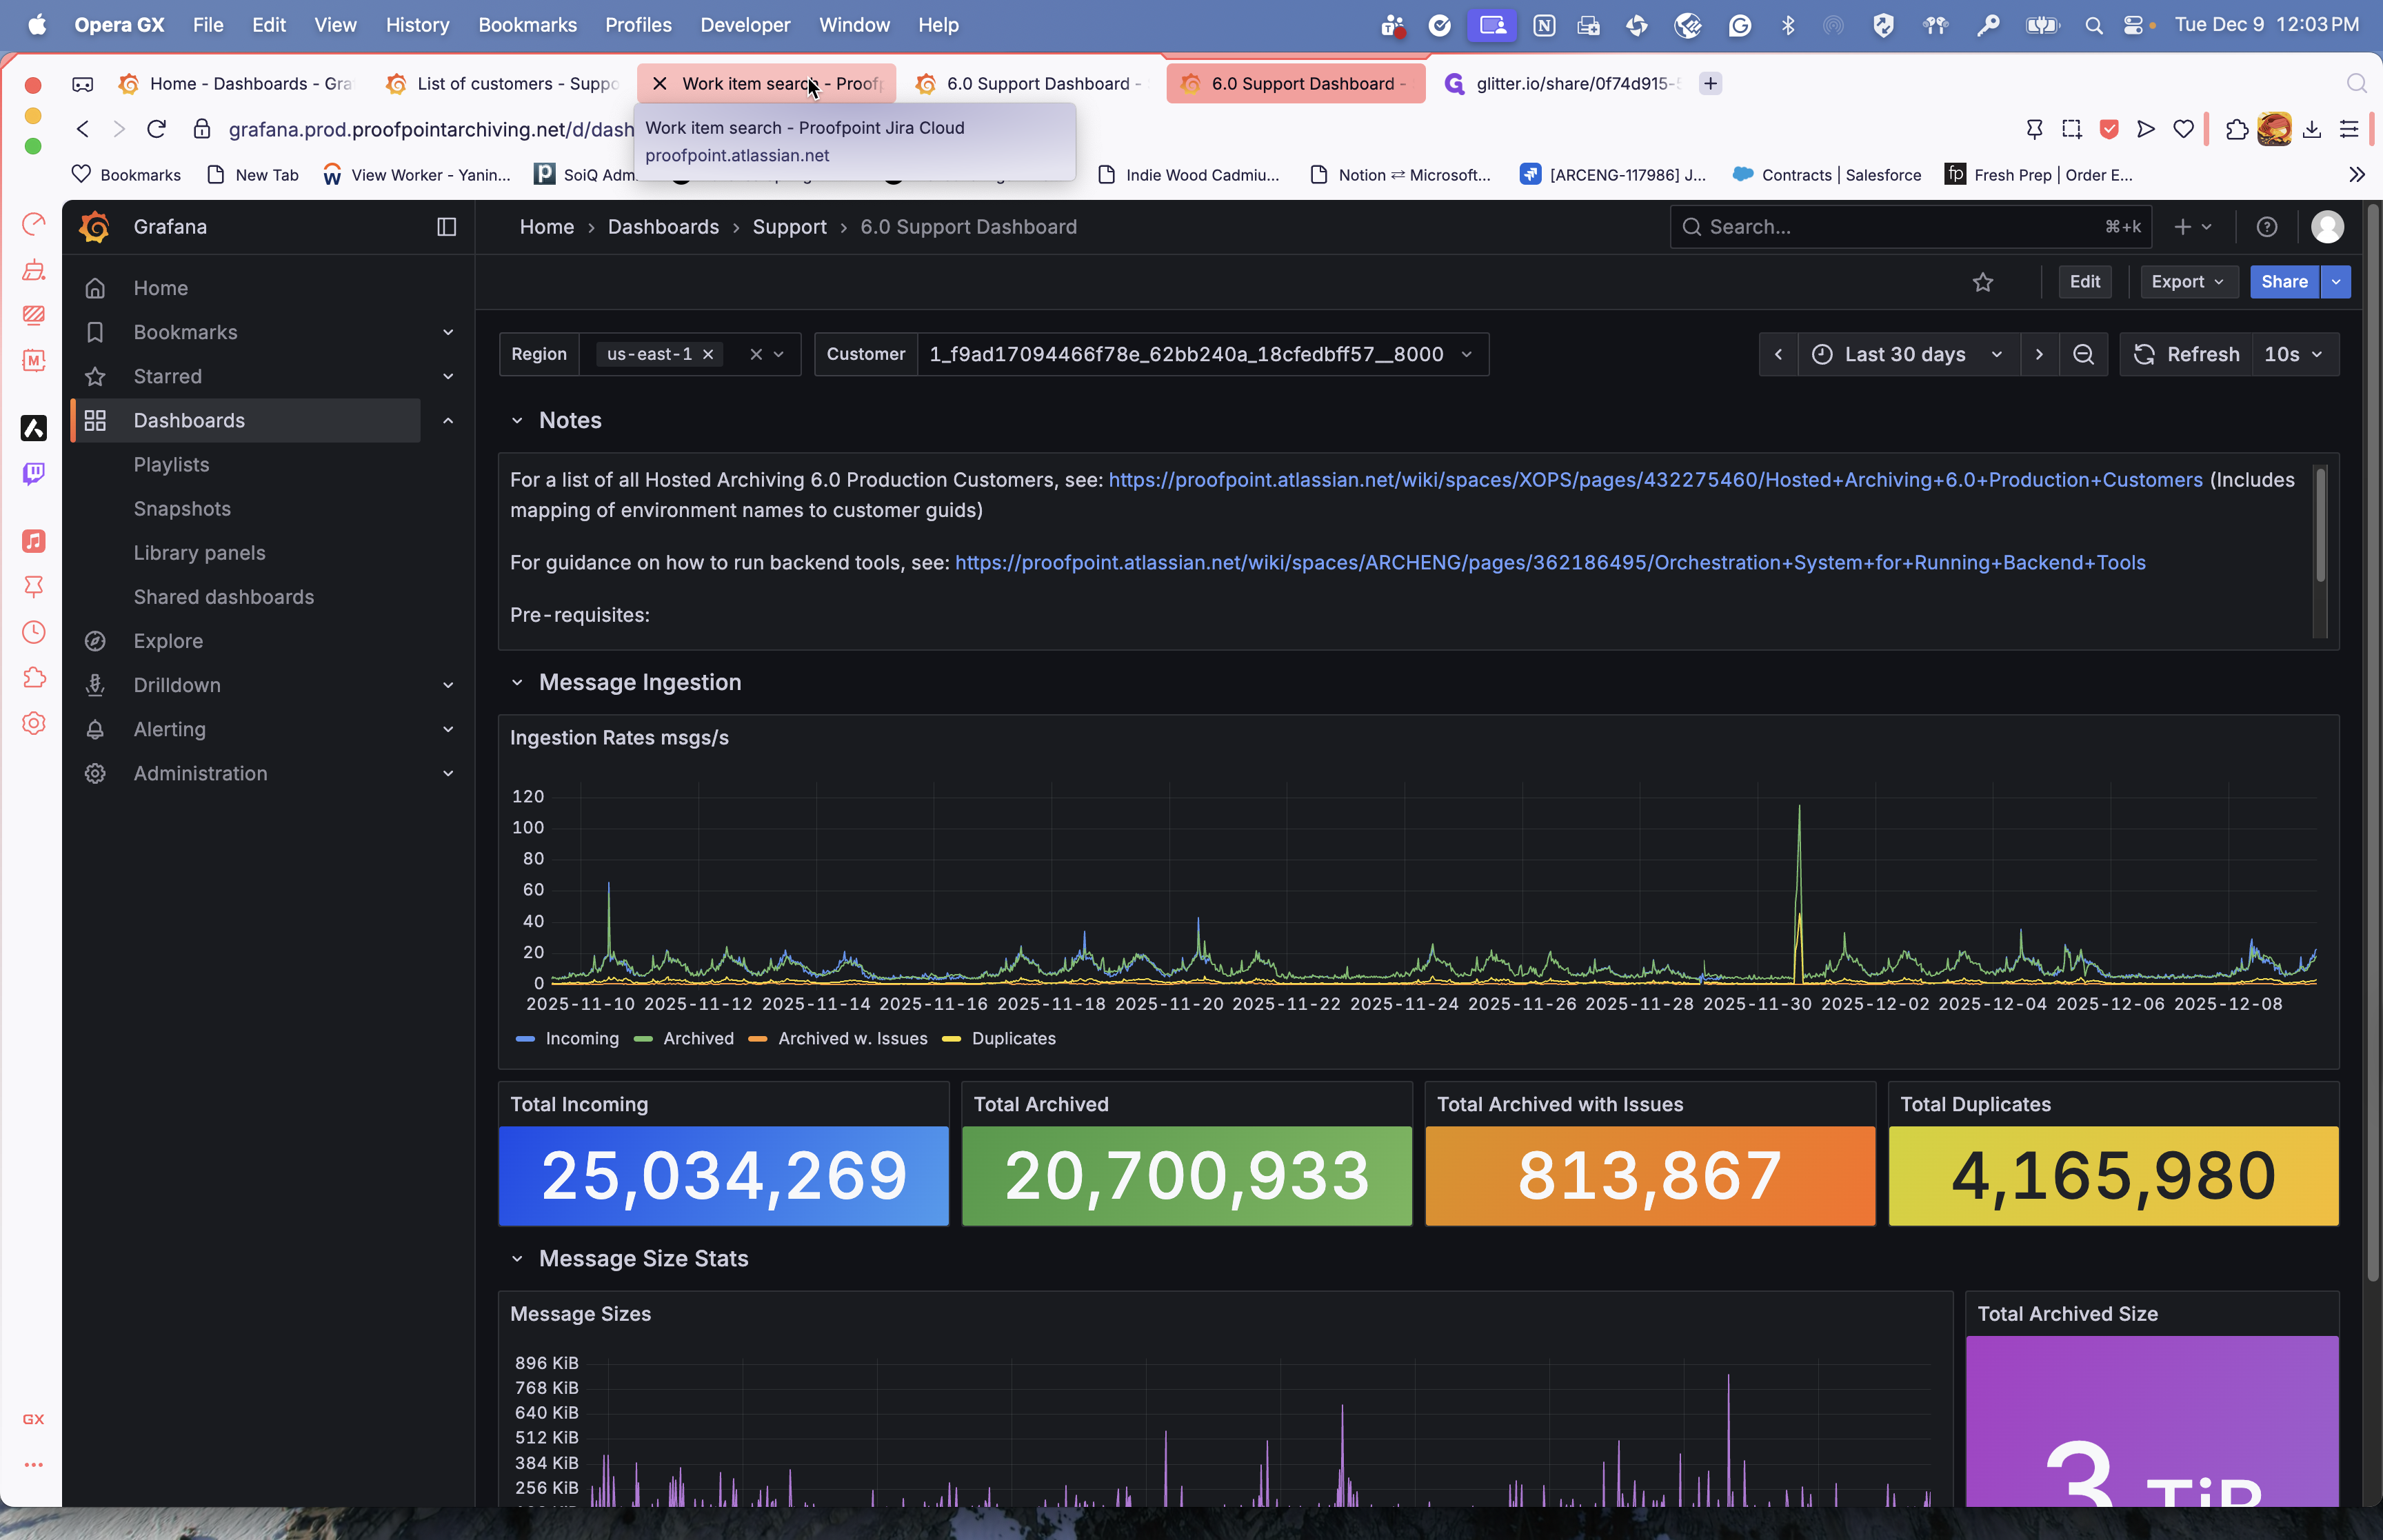
Fill in the customer field with the customer GUID, then press Enter.
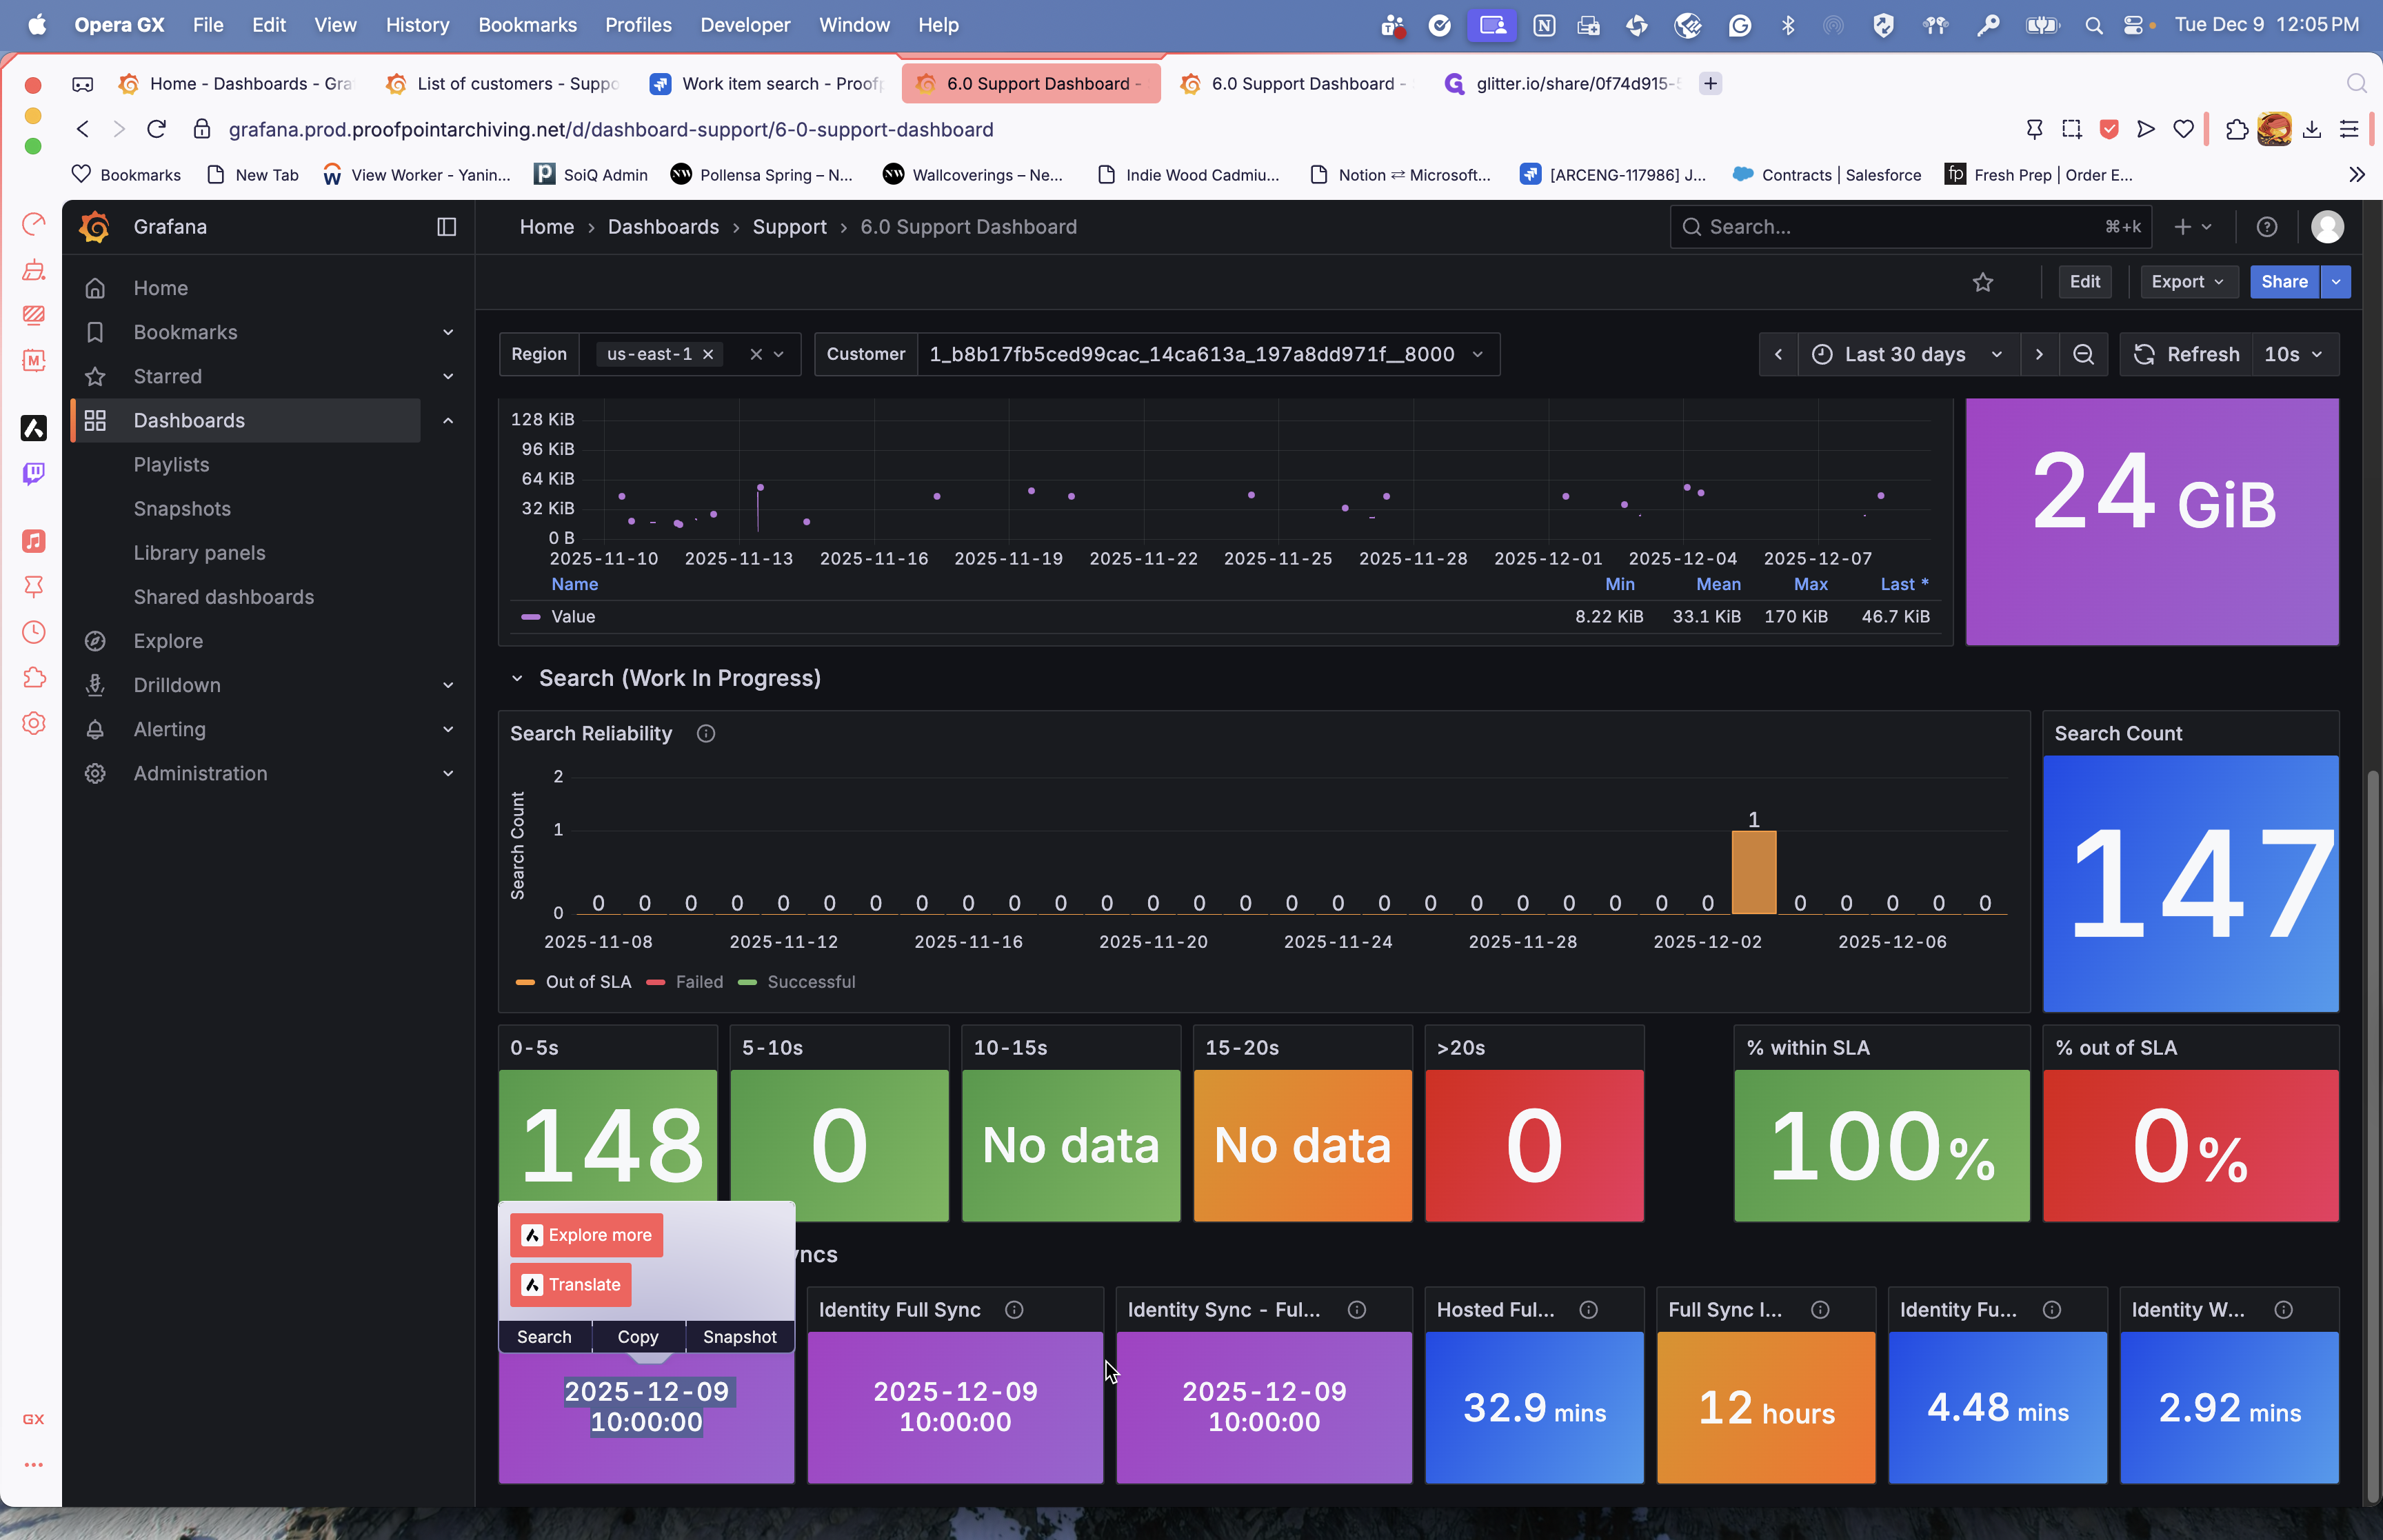
The UI will always display the last user or customer you viewed. We are searching for data from the last 30 days. In the past 30 days, we received 828,000 messages. We archived 822.
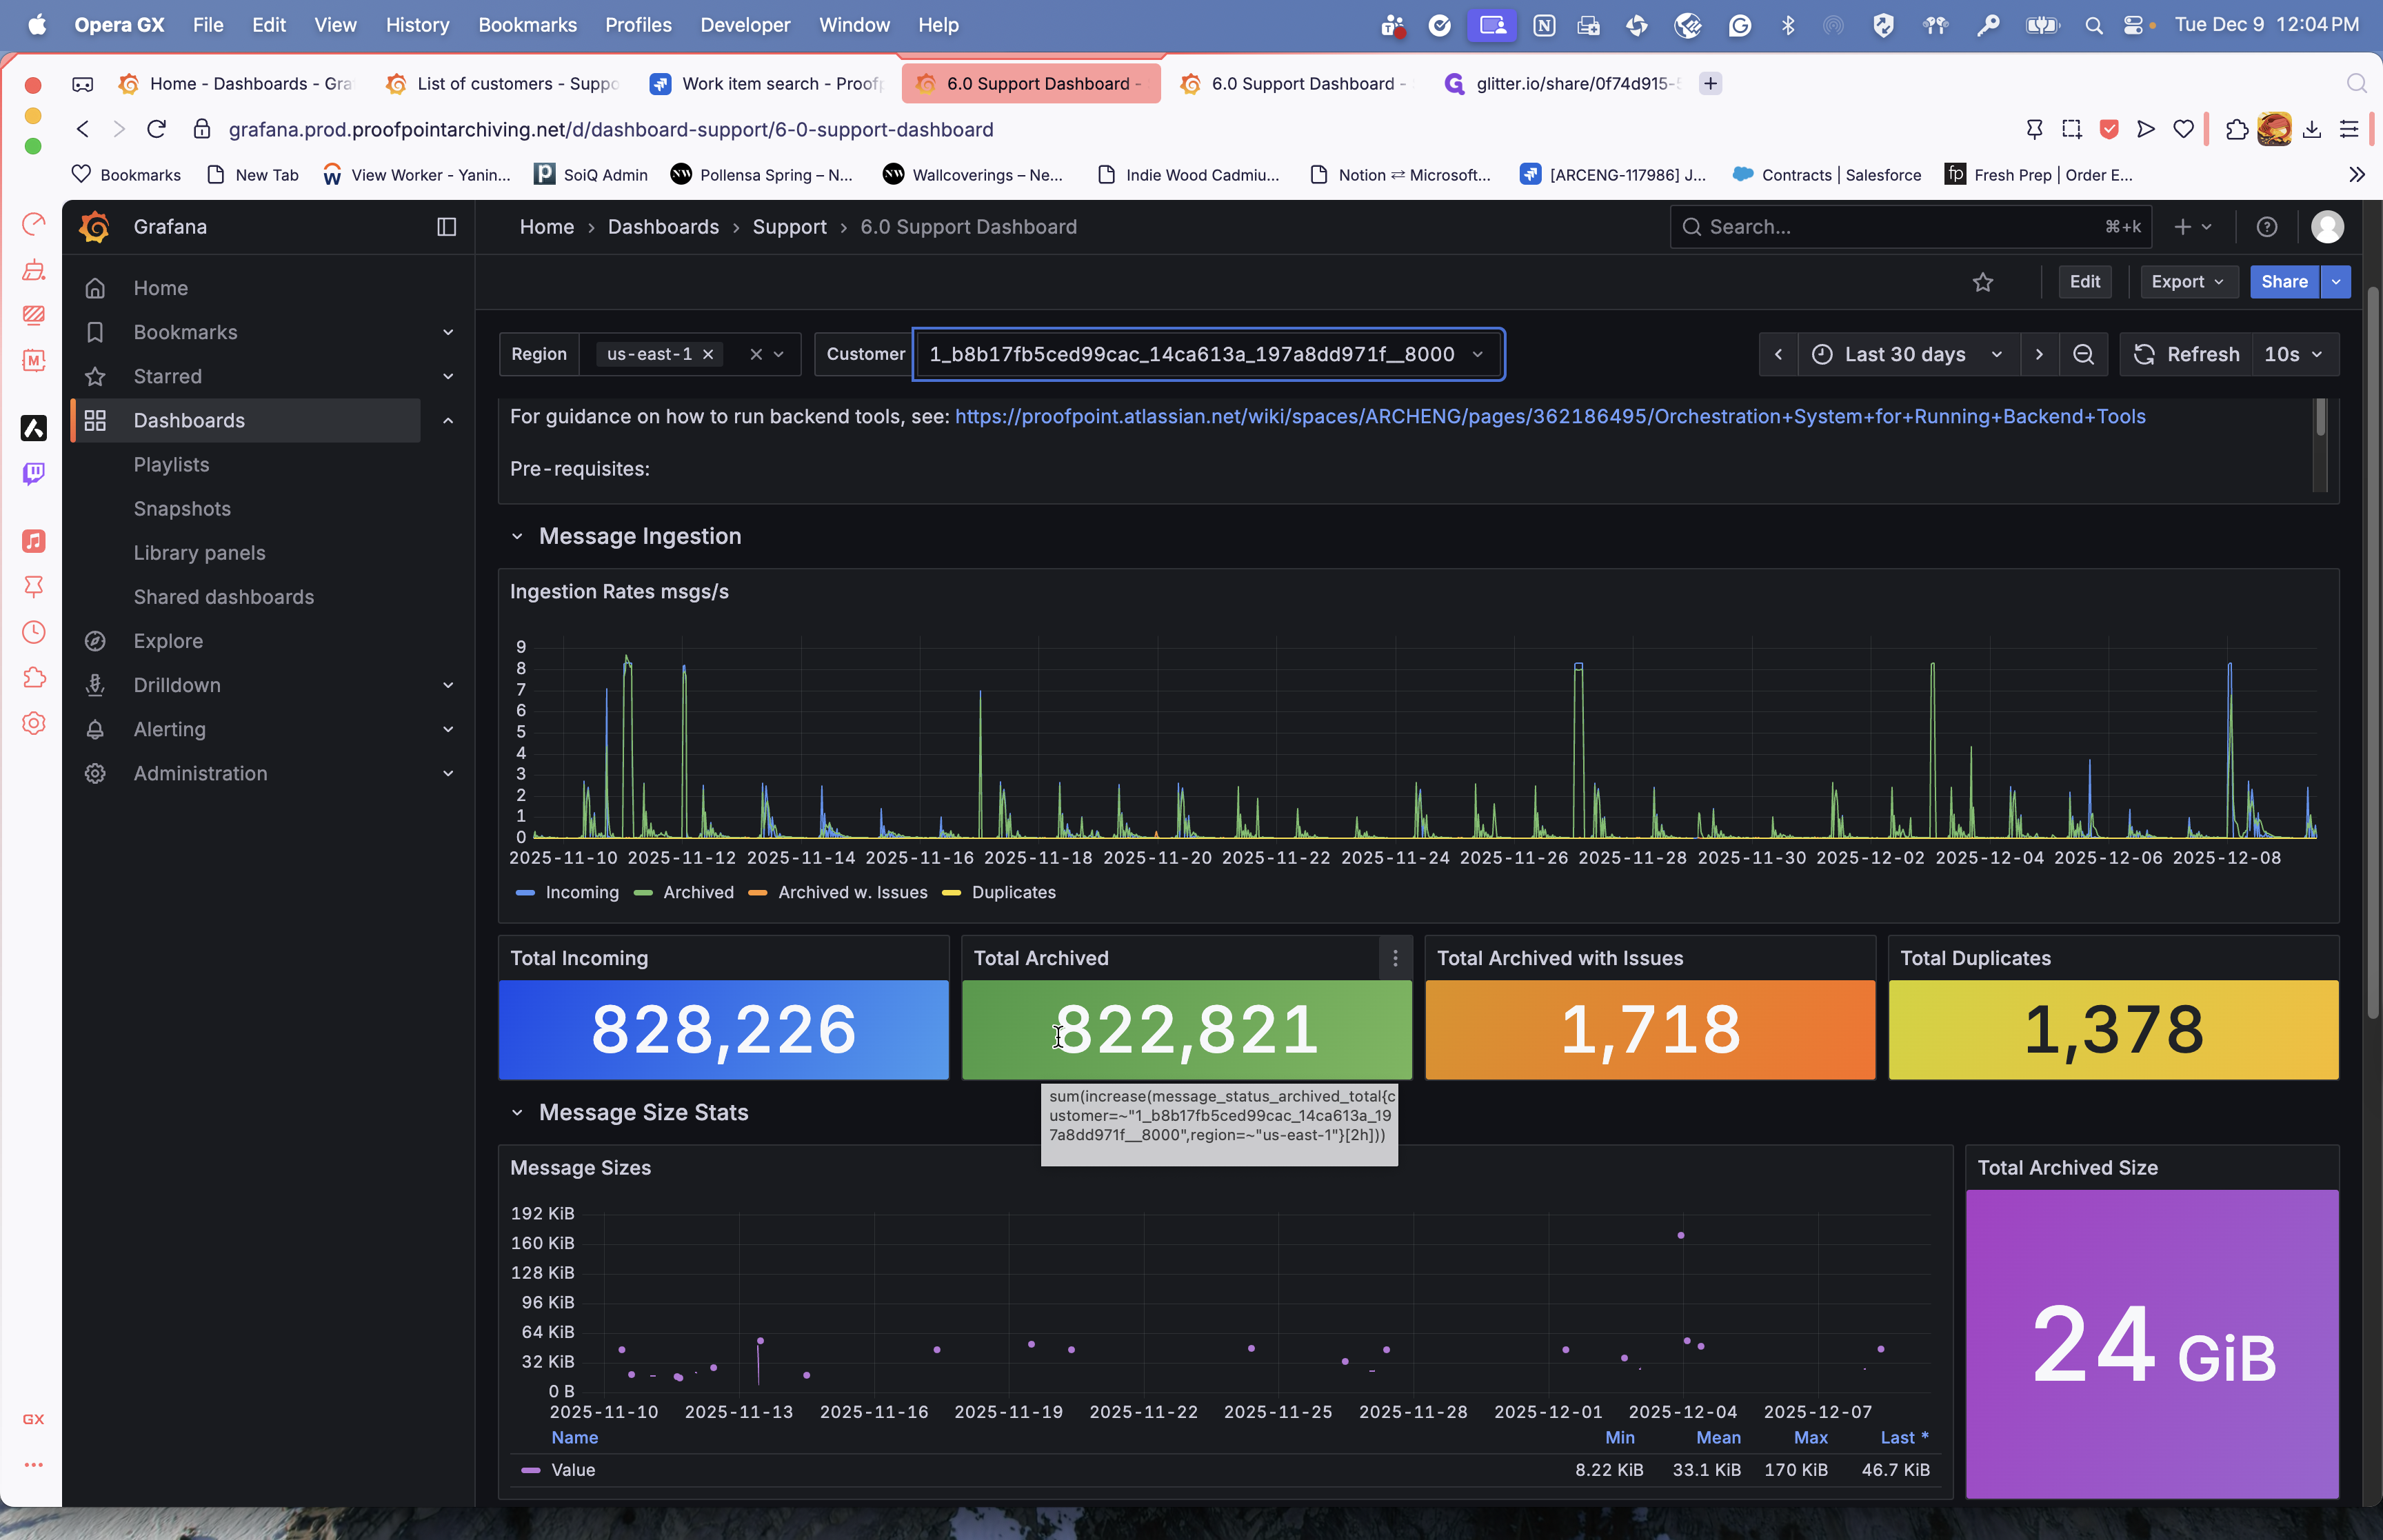
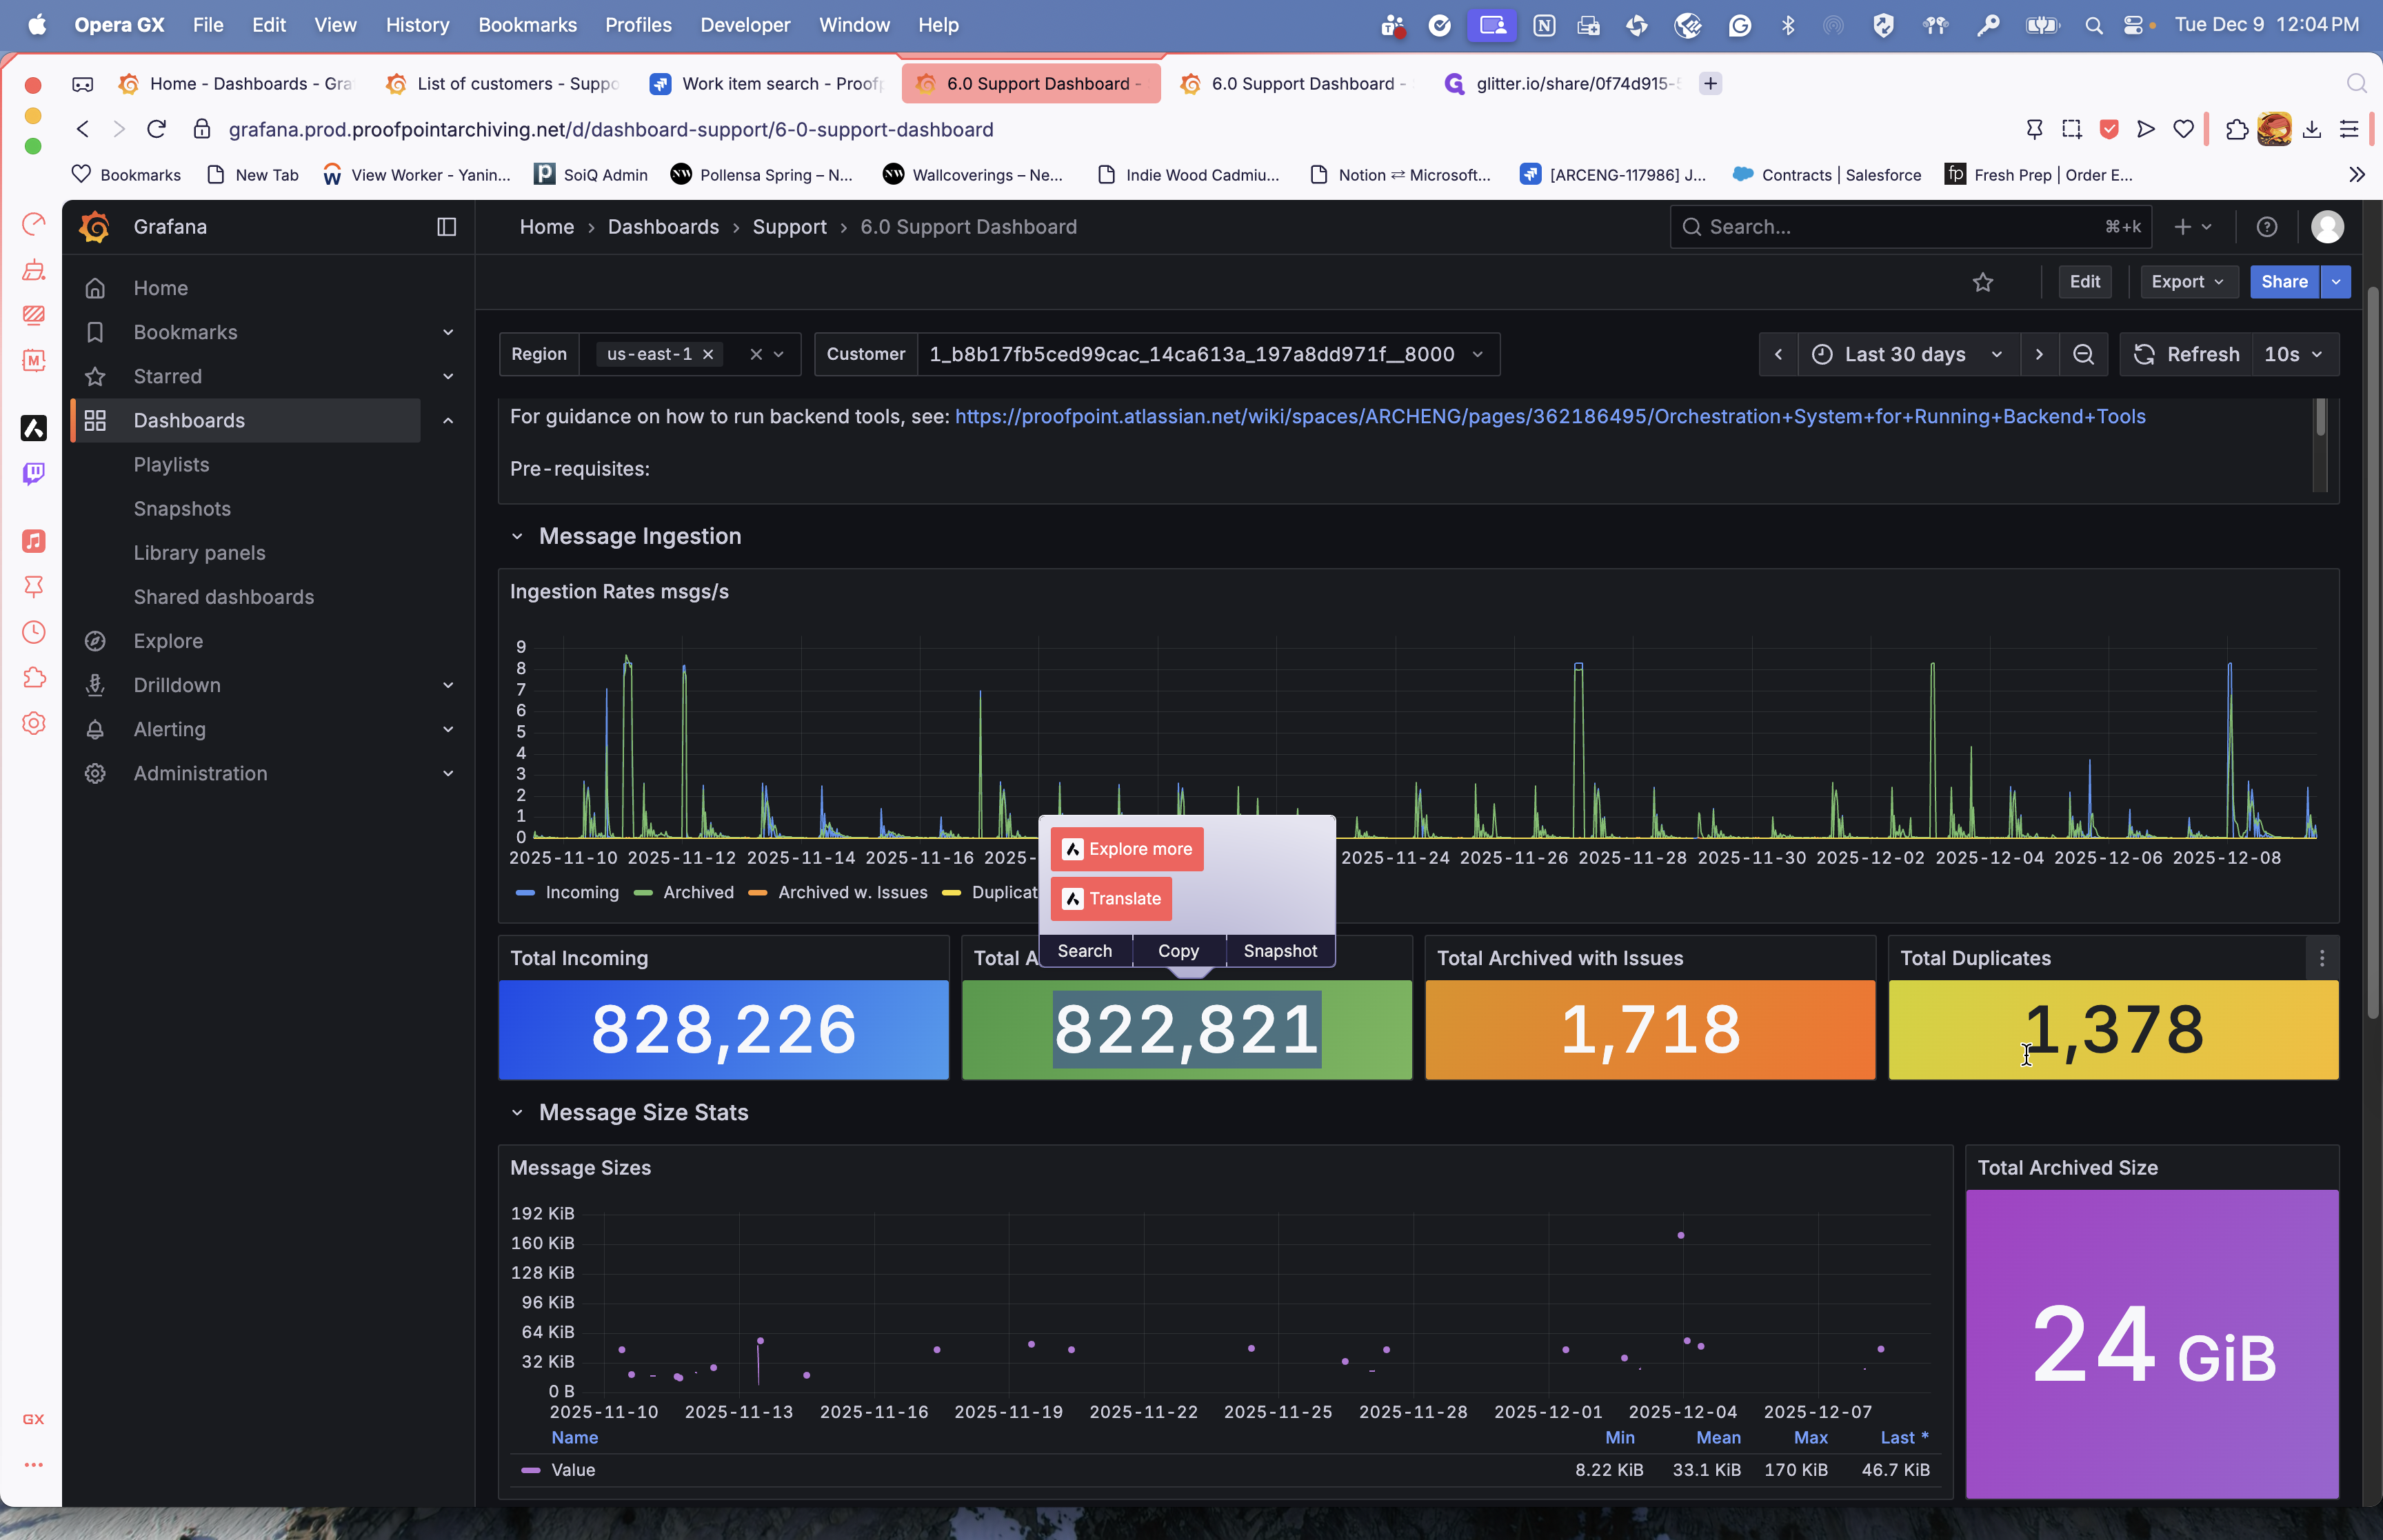
You can see the size of the messages we have been archiving here. The total size of the archive is 24 gigabytes.
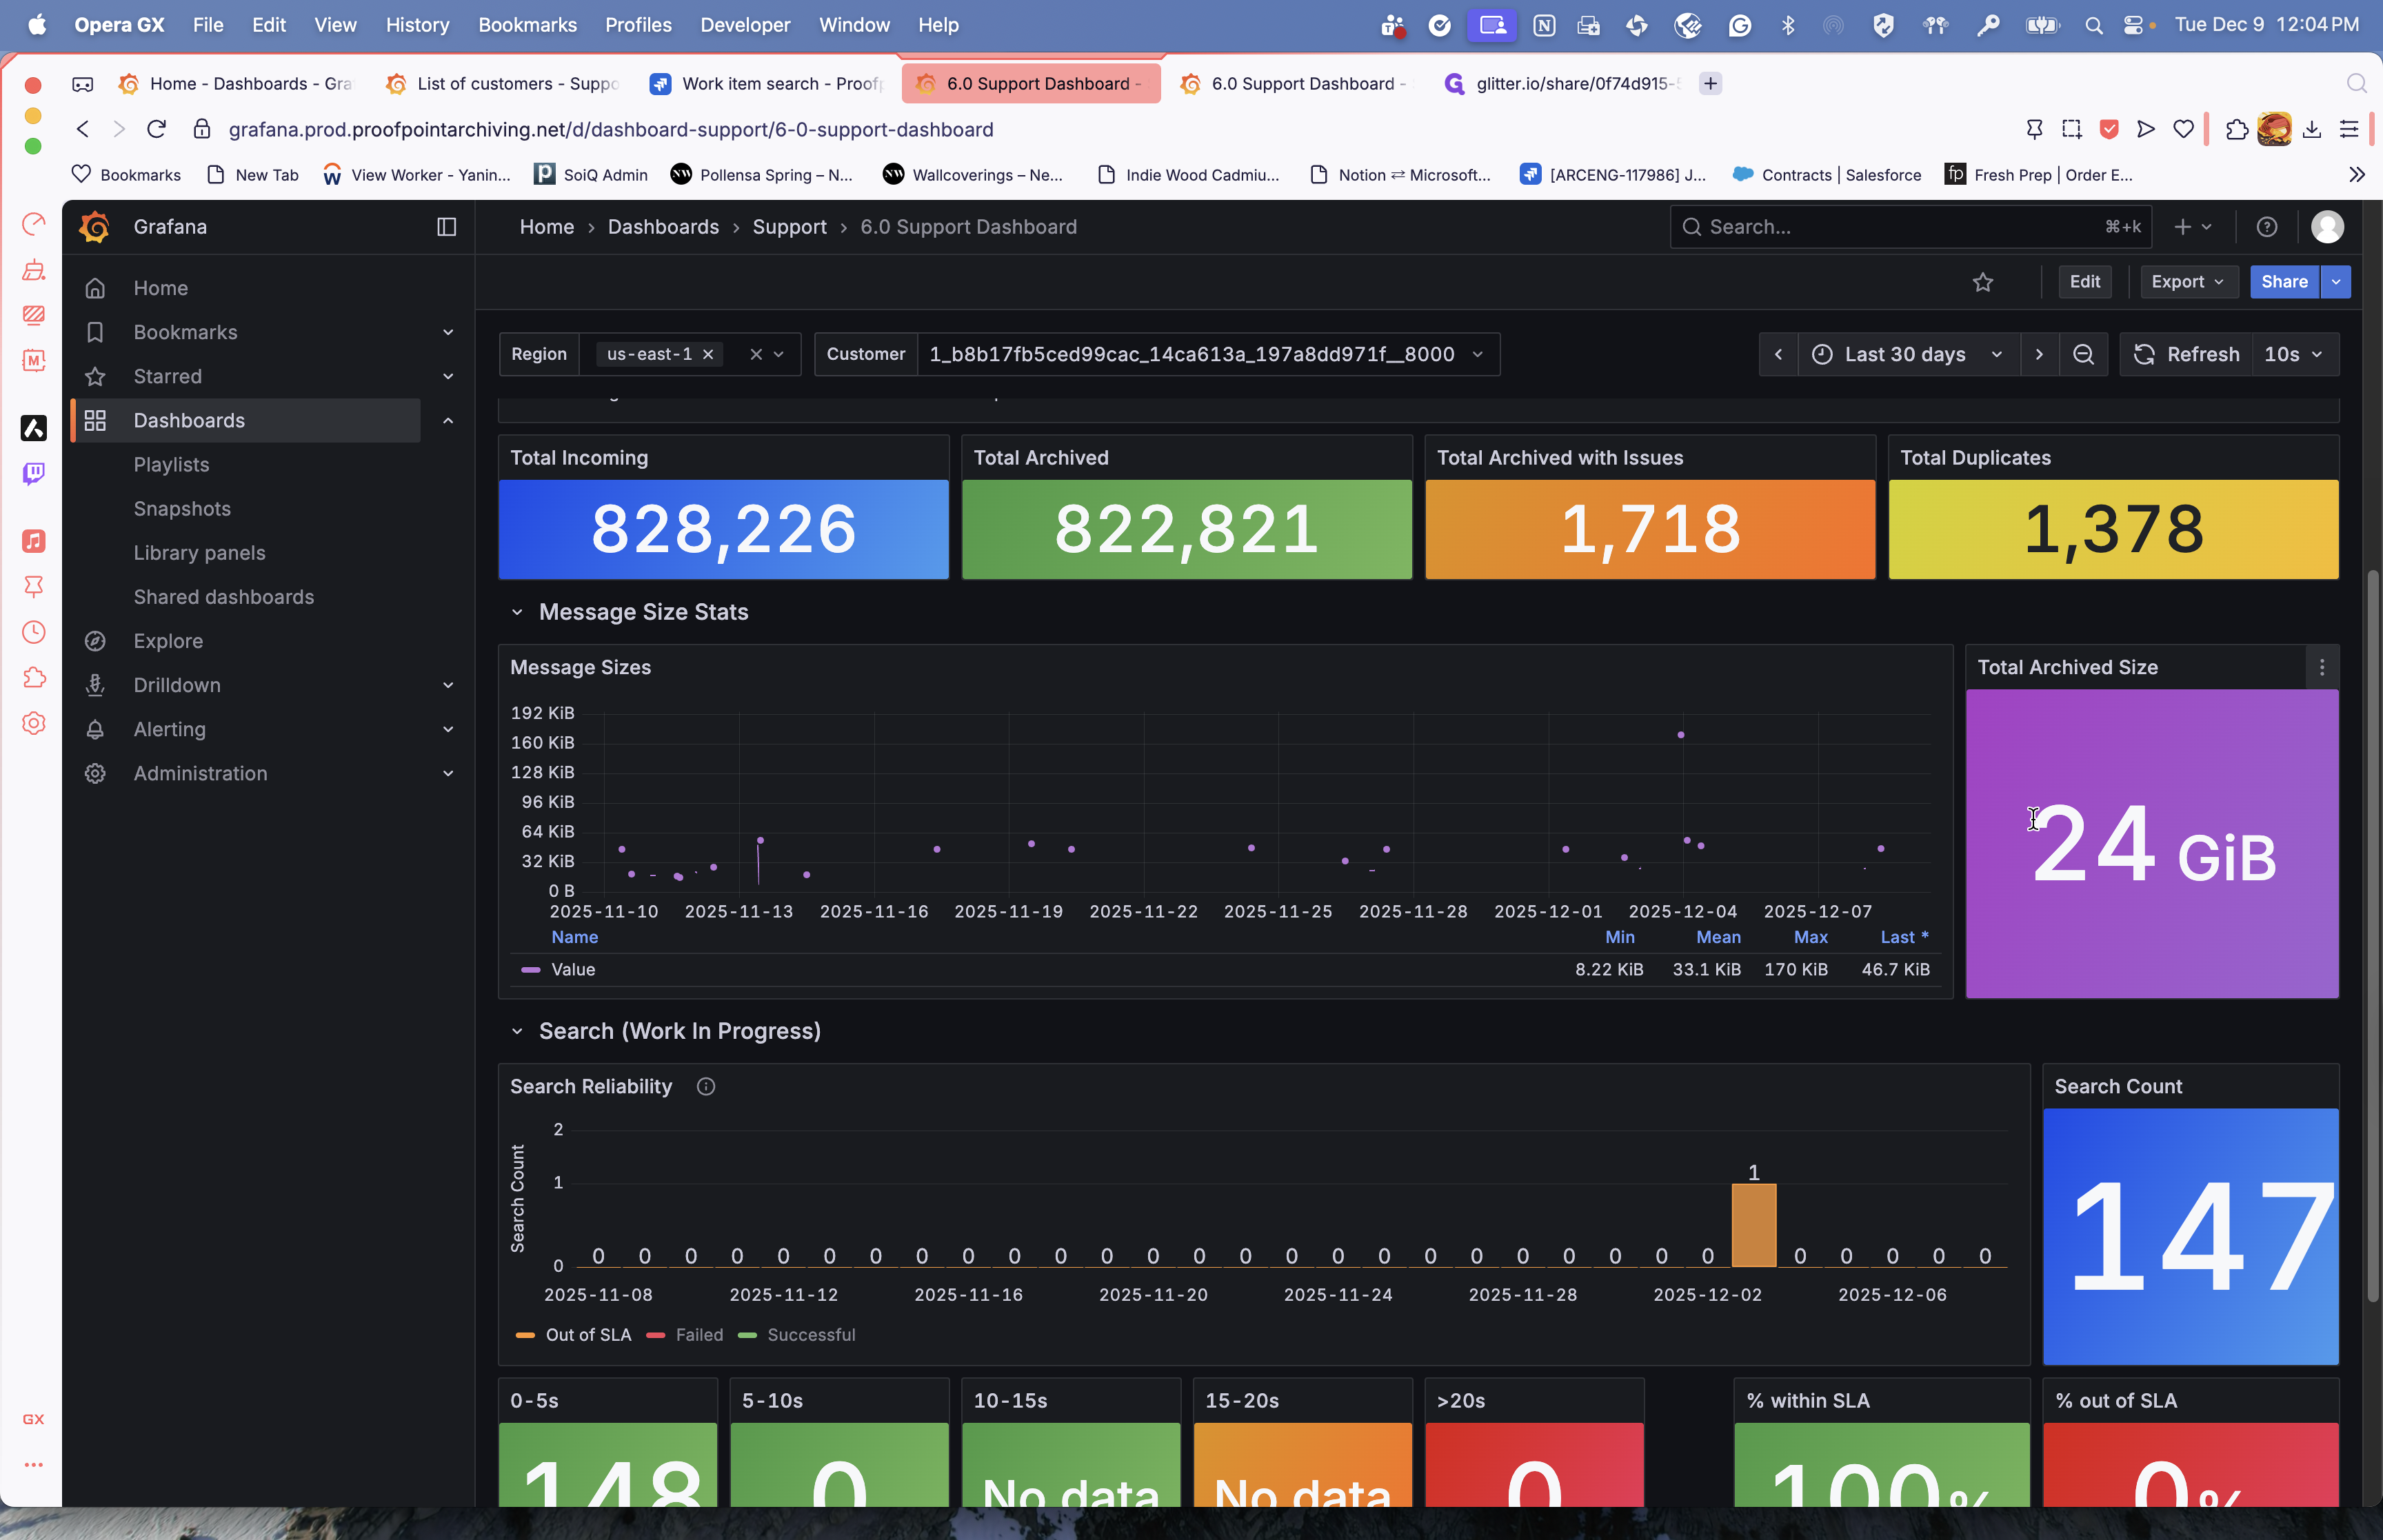
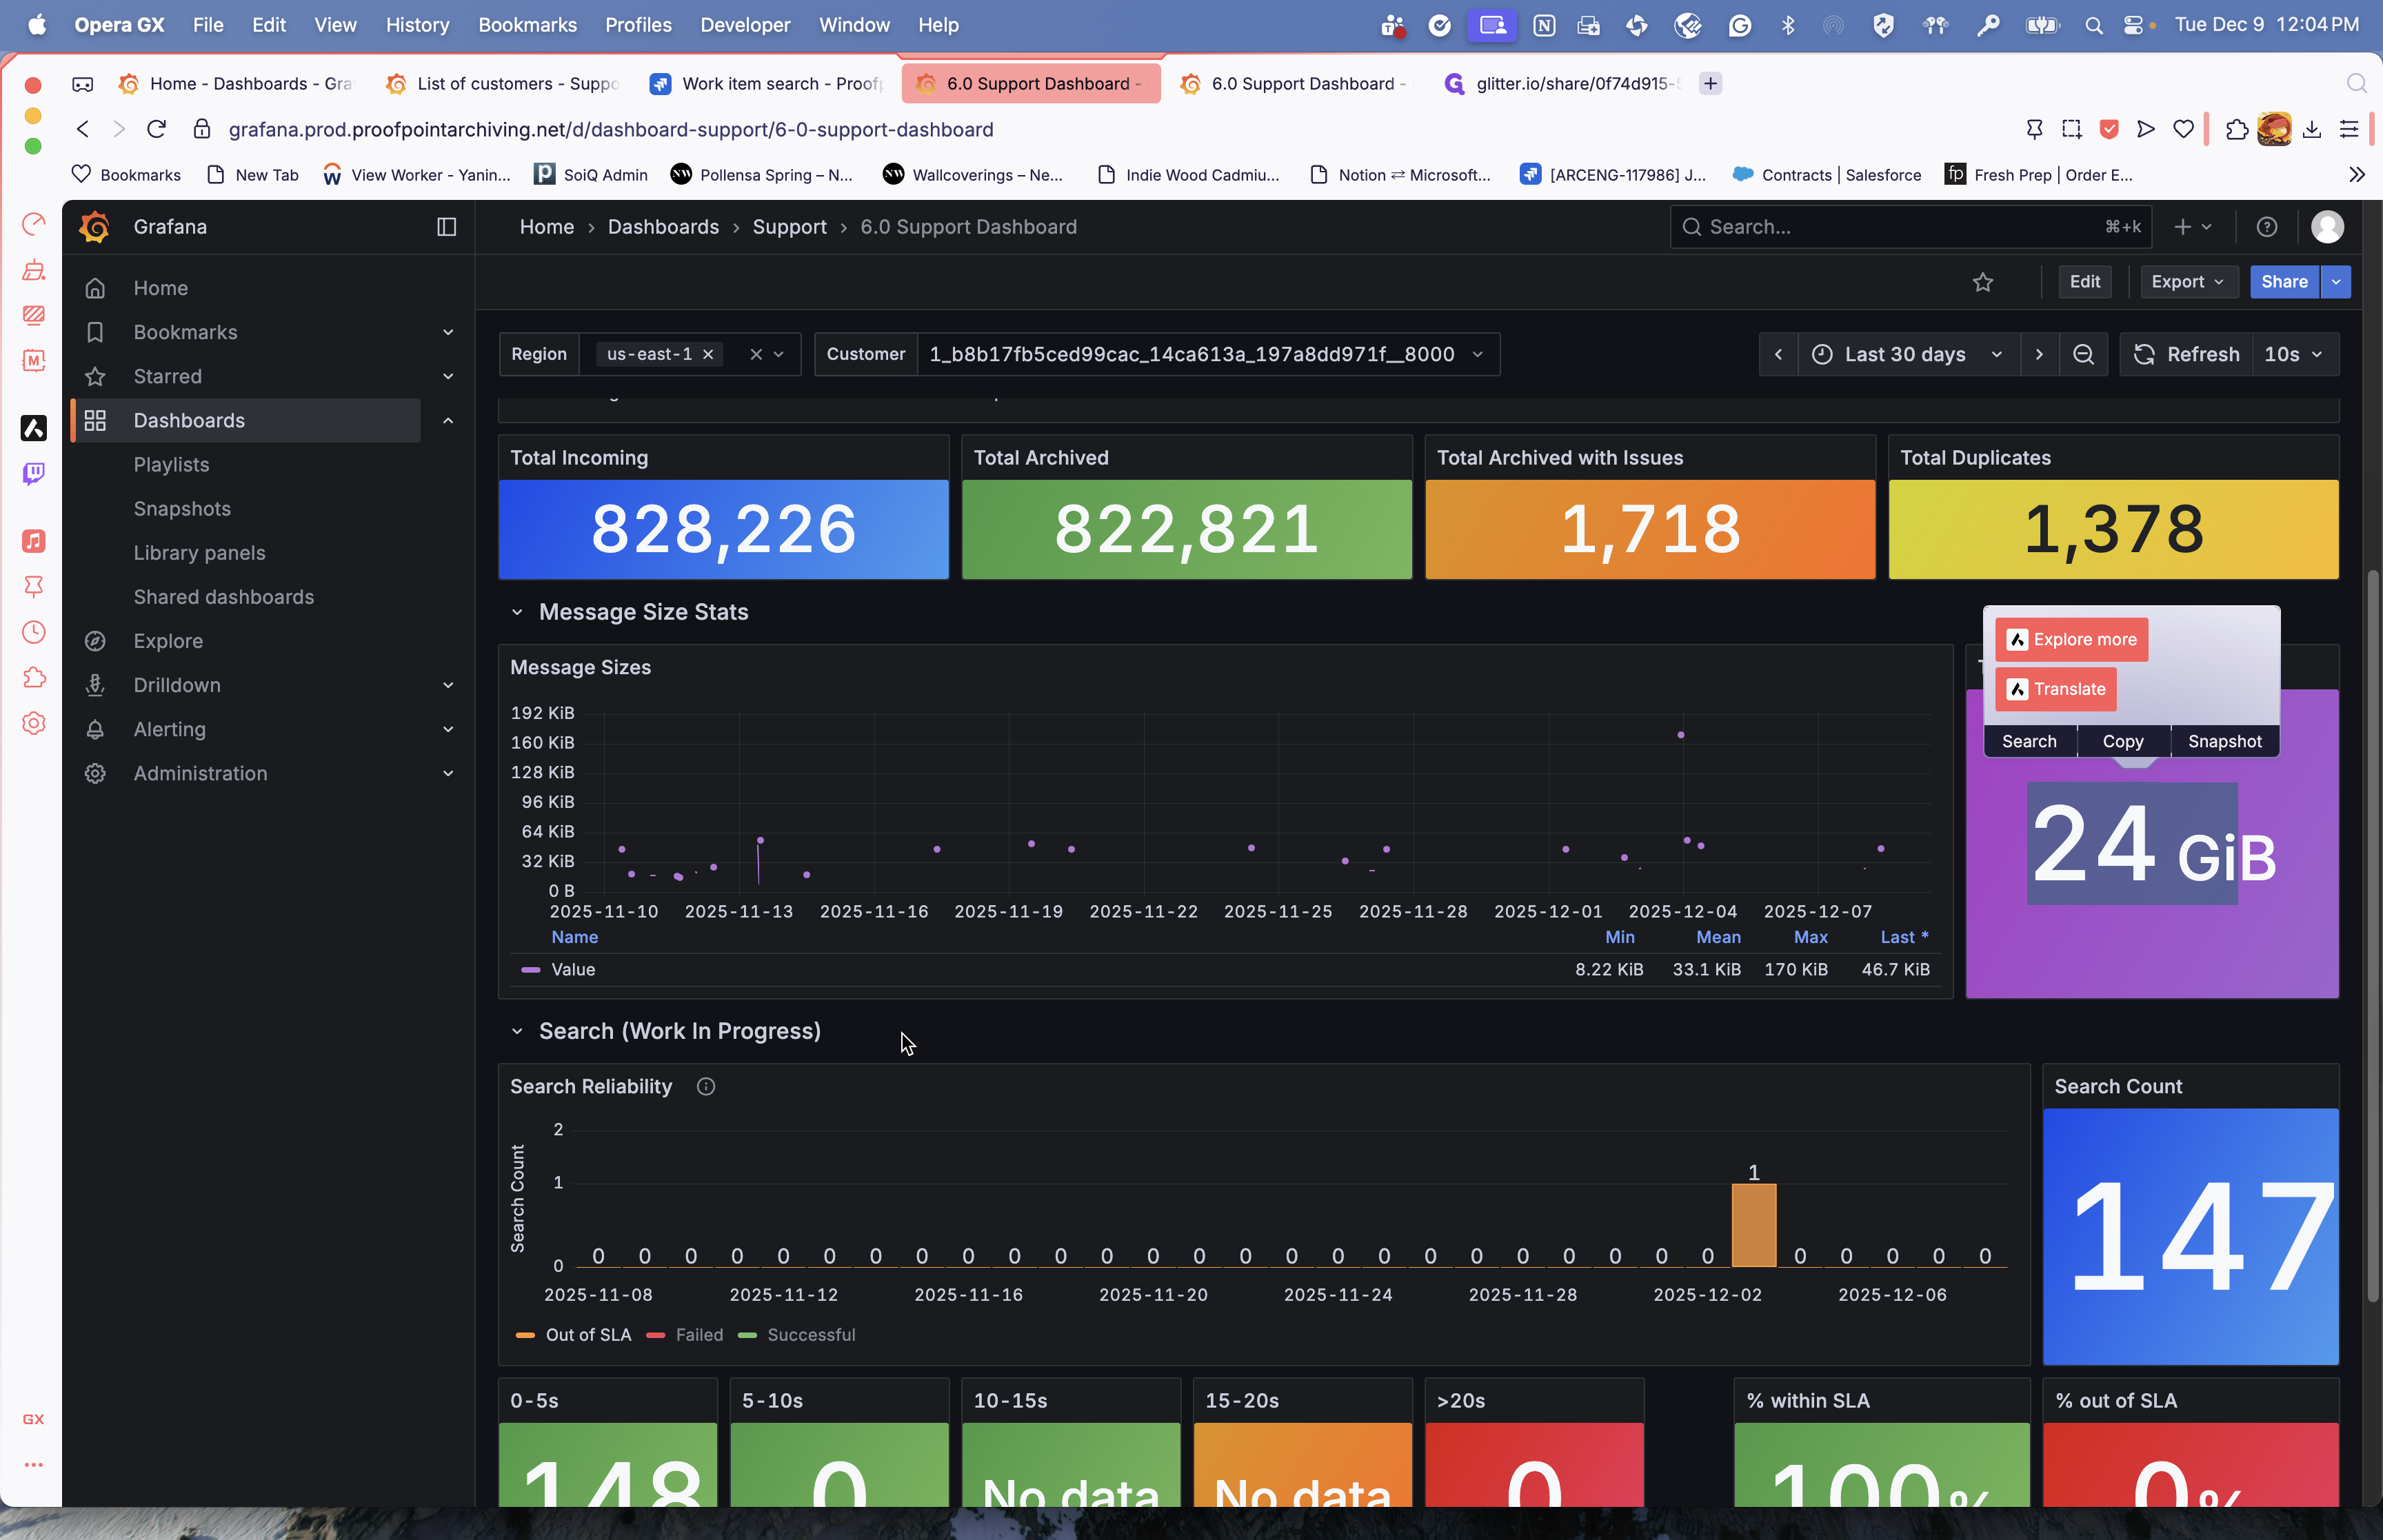

No searches are taking longer than that. None of the searches are out of SLA.
You can also view the status of your most recent successful AD sync.
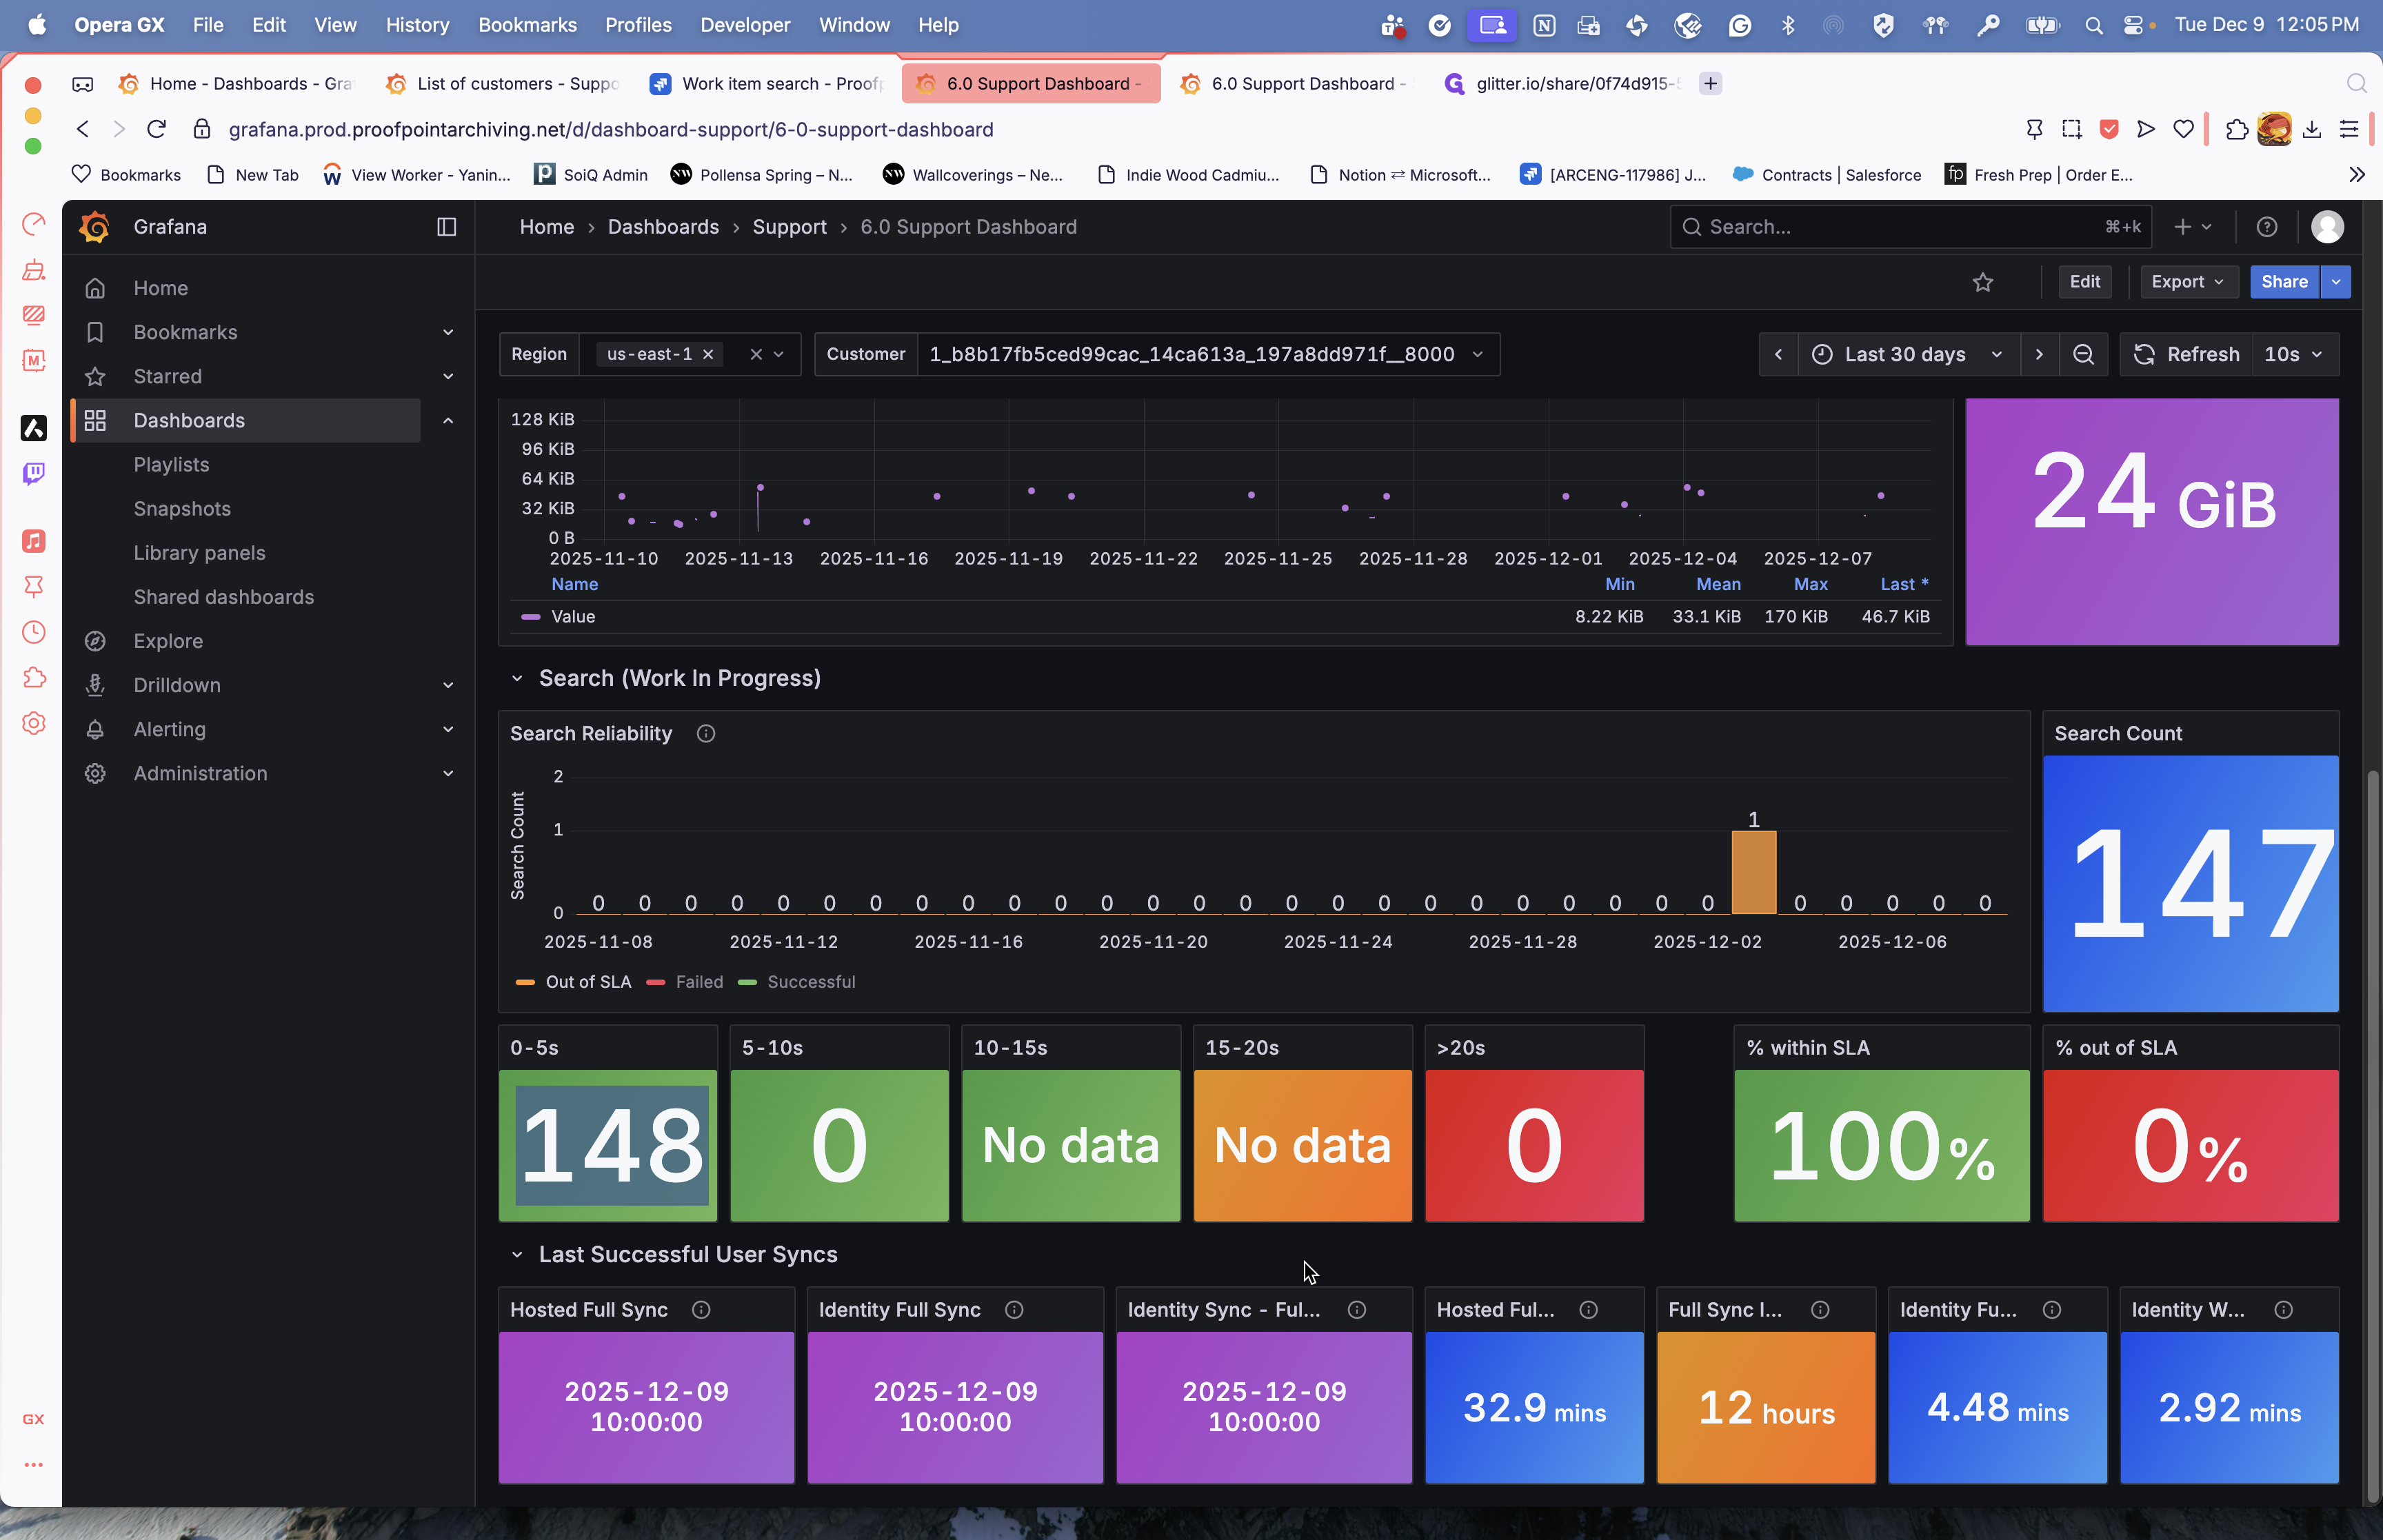
The hosted full sync occurred today.

The identity store was updated today.

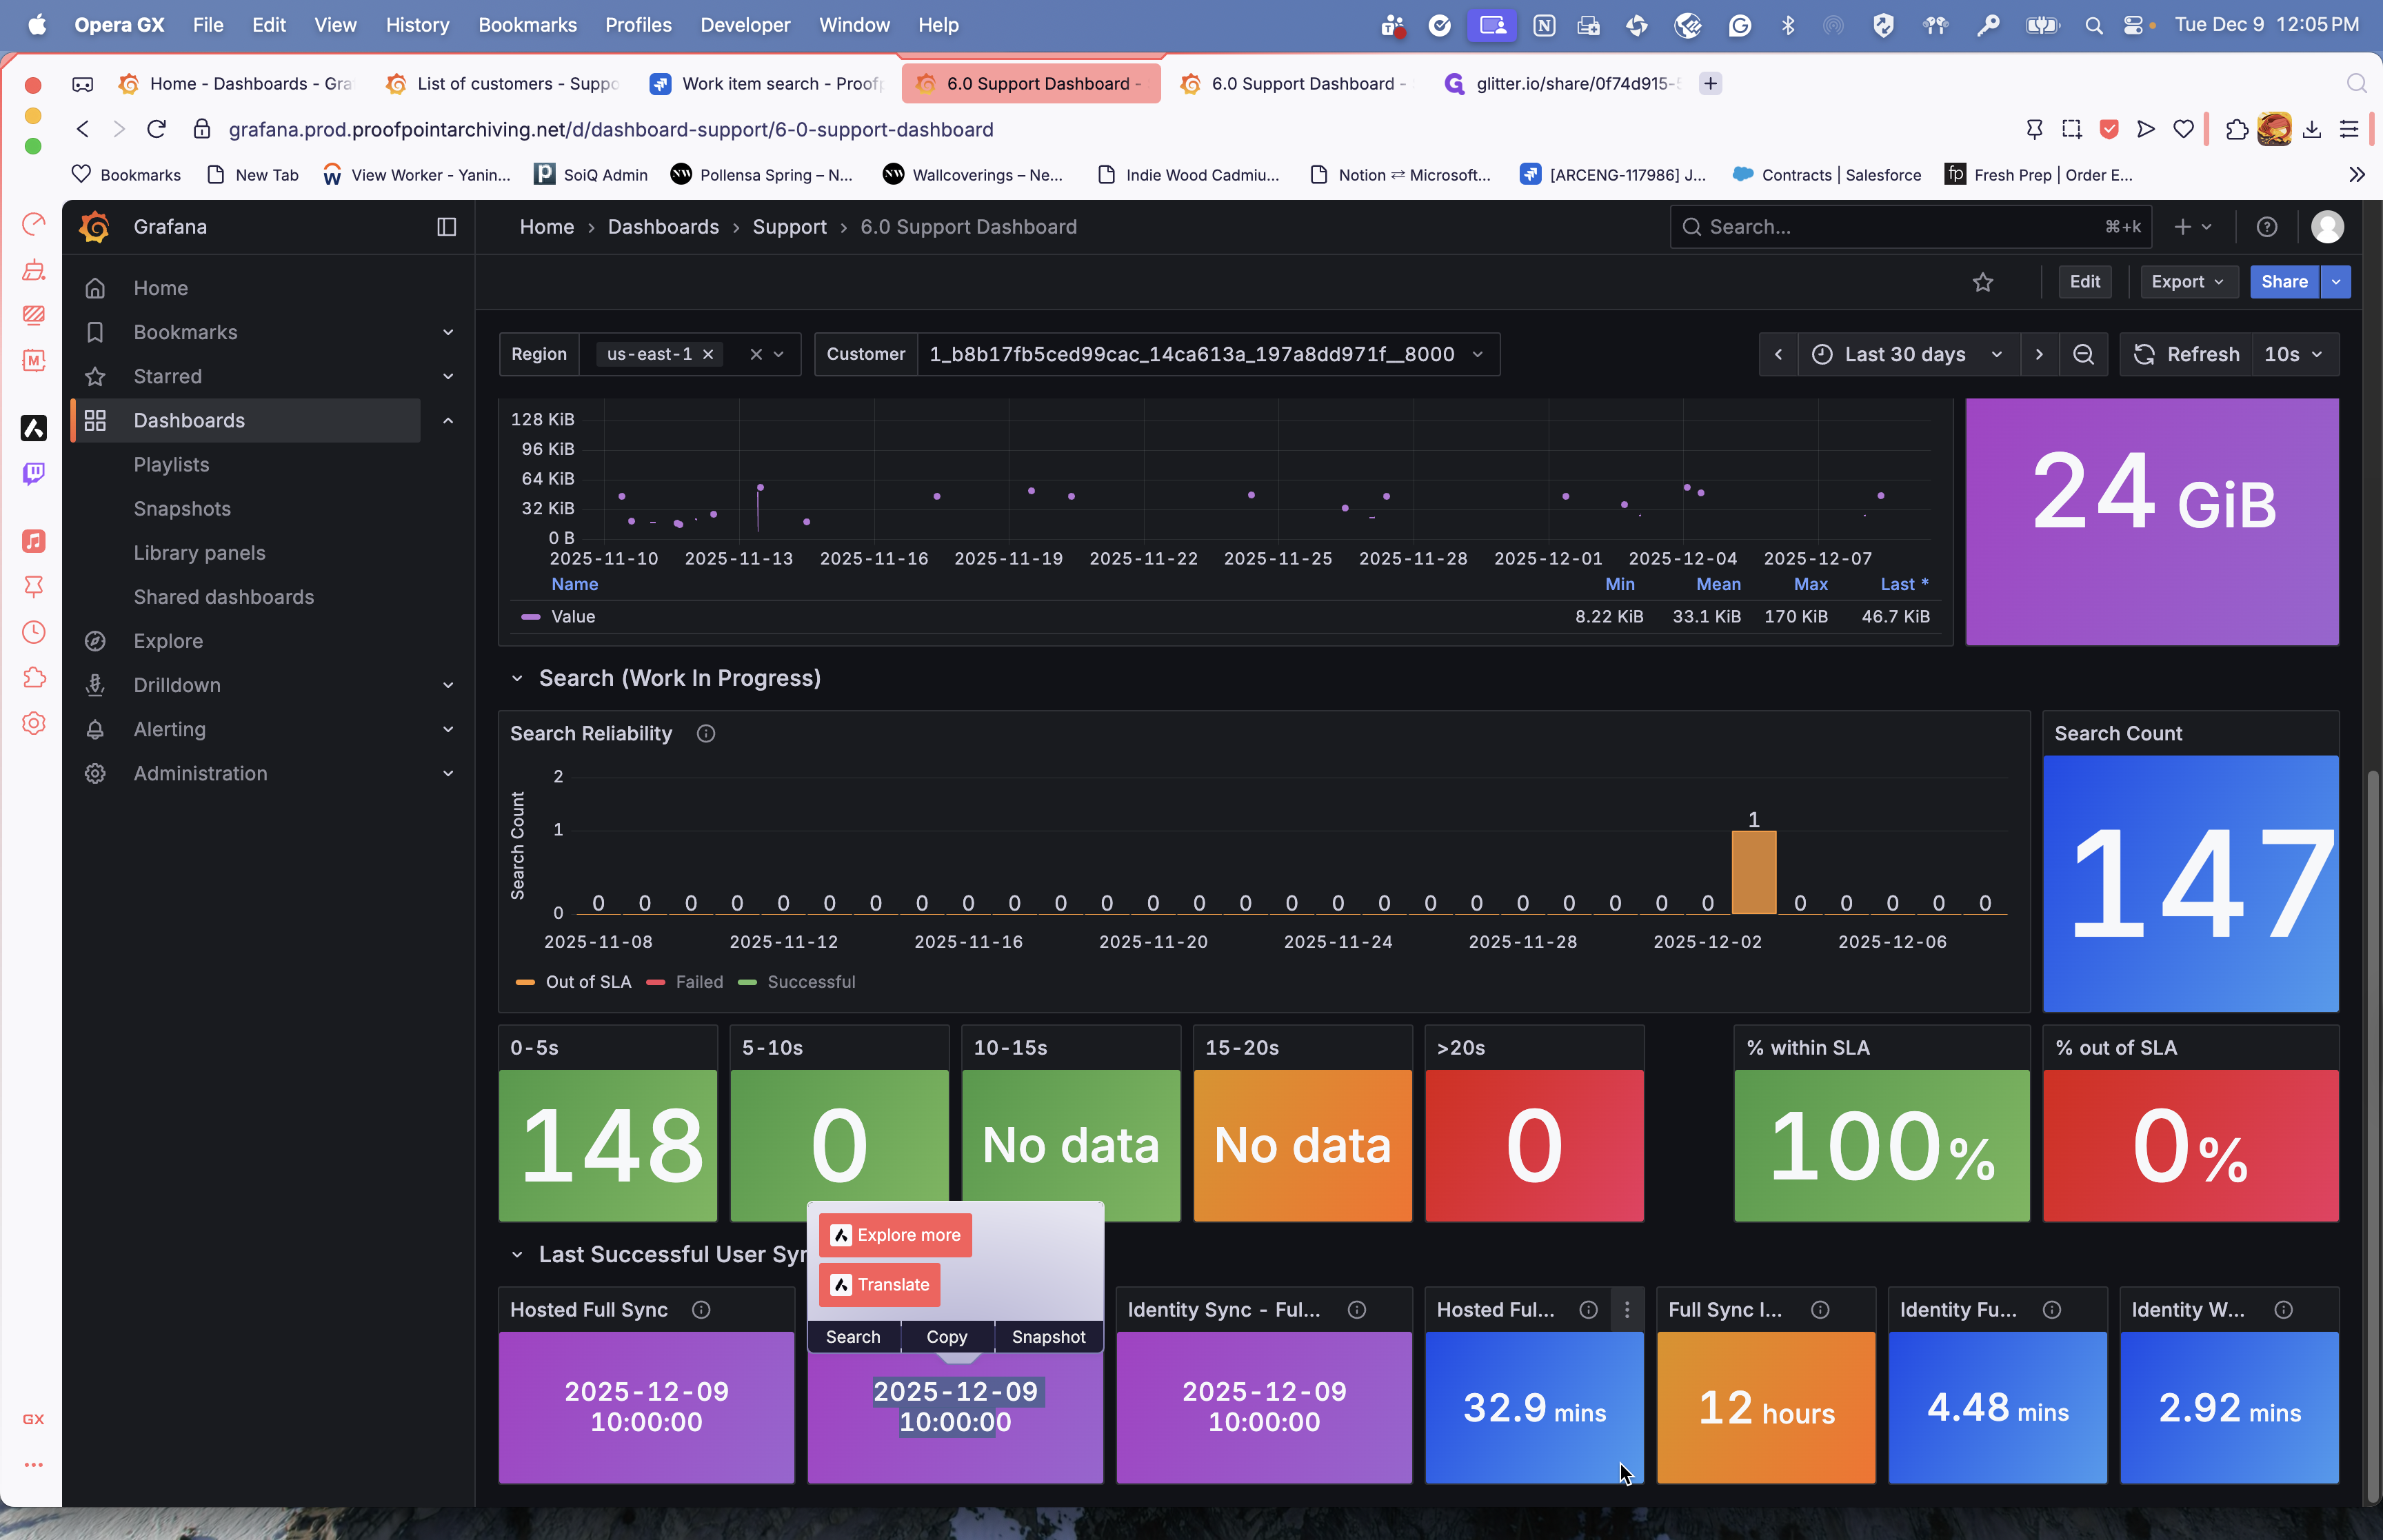
Your hosted full sync also shows how long each one took.


All the details are provided here. You can also select the last 24 hours if needed.

You can change the range of the data being provided to you.
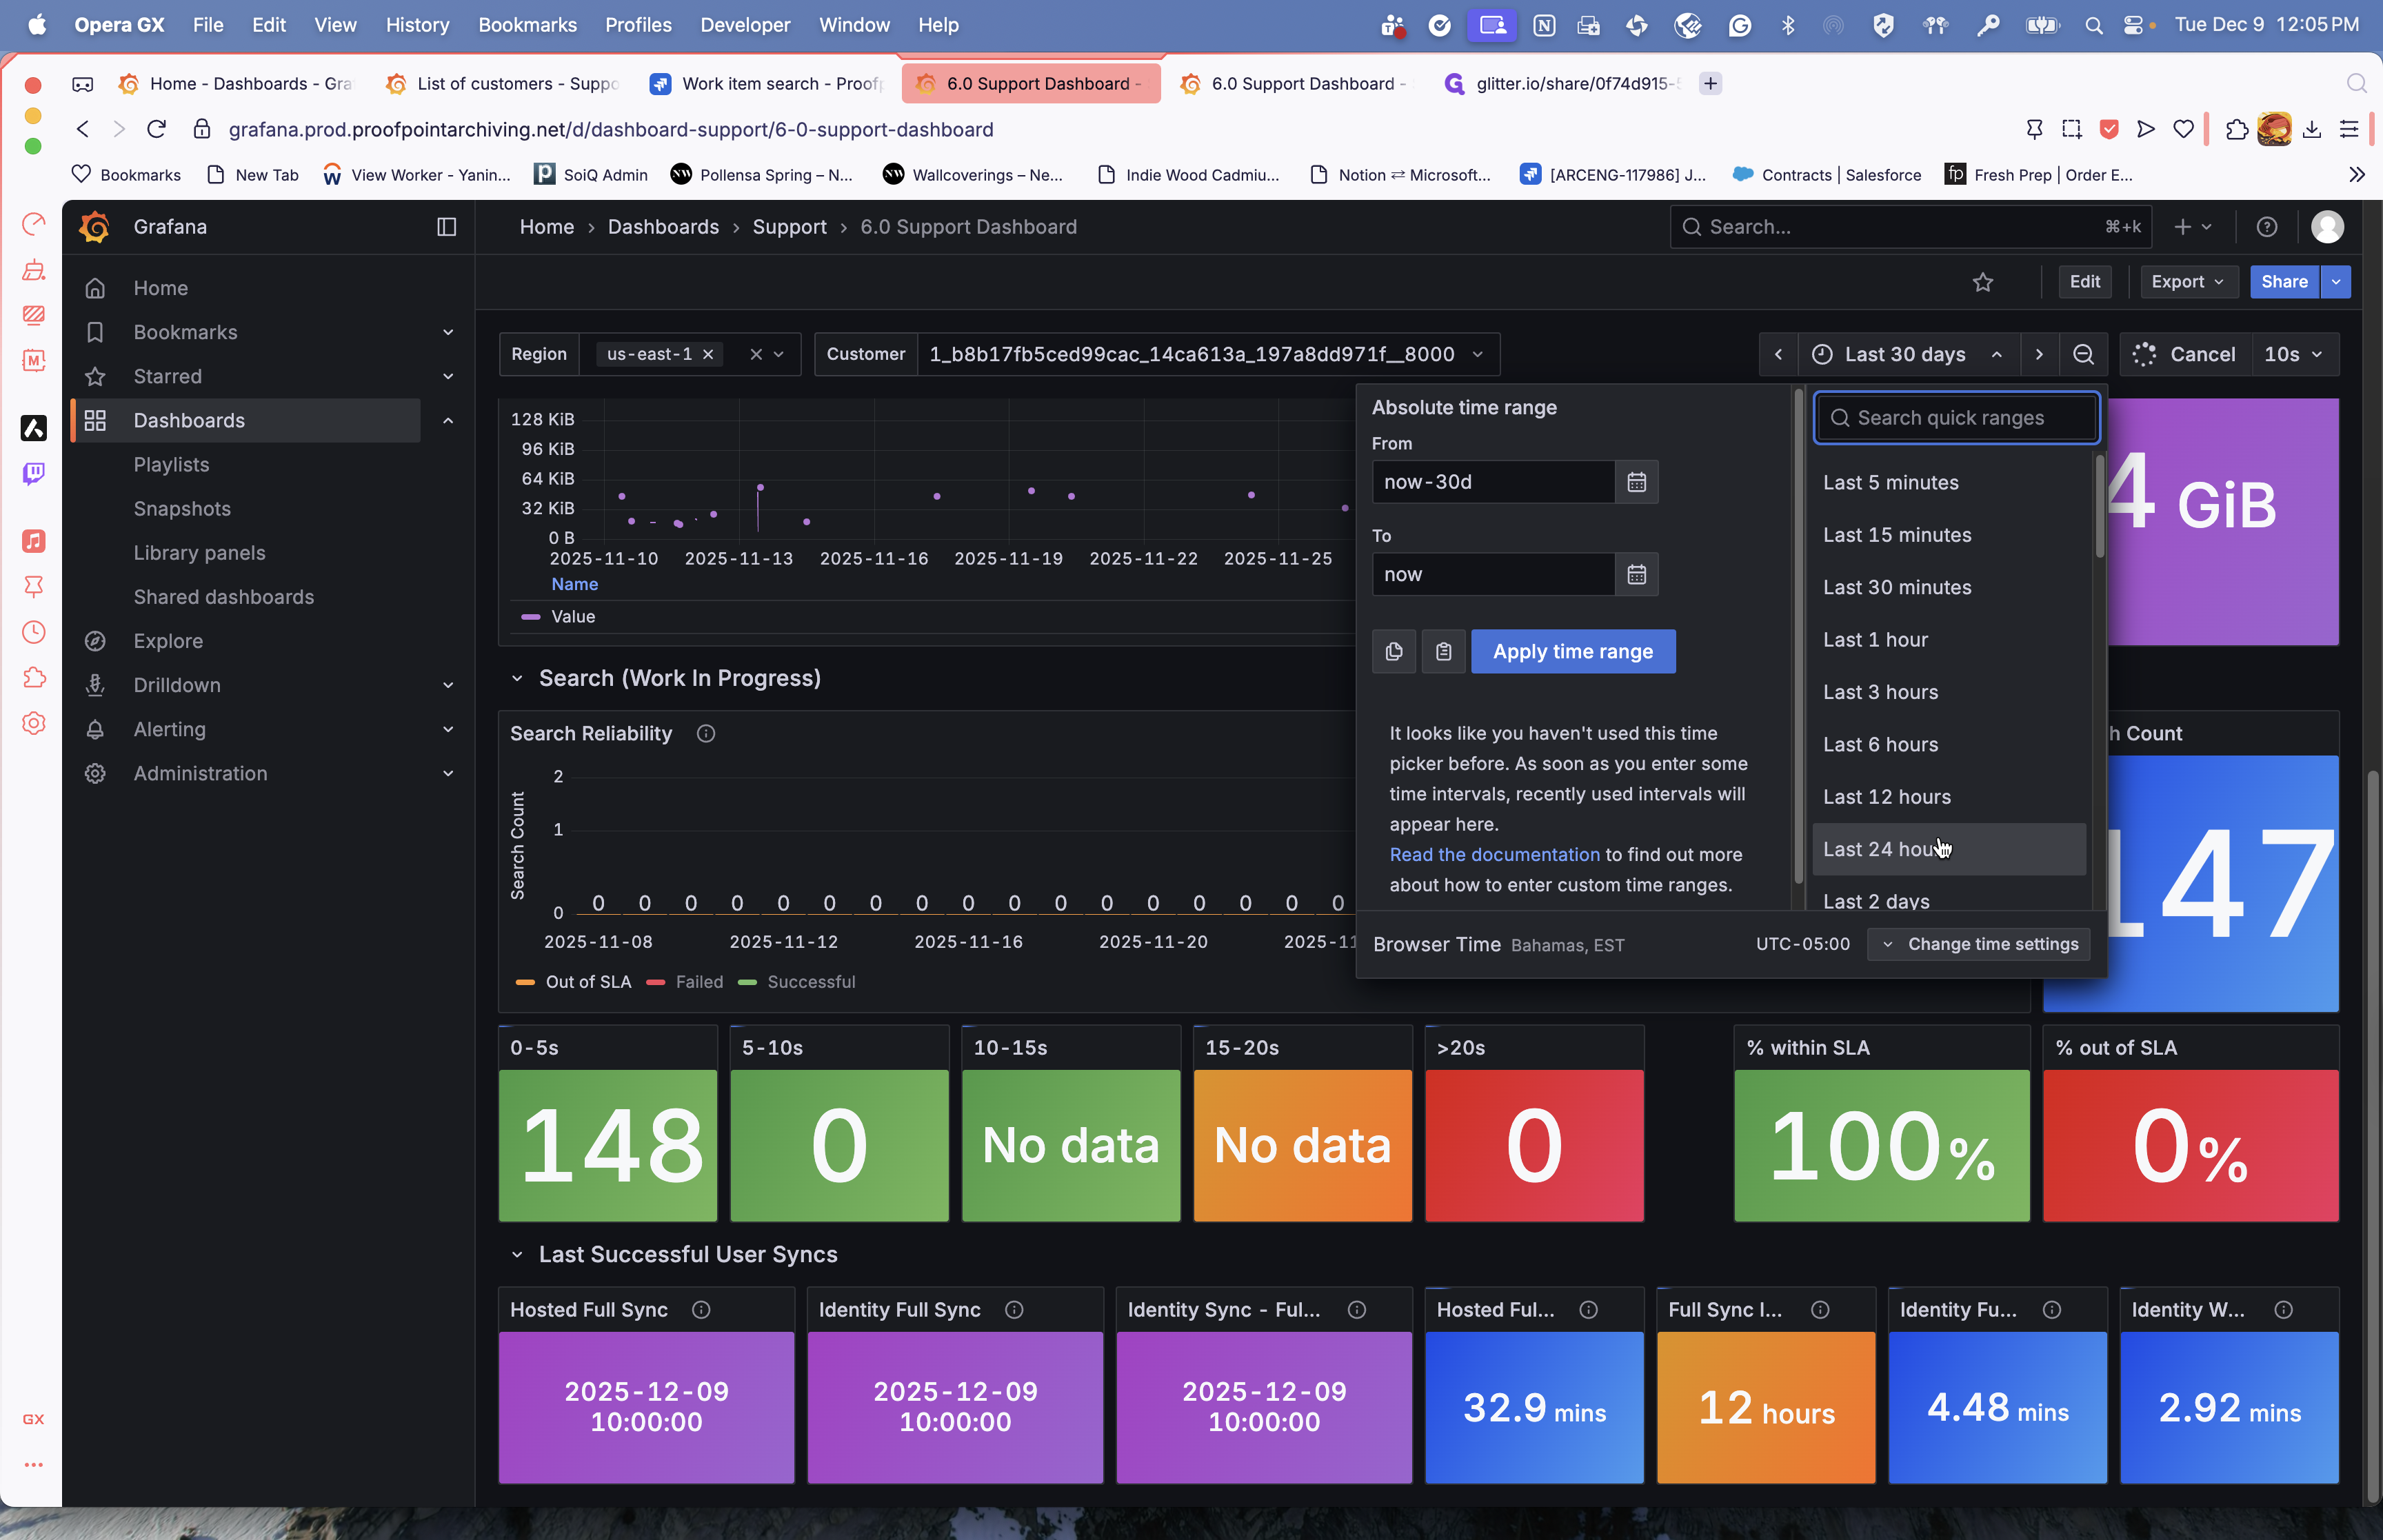
Let's say we want to see the data from the last 24 hours. The data will be updated accordingly. In the past 24 hours, we have archived 15,000 messages, including a few duplicates.
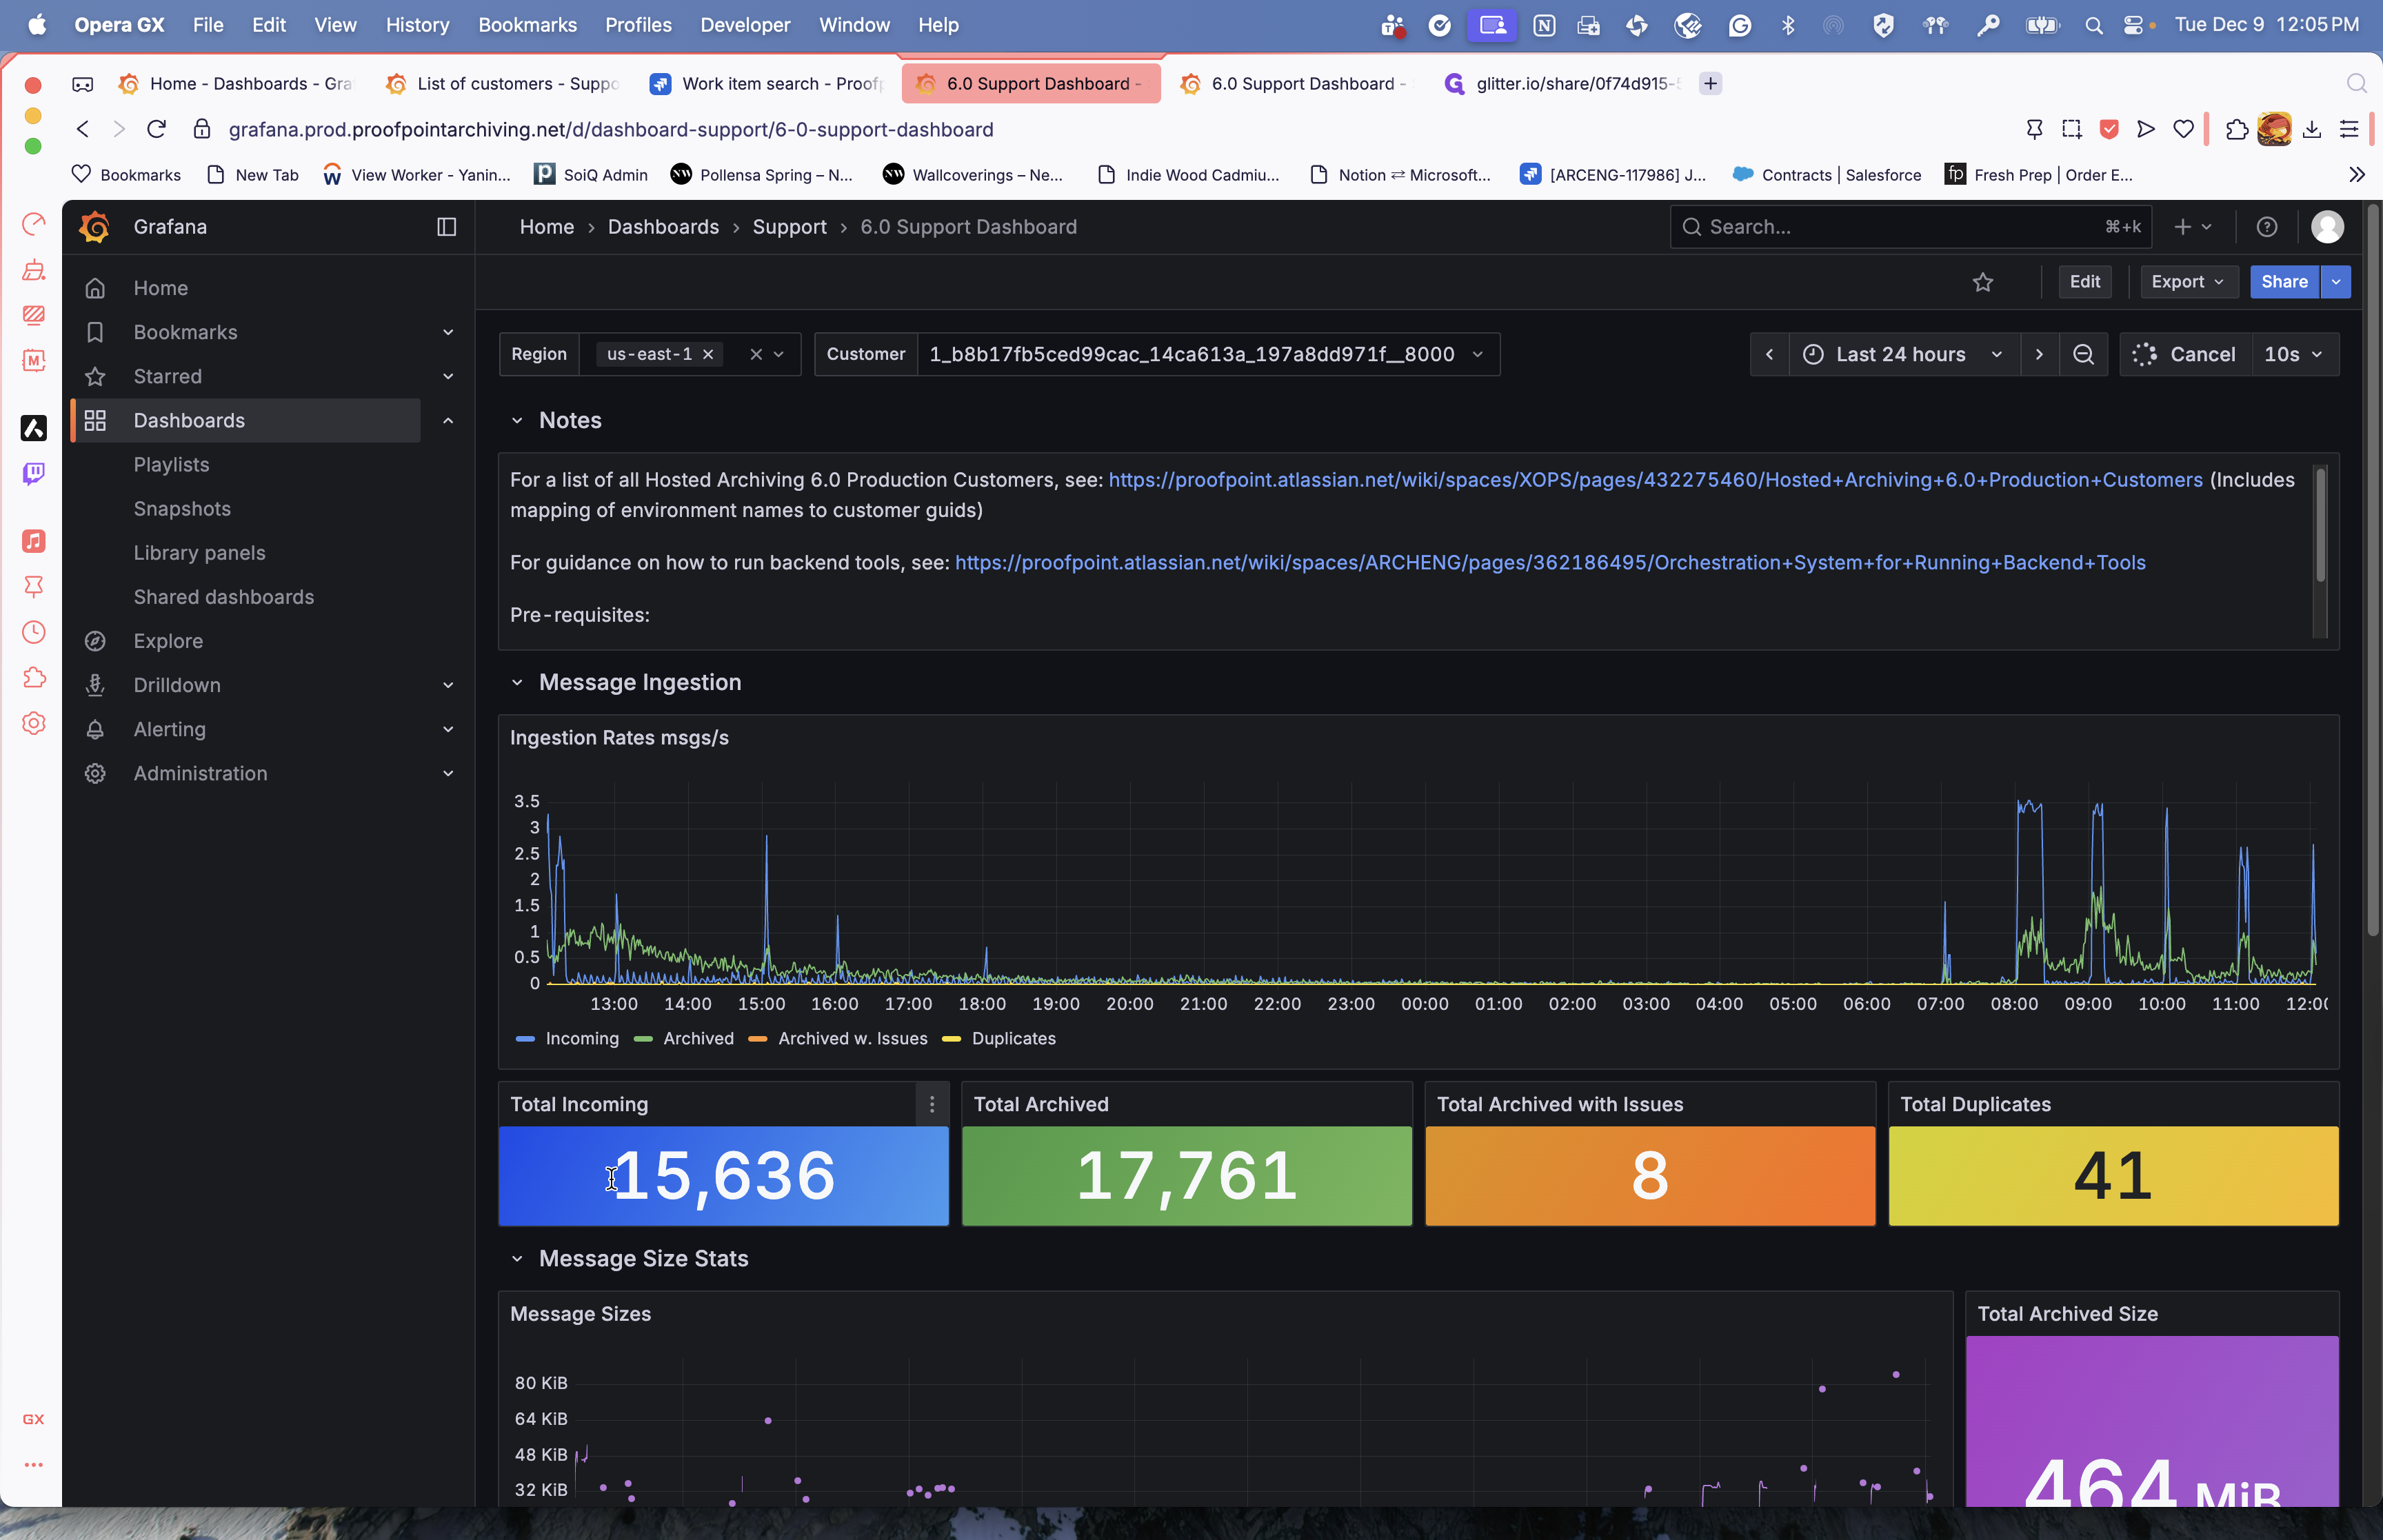
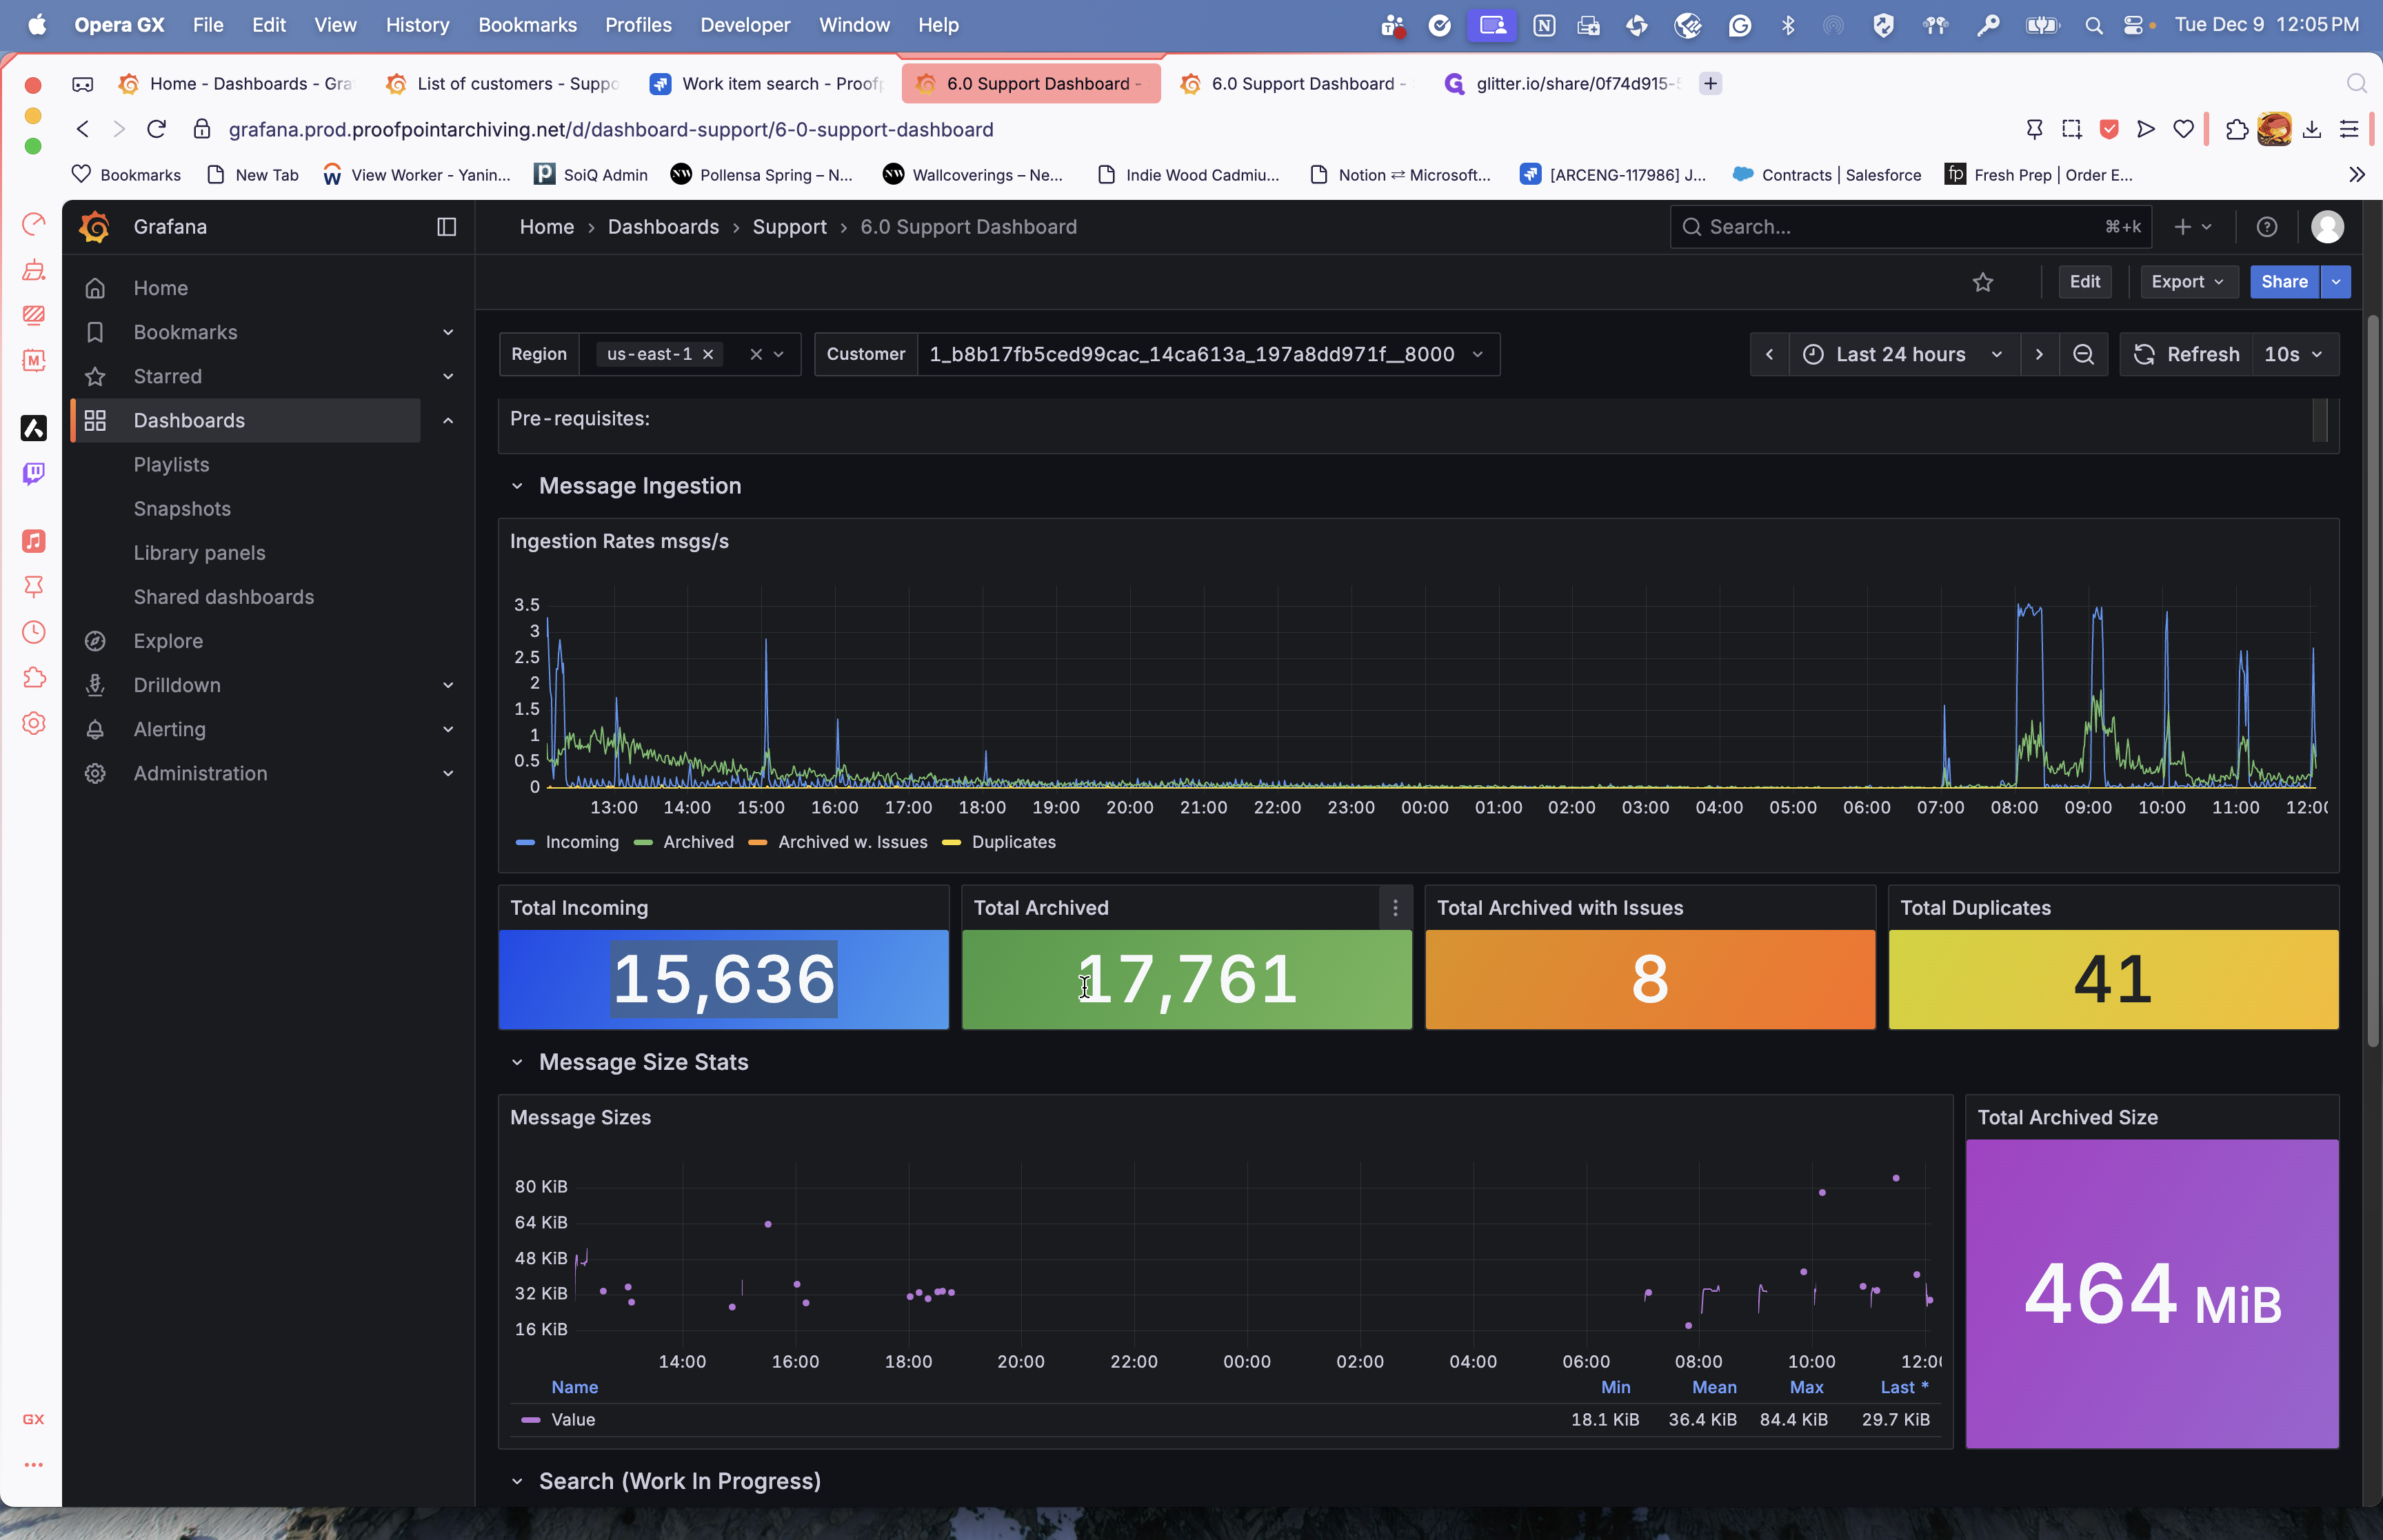
It shows how much we archived during that period, and whether the client performed any searches. The sync still shows the last sync as today. That is all.