
How to Create a Simple Dashboard Widget Using Insights 2.0
Learn how to create and customize dashboards using Insights 2.0 with user-friendly design and live data filtering.
In this guide, we'll learn how to create a new dashboard using Insights 2.0. The focus is on simplifying the process of dashboard creation, offering two main methods: copying an existing template or starting from scratch. We'll explore how to add and configure visualizations, such as metrics and charts, and how to apply filters for dynamic data interaction. This guide will help you efficiently set up and customize dashboards to analyze ticket data and other metrics relevant to your organization.
Let's get started
We will cover how to create a new dashboard using Insights 2.
A significant aspect of Insights 2.0 is its user-friendly design, especially for creating dashboards. There are two ways to create a dashboard. First, create a copy.
To create a copy of a template, go to an existing template in the team support library and click "Make a Copy."
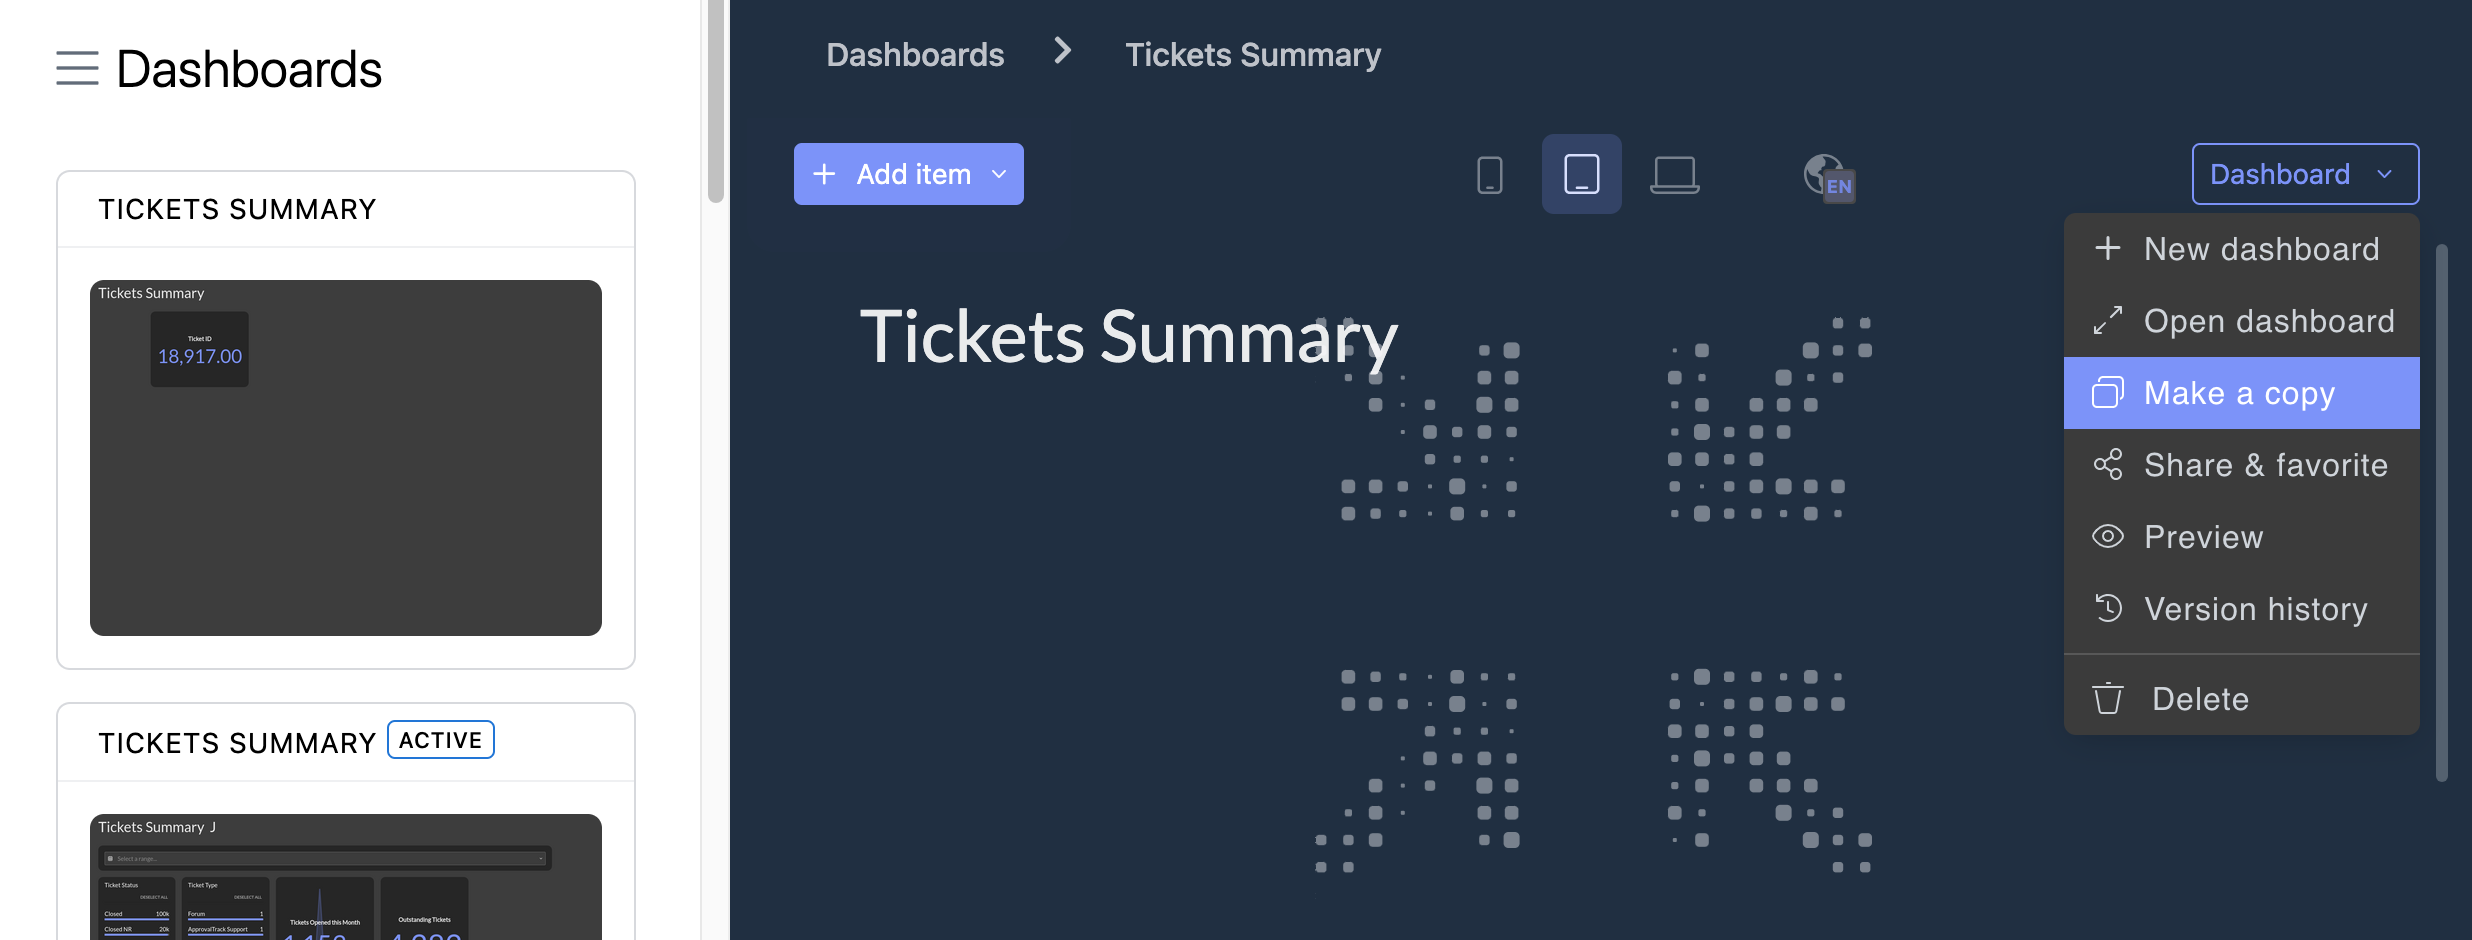
This will create a copy of the dashboard, add it to your collection, and let you update and manipulate the data easily.
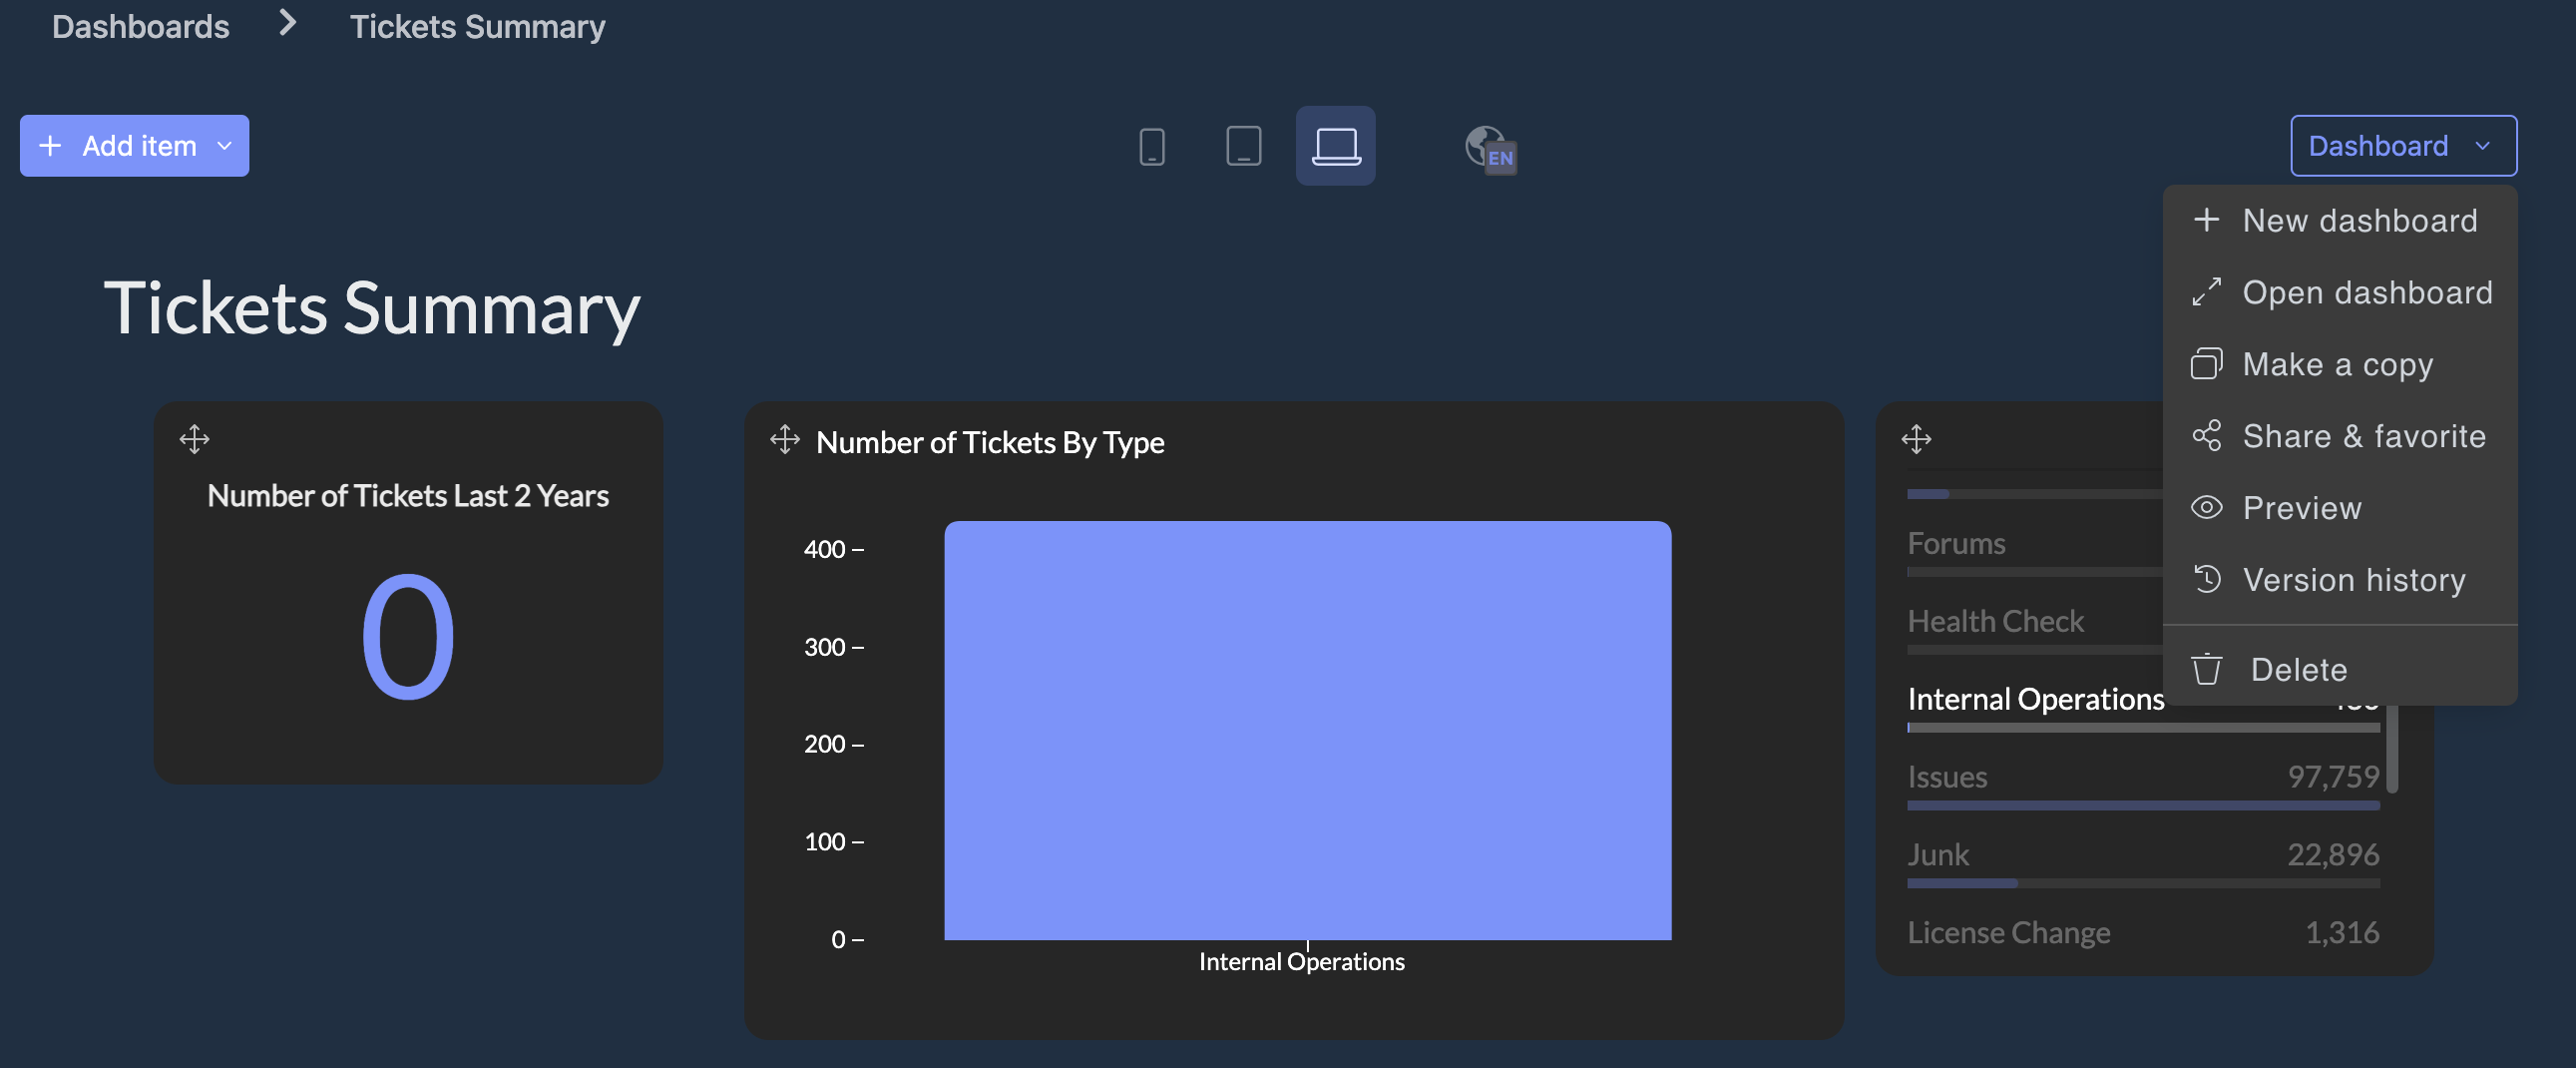
Second, is the new dashboard method. This is what we will cover below.
When you enter the new dashboard, you'll notice a blank slate in the center.
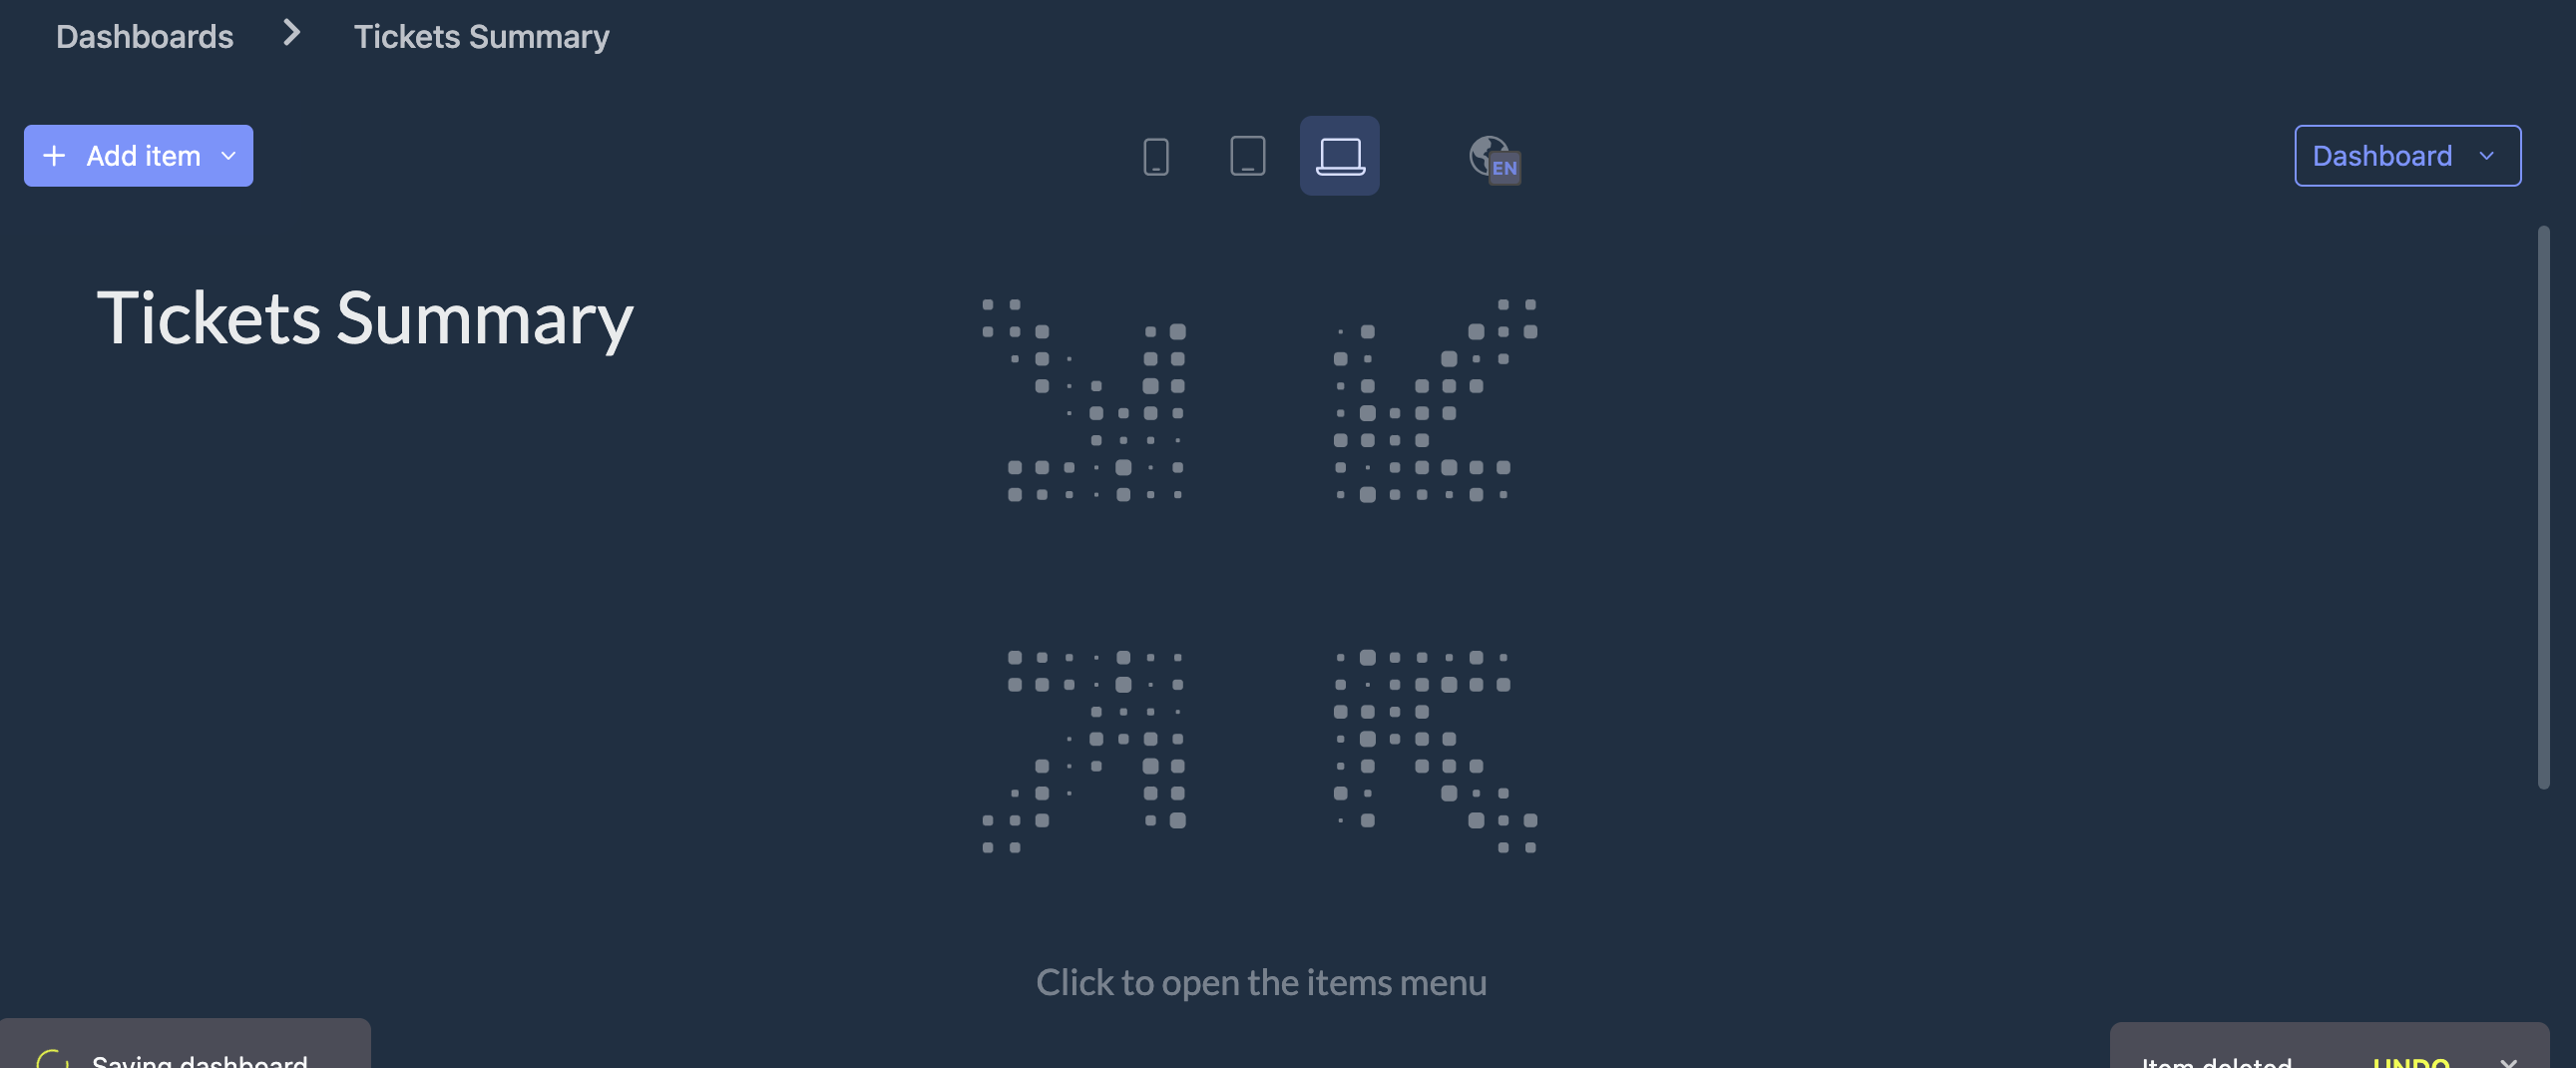
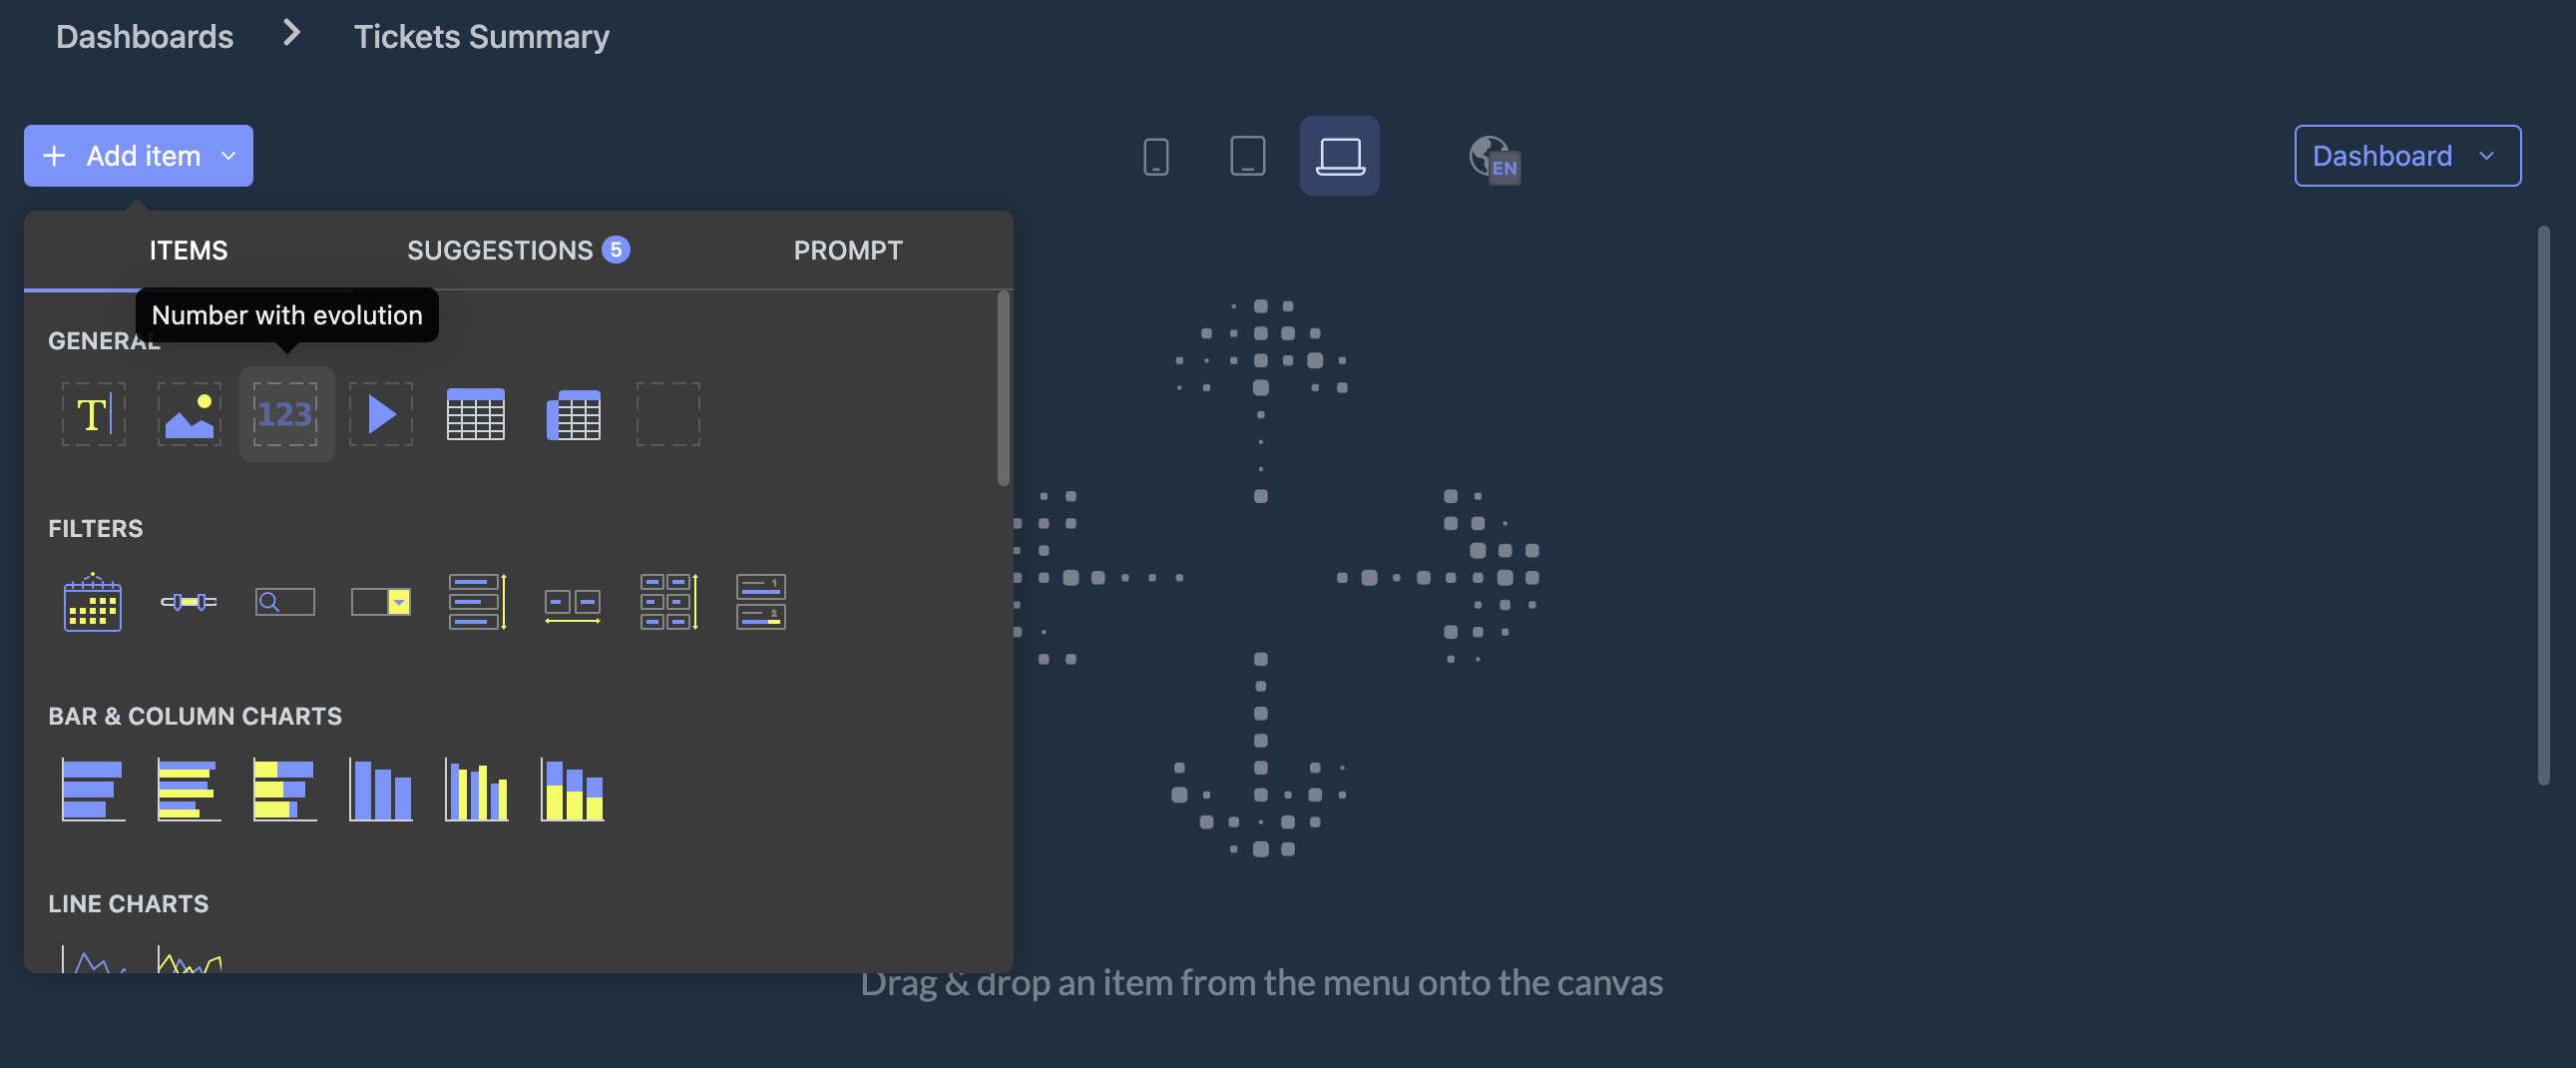
It's as easy as clicking "Add Item" and choosing from the visualization options below.
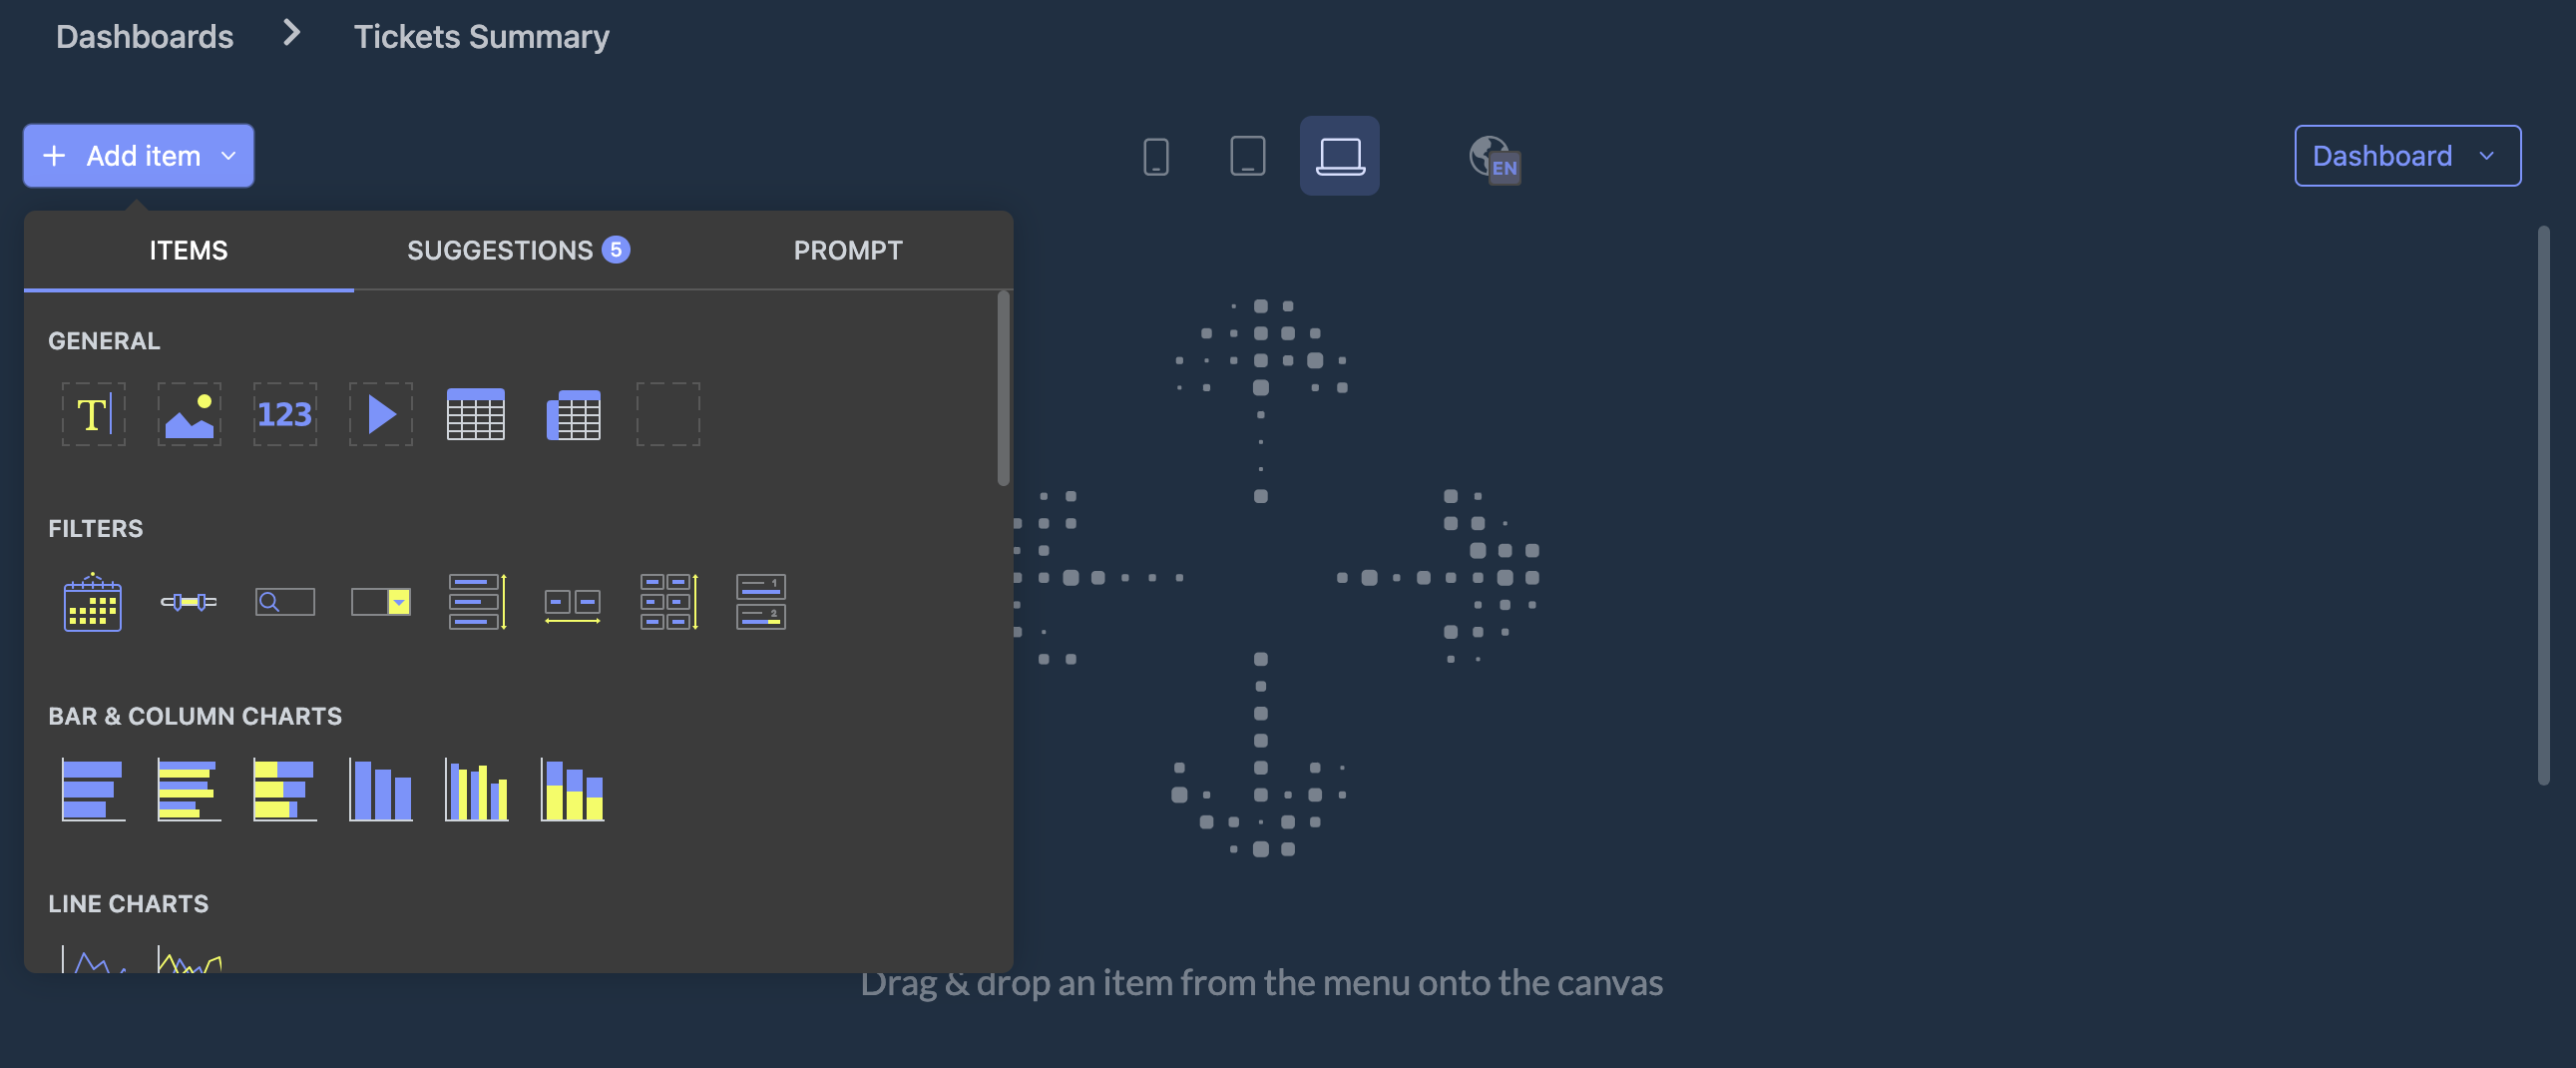
You can see there are quite a few. Let's create a couple of basic metrics. We'll start by creating a number with an evolution.
Drag it onto your dashboard.

Once you drag it, you can reshape it as you wish.
After dragging it onto your dashboard, open your dataset on the right, where the icon appears as a table.
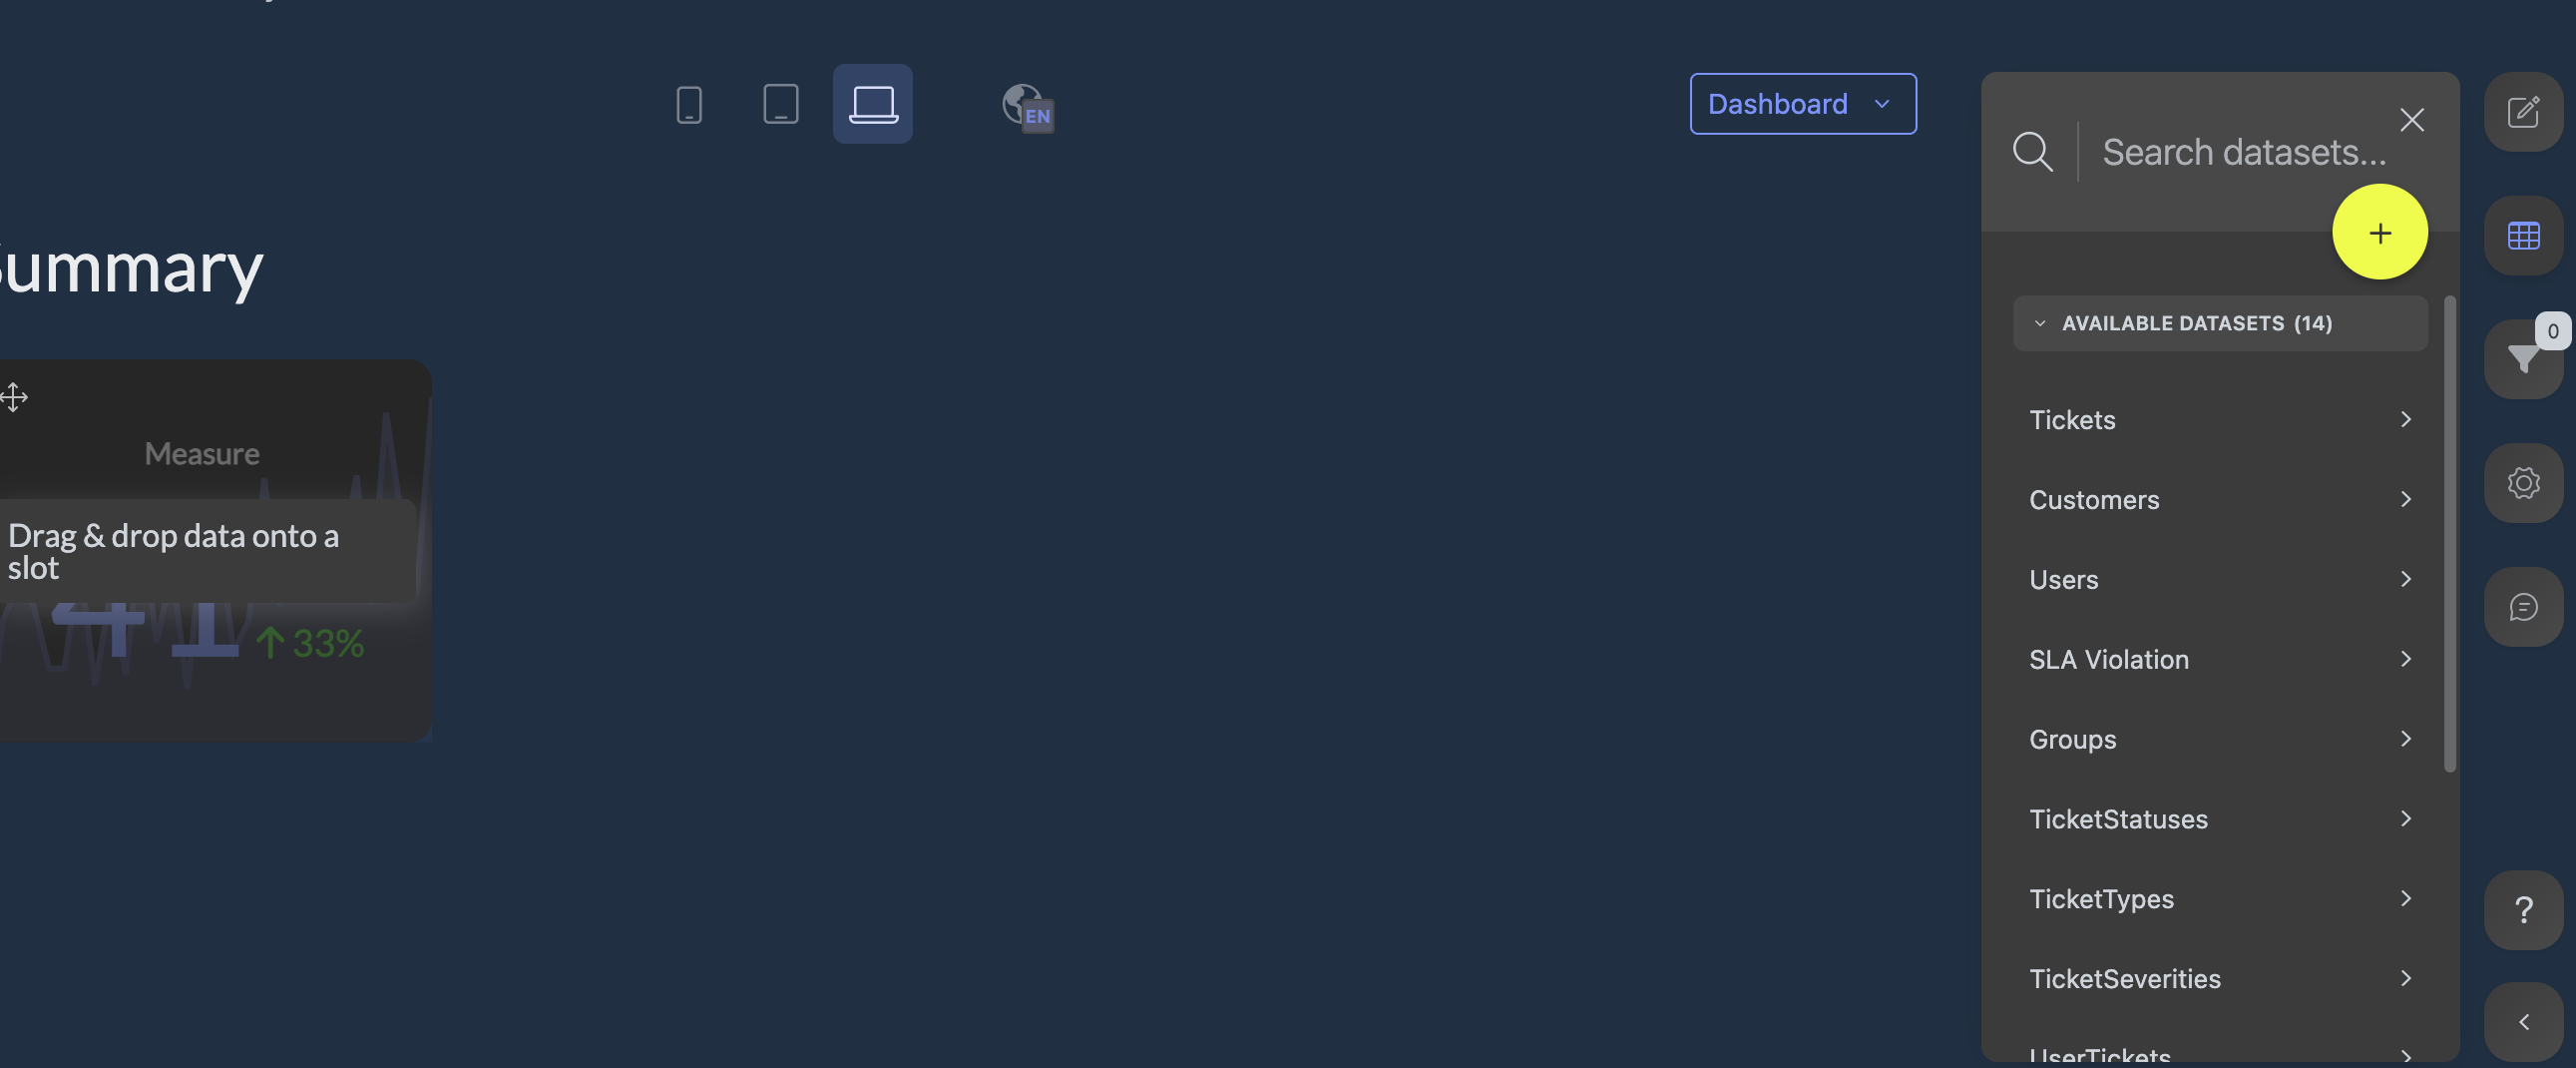
You will see all the different tables we provide at team support.
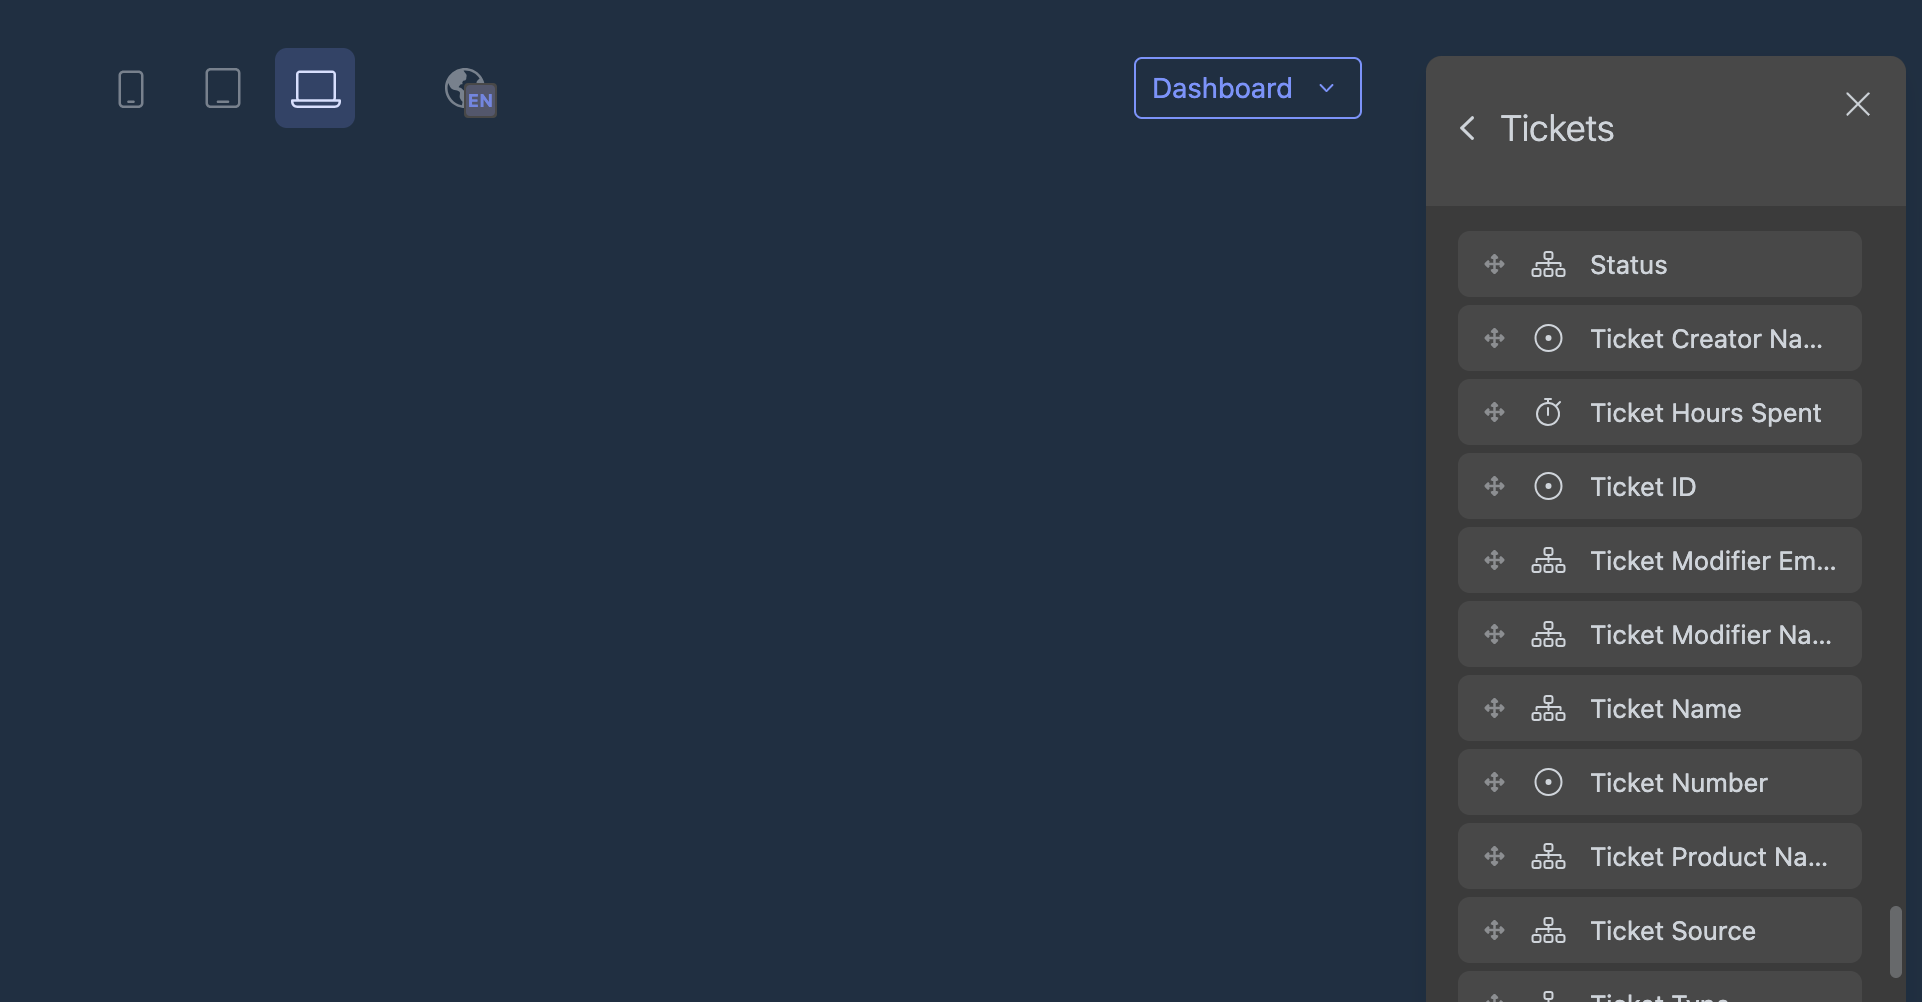
Let's grab tickets. To see how many tickets have been created over time, look for the ticket ID.
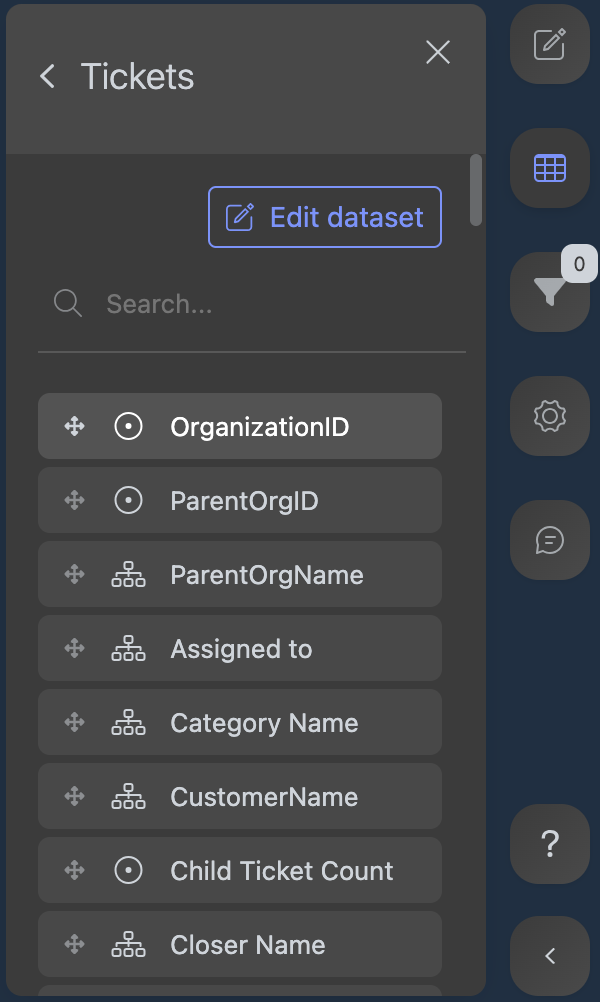
Every ticket in team support has a unique ticket ID. We will count how many ticket IDs our organization has over a certain time. This give us an accurate count of how many tickets have been created.
I
You can see a large number associated with it. Is that accurate? We can examine the data more closely. By clicking on the data and then on the settings for ticket ID, you can see it is creating a sum.


It's adding up all your ticket ID numbers using a SUM. which we don't want. We want a COUNT of how many unique ticket IDs exist.
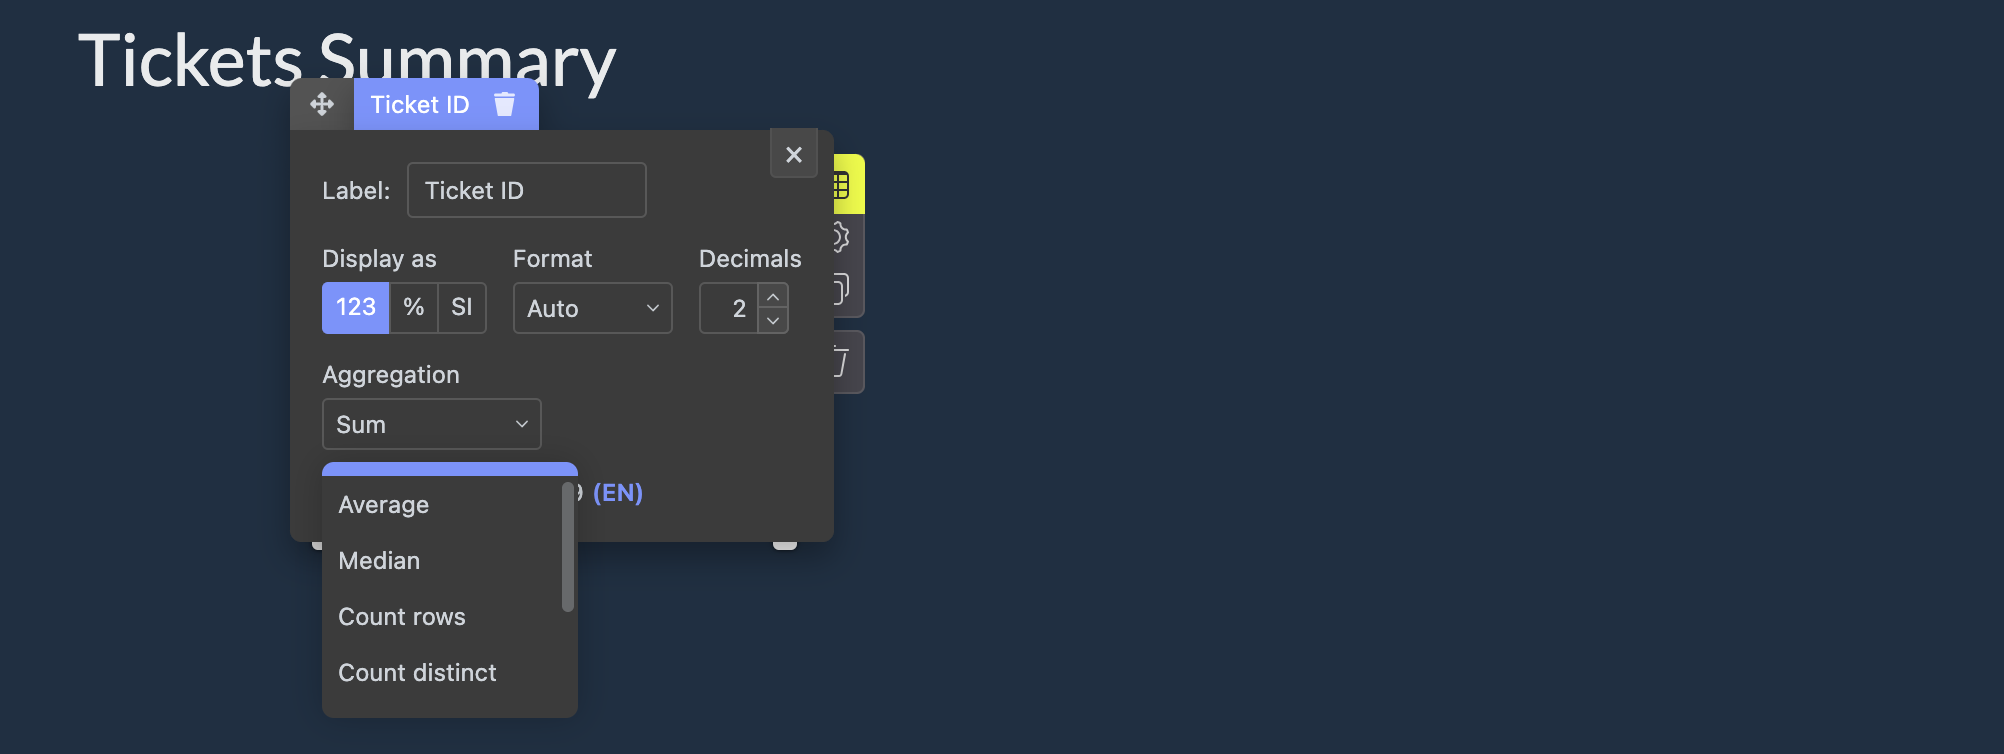
Let's set it to COUNT DISTINCT
Remove the decimals.
Now you can see that the number is more relevant to your organization because it shows how many tickets have been created. What else can we do with this? We can go into the settings for the data and create a filter.

Let's say we want to see the number of tickets from the last month.
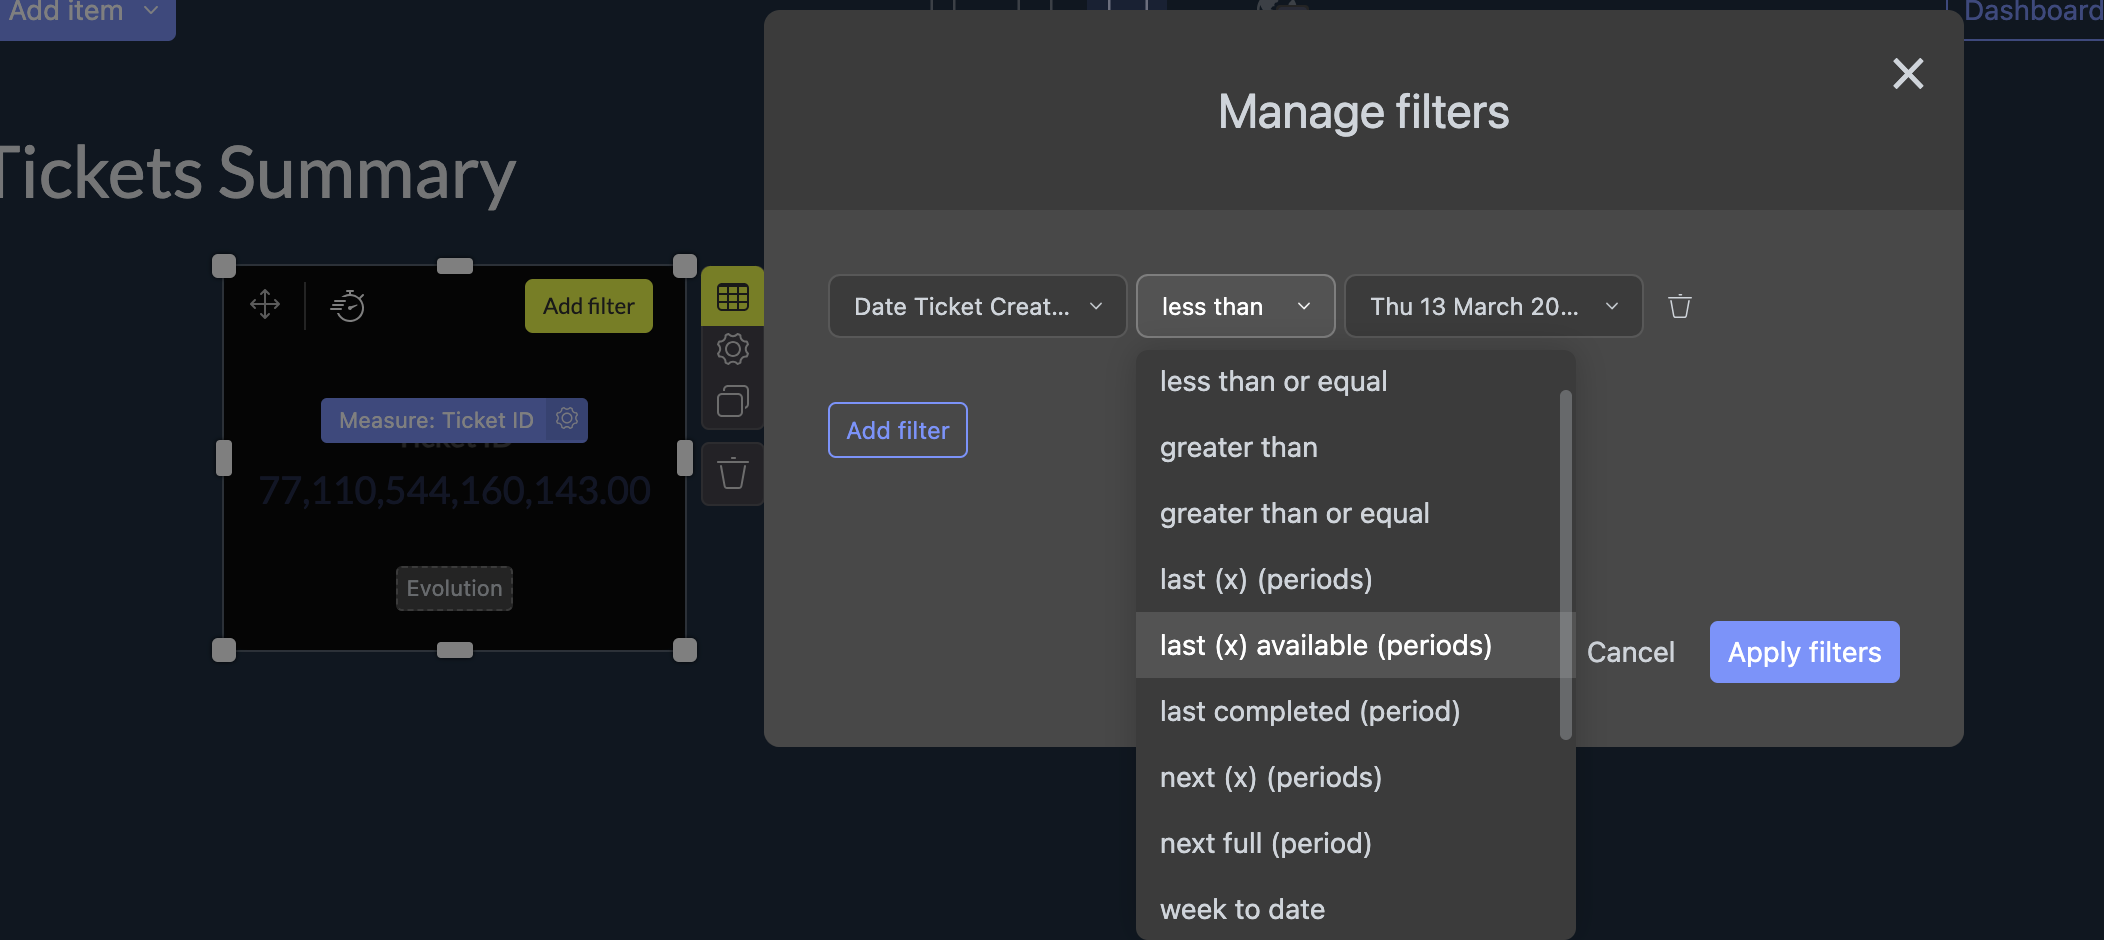
When you apply the filter, you can see the data refreshing. It's live data, and it will filter down for you. You can see it reduces to 18,000.