Icon

How to Create a Map in Metabase

Learn how to create a map in Metabase using tables with latitude and longitude coordinates. This guide walks you through checking your data, visualizing addresses, and filtering map views in Metabase.

By Jason Block

In this guide, we'll learn how to create a map using Metabase. The main objective is to visualize data points based on their geographic coordinates. We will check if your data table contains latitude and longitude fields, which are required for mapping.

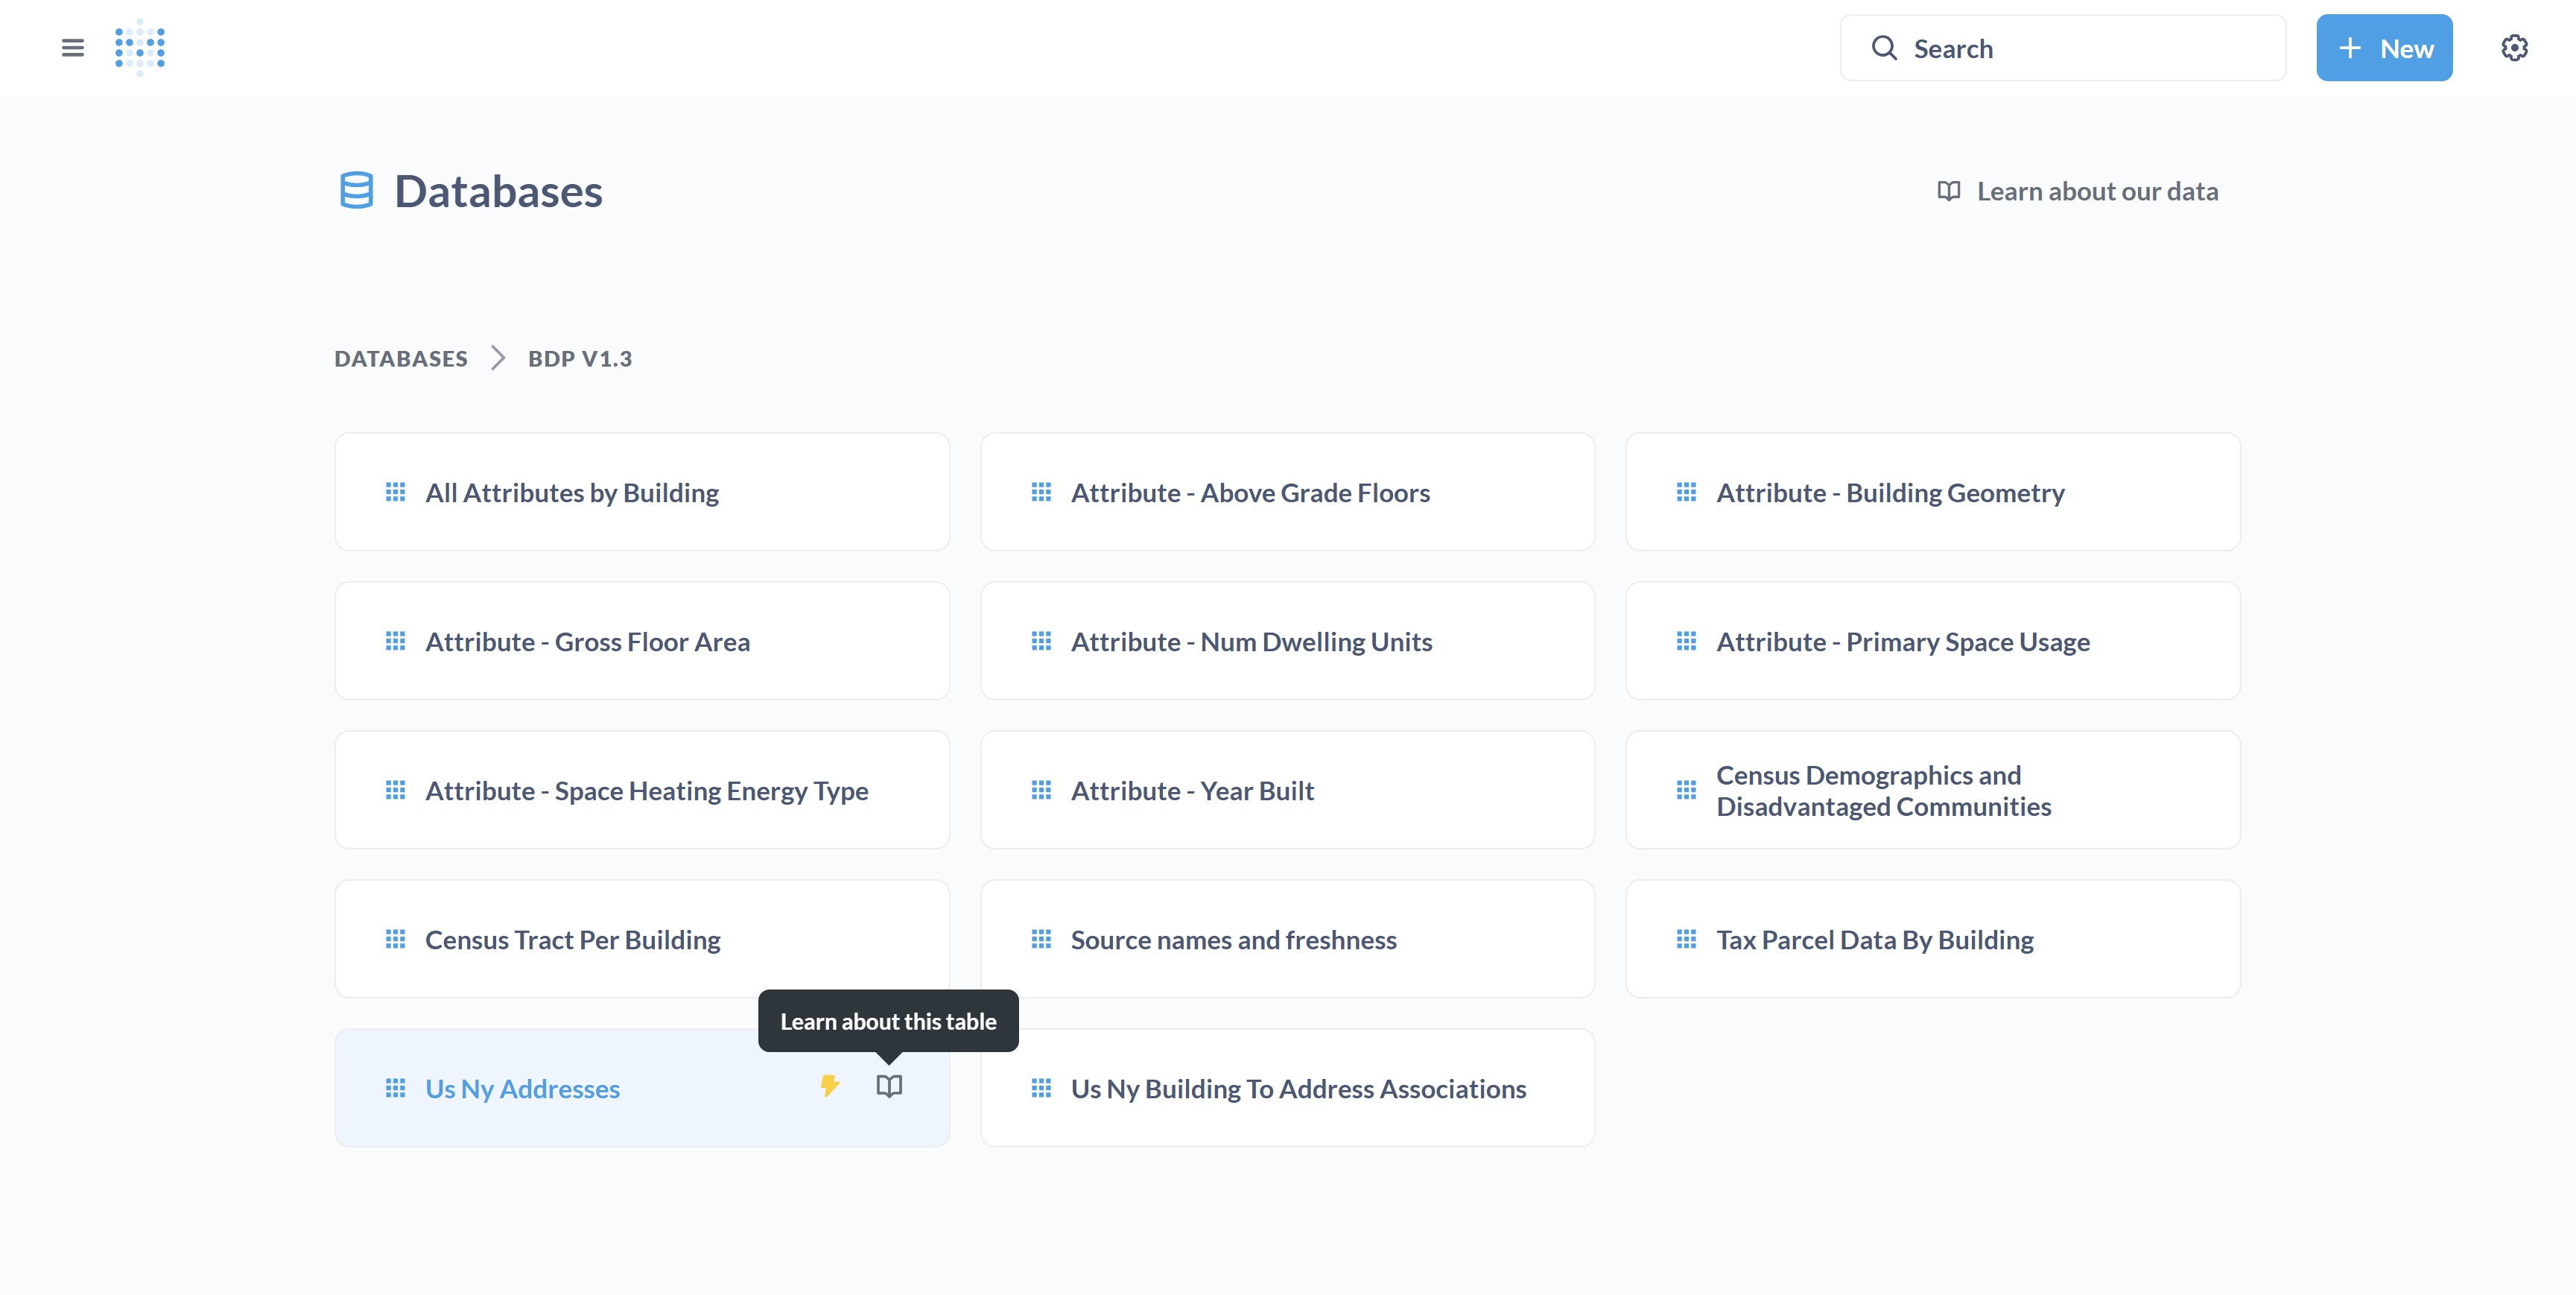
We will use a table of US New York addresses as an example and walk through the steps to display this data on a map in Metabase.

Let's get started

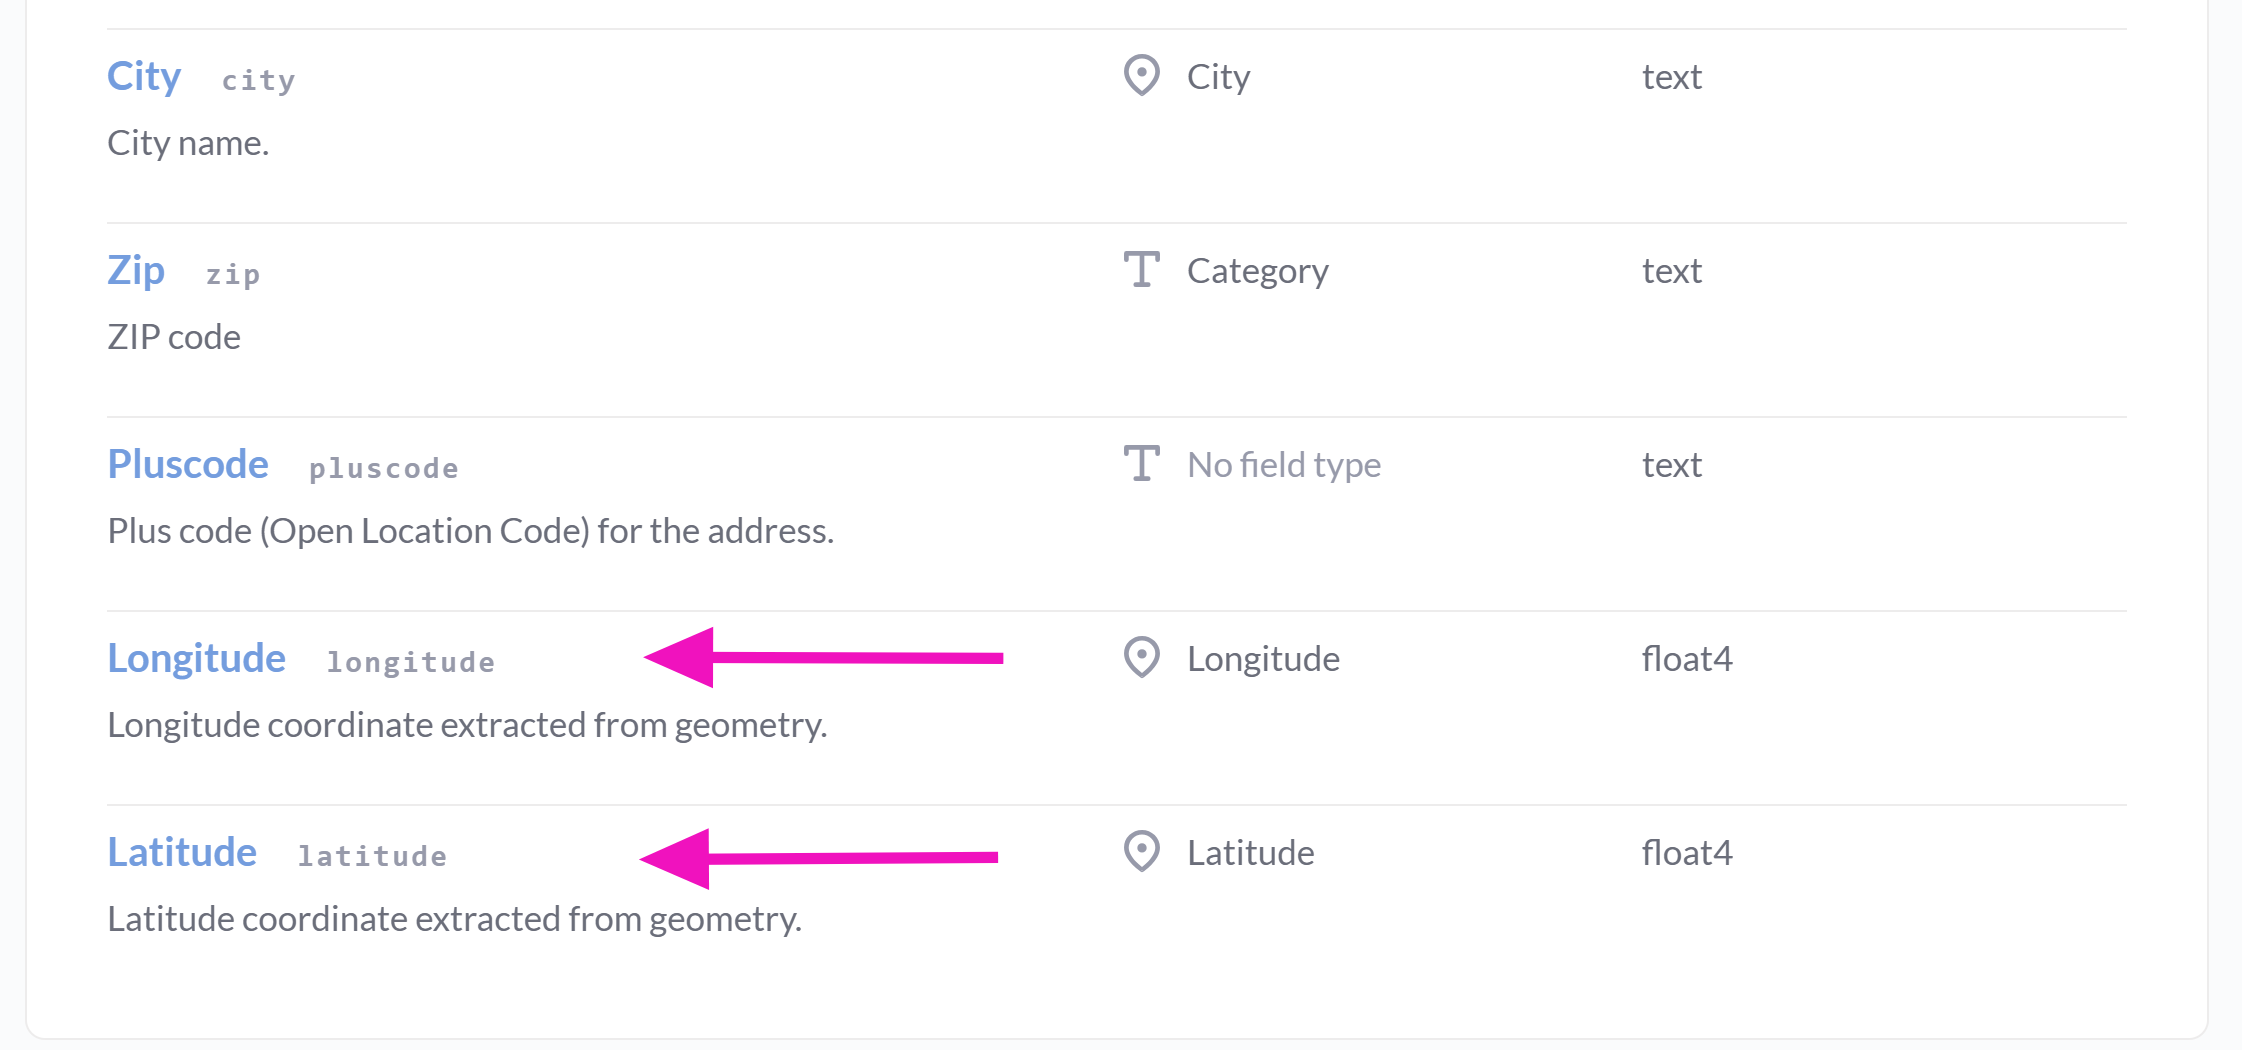
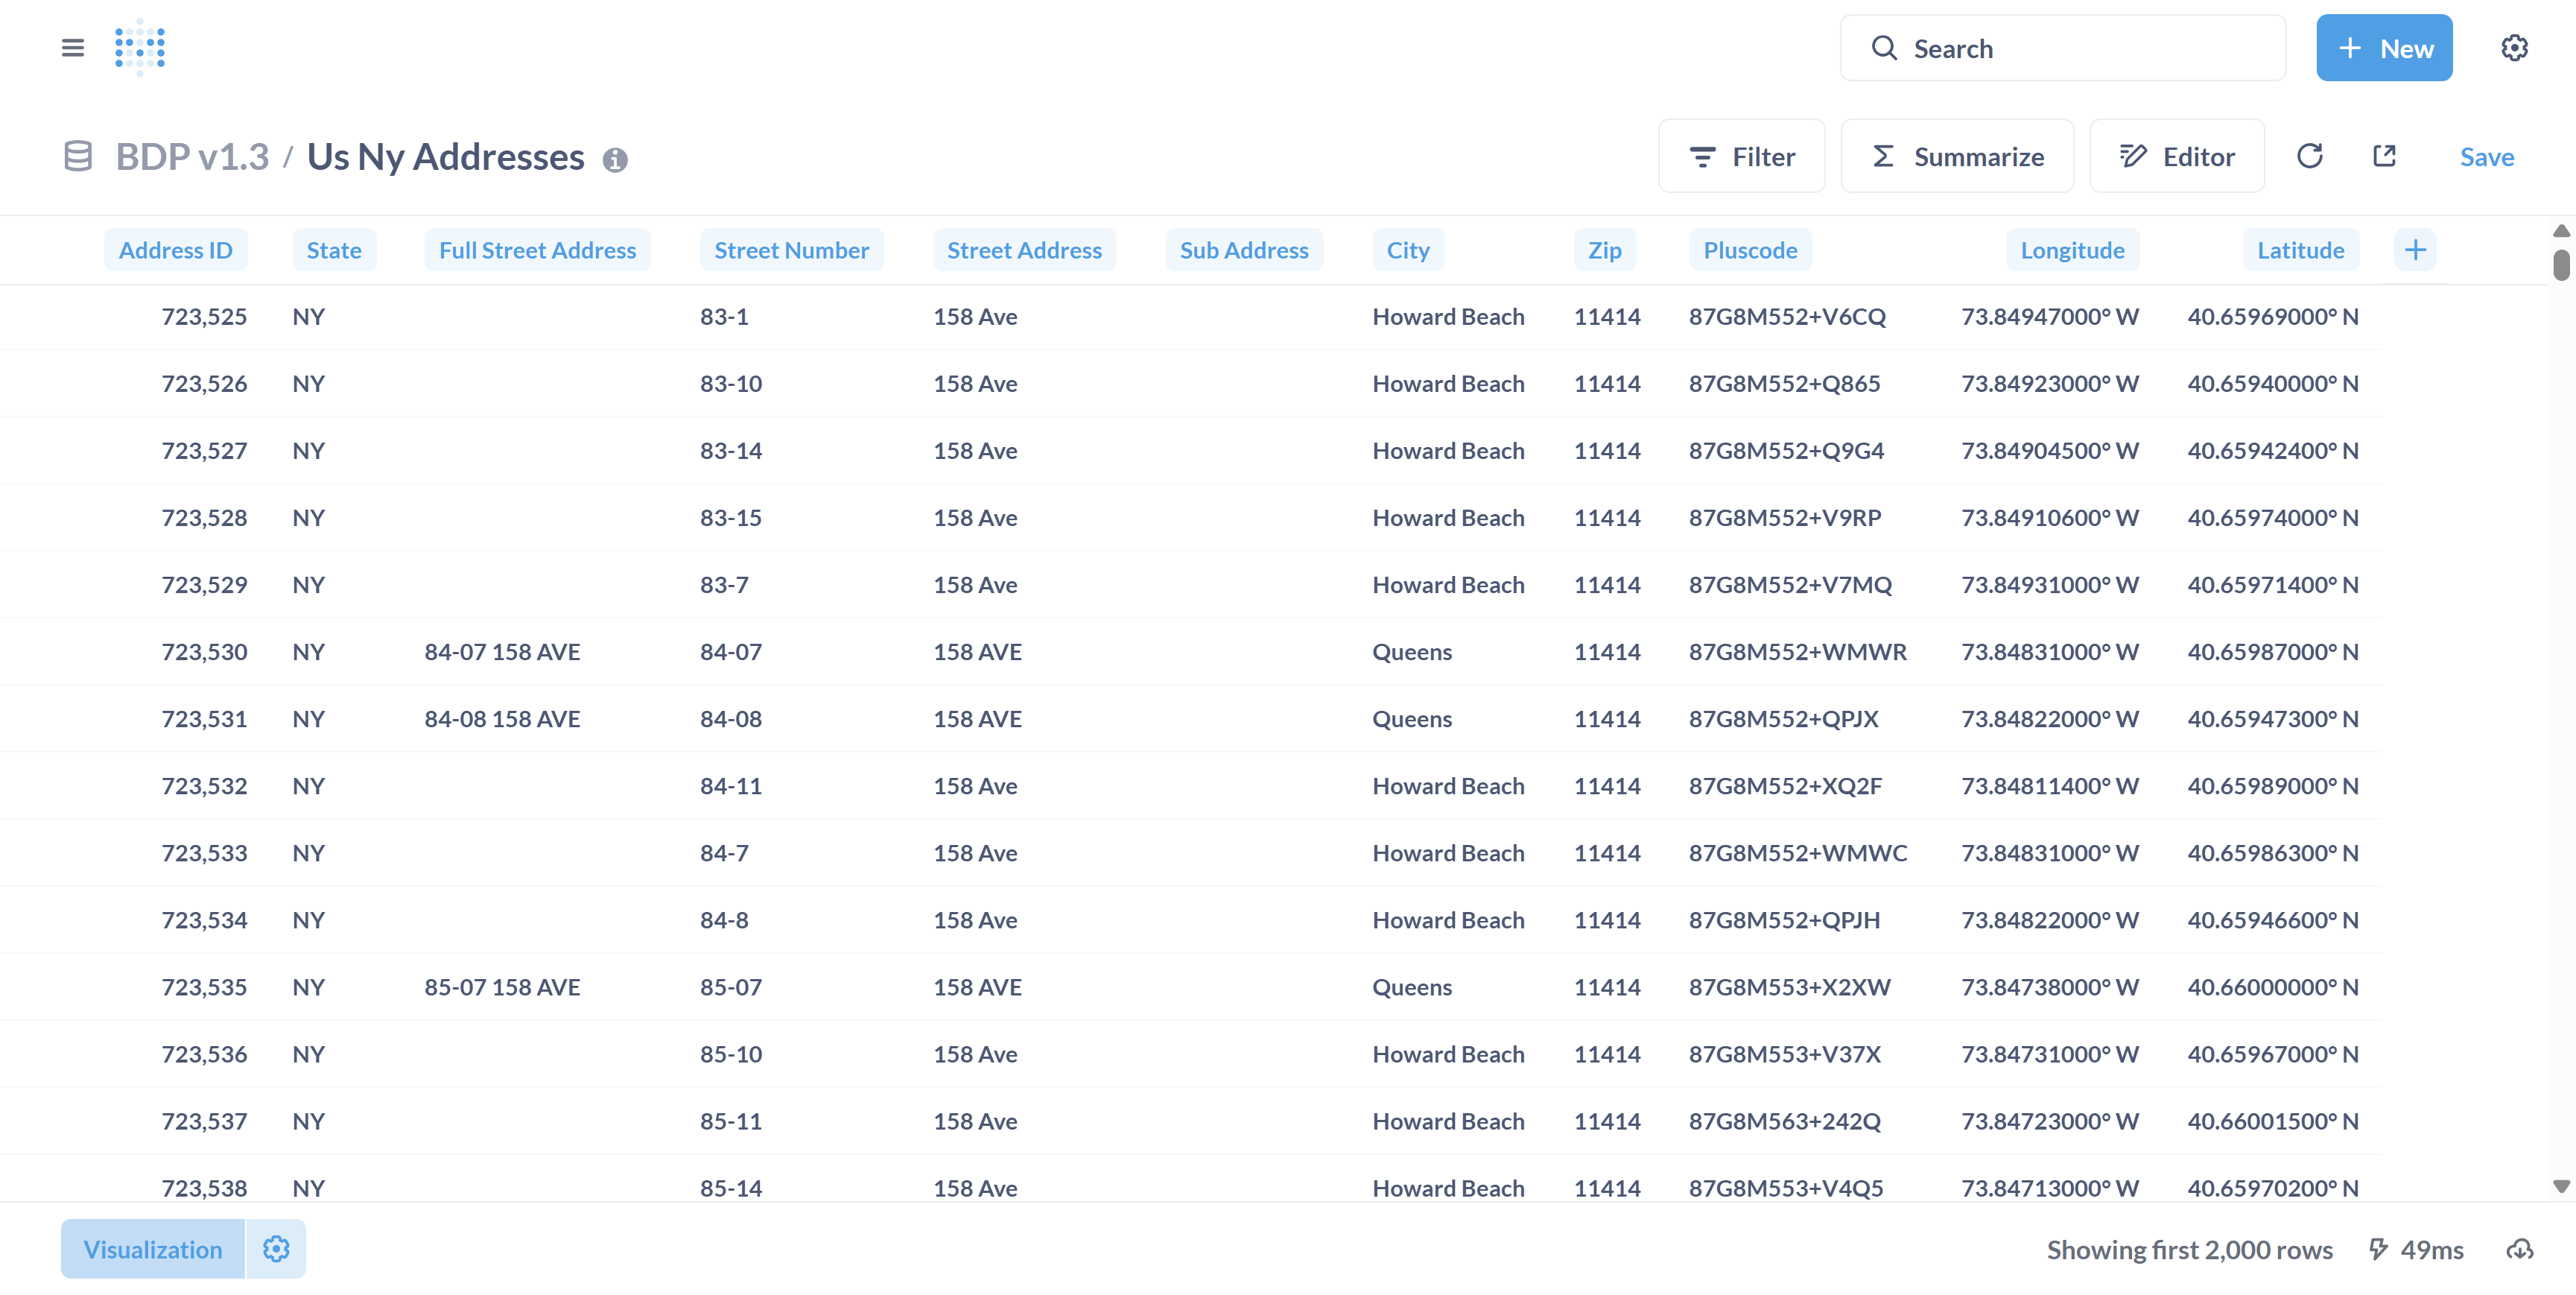
In this tutorial, we will learn how to create a map in Metabase. To create a map, first check if your table includes longitude and latitude coordinates. If your table does not have coordinates, you won't be able to create a map.

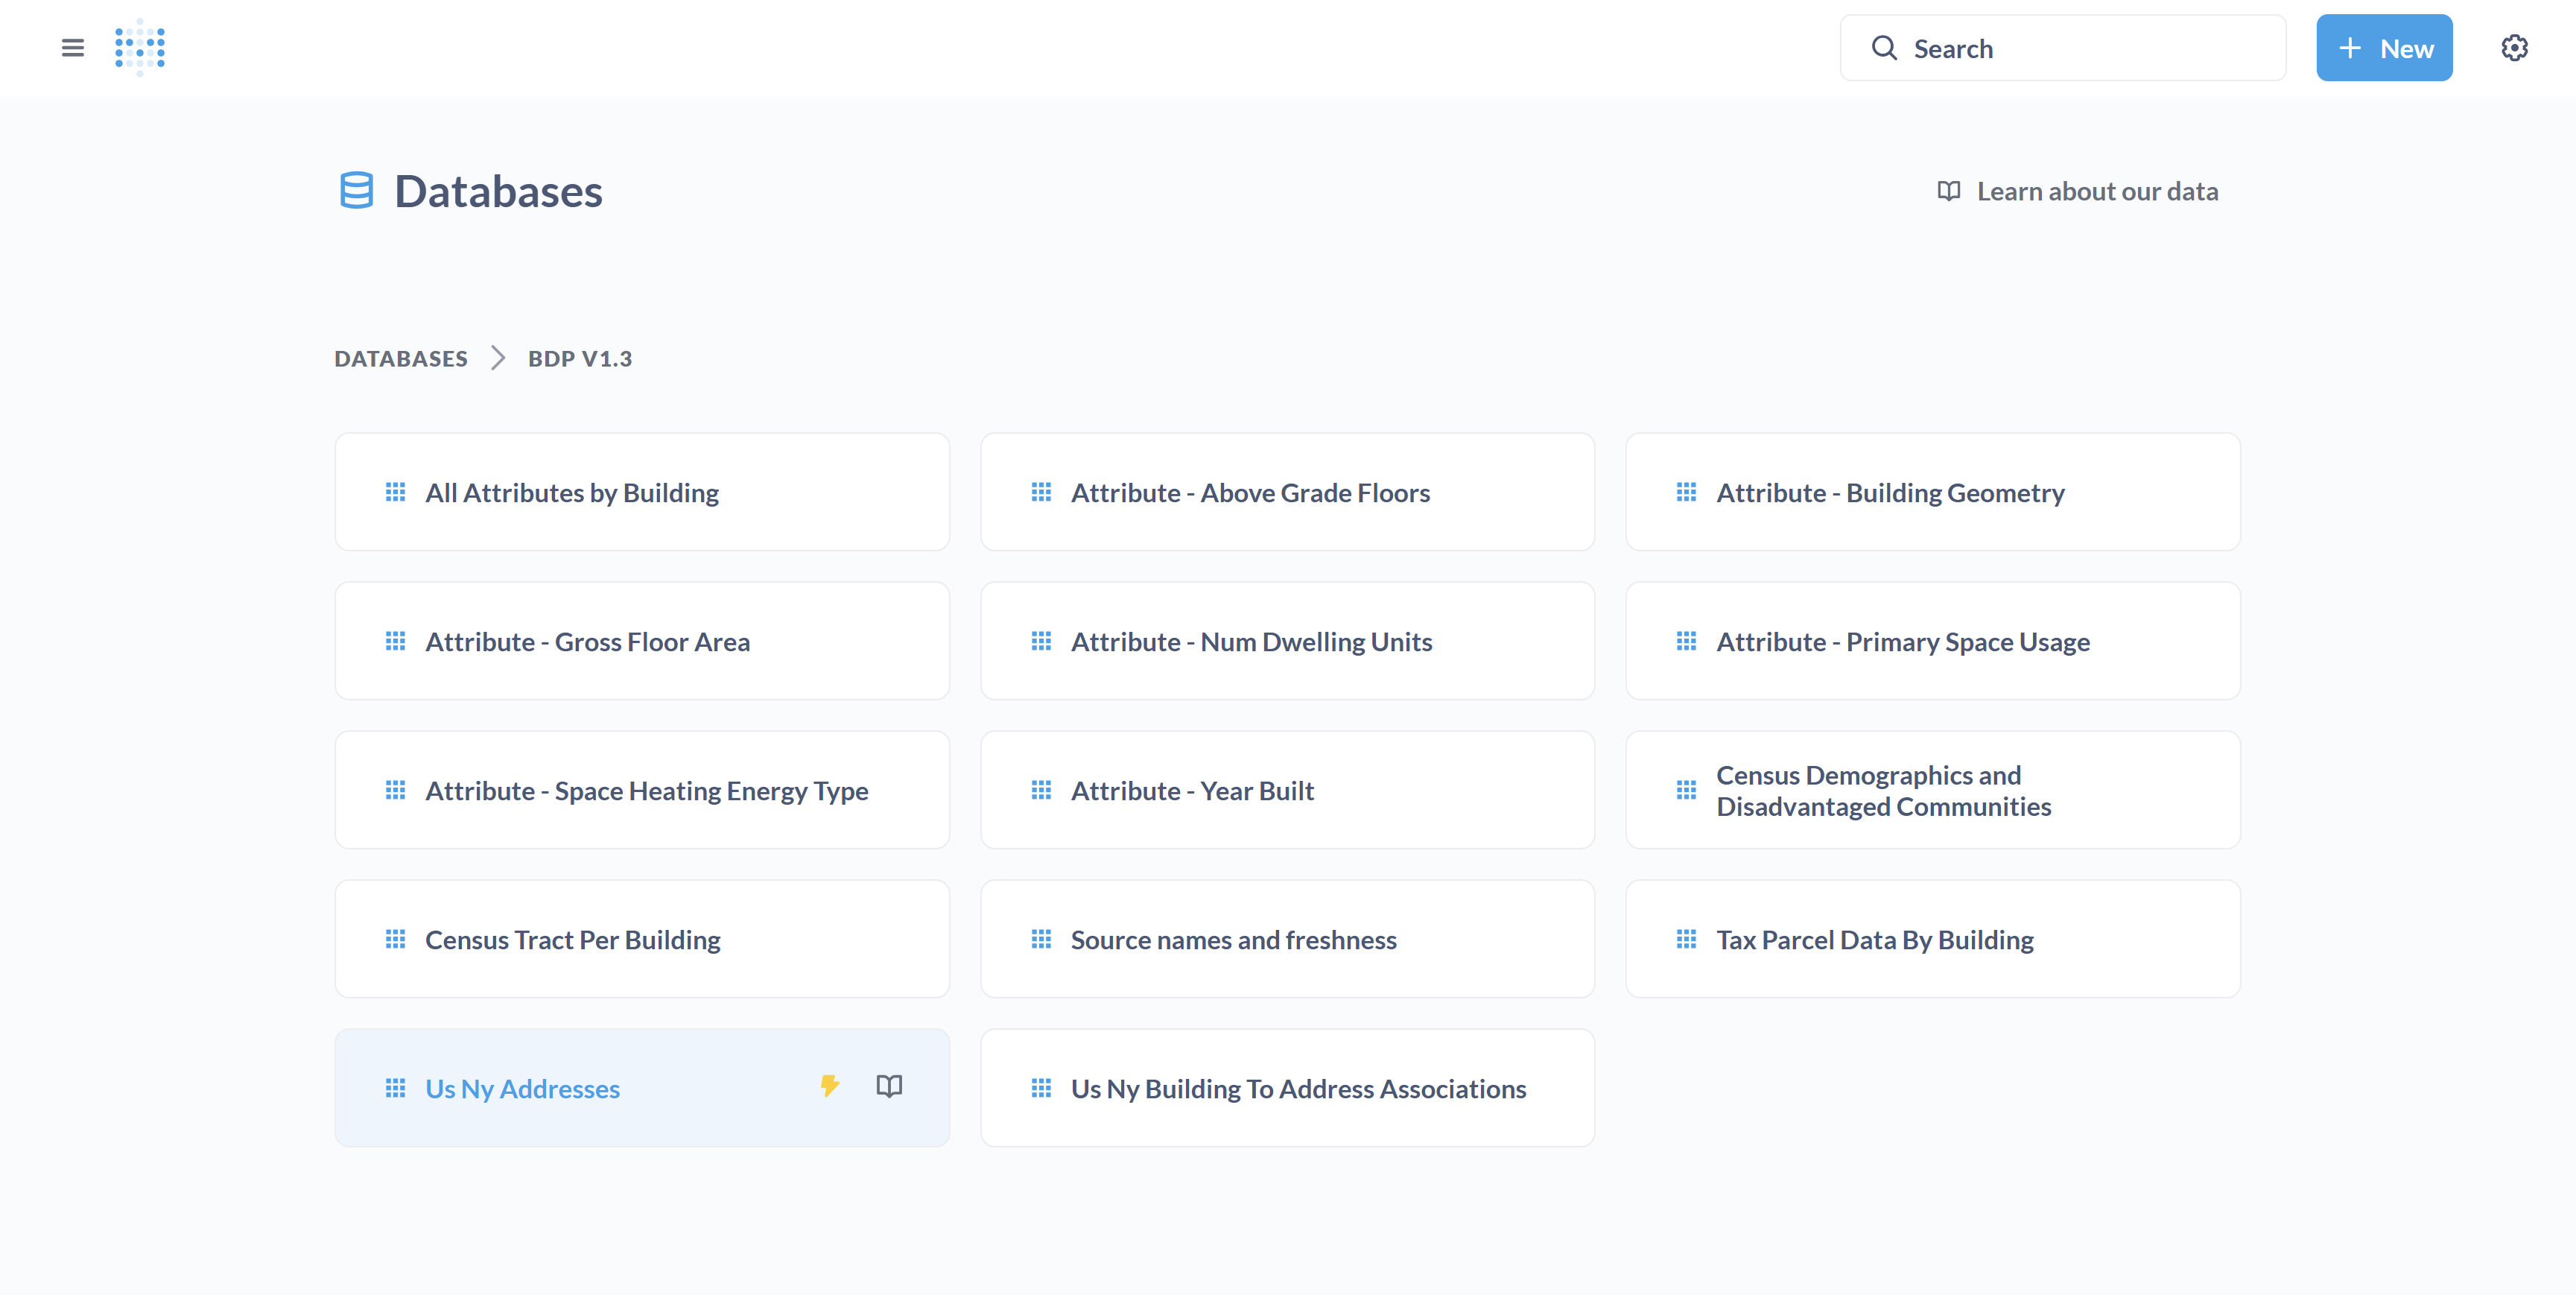
How do we check if a table has coordinate points? We'll do that now.

1
Go to Metabase
2
Find Us Ny Addresses and click on "Learn about this table". This will open up the table documentation.
Step #2: Find Us Ny Addresses and click on "Learn about this table". This will open up the table documentation.
3
Click on "Fields in this table." You will see all the columns for the table. We'll look for columns that contain longitude and latitude data.
Step #3: Click on "Fields in this table." You will see all the columns for the table. We'll look for columns that contain longitude and latitude data.
4
Check if the table has latitude and longitude data. In this case, it does.
Step #4: Check if the table has latitude and longitude data. In this case, it does.
5
Return to the database and click on "US New York Addresses" to open the table.
Step #5: Return to the database and click on "US New York Addresses" to open the table.

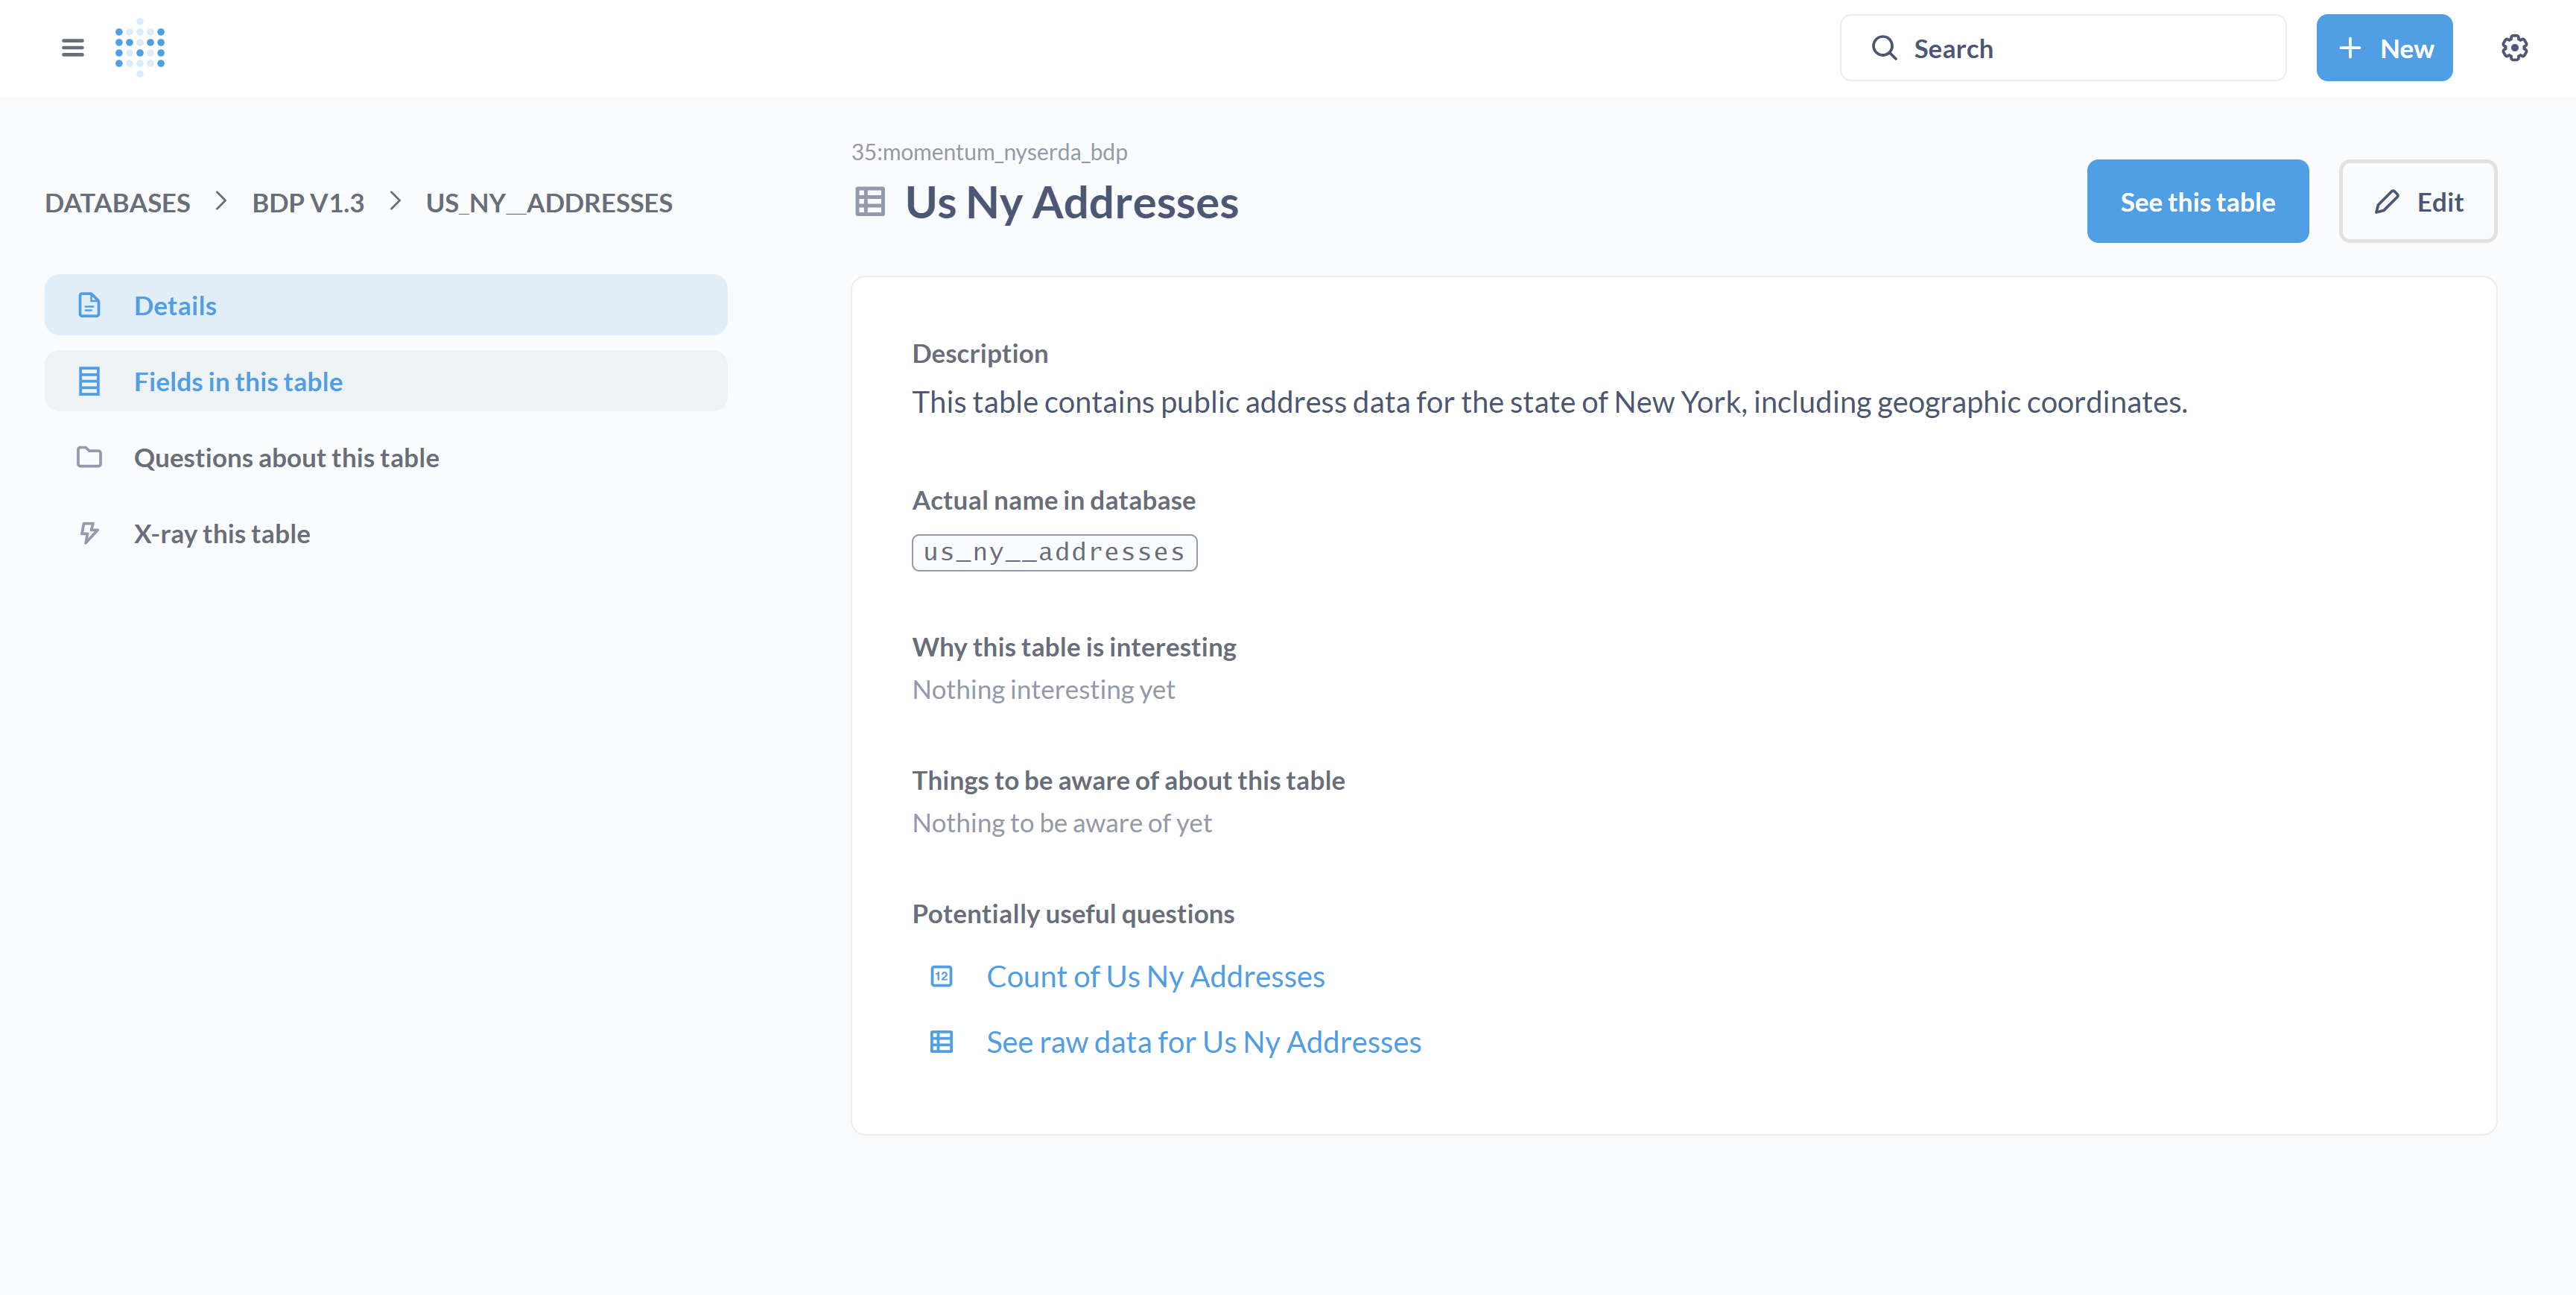
In this table, we have address ID, states, street address, and more.

6
Click on Visualization. This will give you an array of visualization options.
Step #6: Click on Visualization. This will give you an array of visualization options.
7
Click on Map and press Done.
Step #7: Click on Map and press Done.

You will now see a map of addresses in NY, represented by small squares. You can zoom in and out on the map.

You can also draw a box to filter the view. We'll do that next.

8
Click on "Draw box to filter." Then, click on where you would like to filter and create a rectangle.
Step #8: Click on "Draw box to filter." Then, click on where you would like to filter and create a rectangle.
9
You now have a filtered view of the database, based on the box you just drew.
Step #9: You now have a filtered view of the database, based on the box you just drew.

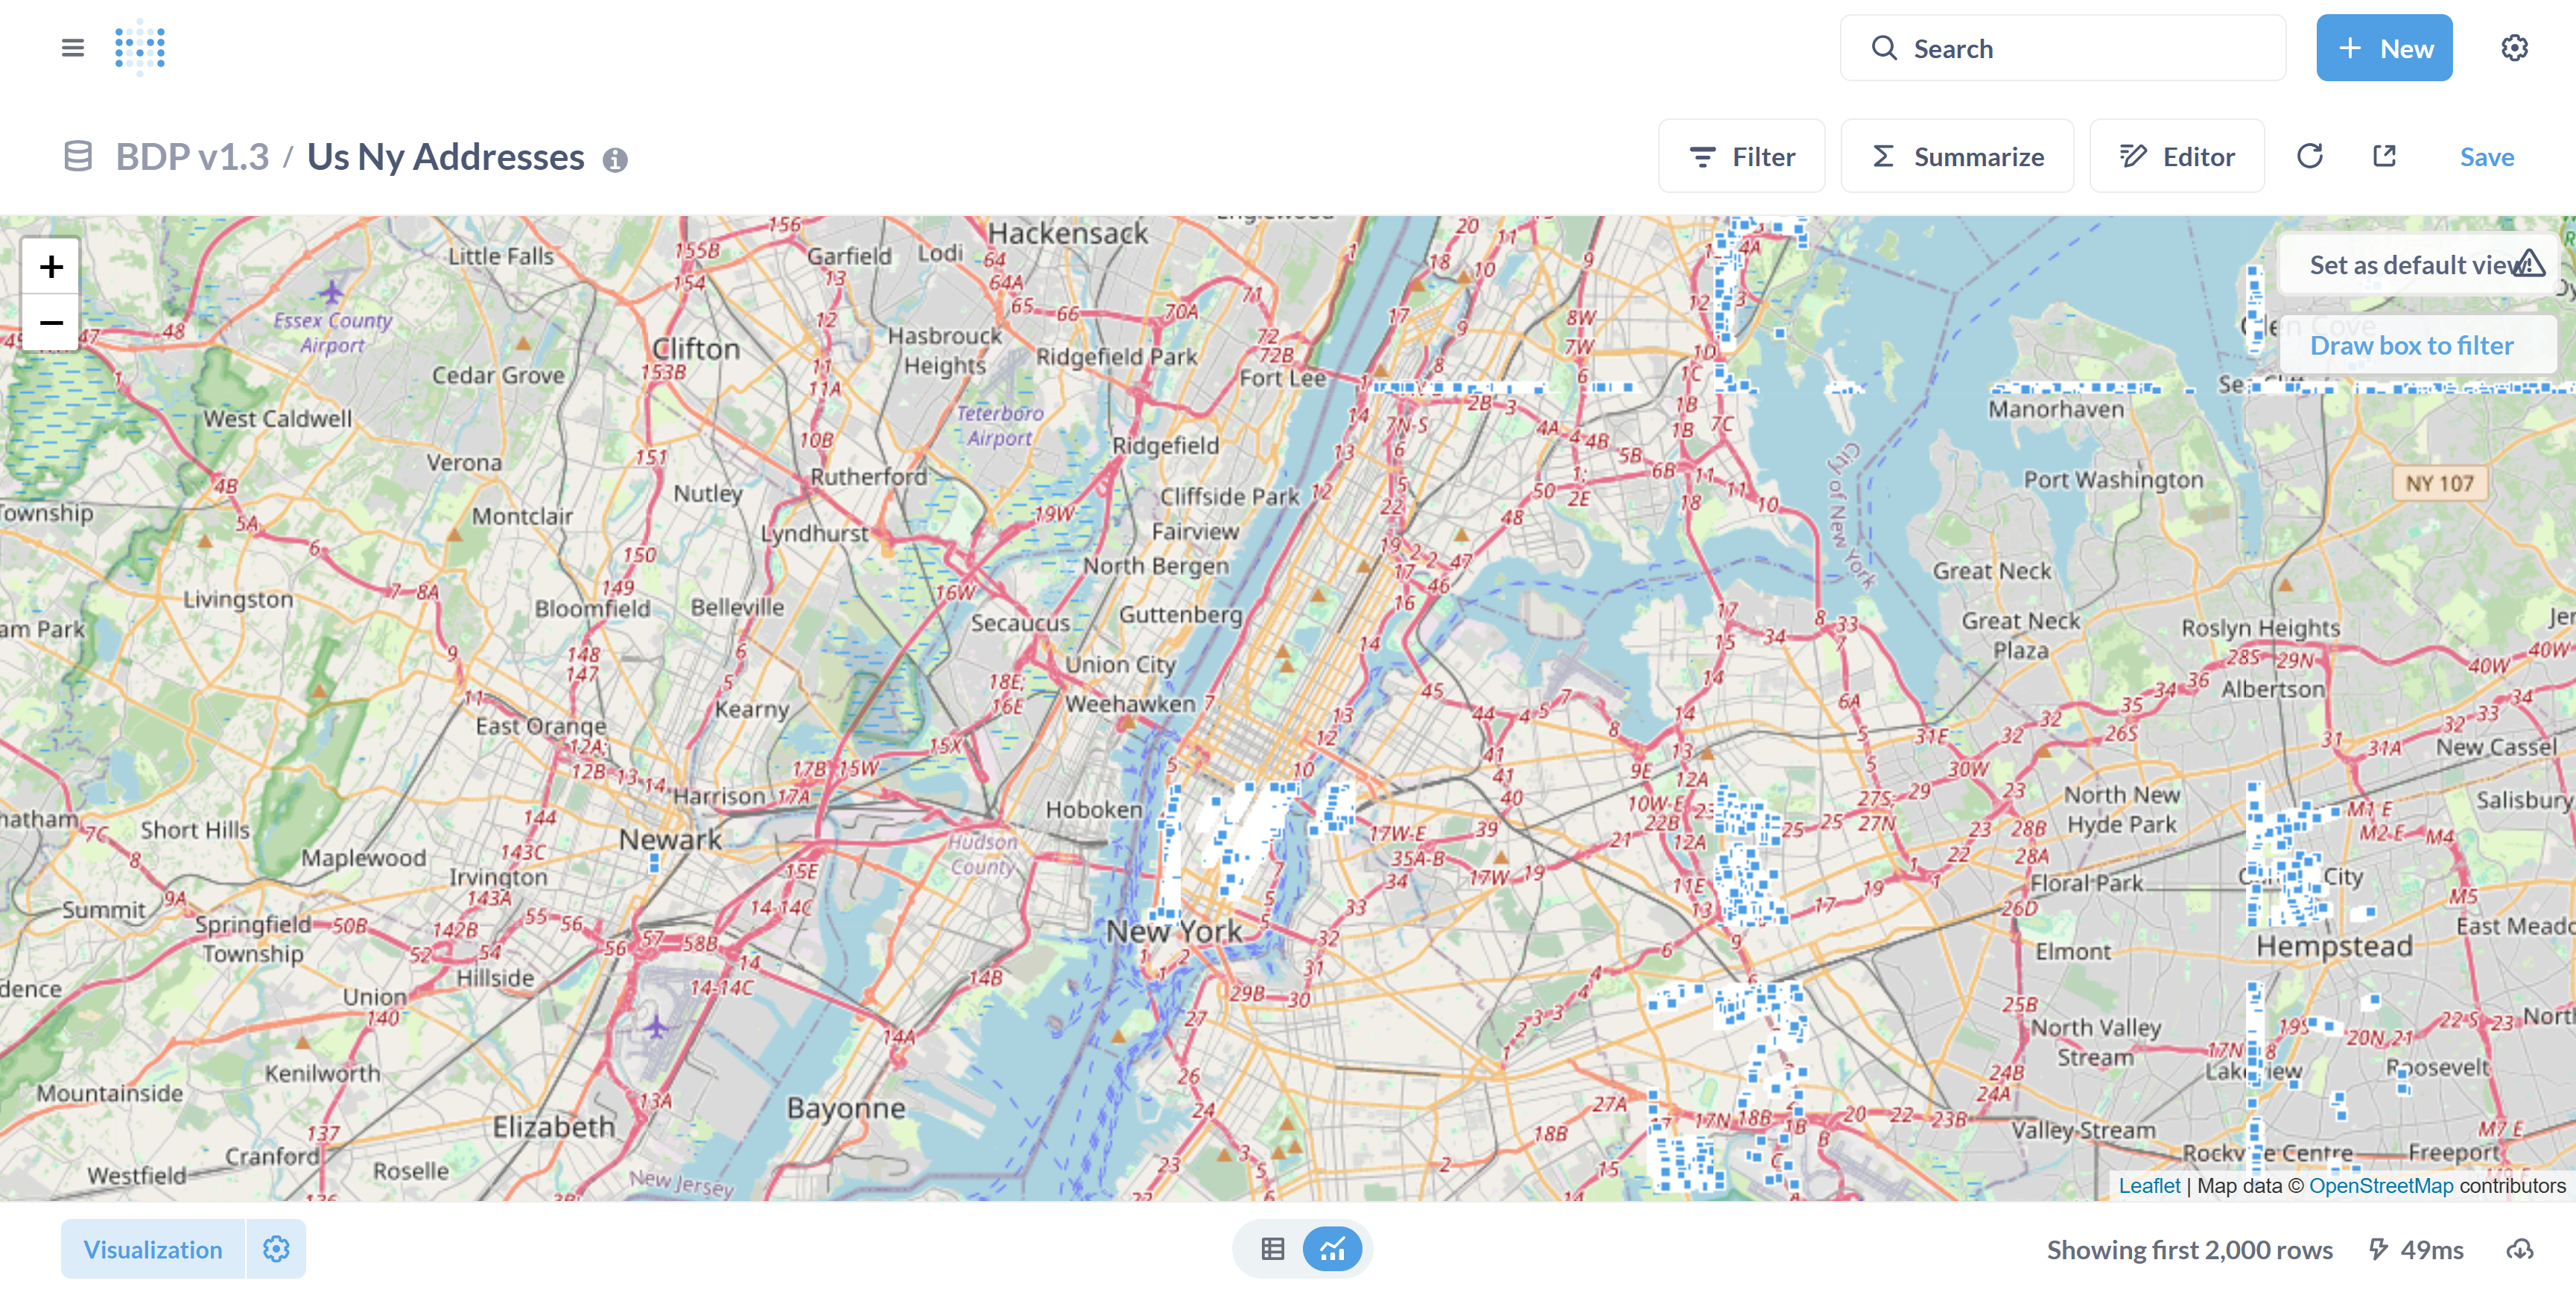
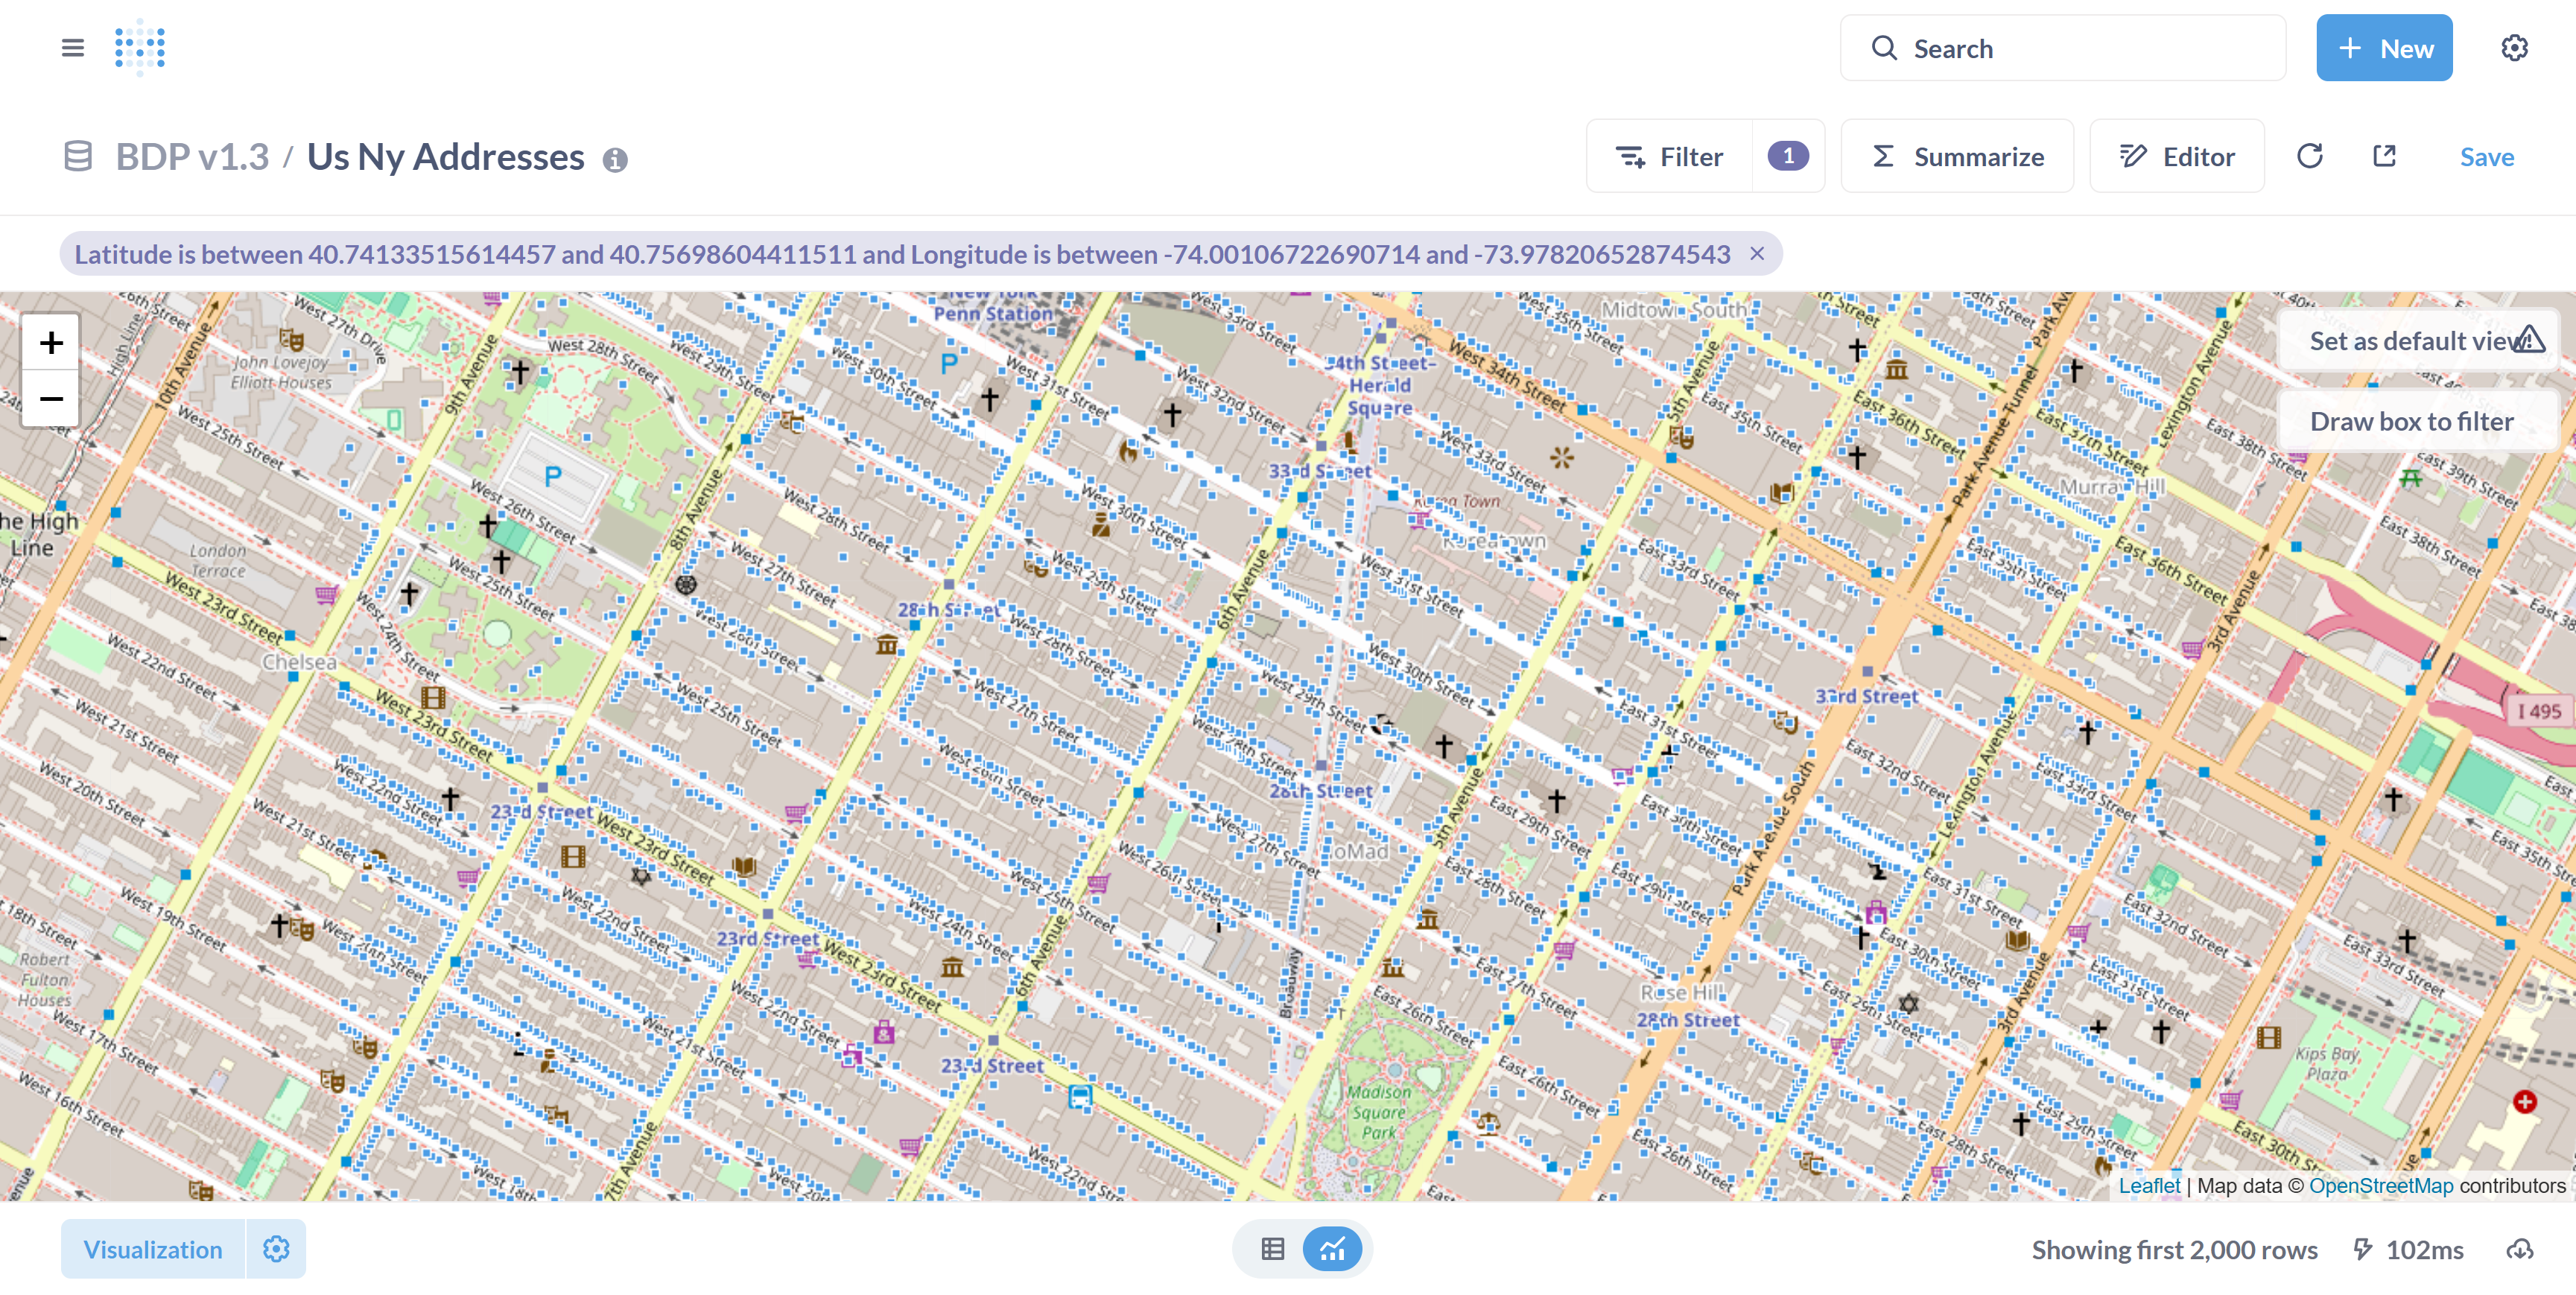
In this case, each square represents one point in the table dataset.

And that's it! You've now created a map using Metabase.

In this guide, we learned how to identify tables that have coordinate points, visualize a map, and draw a filter on a map.