
How to Create a Summary Table of Buildings by New York State REDC Region
Learn step-by-step how to create and format a summary table of buildings in New York State, grouped by REDC Region, including building count, total dwelling units, and median year built.
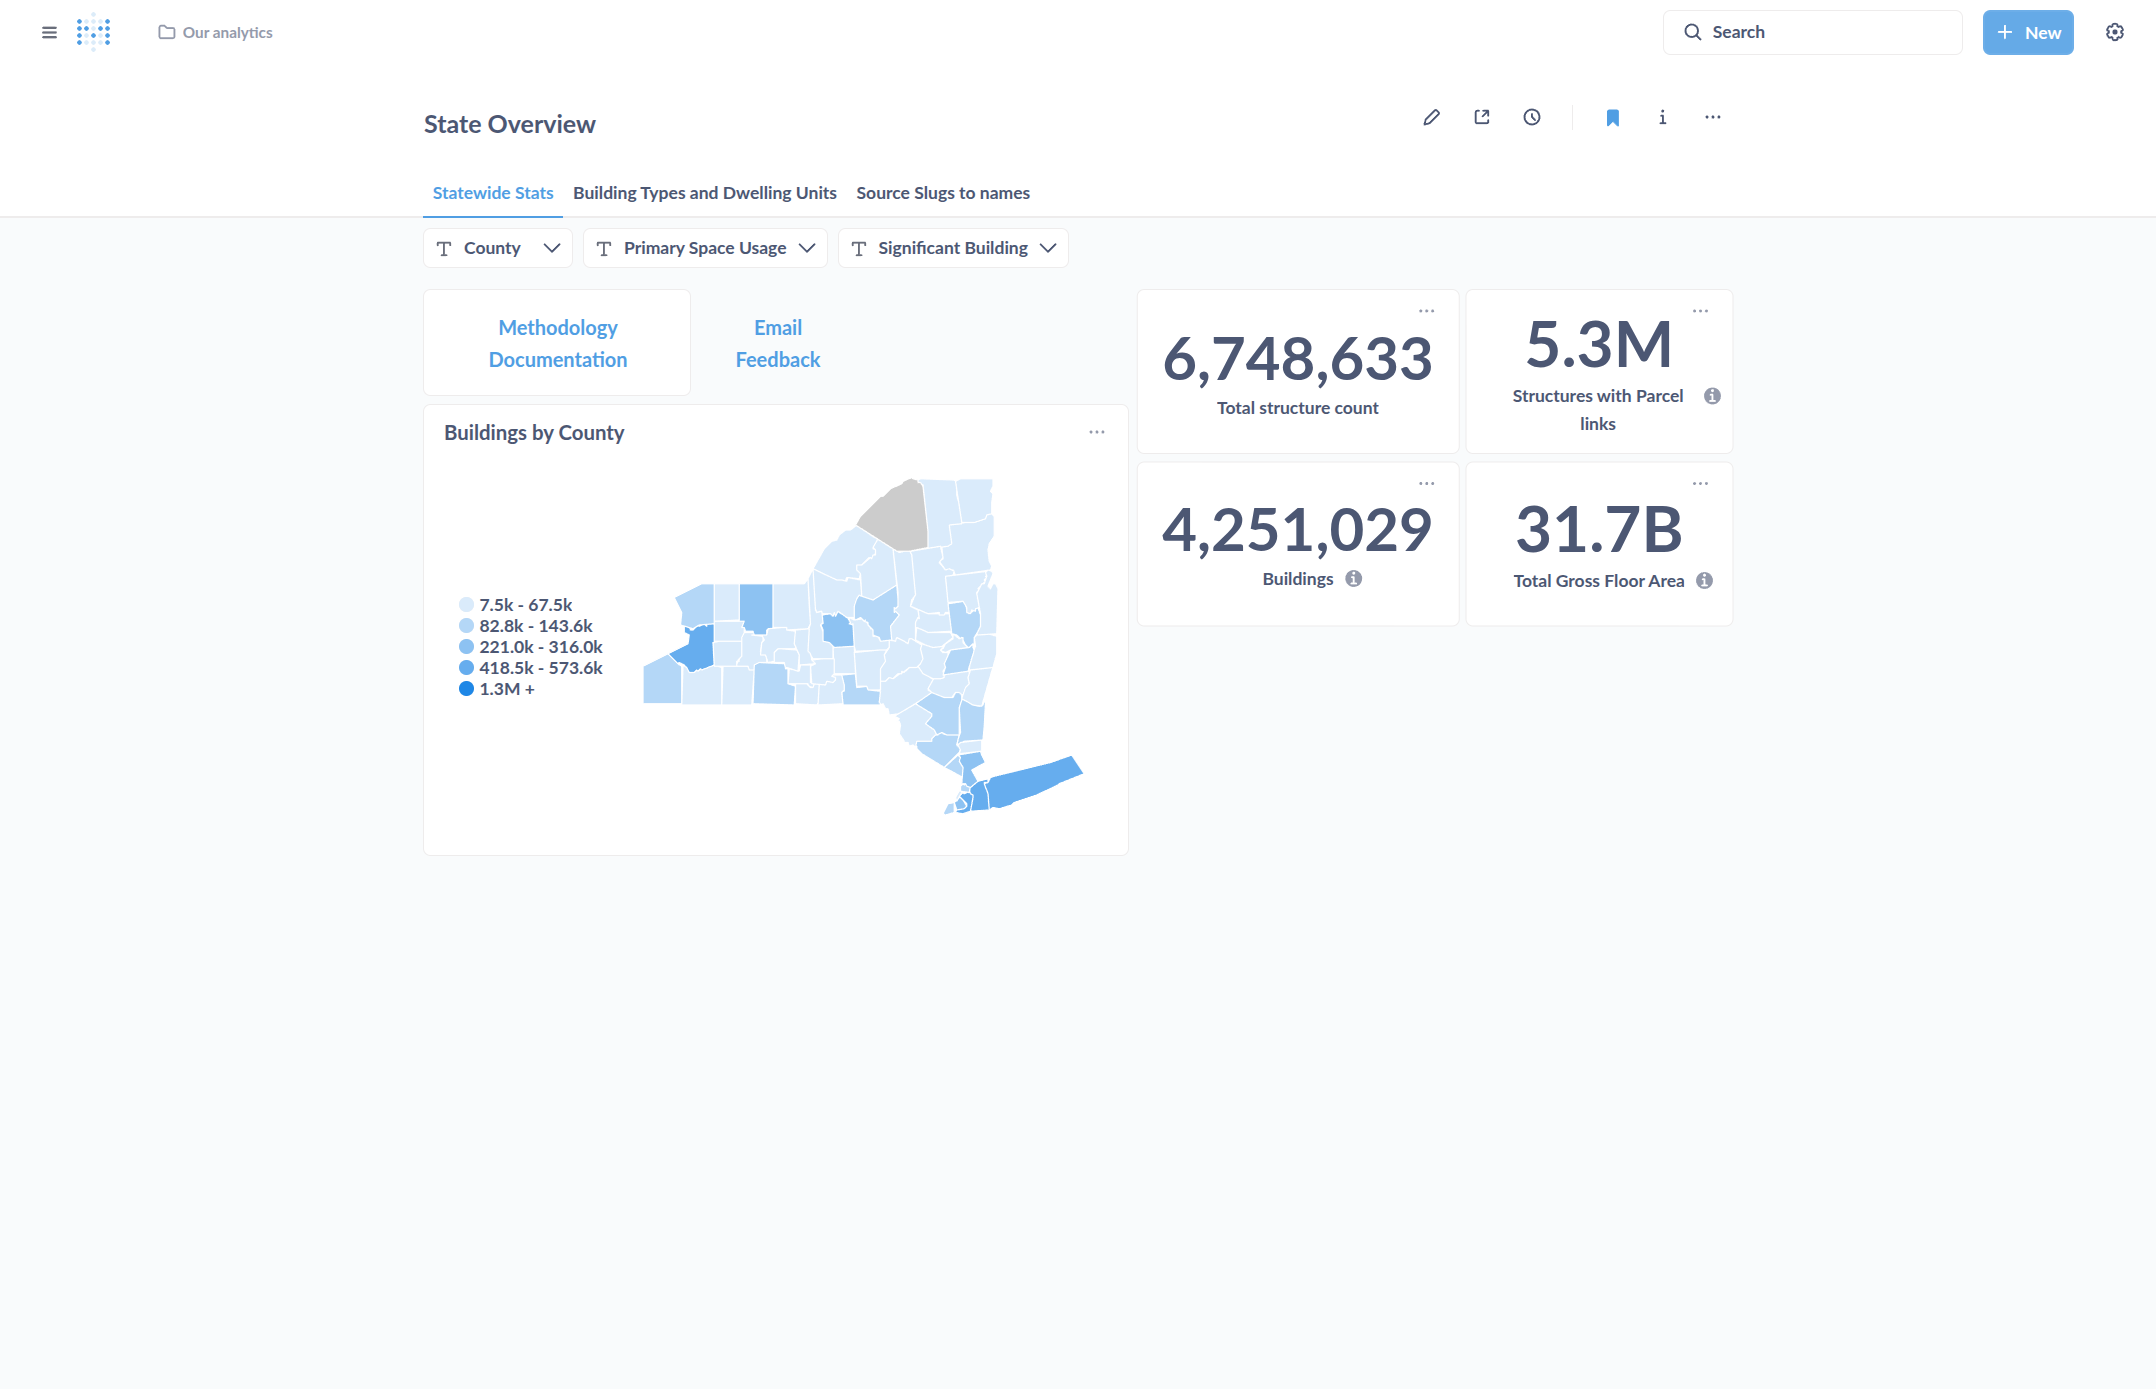
In this guide, we'll learn how to create a summary table of buildings across the different regions of New York State. We will group building data by region, calculate totals and medians, and format the results for clarity. This process will help you organize and present building information in a clear table that you can save or download.
Let's get started
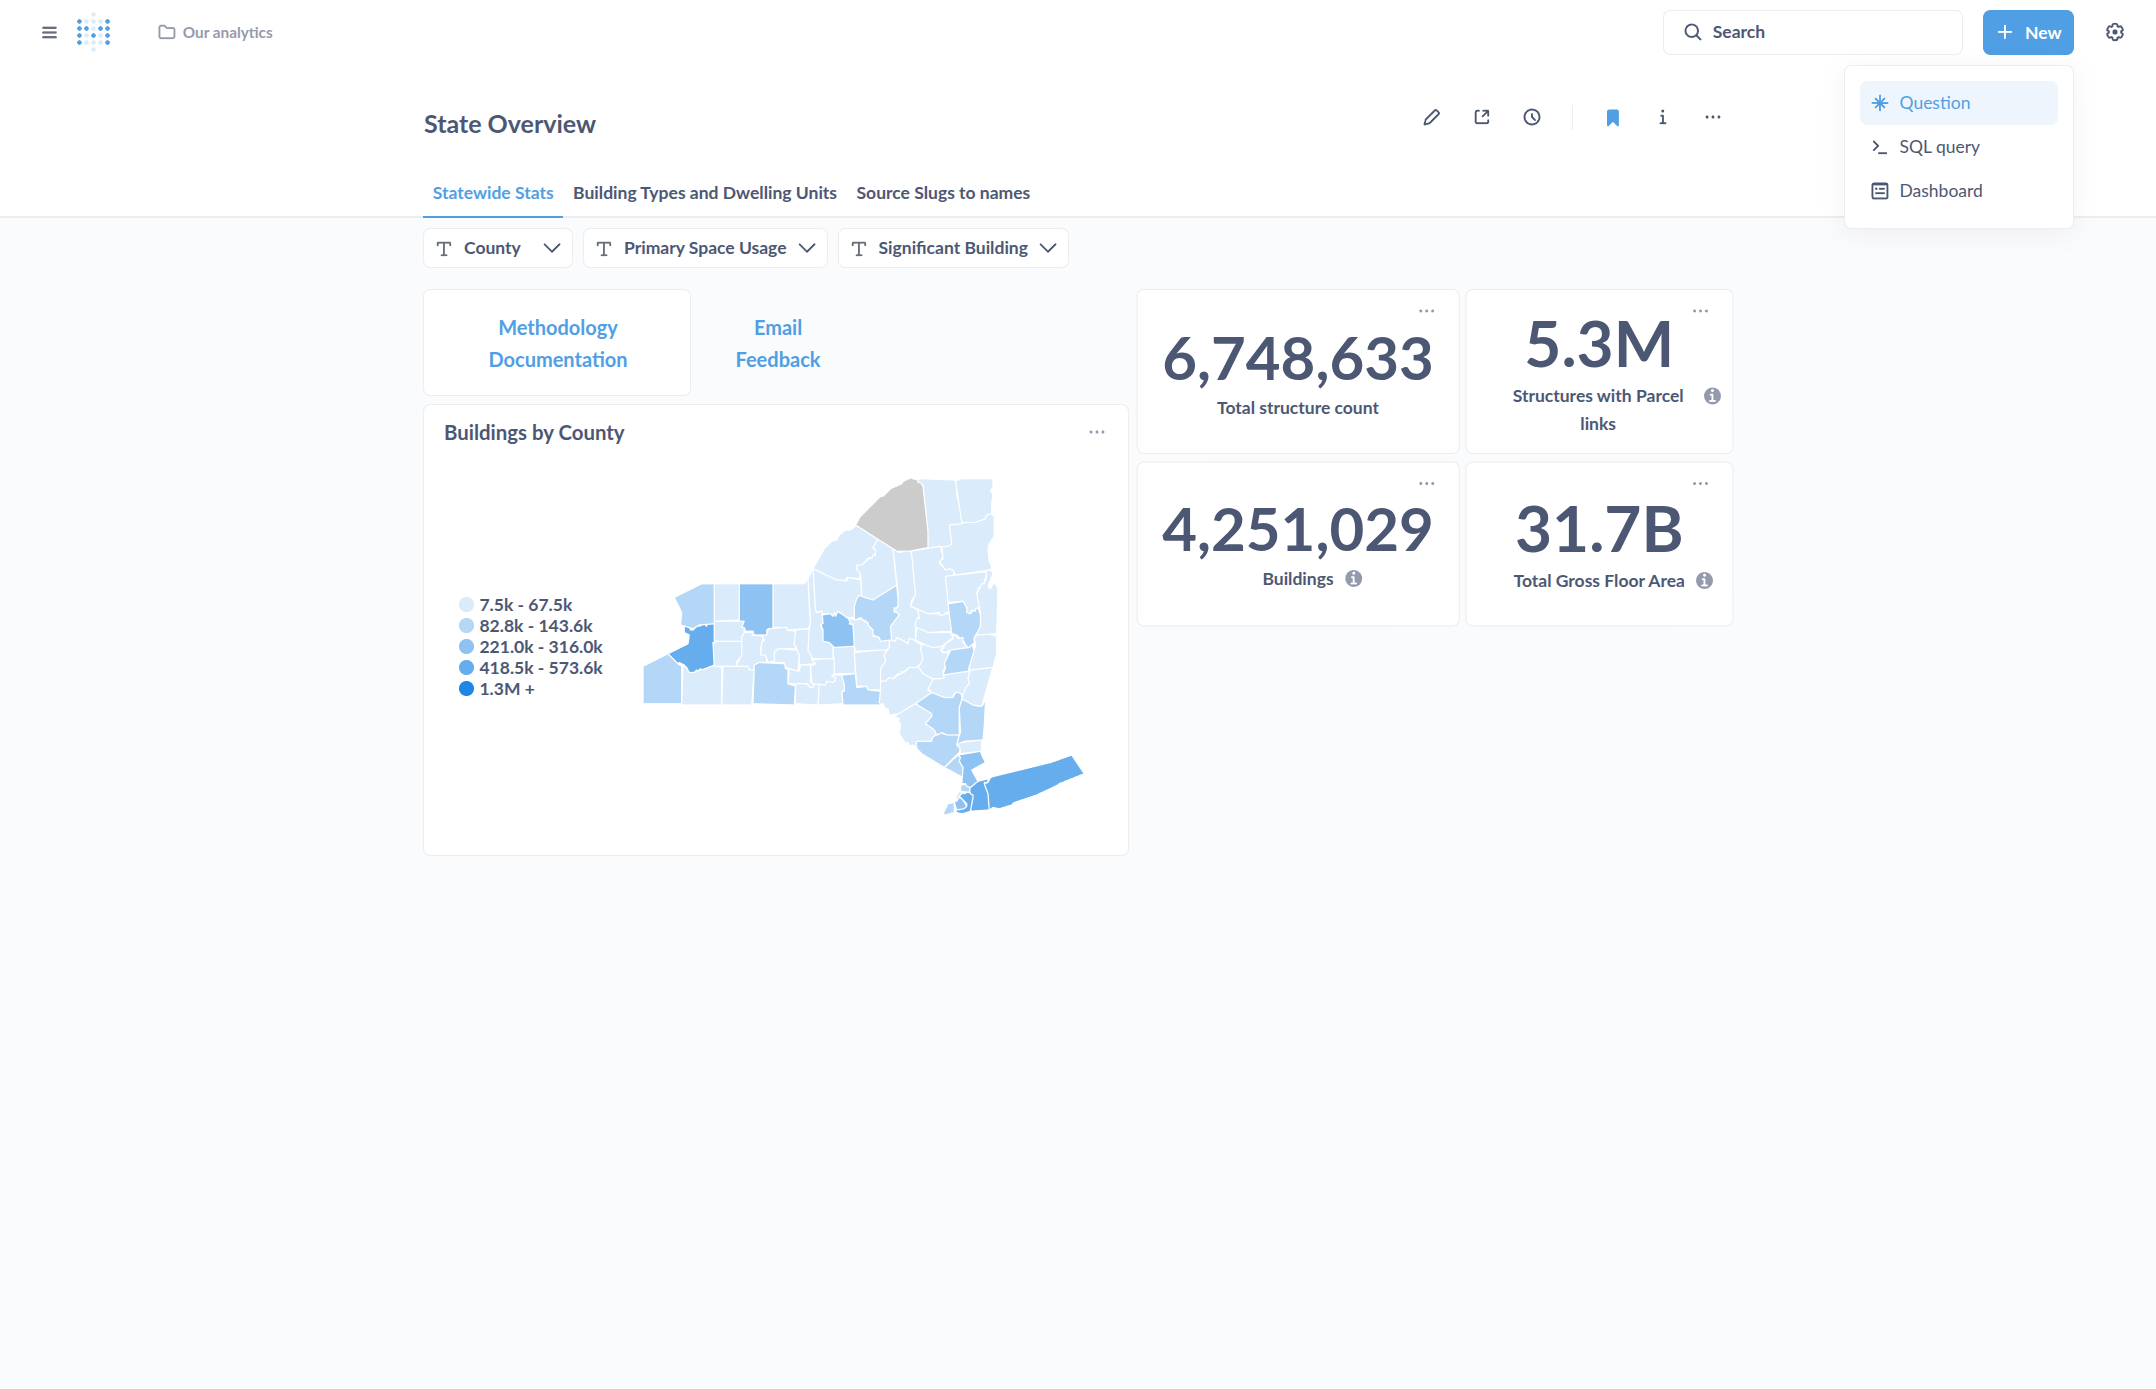
In this guide, we will create a table summarizing buildings in various regions of New York State. Click on New, then select Question.
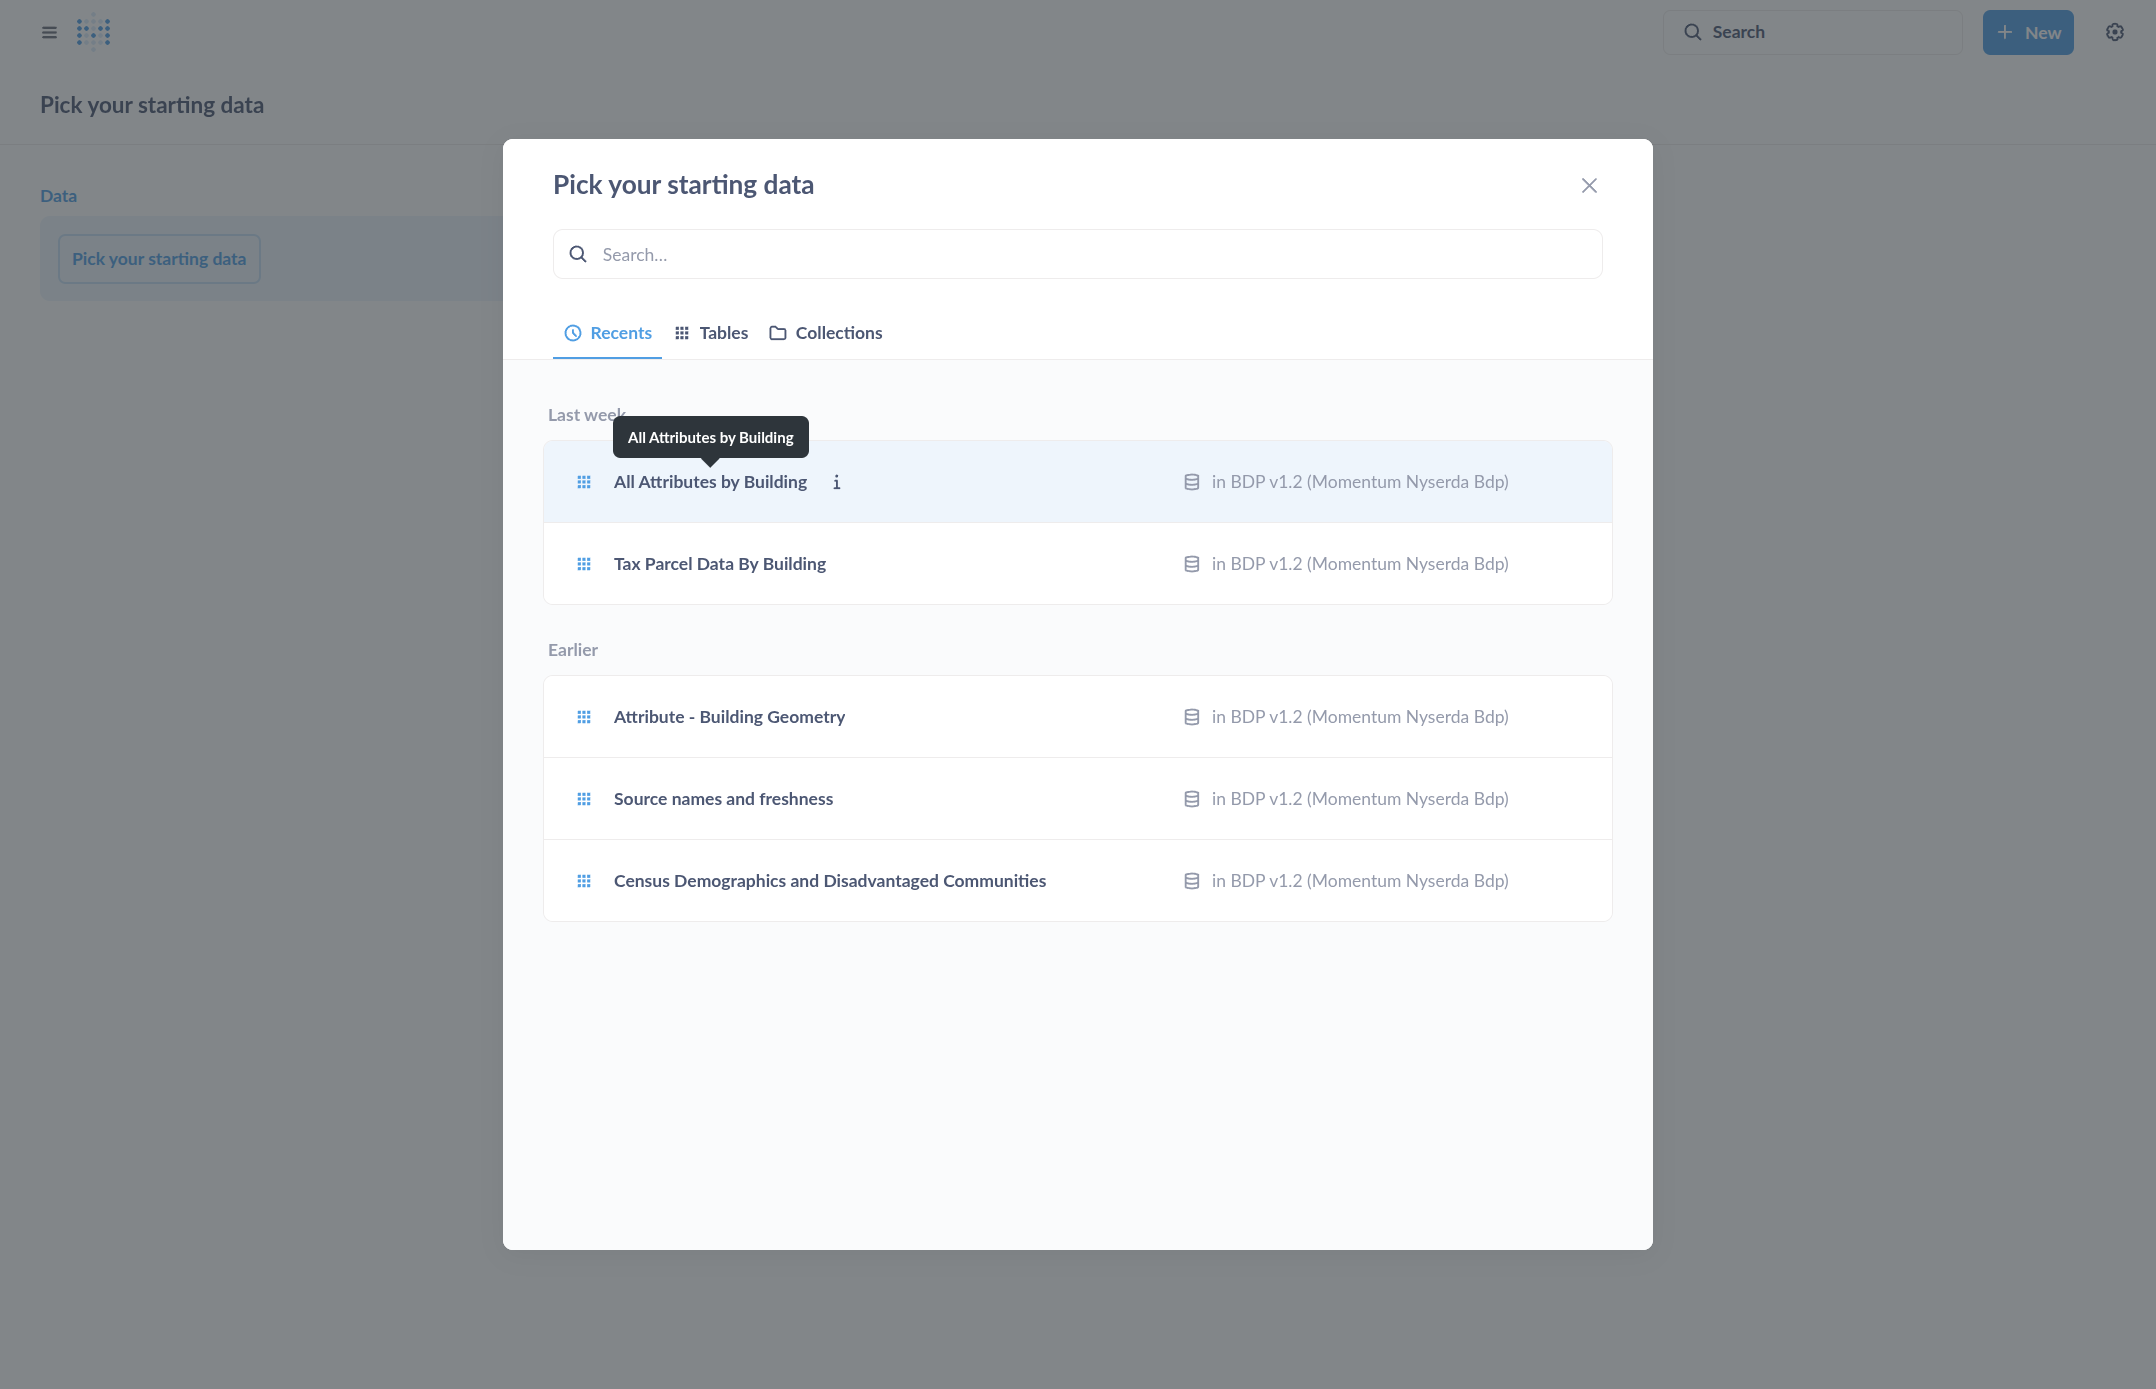
For this example we choose the table "All Attributes by Building" as our starting point.
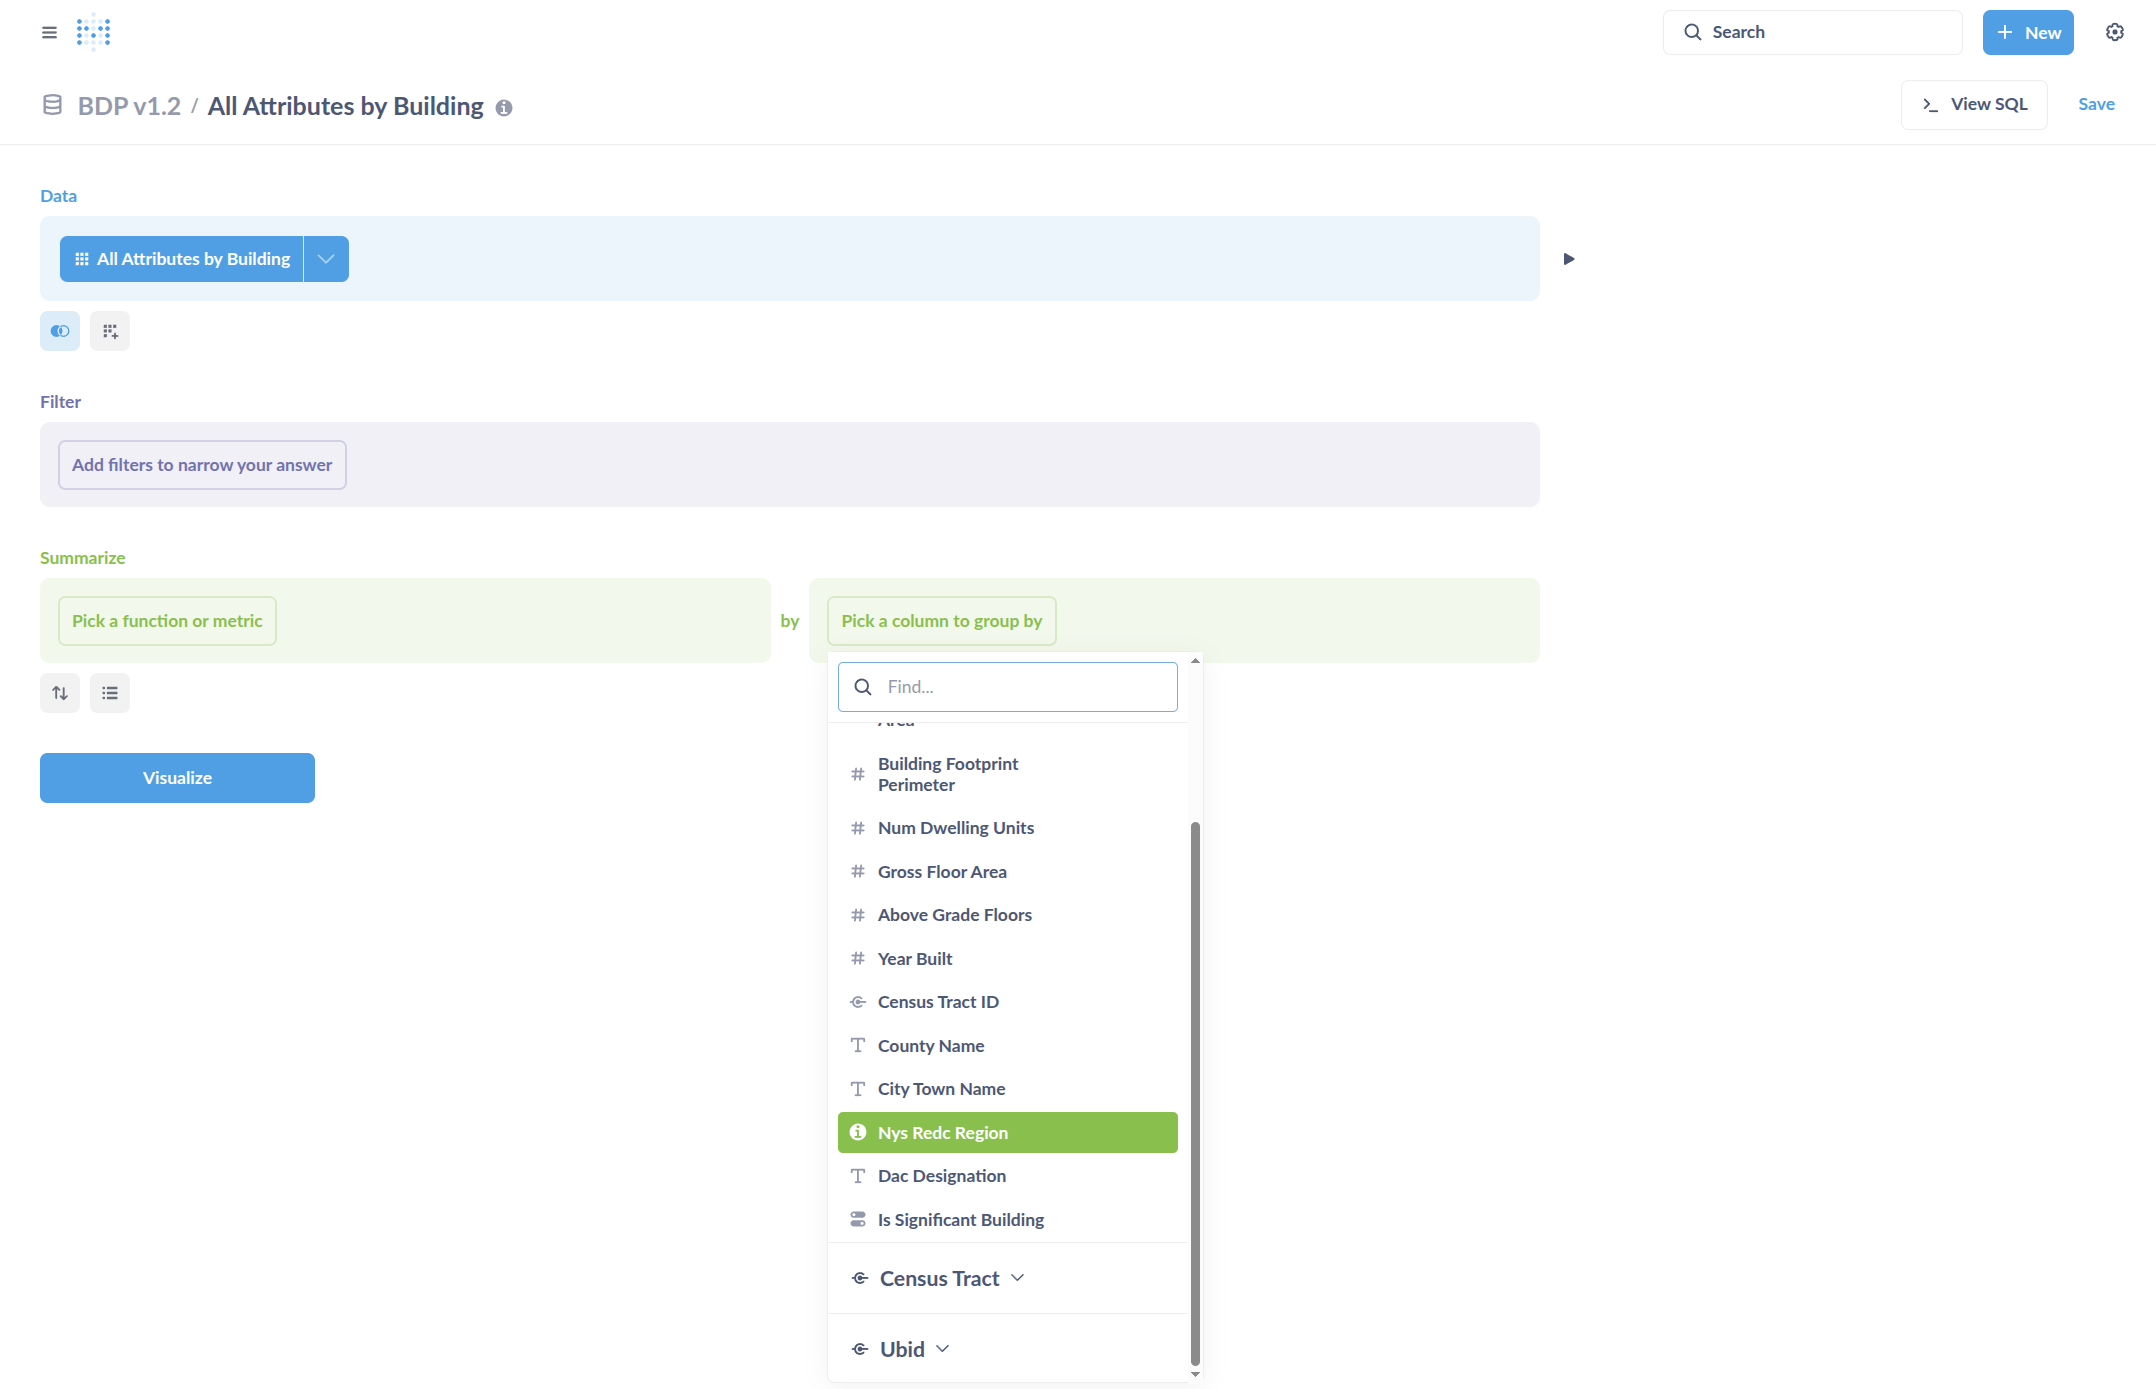
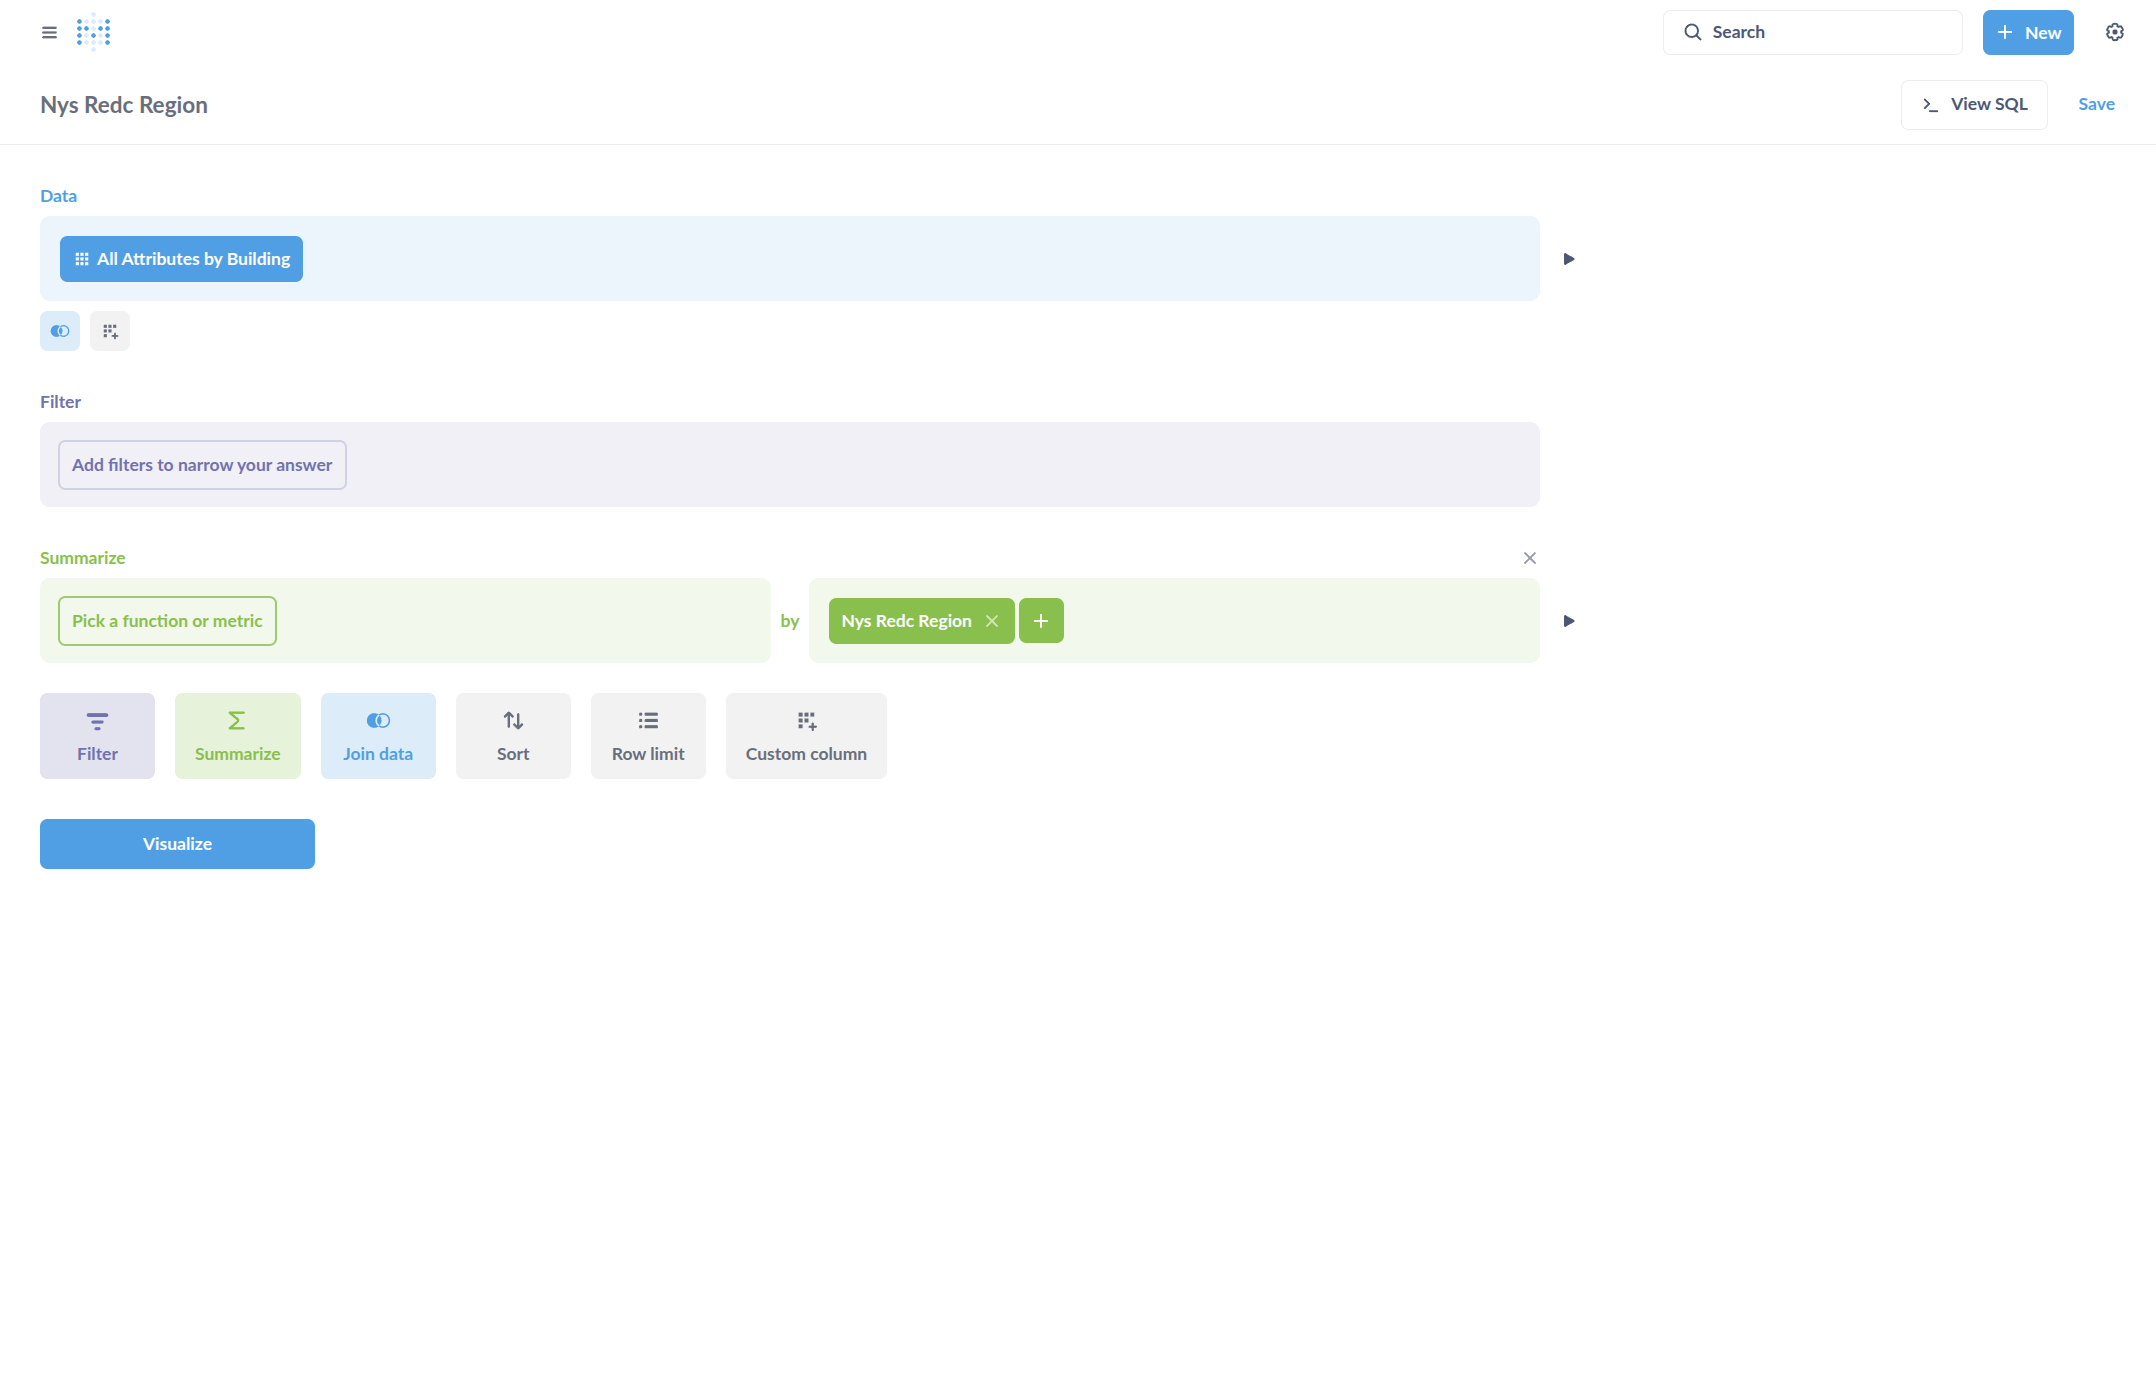
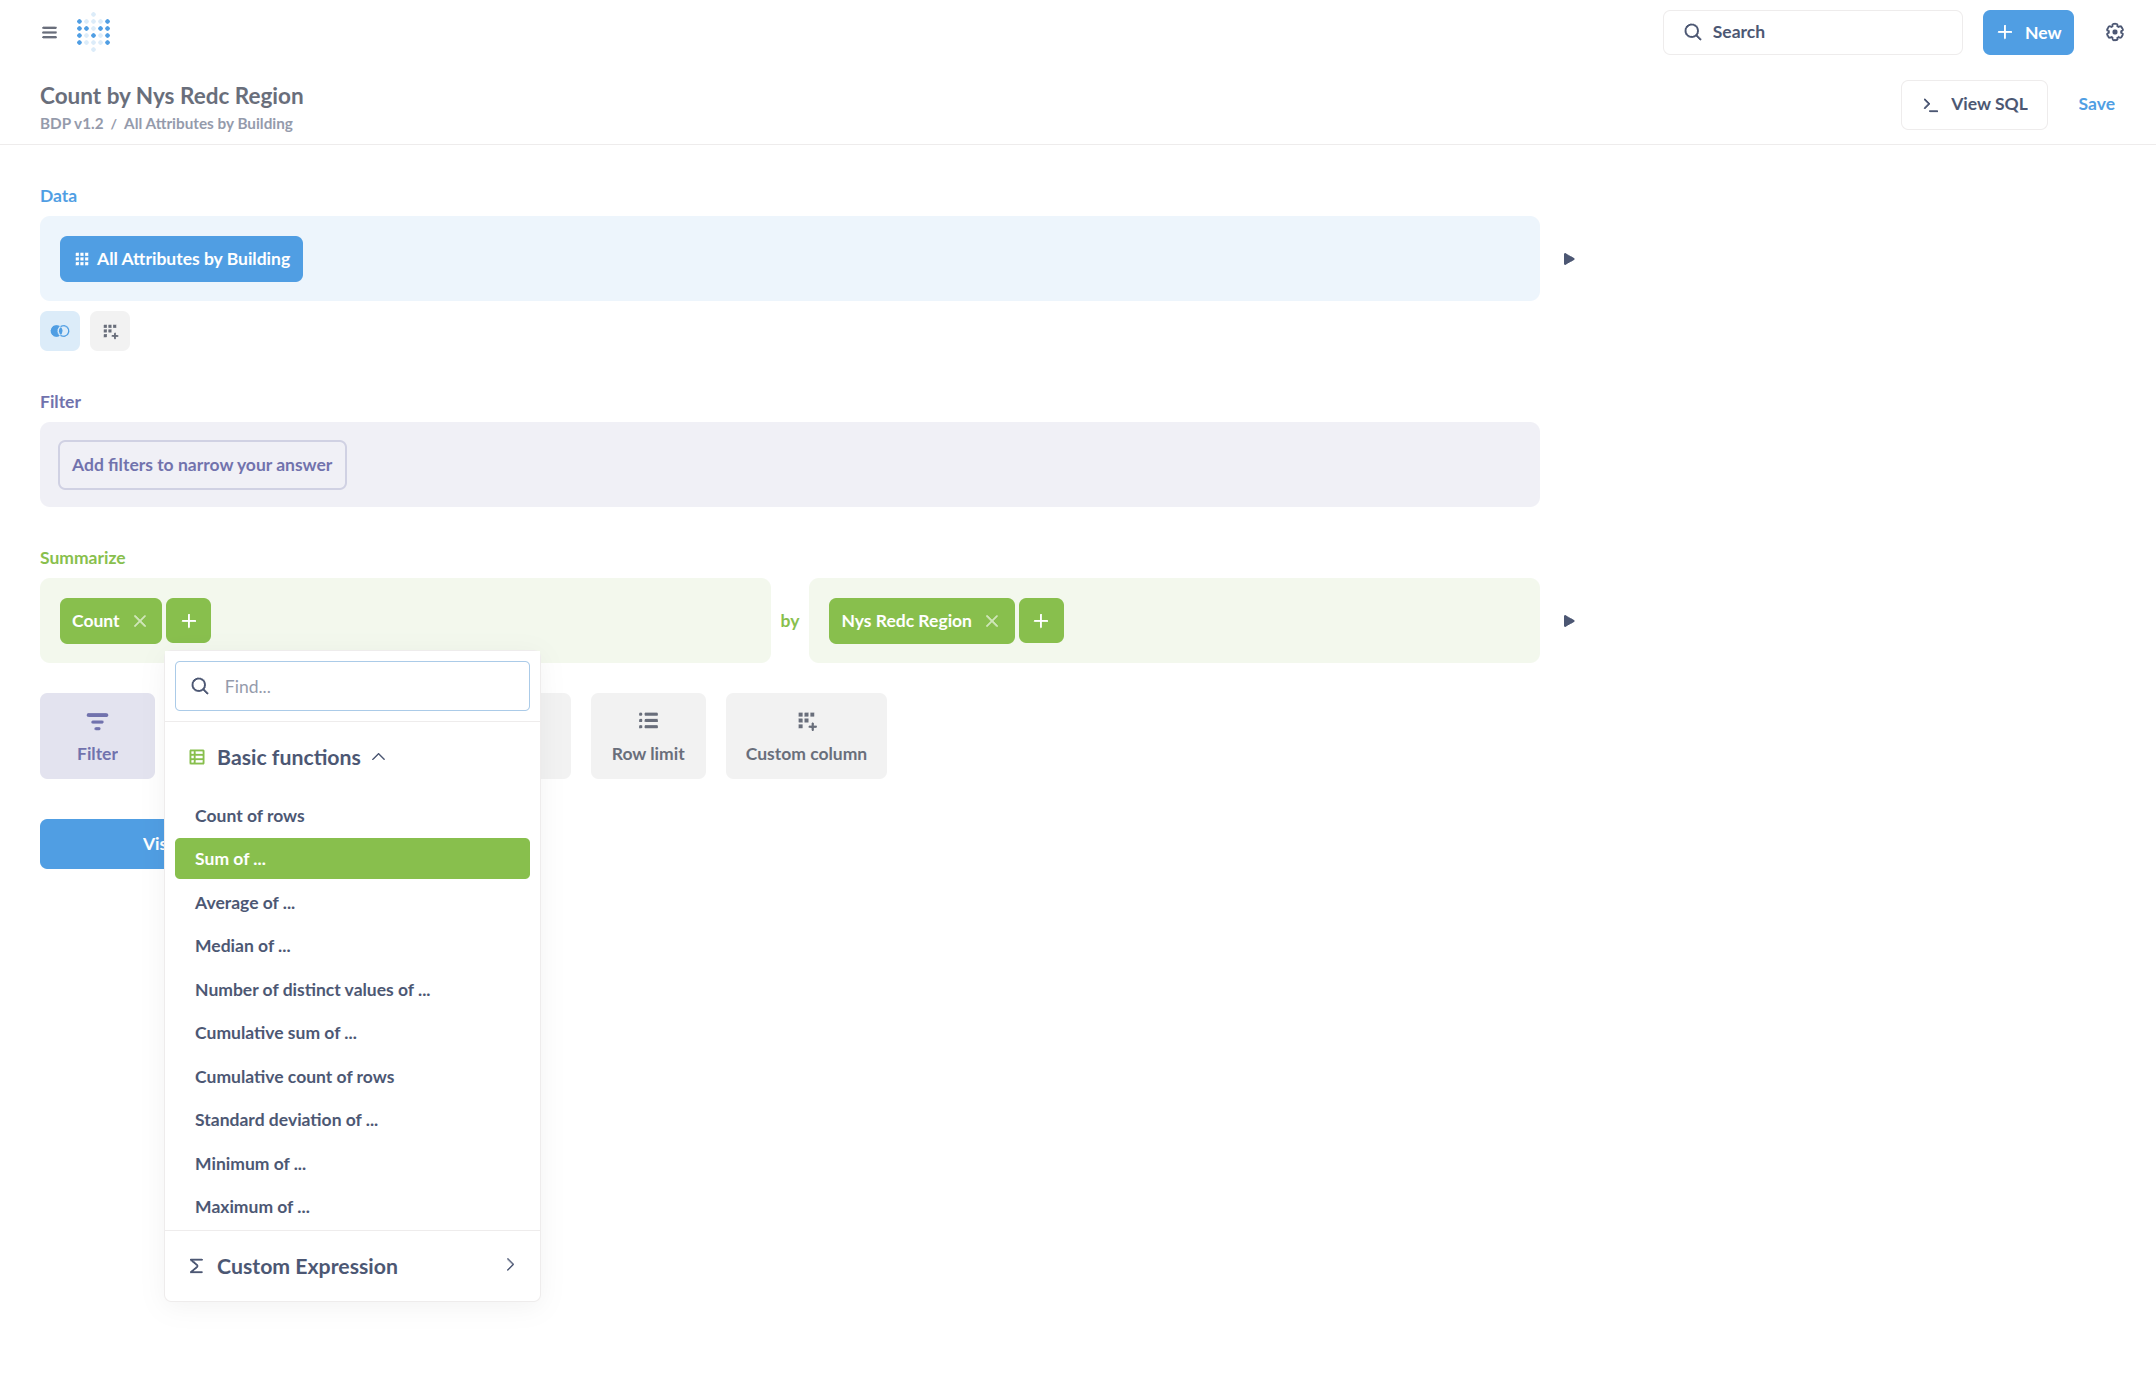
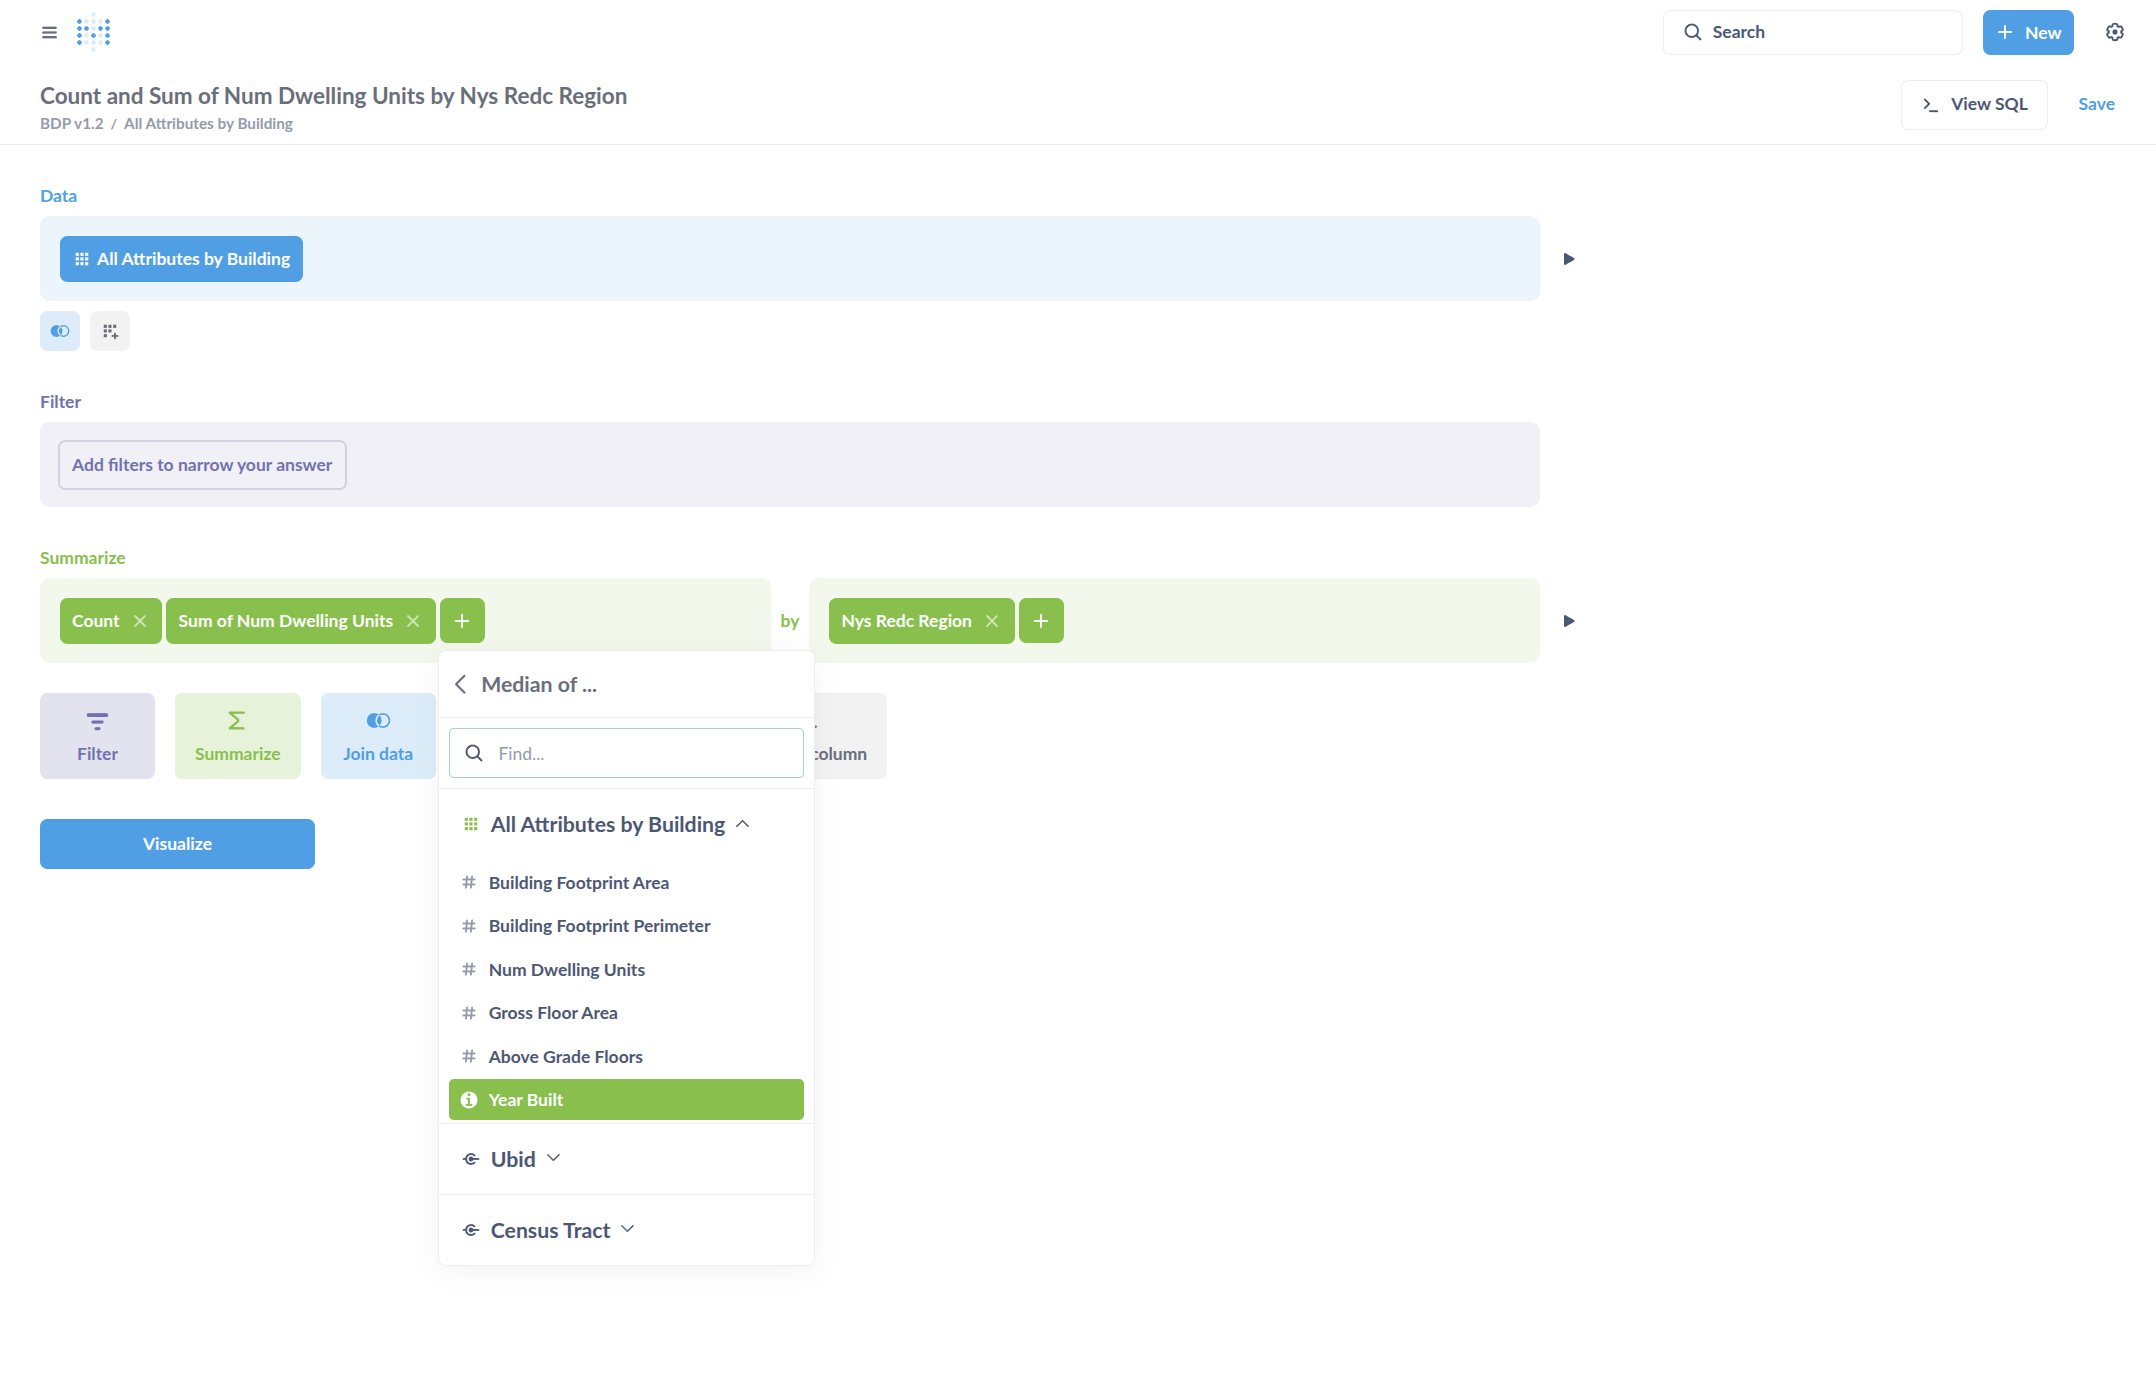
In the question editor, select Group by New York State REDC Region.
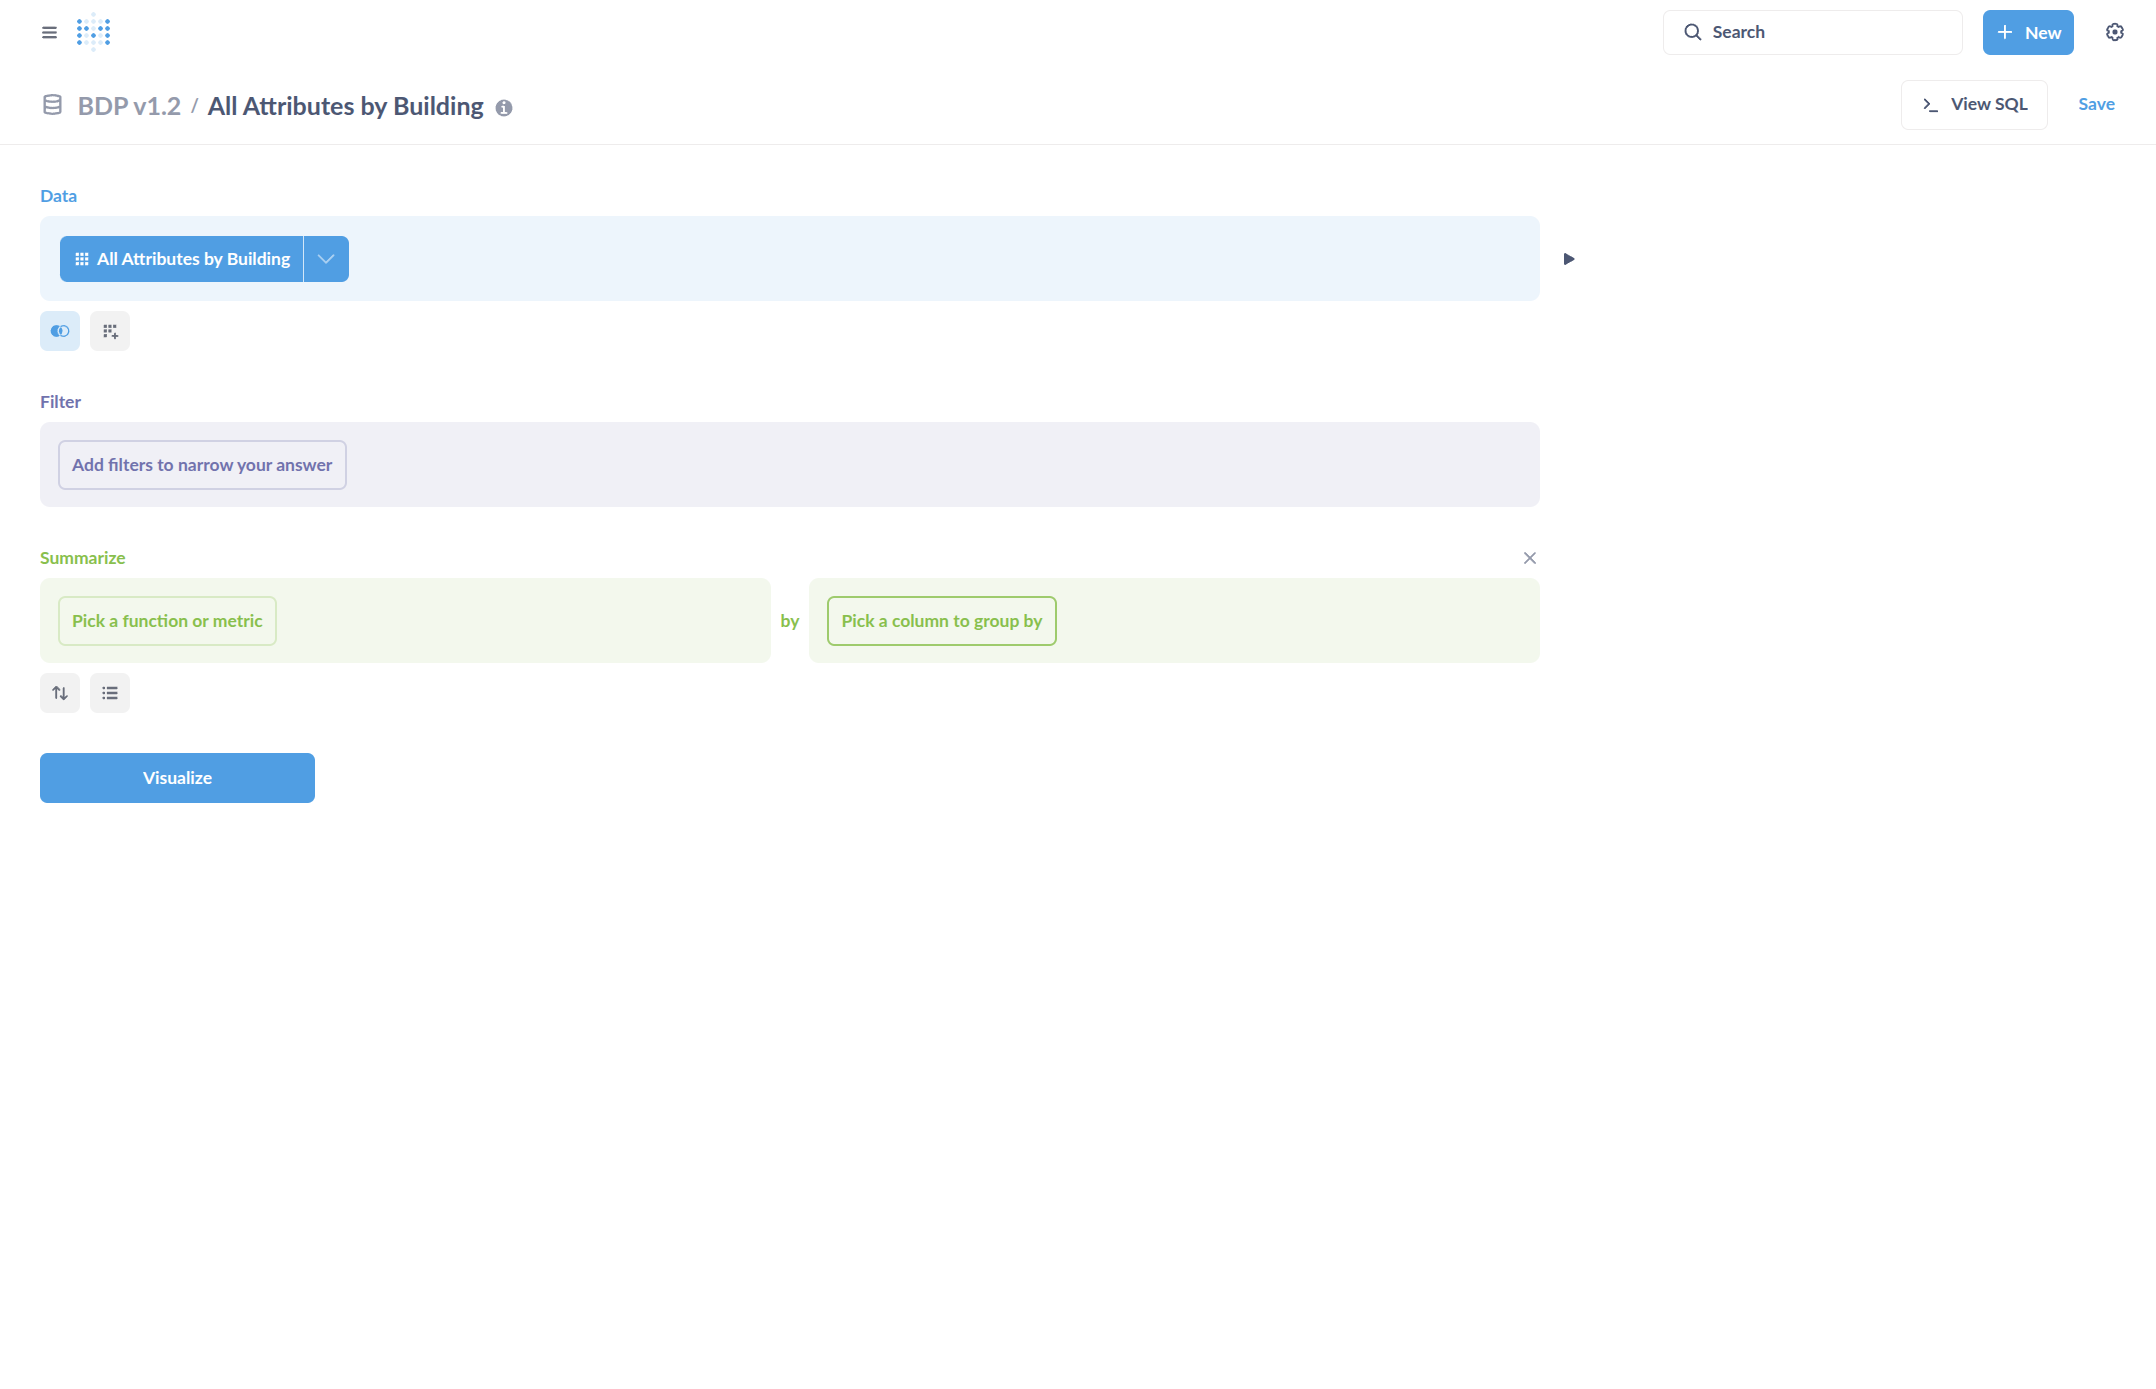
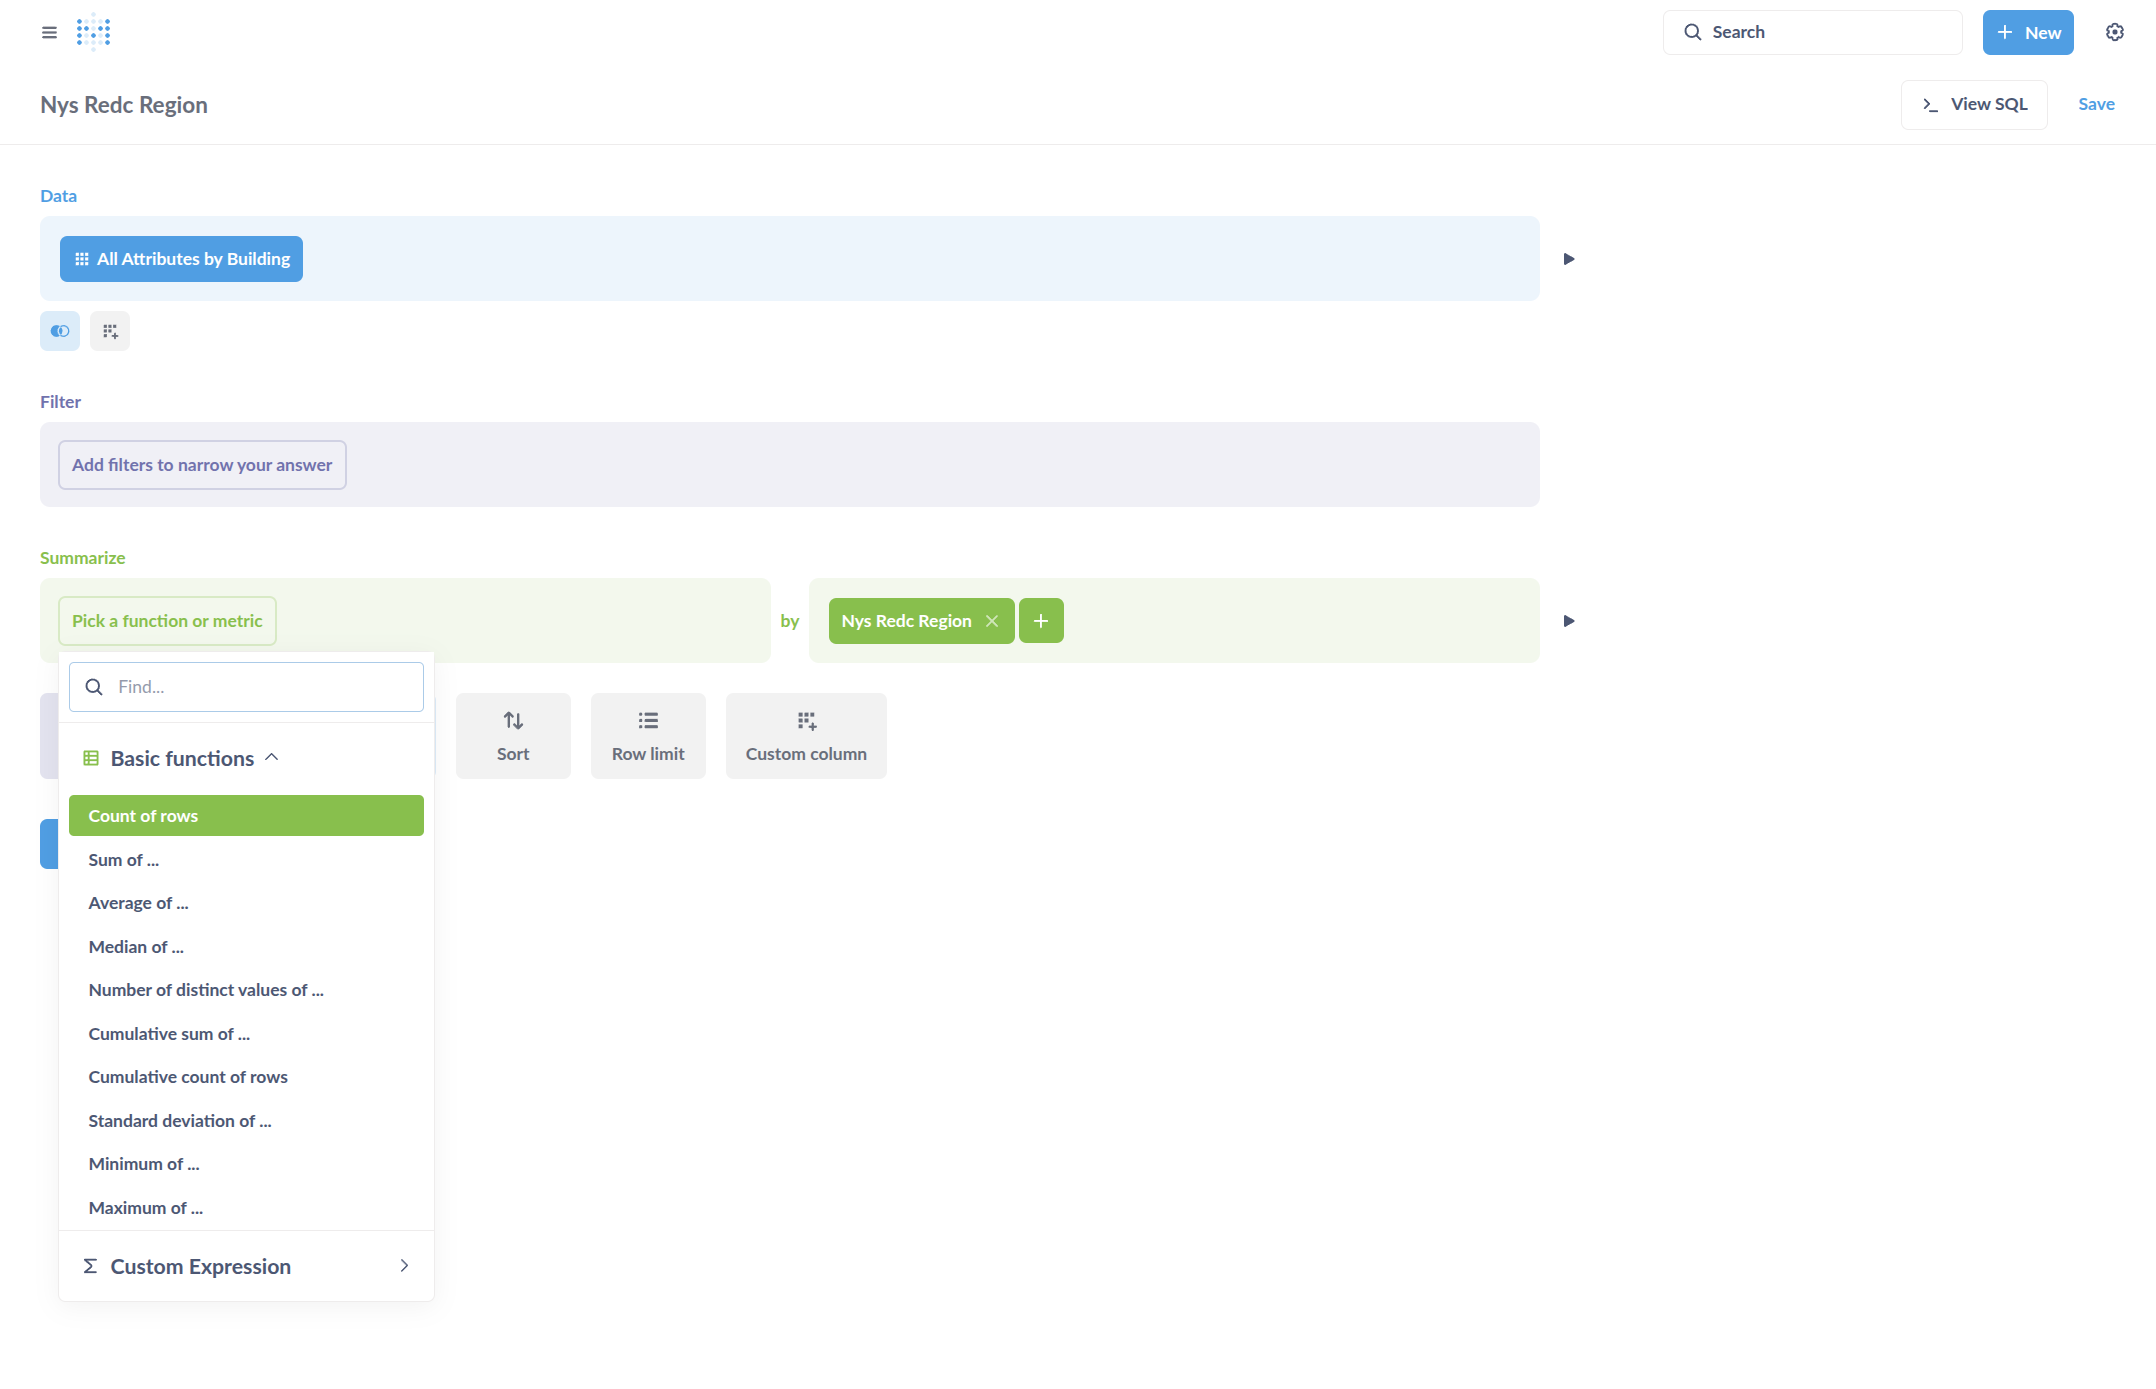
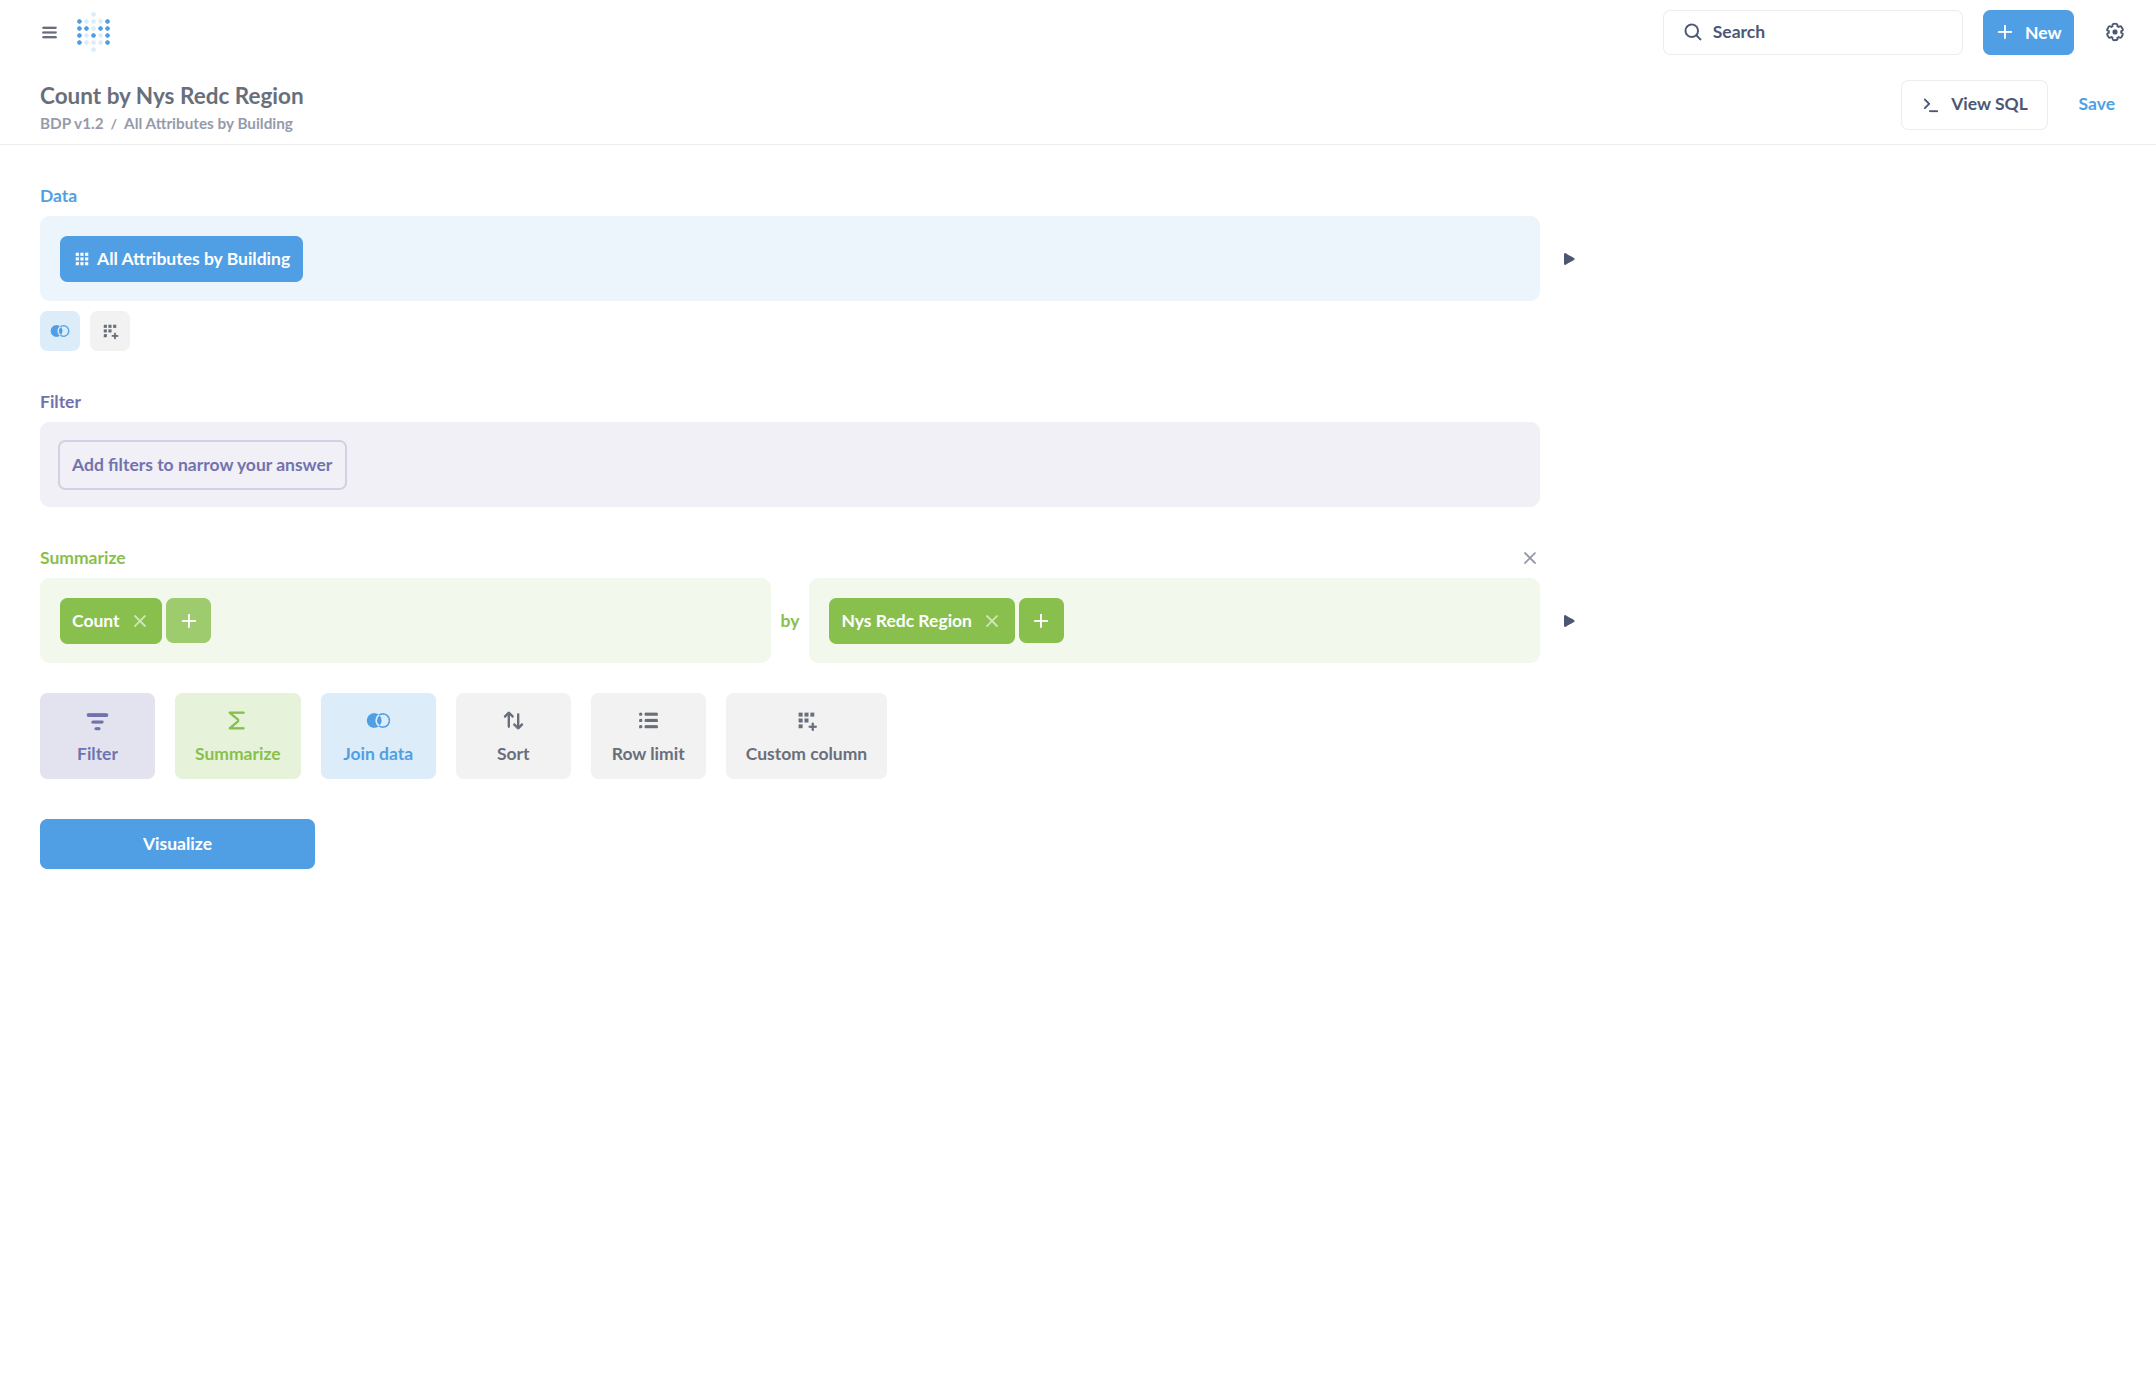
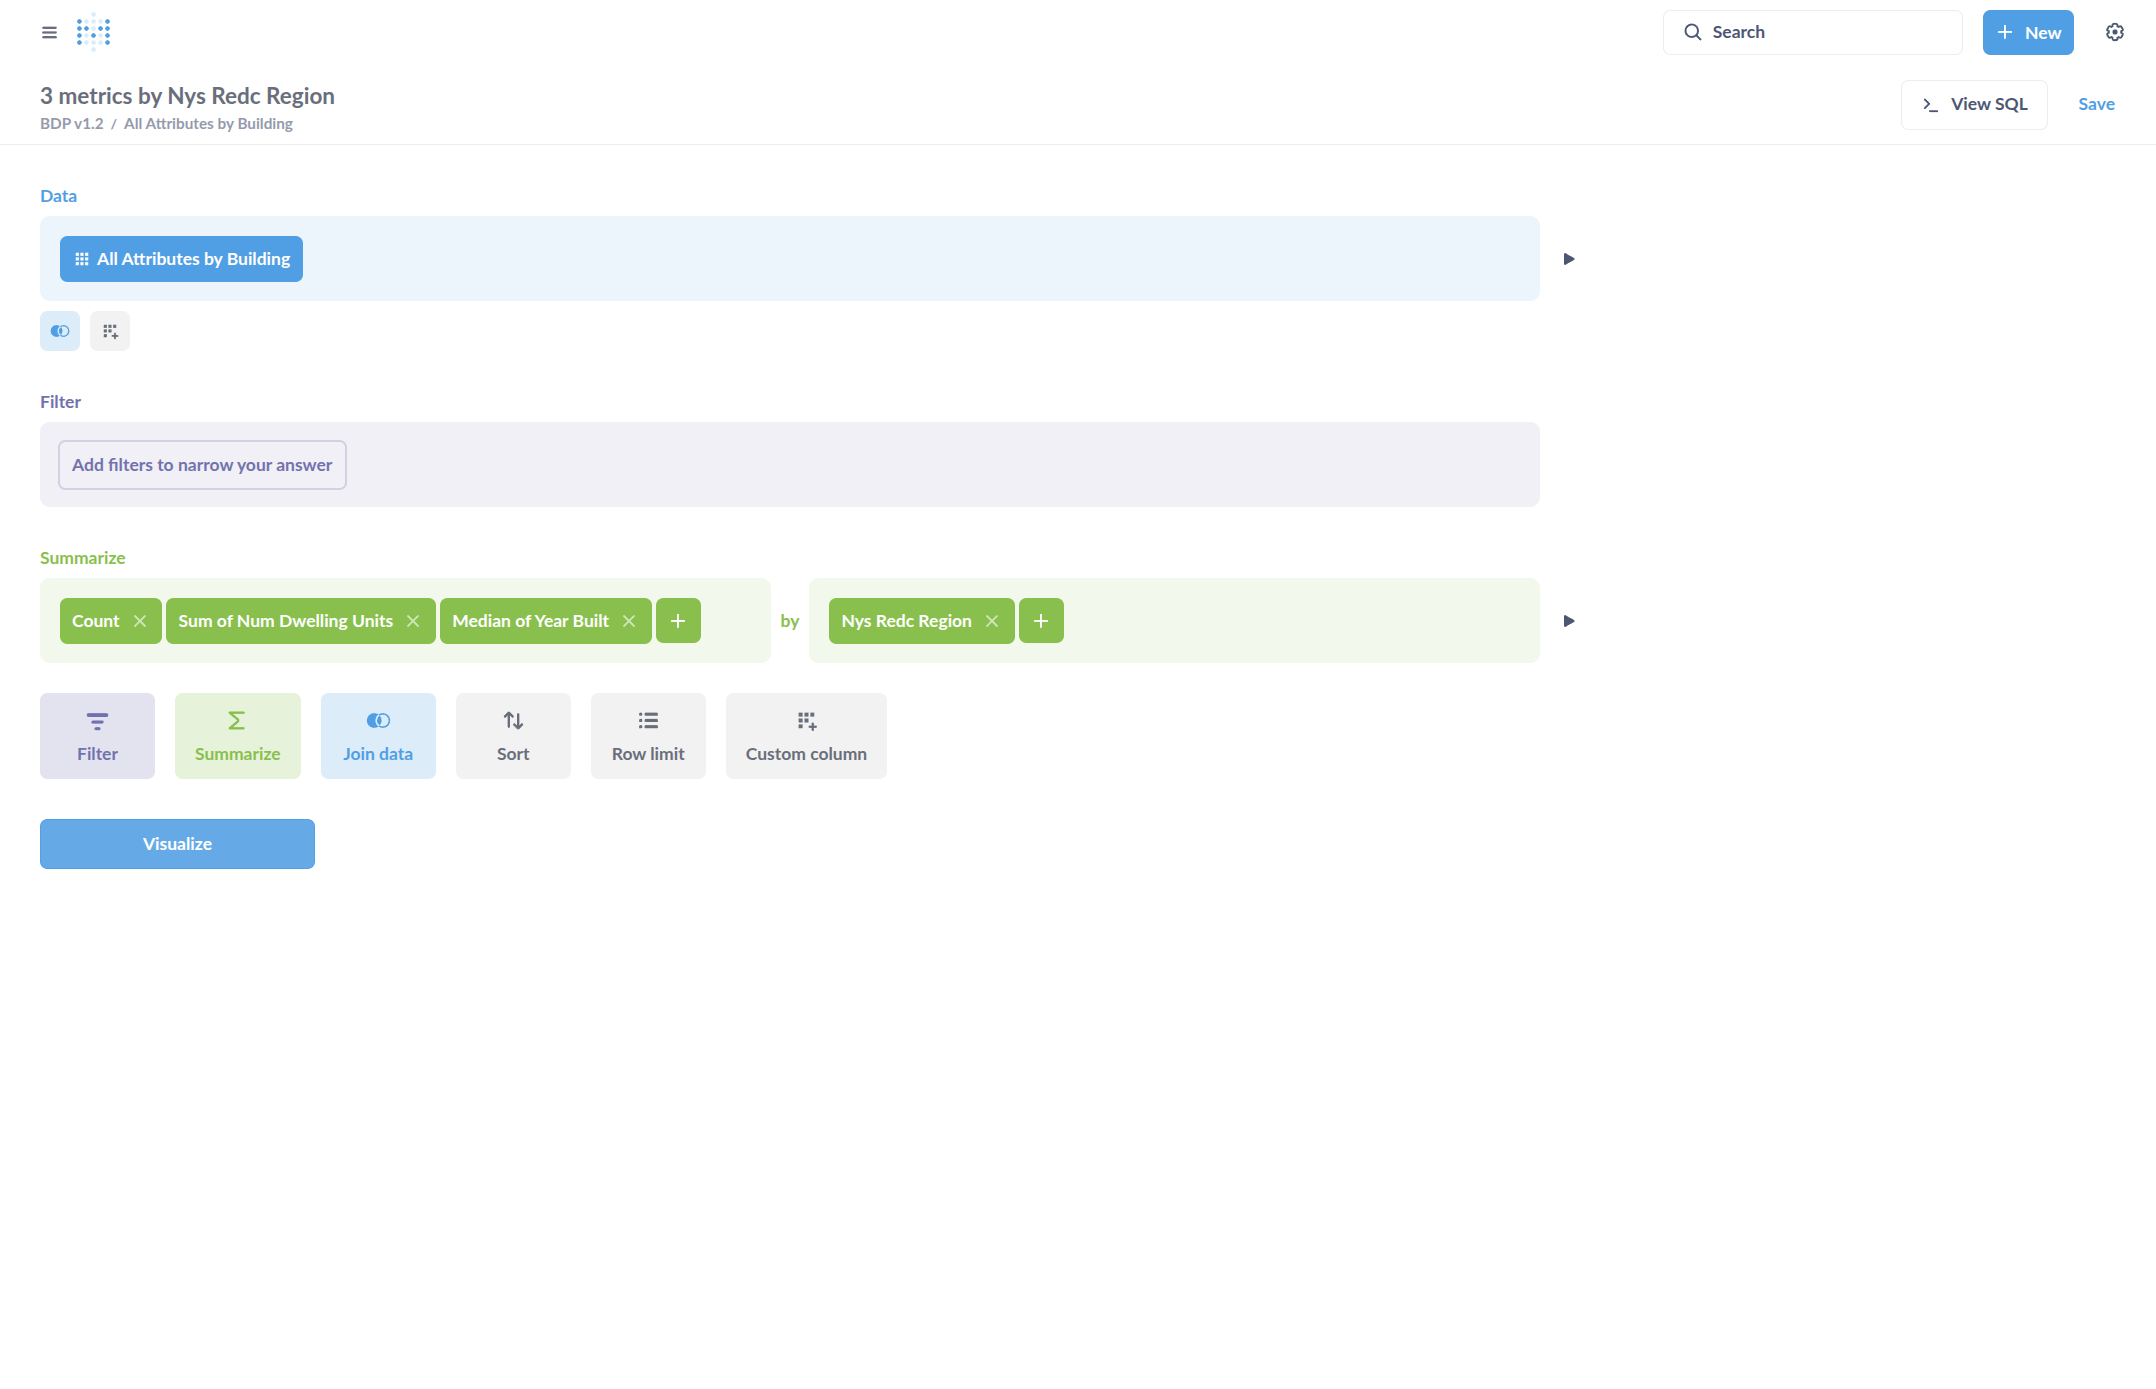
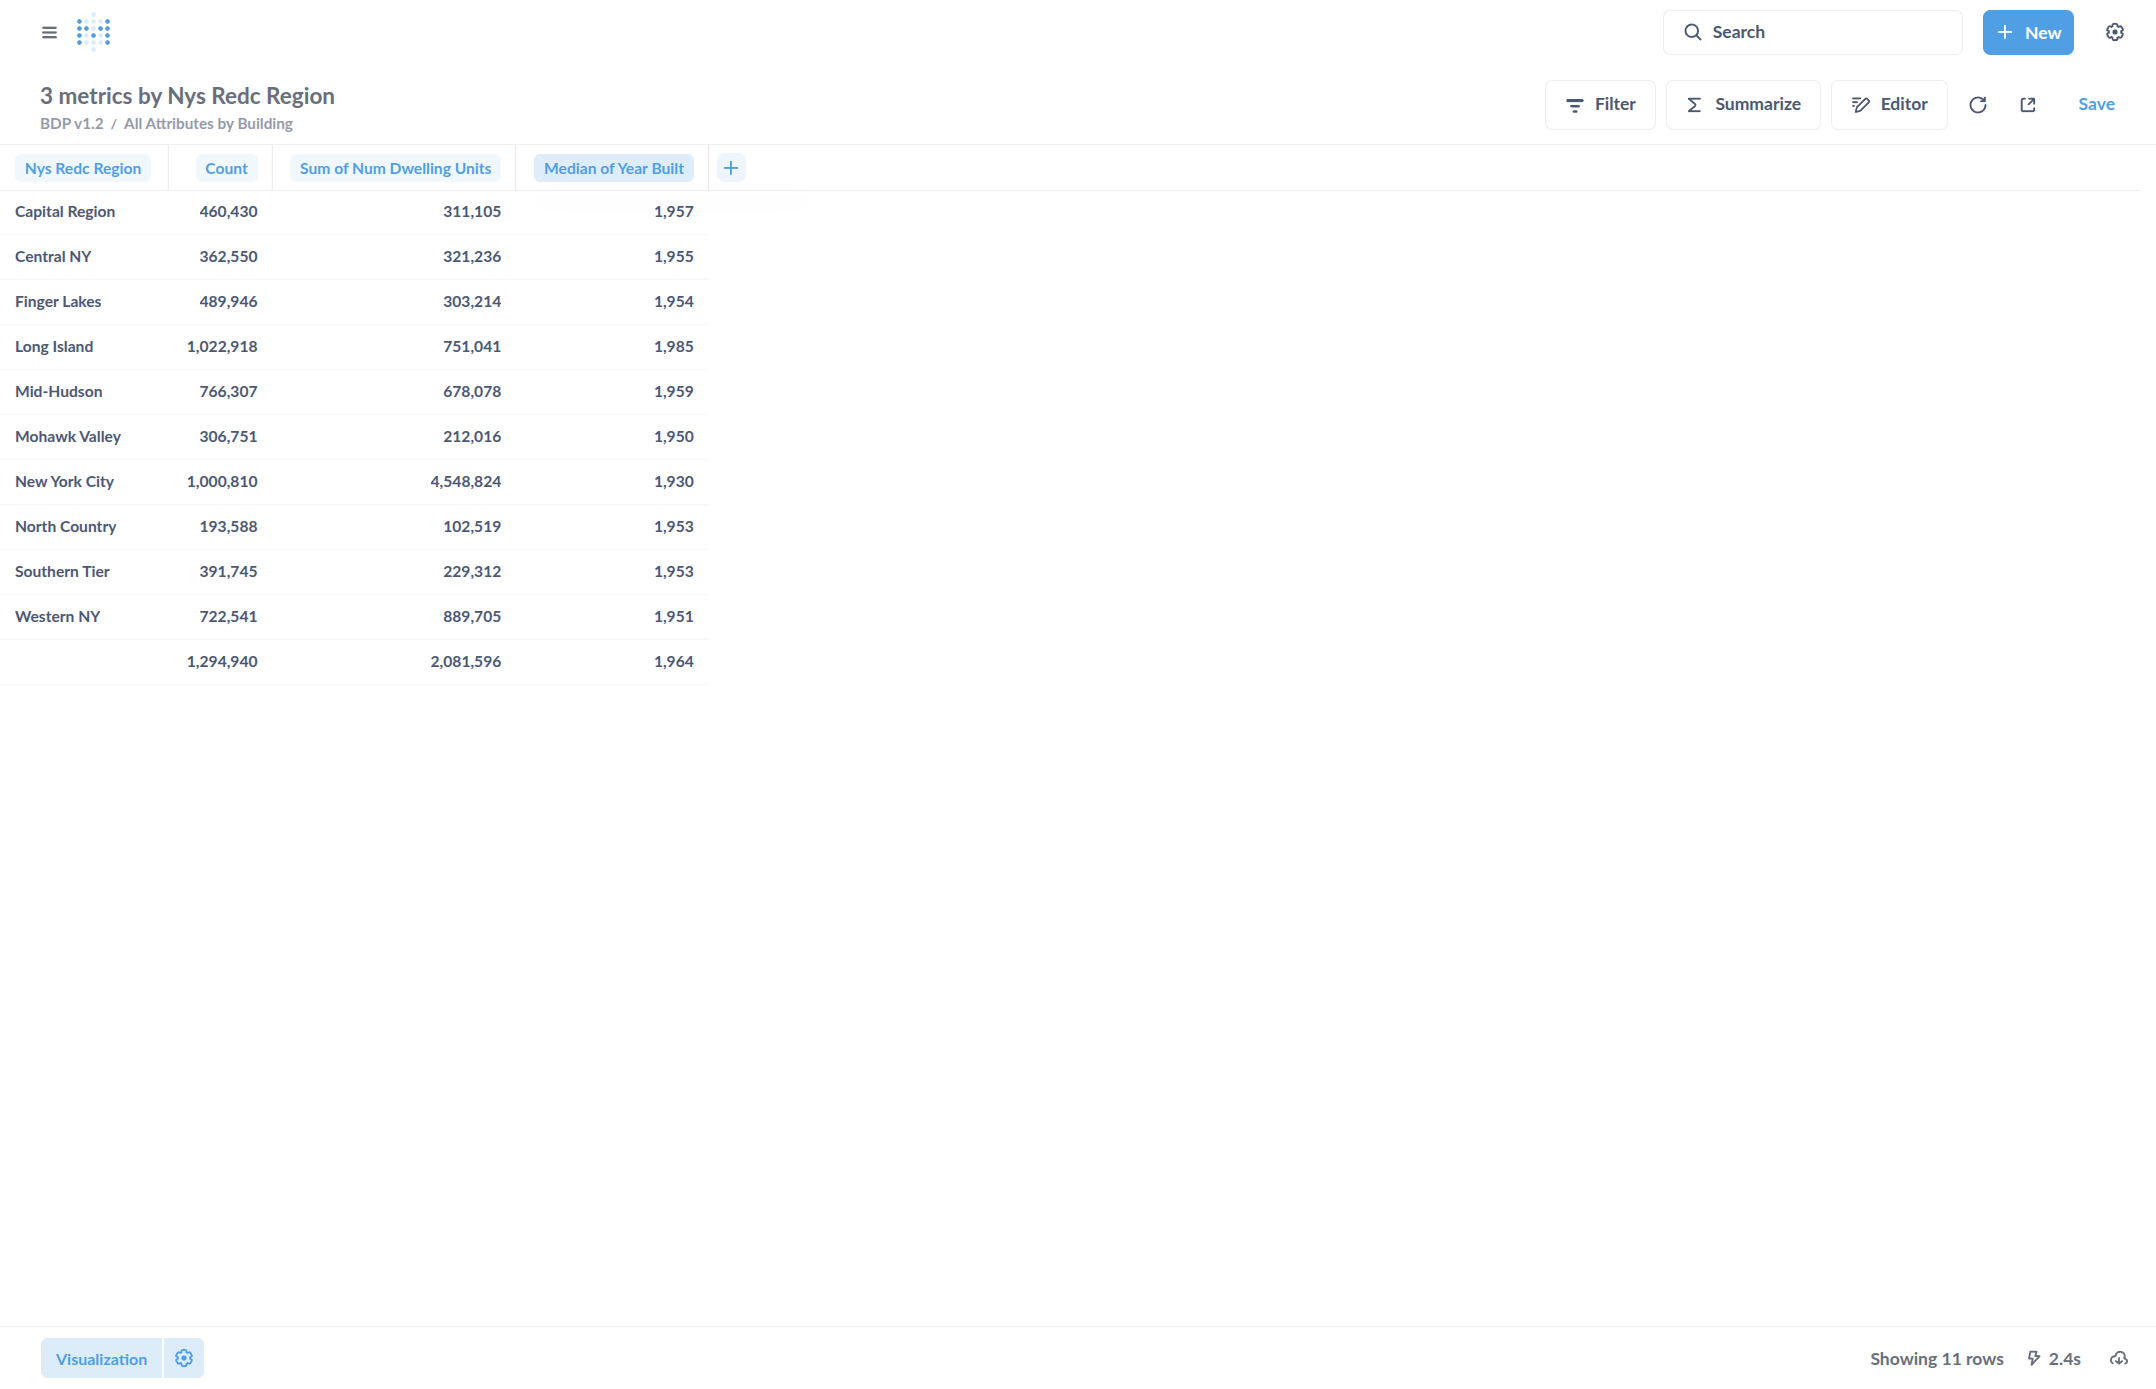
The table will have building count, sum of gross floor area, and median Year Built.
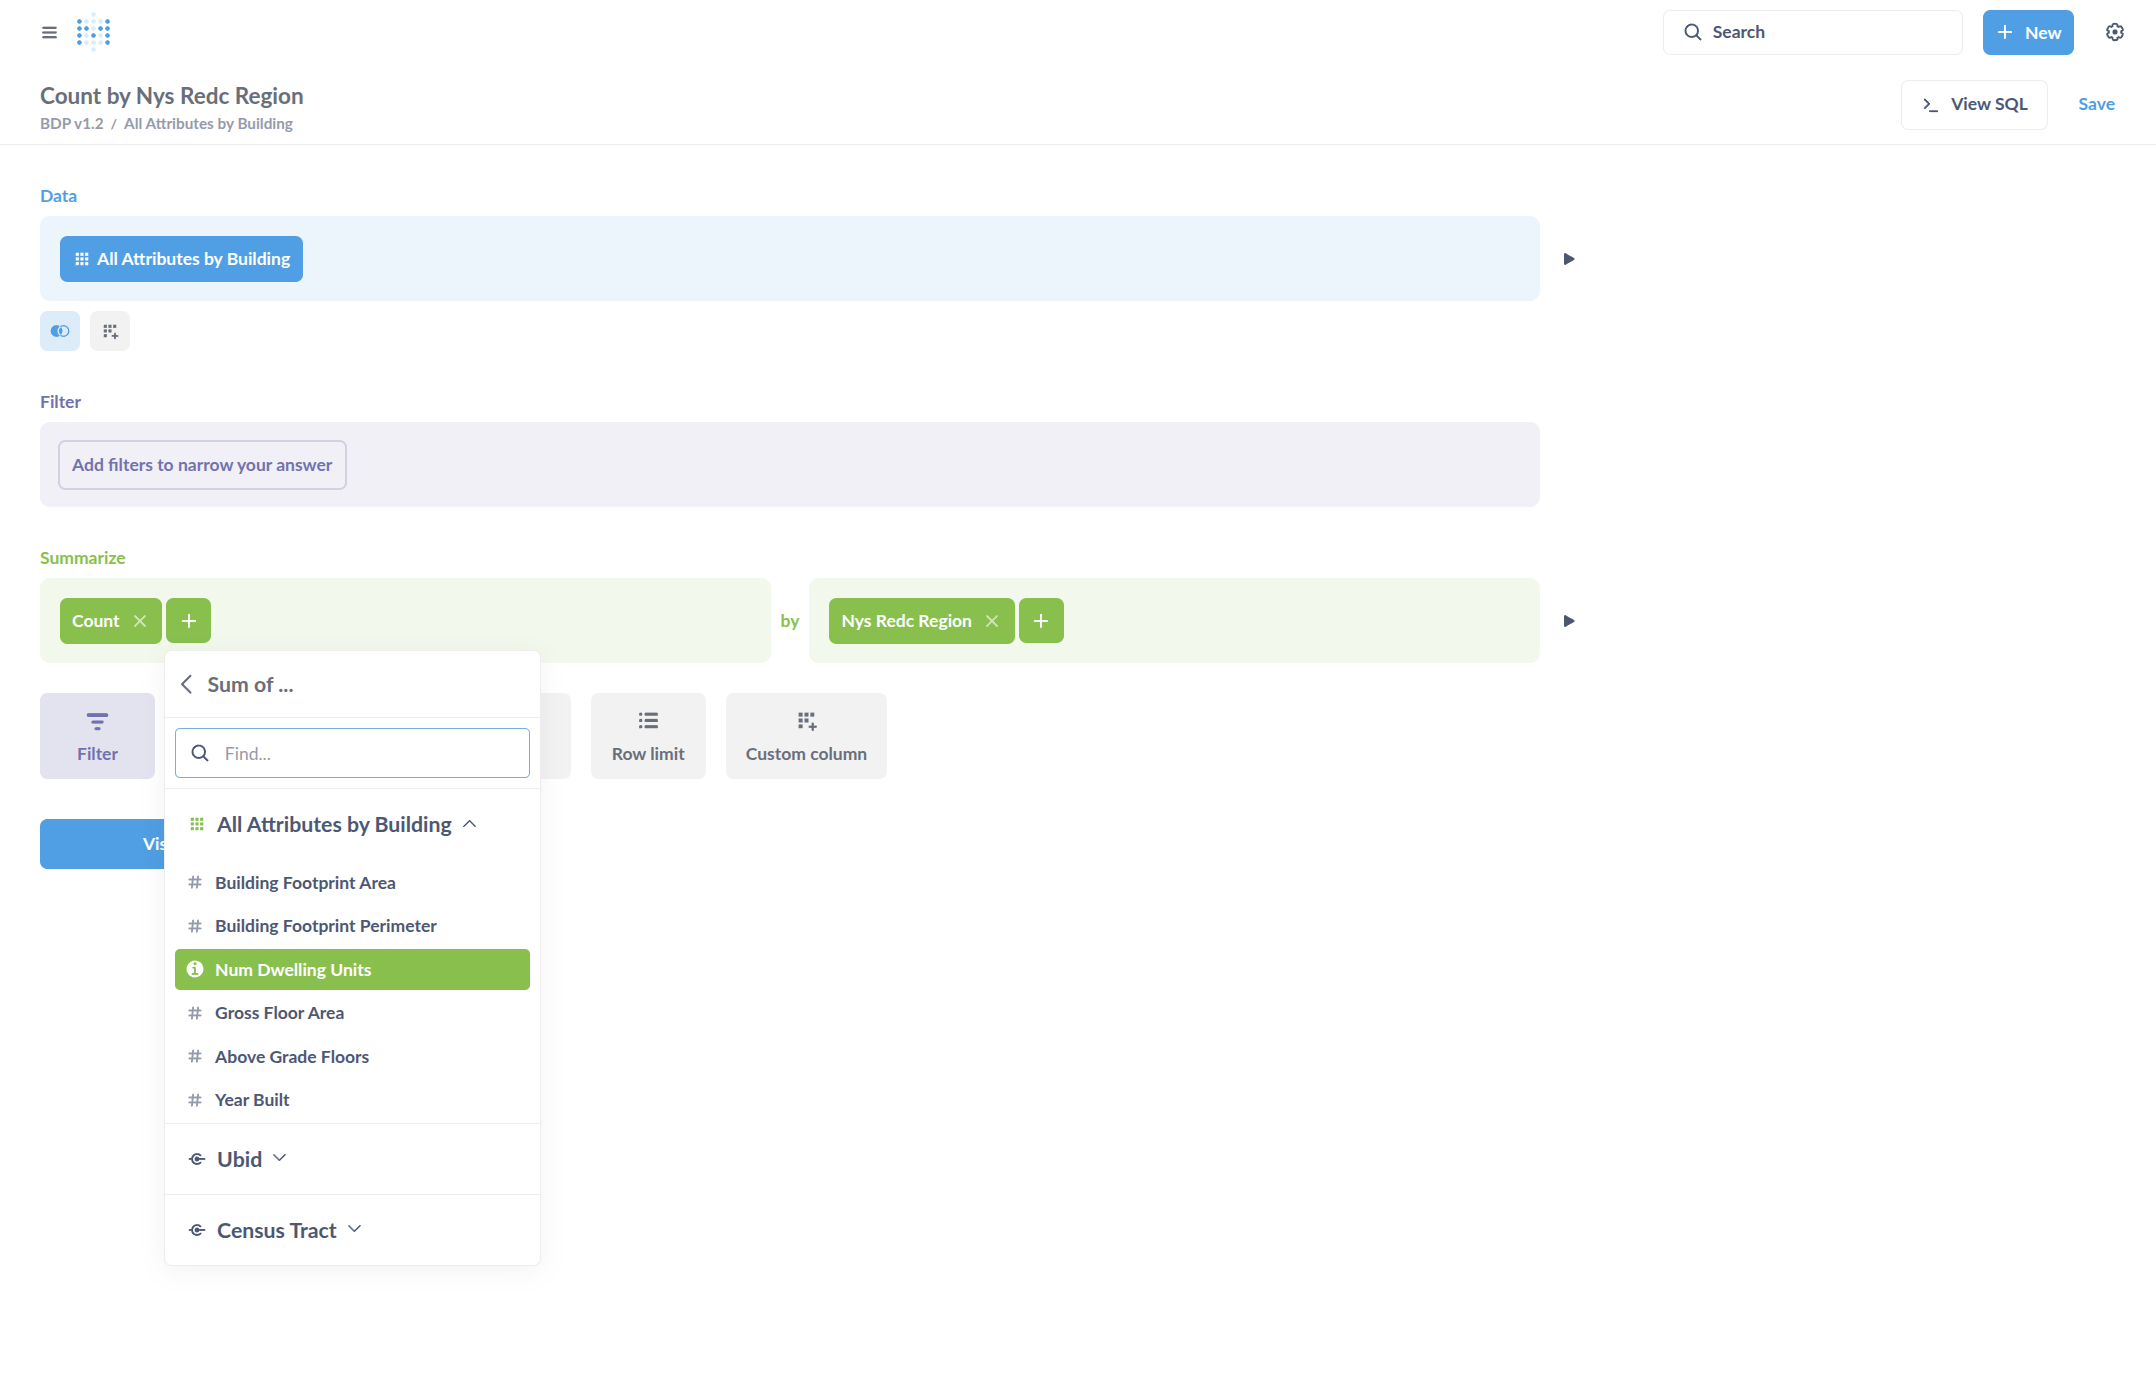
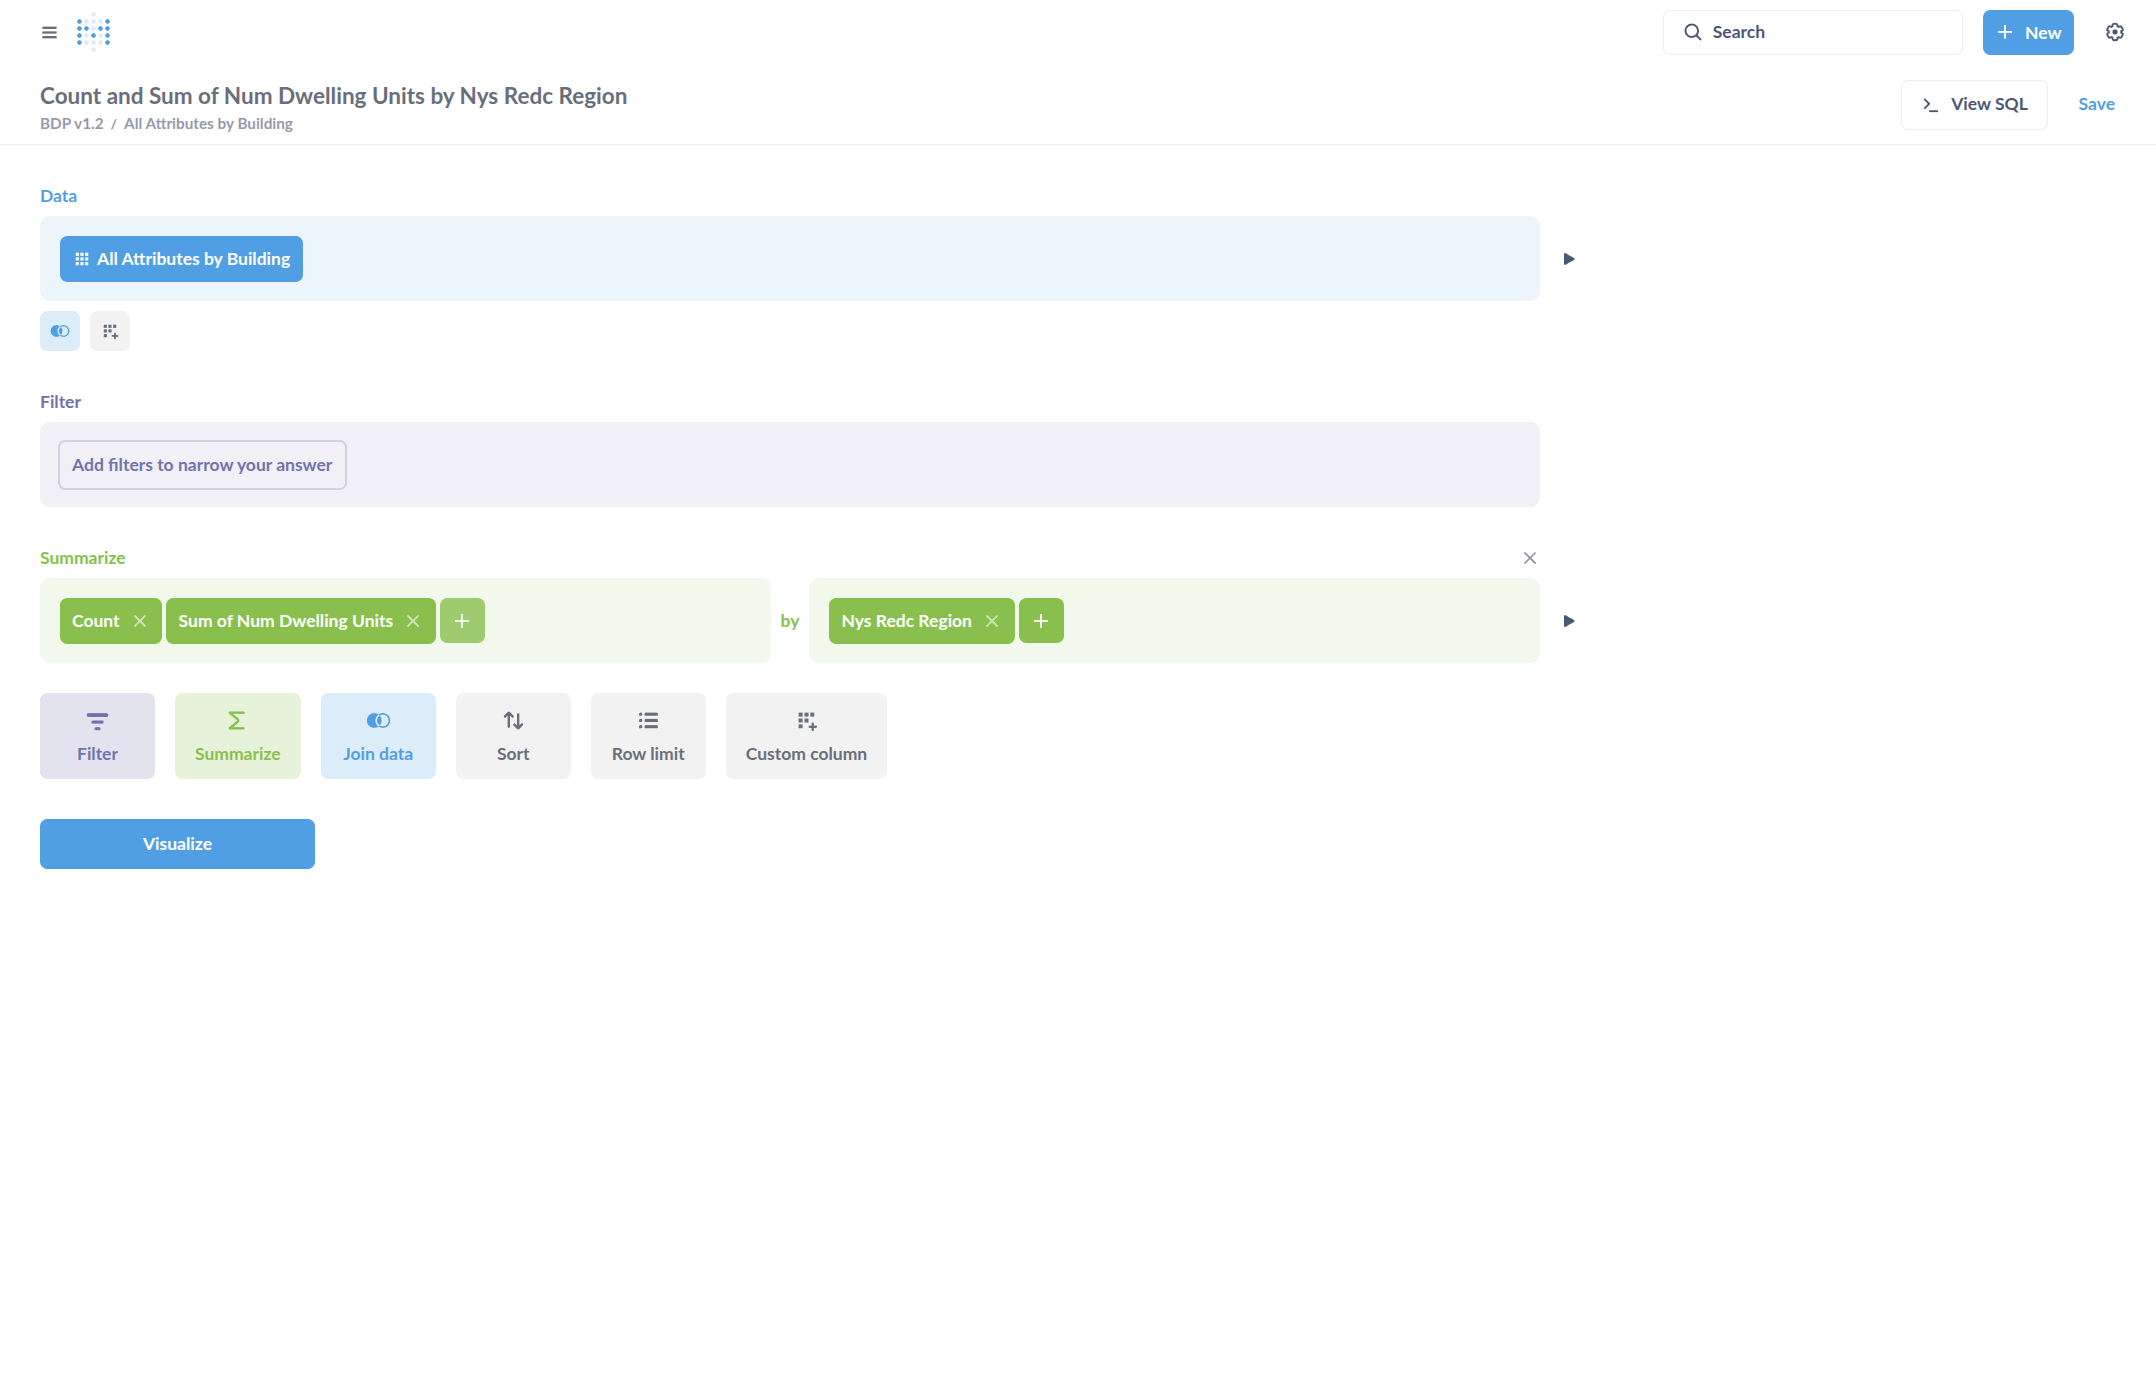
Sum of dwelling units is next.
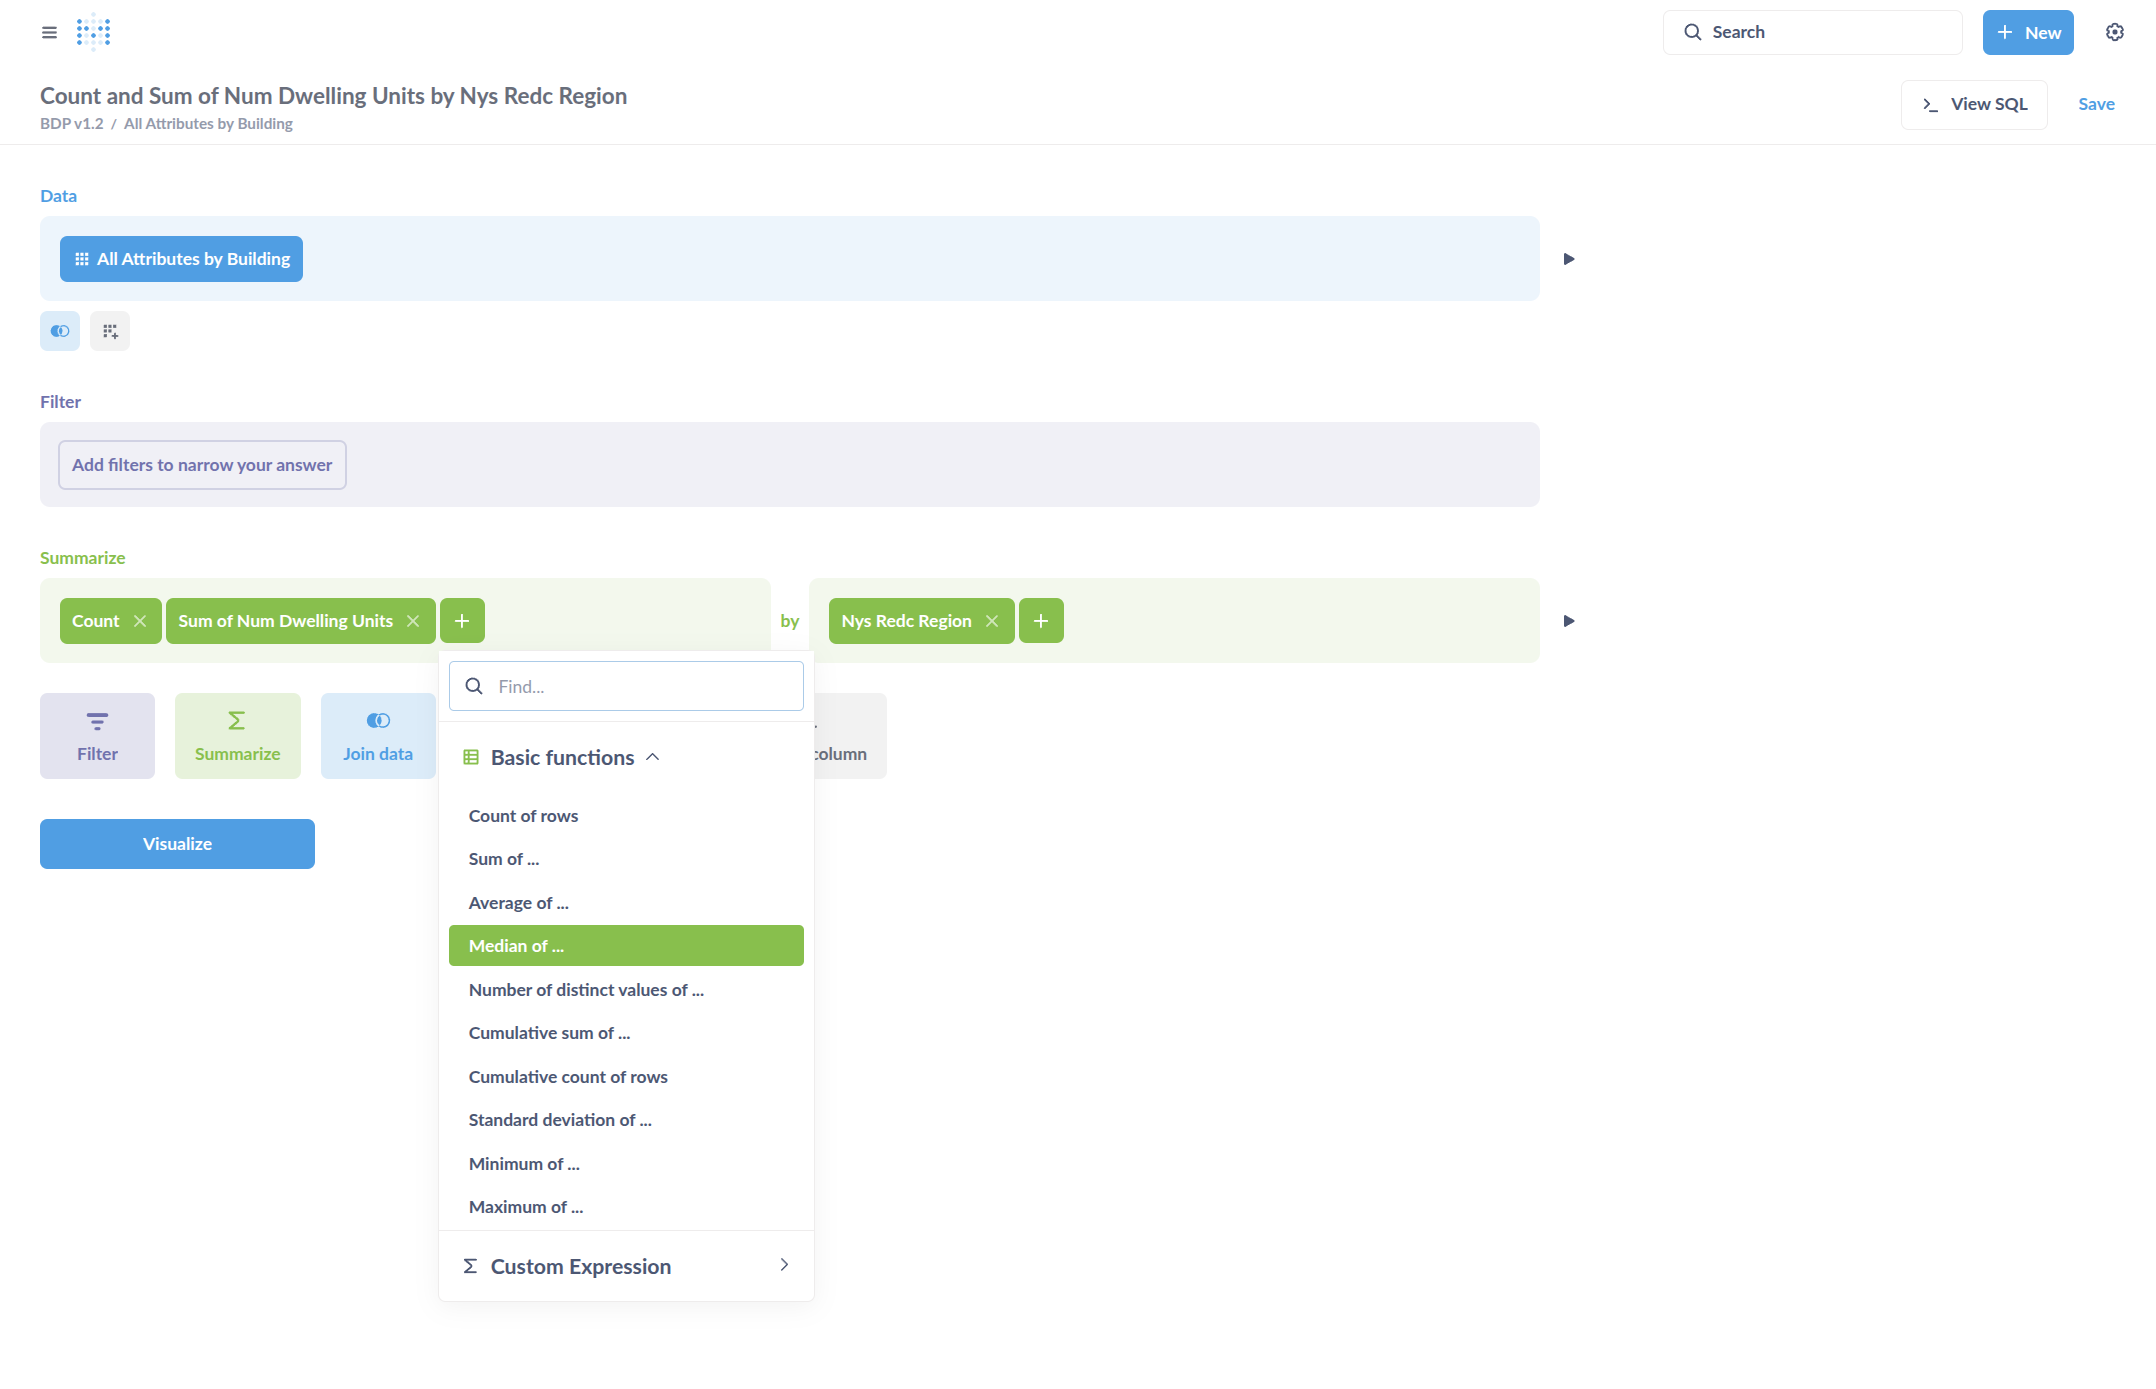
Median year built is next.
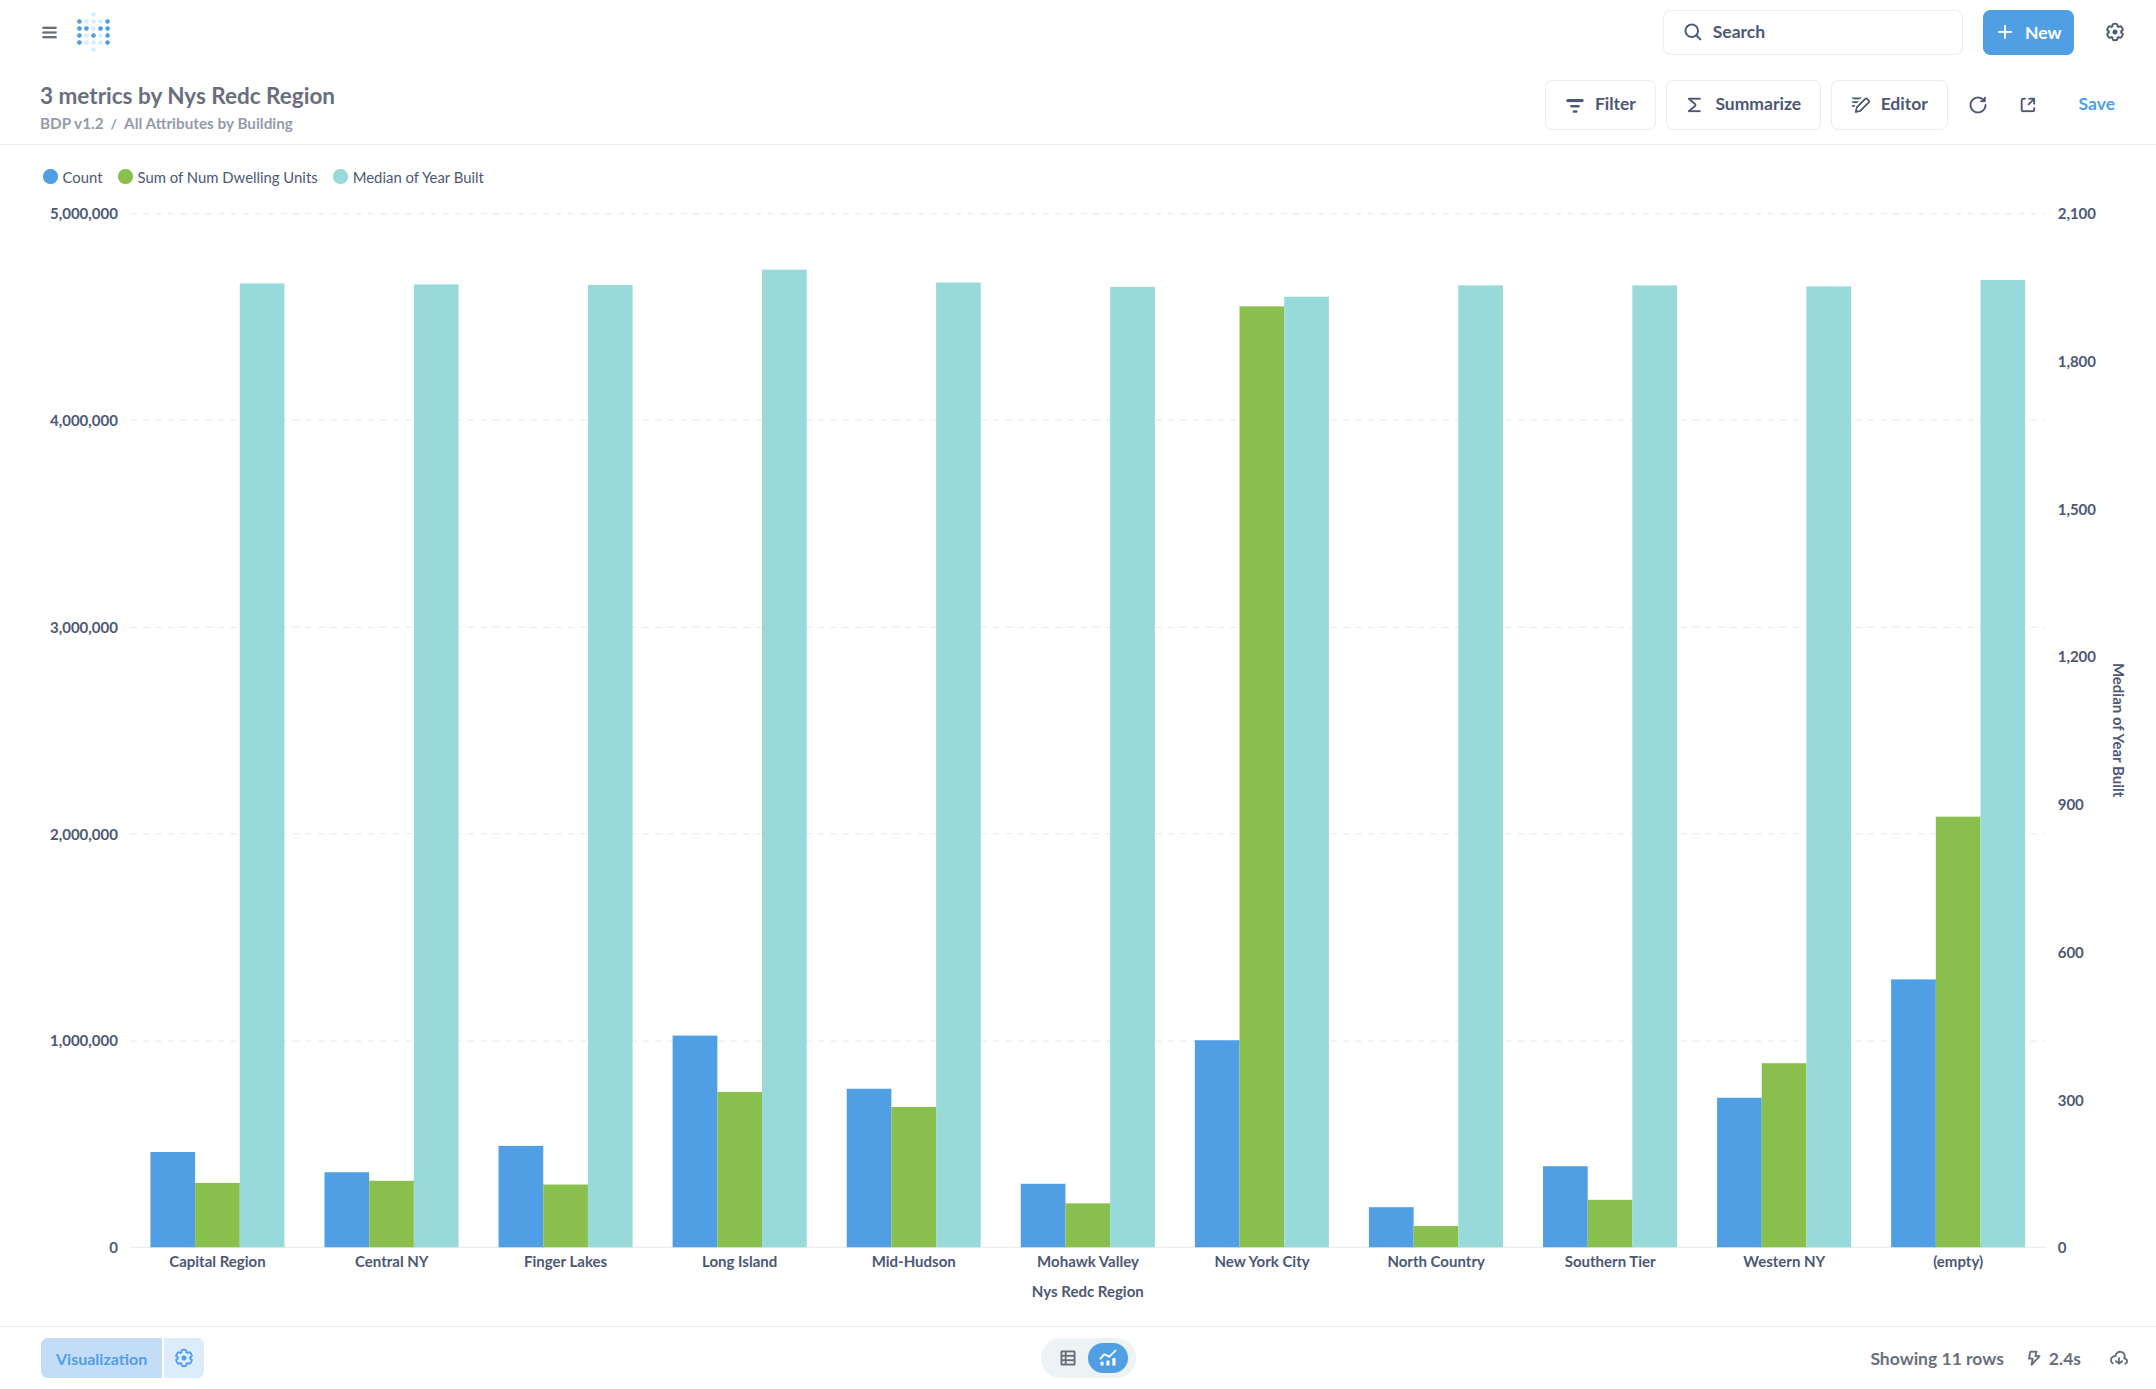
Select Visualize.
It may give a graph by default. Change this to a table by selecting "Visualization."
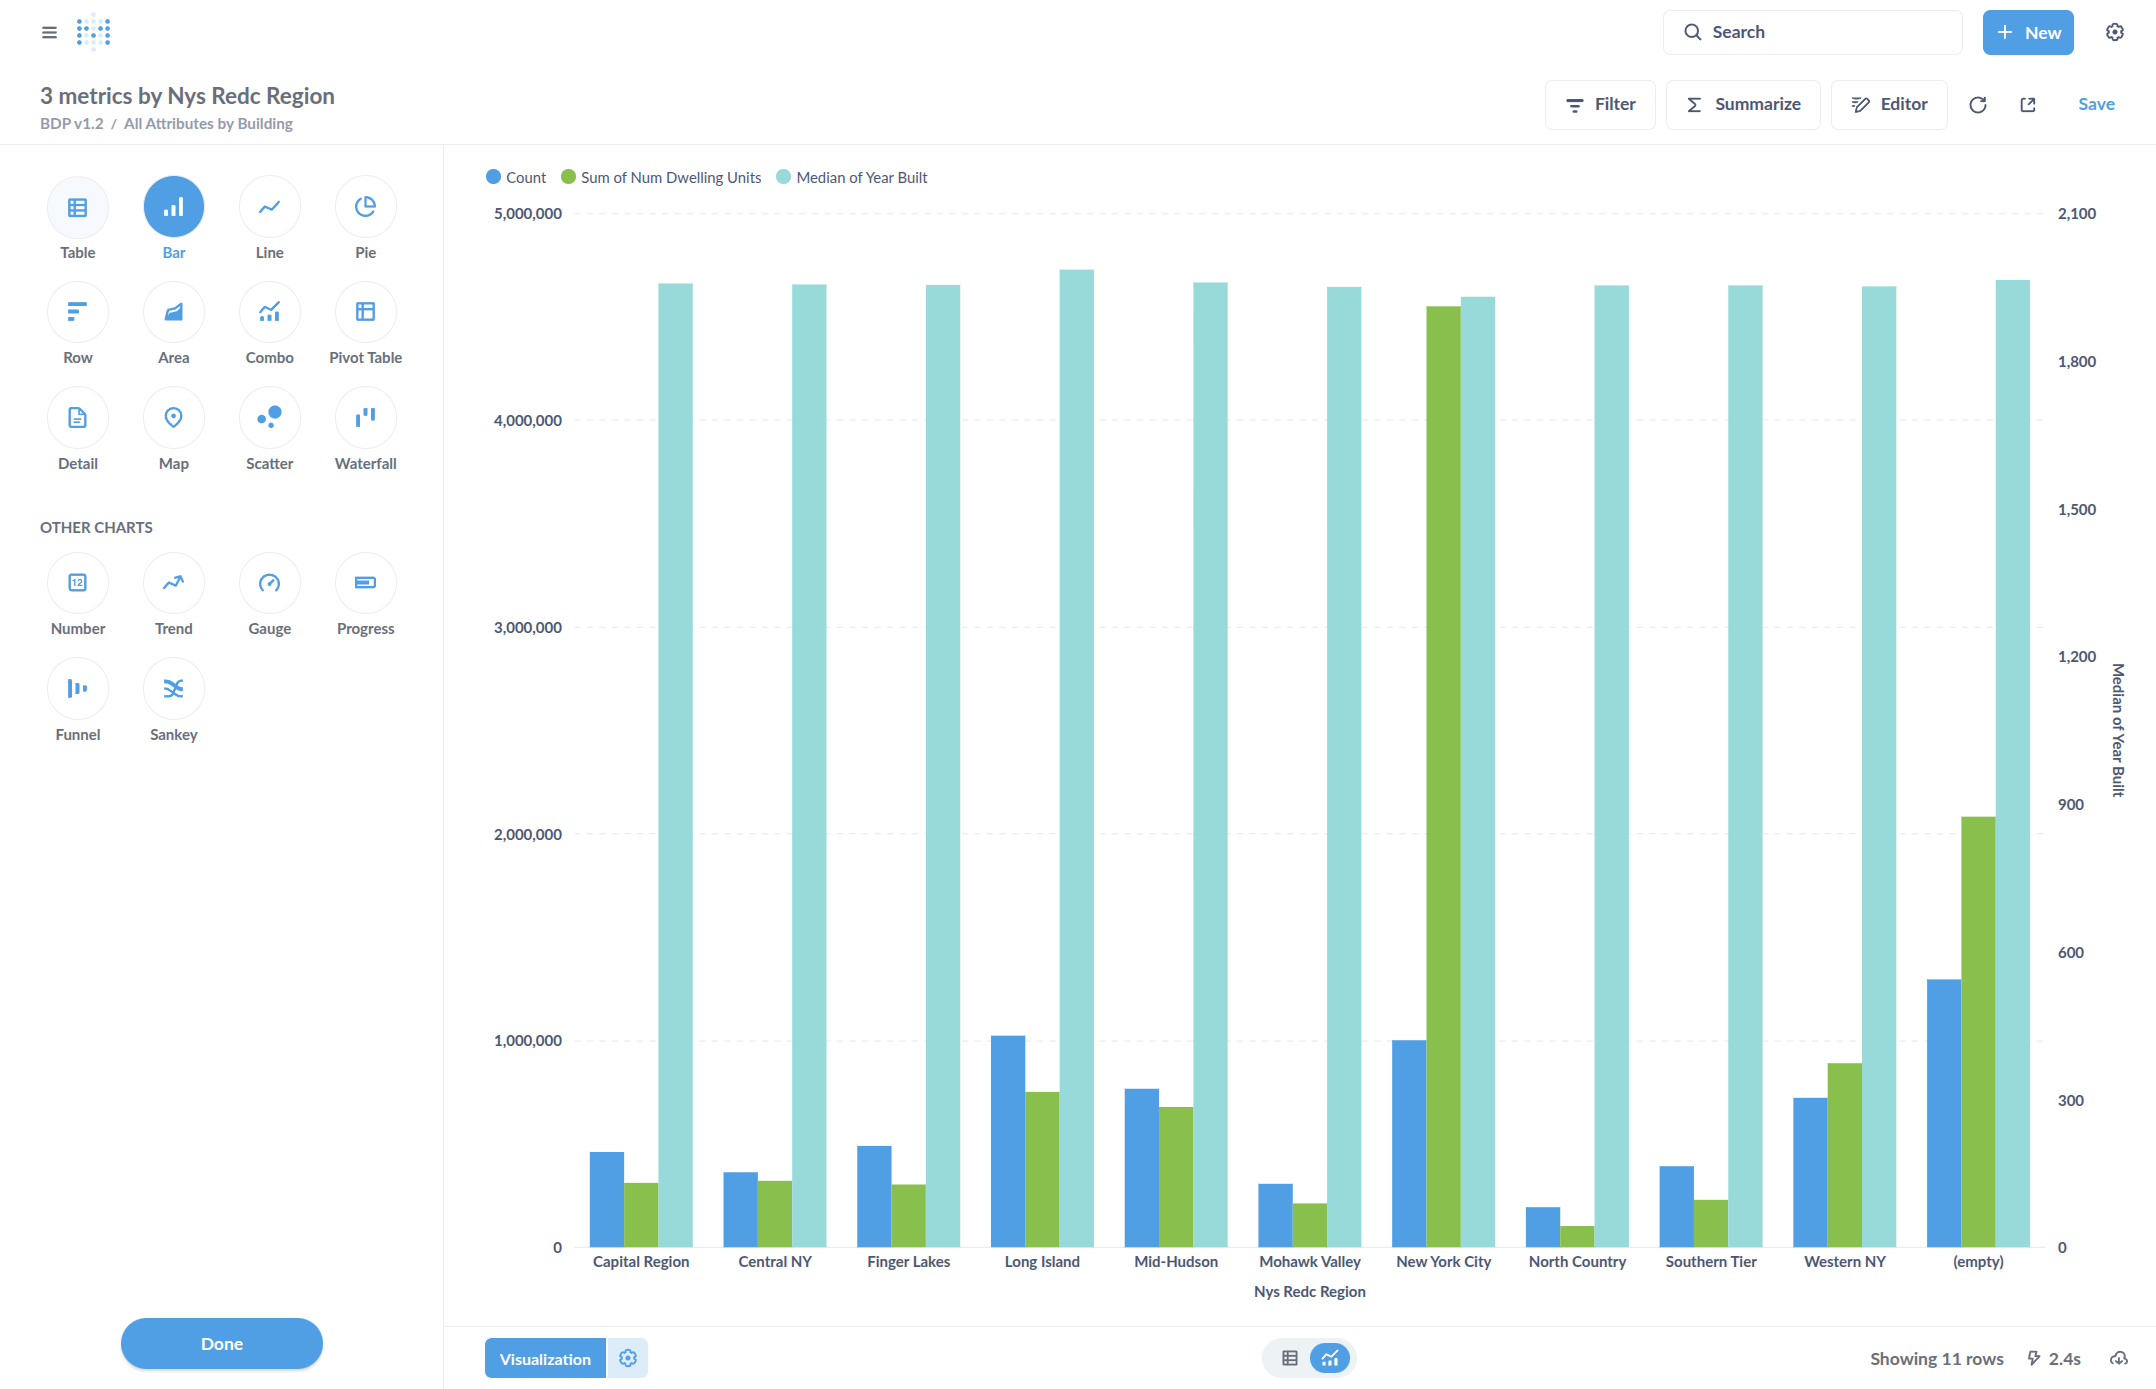
Click Done.
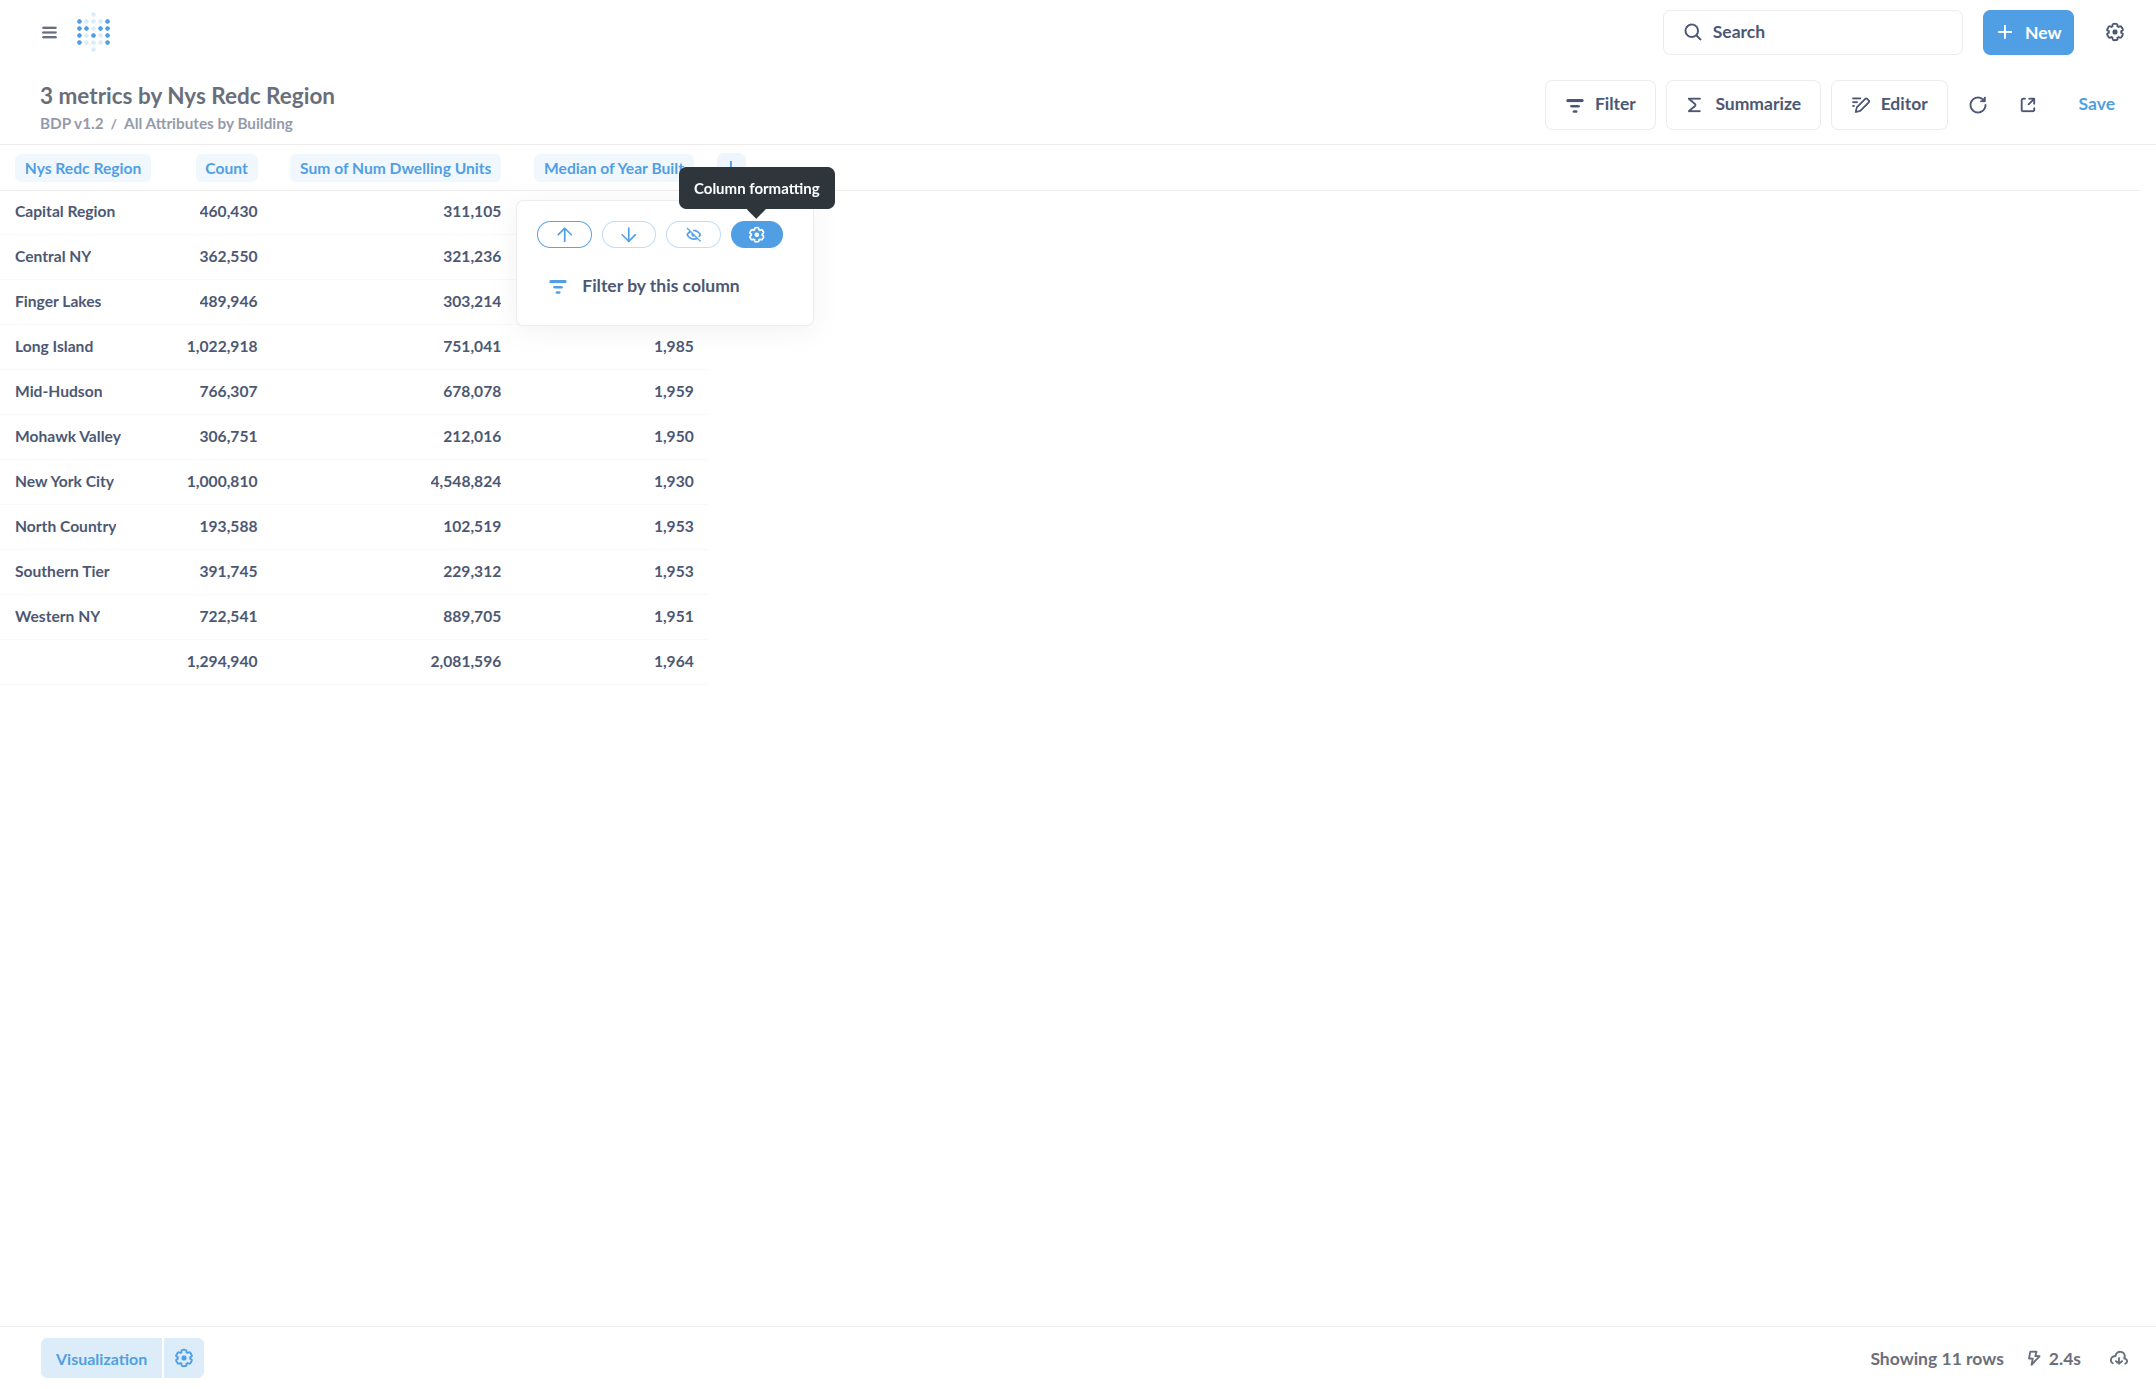
Format some of these numbers, such as median year built.
Click Column Formatting. For Separator Style, select one without commas to properly format the numbers as years.
Change column names as desired.
Save this table by clicking "Save" in the upper right. Or, download this table by clicking "Download" in the lower right.