How to Create Dashboards in Power BI Desktop: Step-by-Step Guide
Learn how to create dashboards in Power BI Desktop with this easy step-by-step tutorial. Discover how to add pages, insert text boxes, format titles, and display KPIs using card visuals.
In this guide, we'll learn how to create a dashboard in Power BI Desktop. We will start by making a new page, renaming it, and adding a title using a text box. Then, we will add card visuals to display key performance indicators such as net profit percent, sales, target, gross margin percentage, net profit, and gross profit.
We will also look at how to format these elements for better clarity and presentation.
Let's get started
In this session, we will learn how to create dashboards. Okay. First, we need to create a new page. Click the plus icon to create a new page. When I click the plus icon, I can create a new page.
Here, I open a new page. Then I will rename the page. How do I rename it?
Double-click on this, then rename the page to Overview.

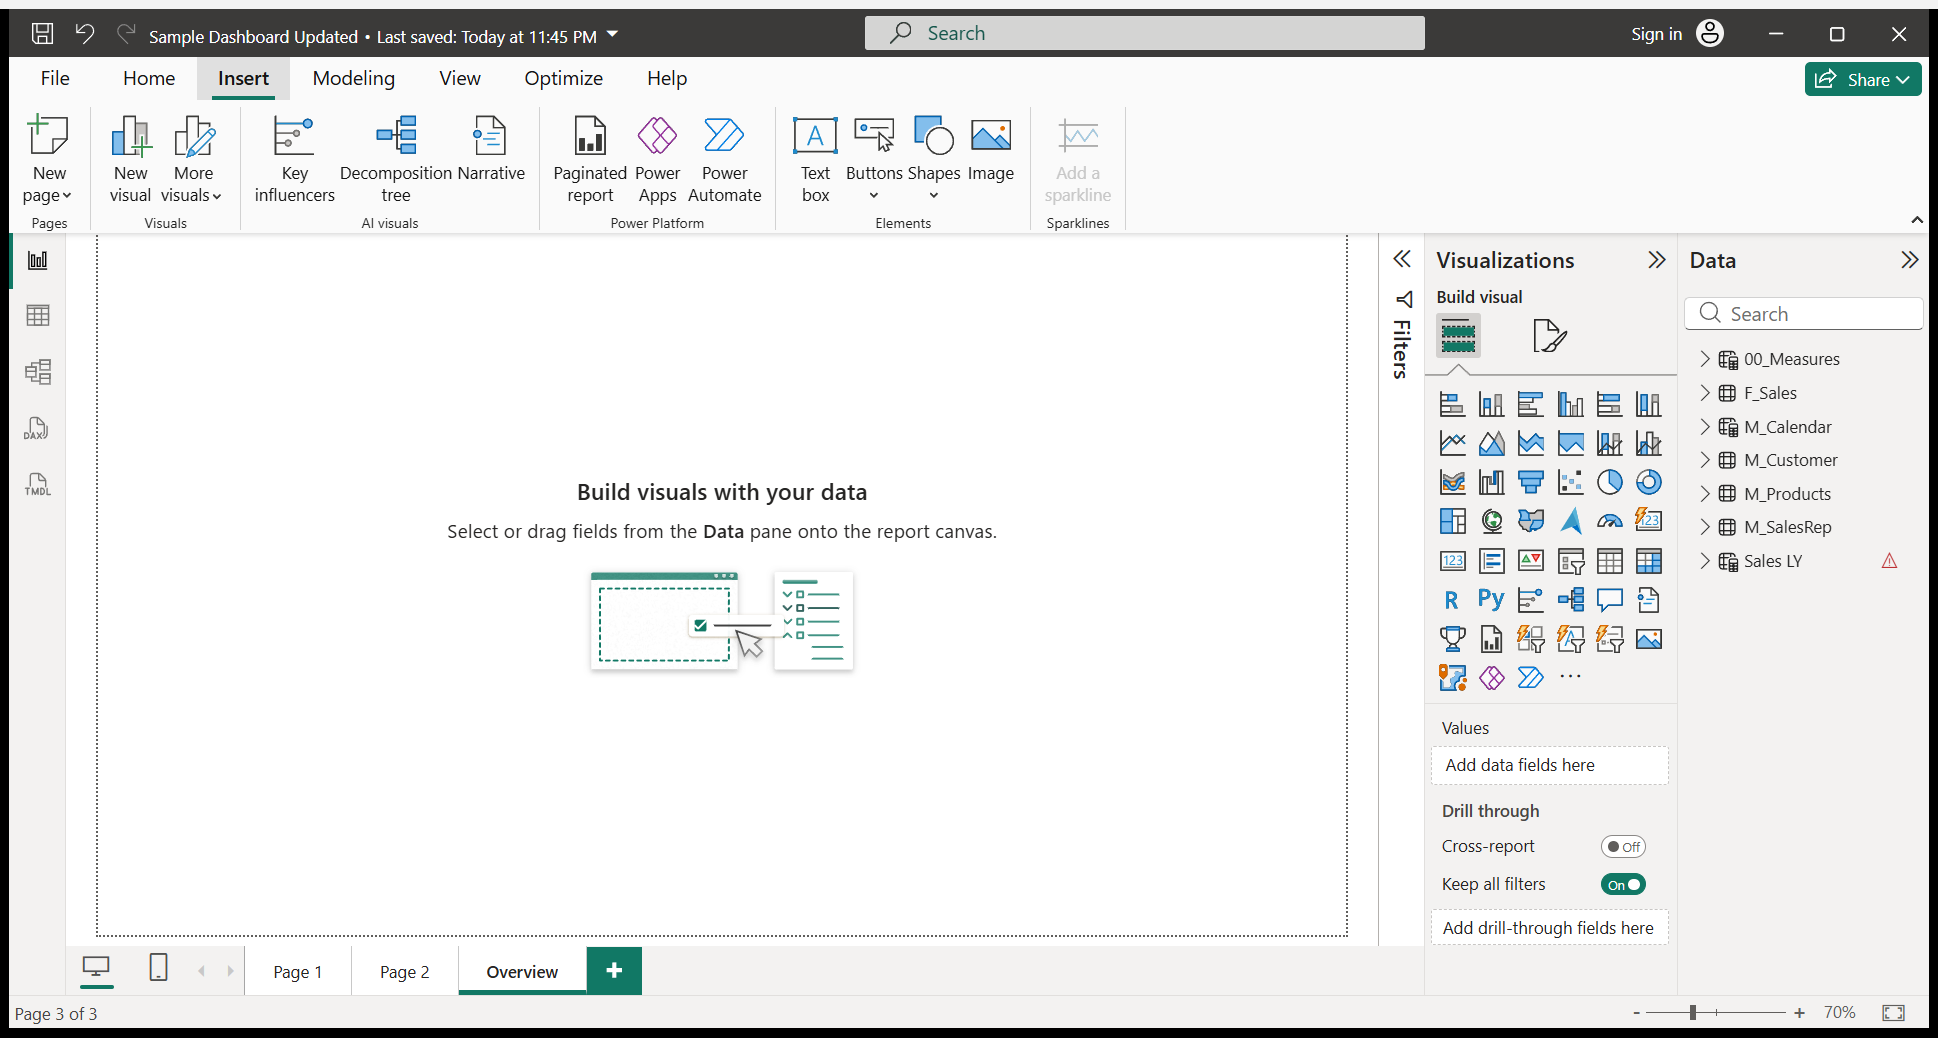
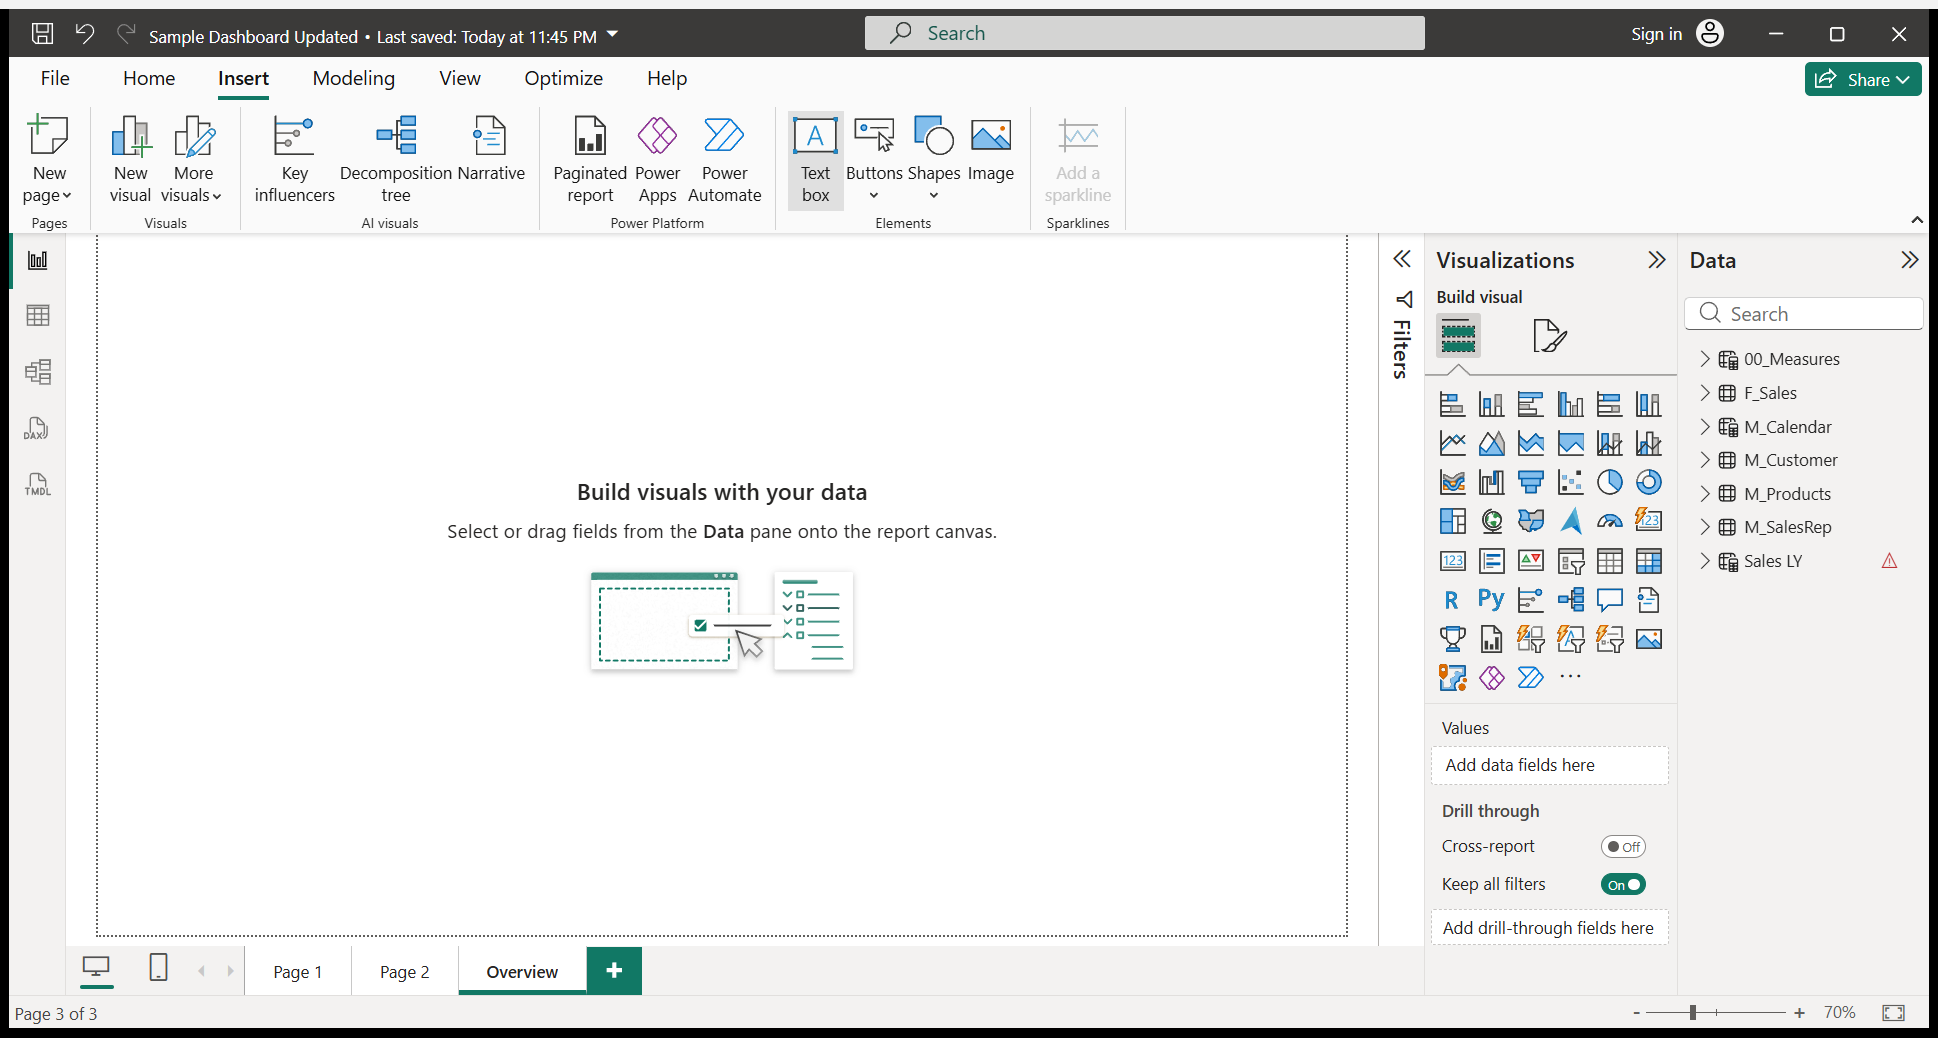
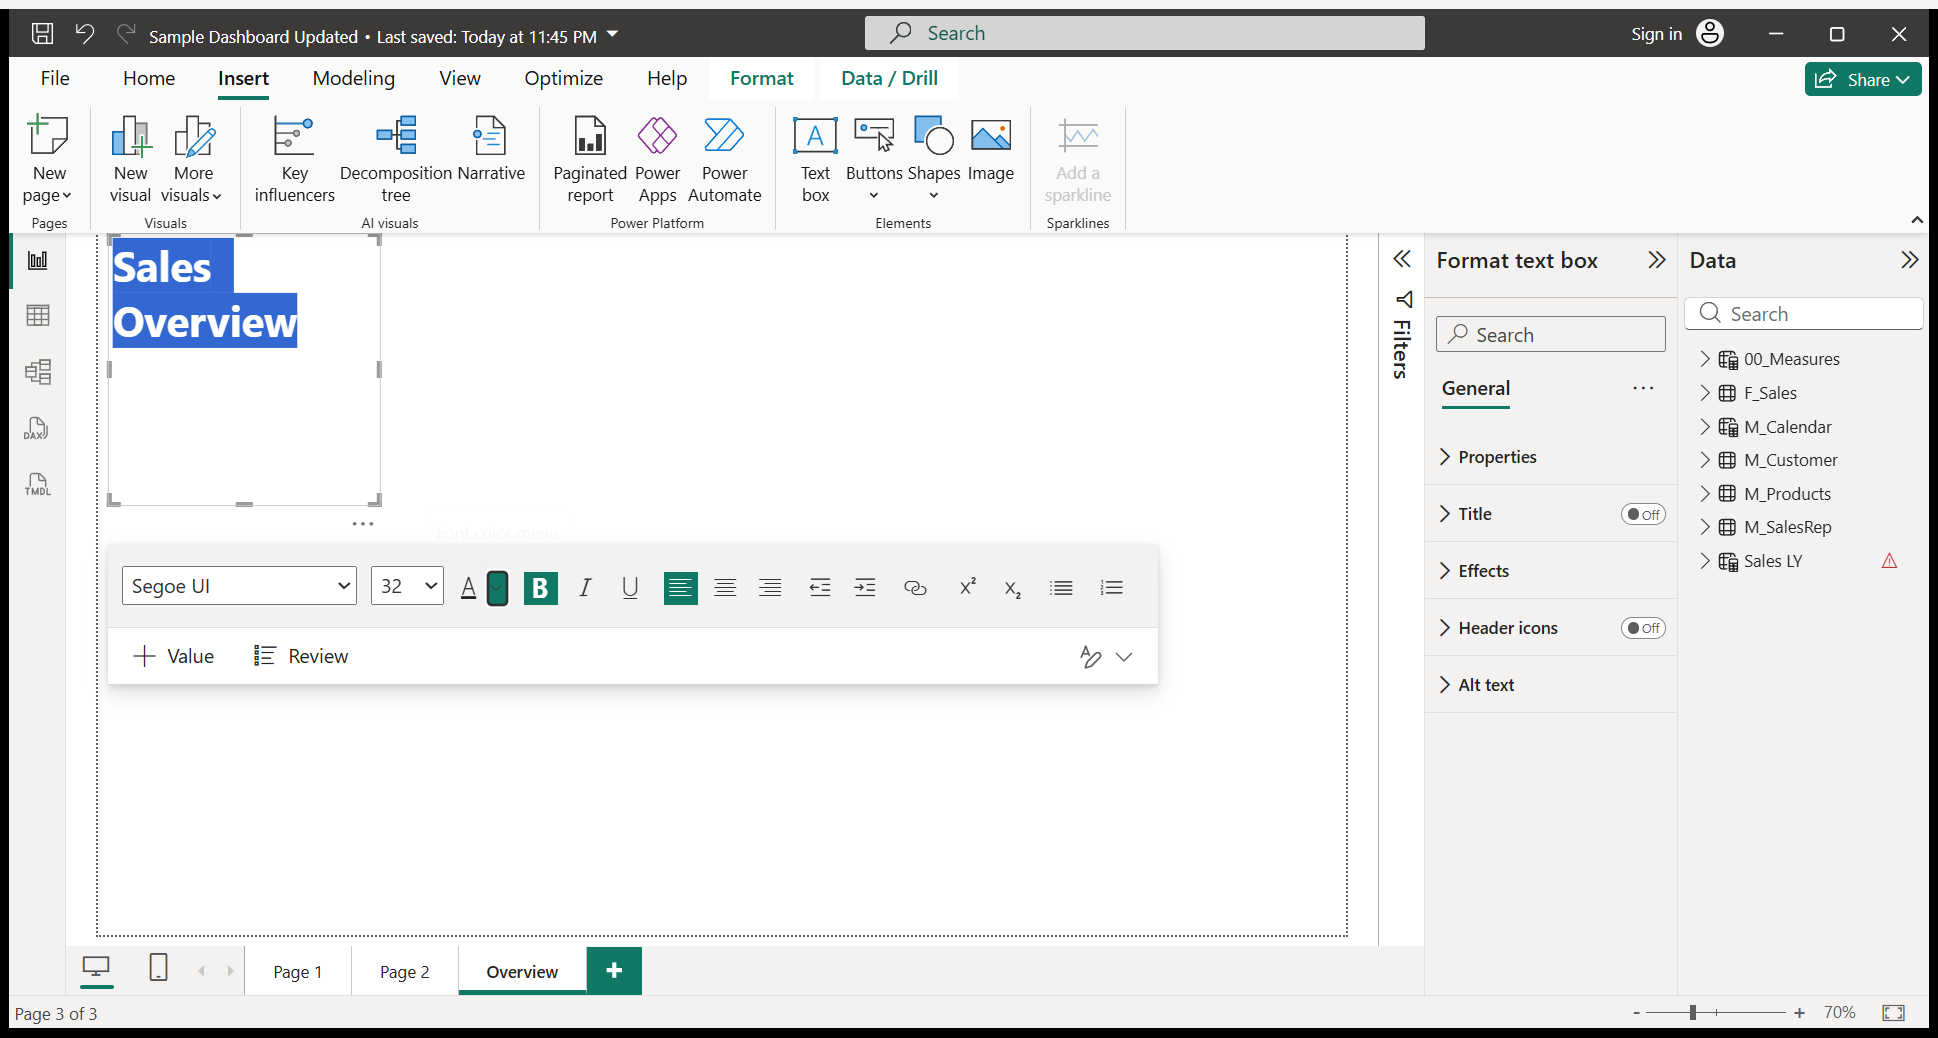
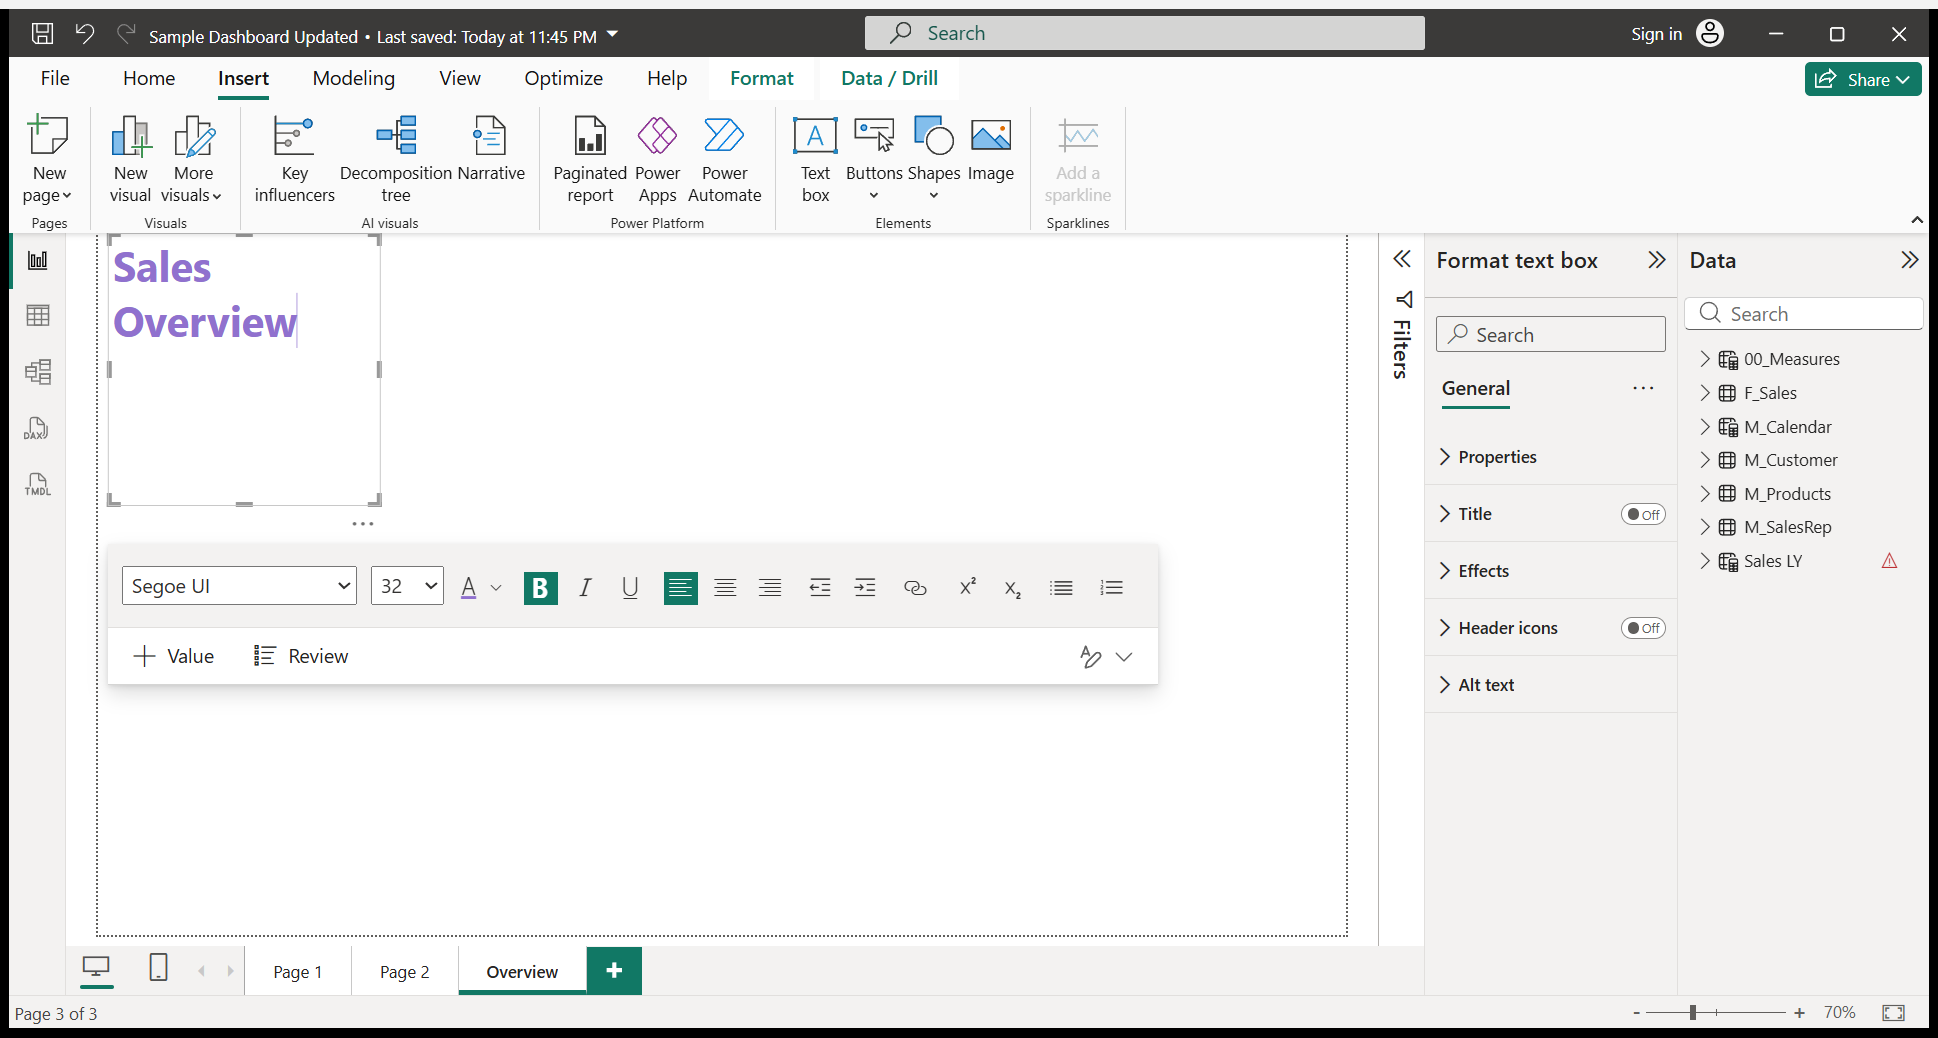
Here’s how I created a new page in Power BI Desktop. Now, we need to add a text box to this page. We need to add a title to this page. Go to the Insert tab. Under Insert, select the text box option.
I will click on the text box so it appears. Then, I will write whatever I want the title to be.
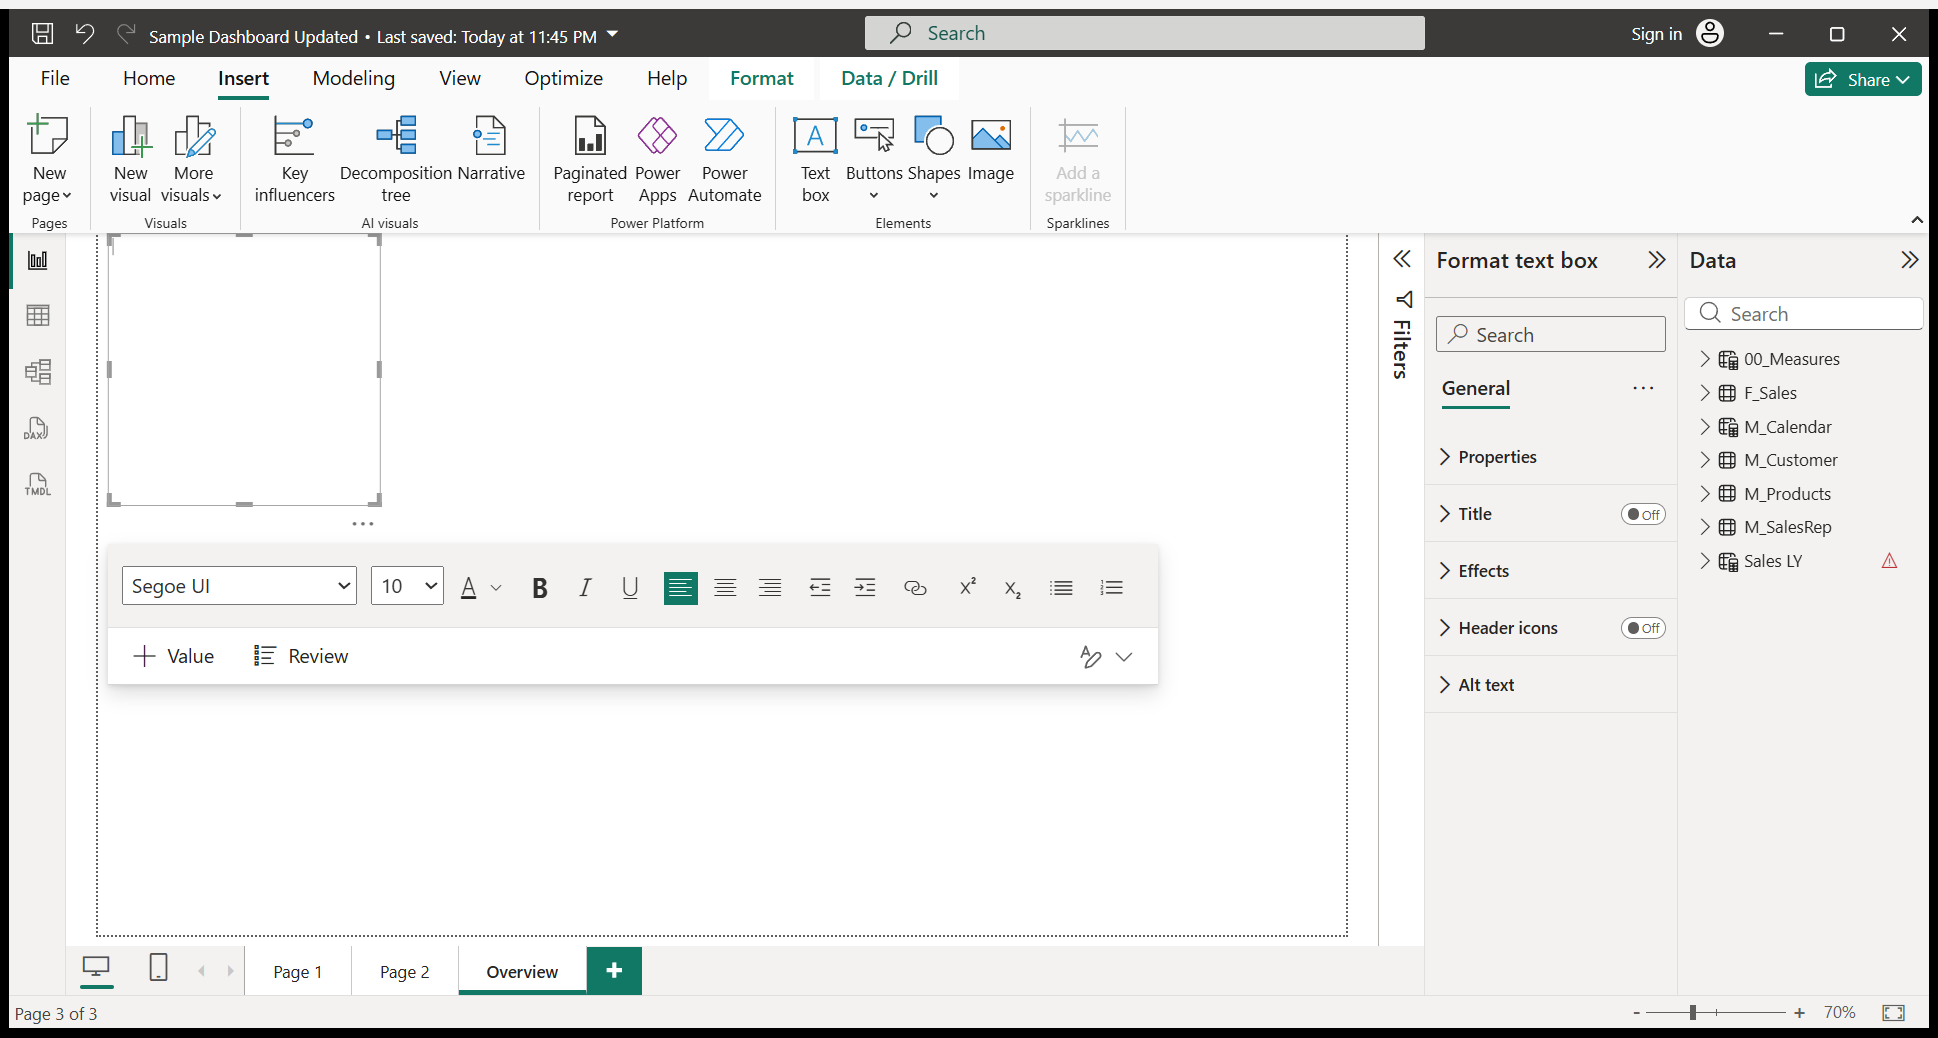
We will write a Sales Overview. I will do some formatting.

I will select my text here.

I will increase the font size to 32 and make it bold.

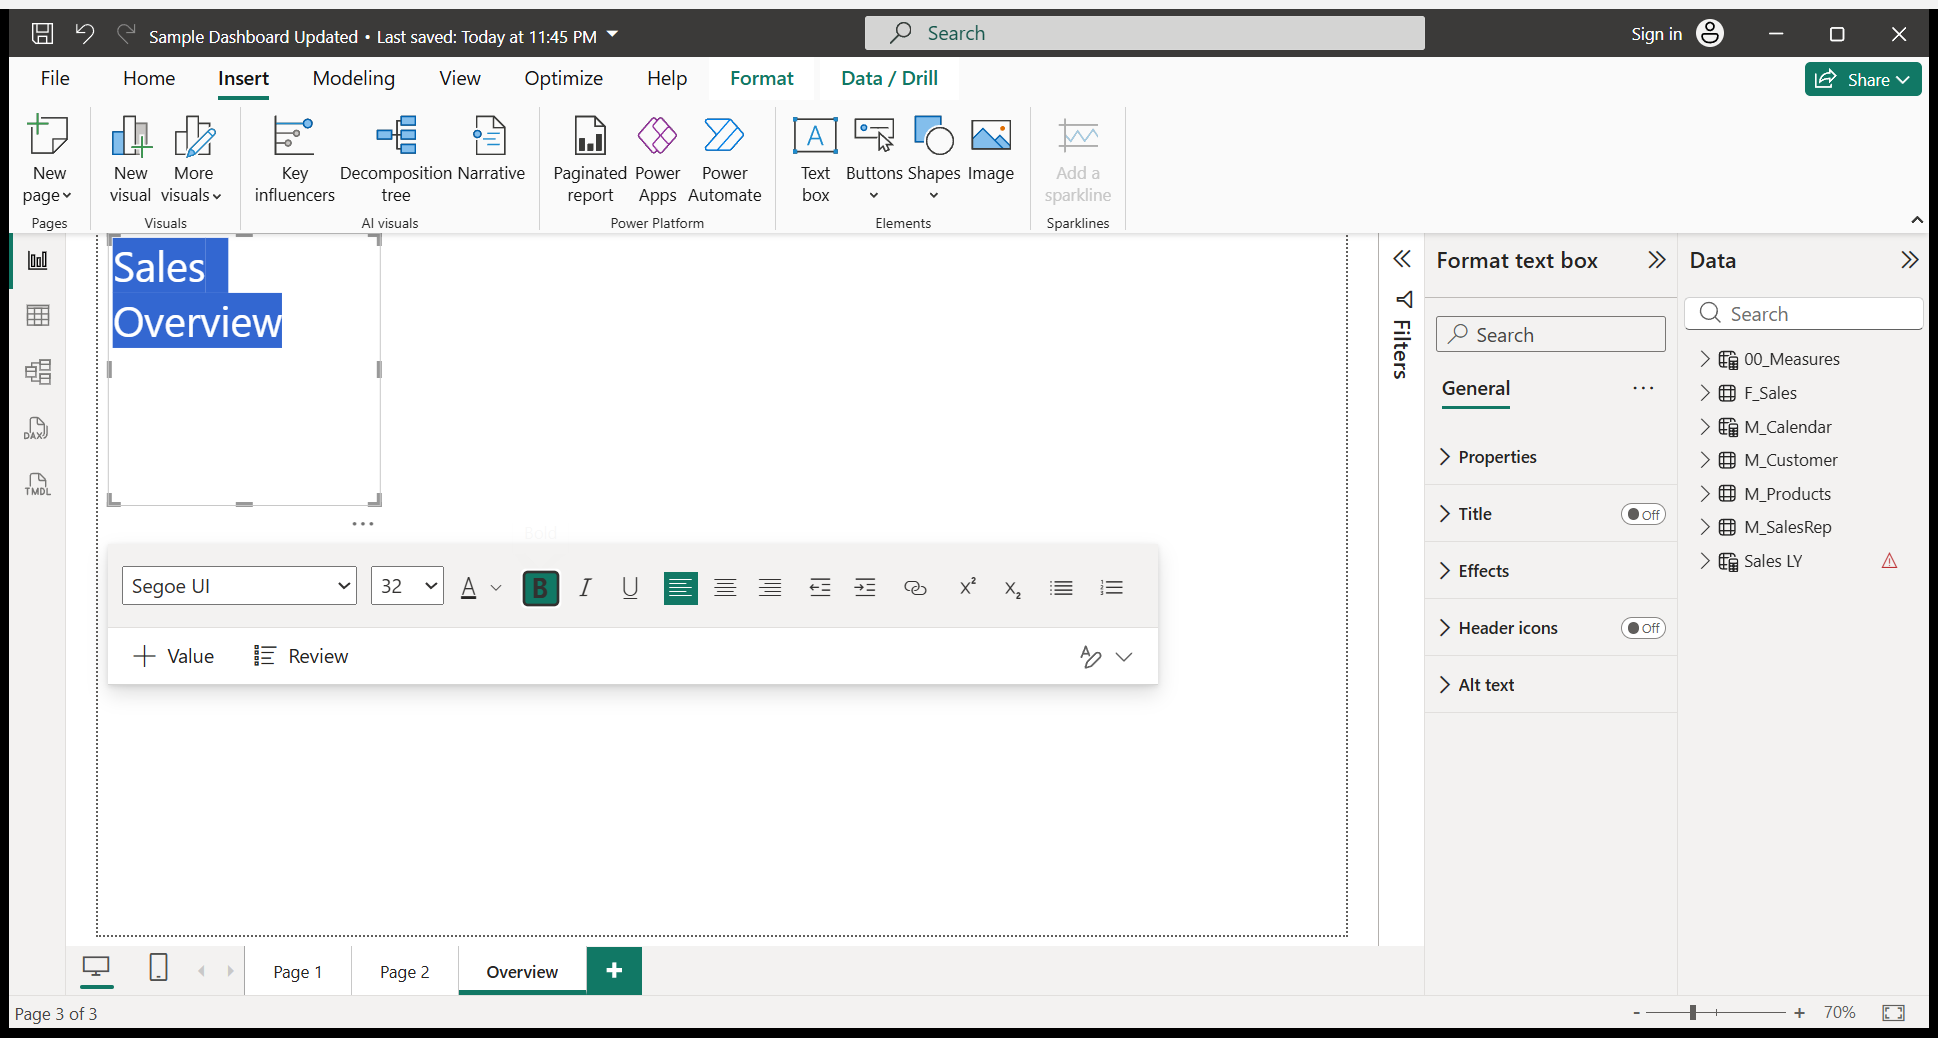
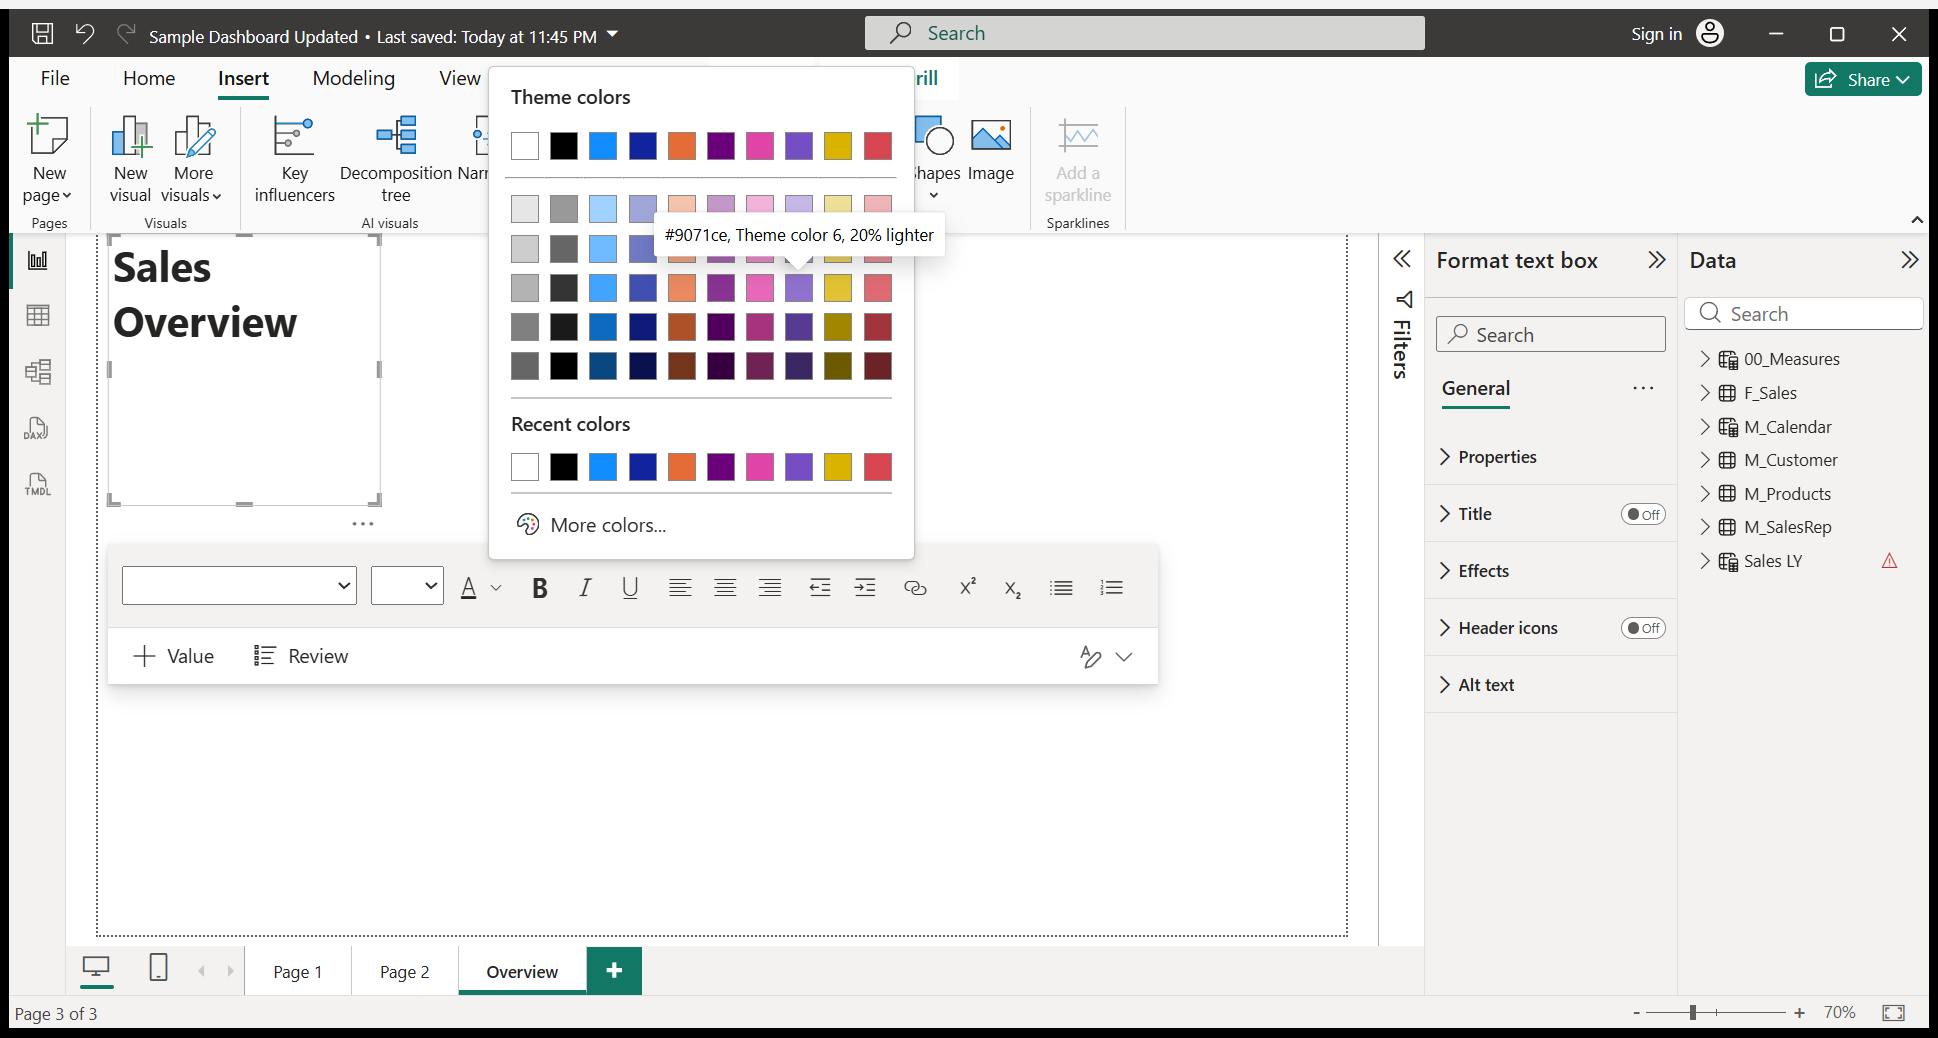
We will also change its color to purple.
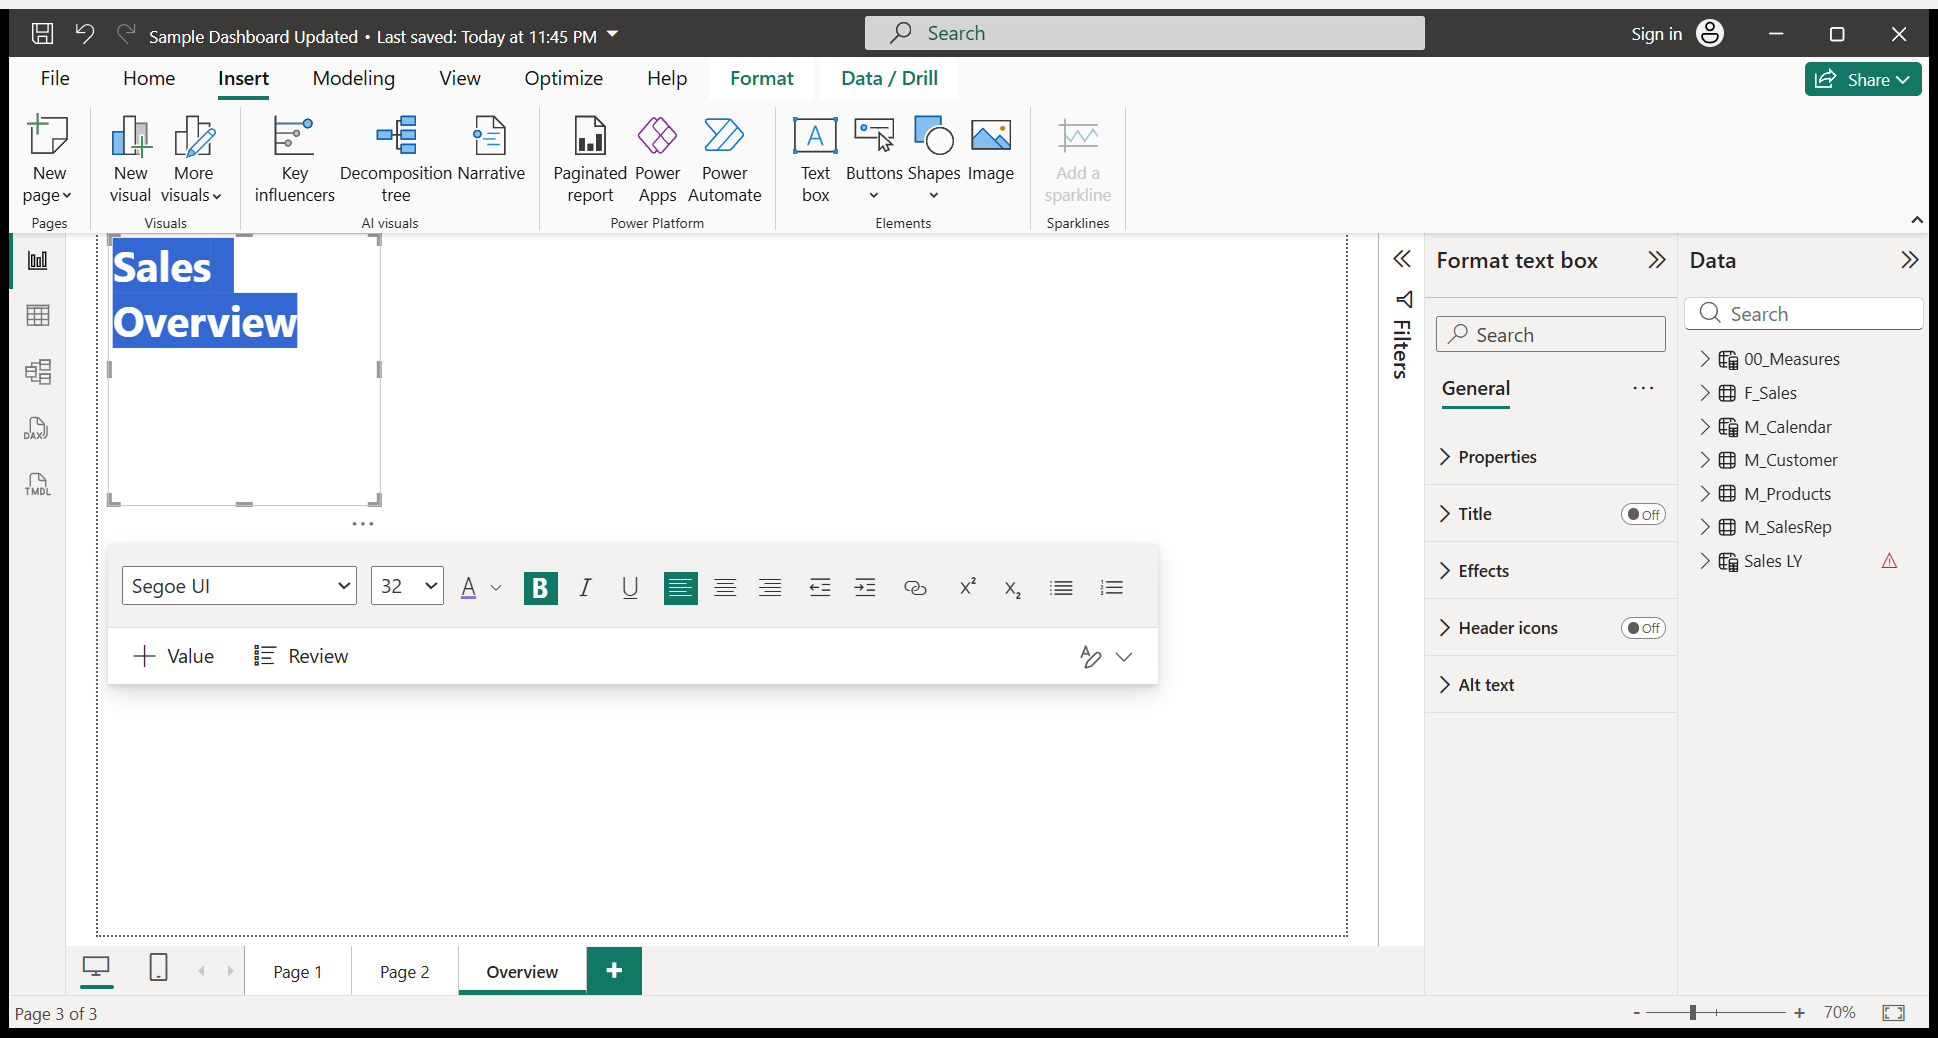
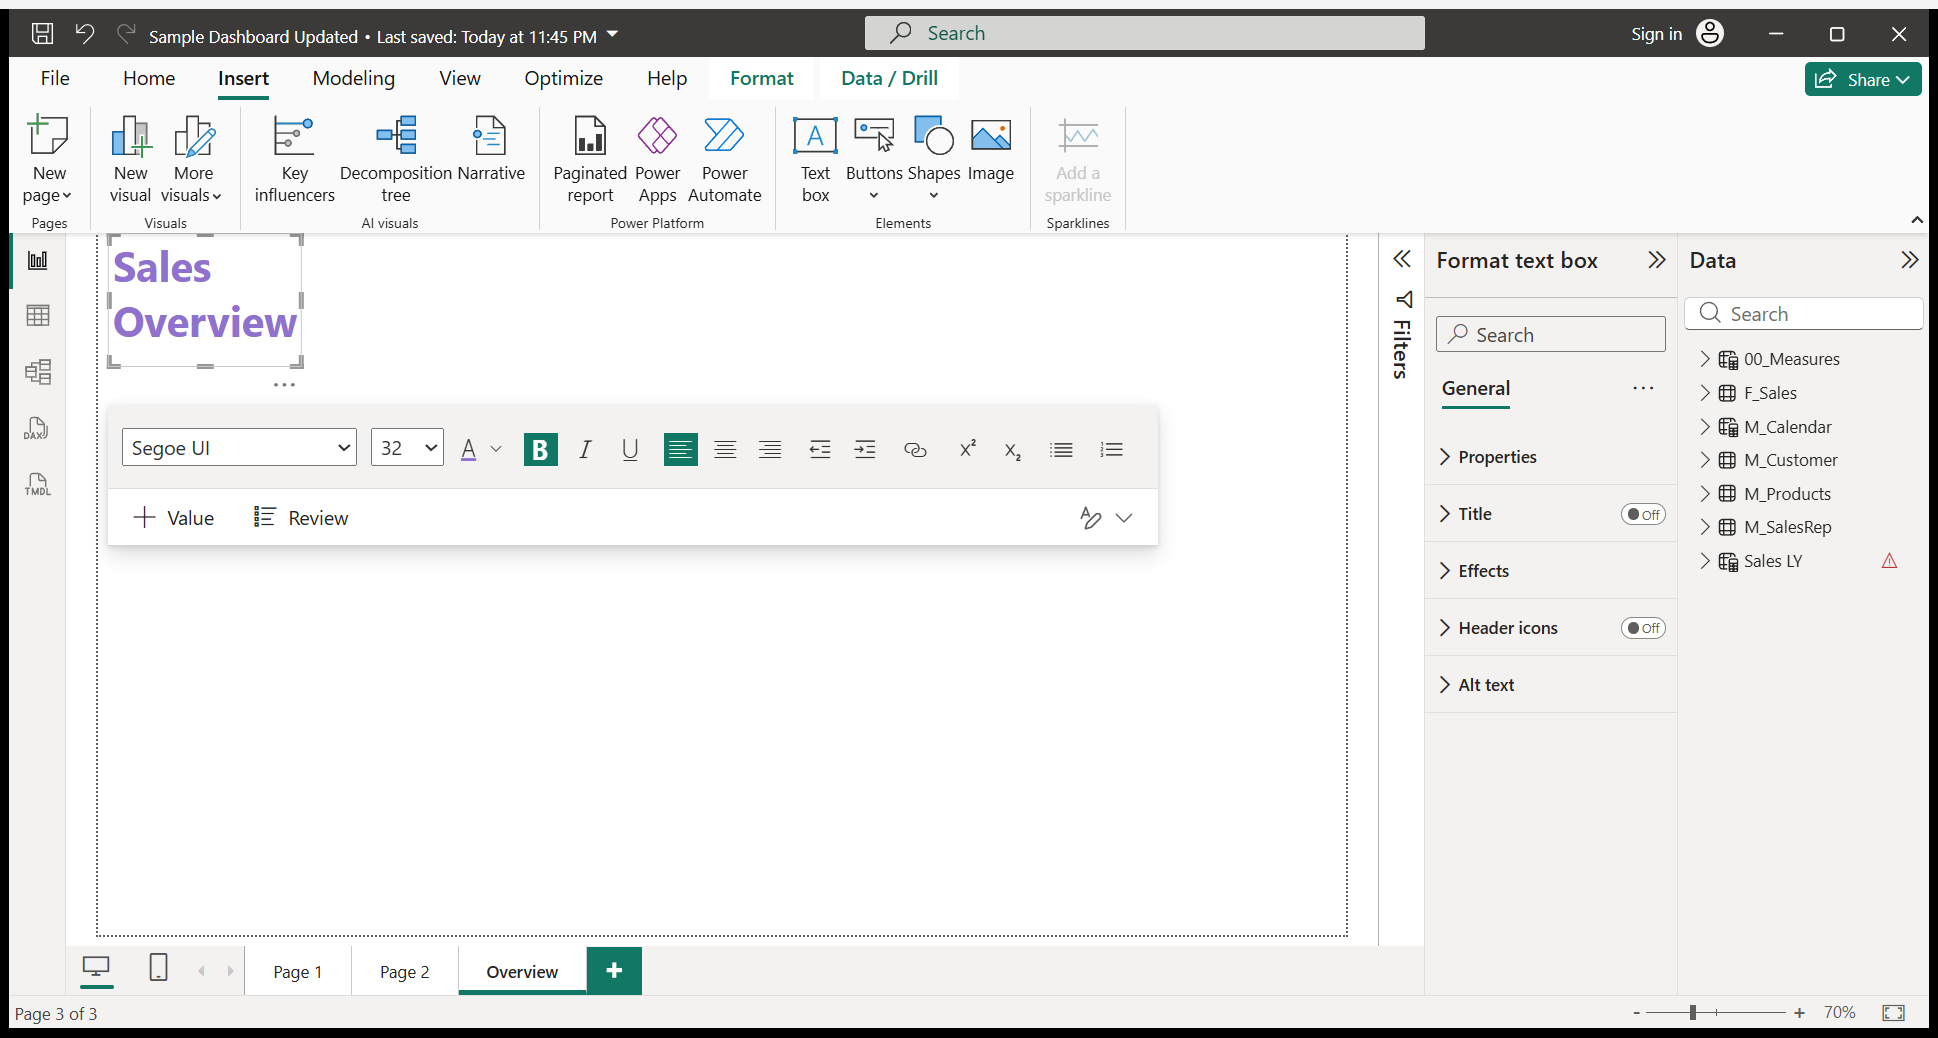
I have finished creating the title for my page overview.
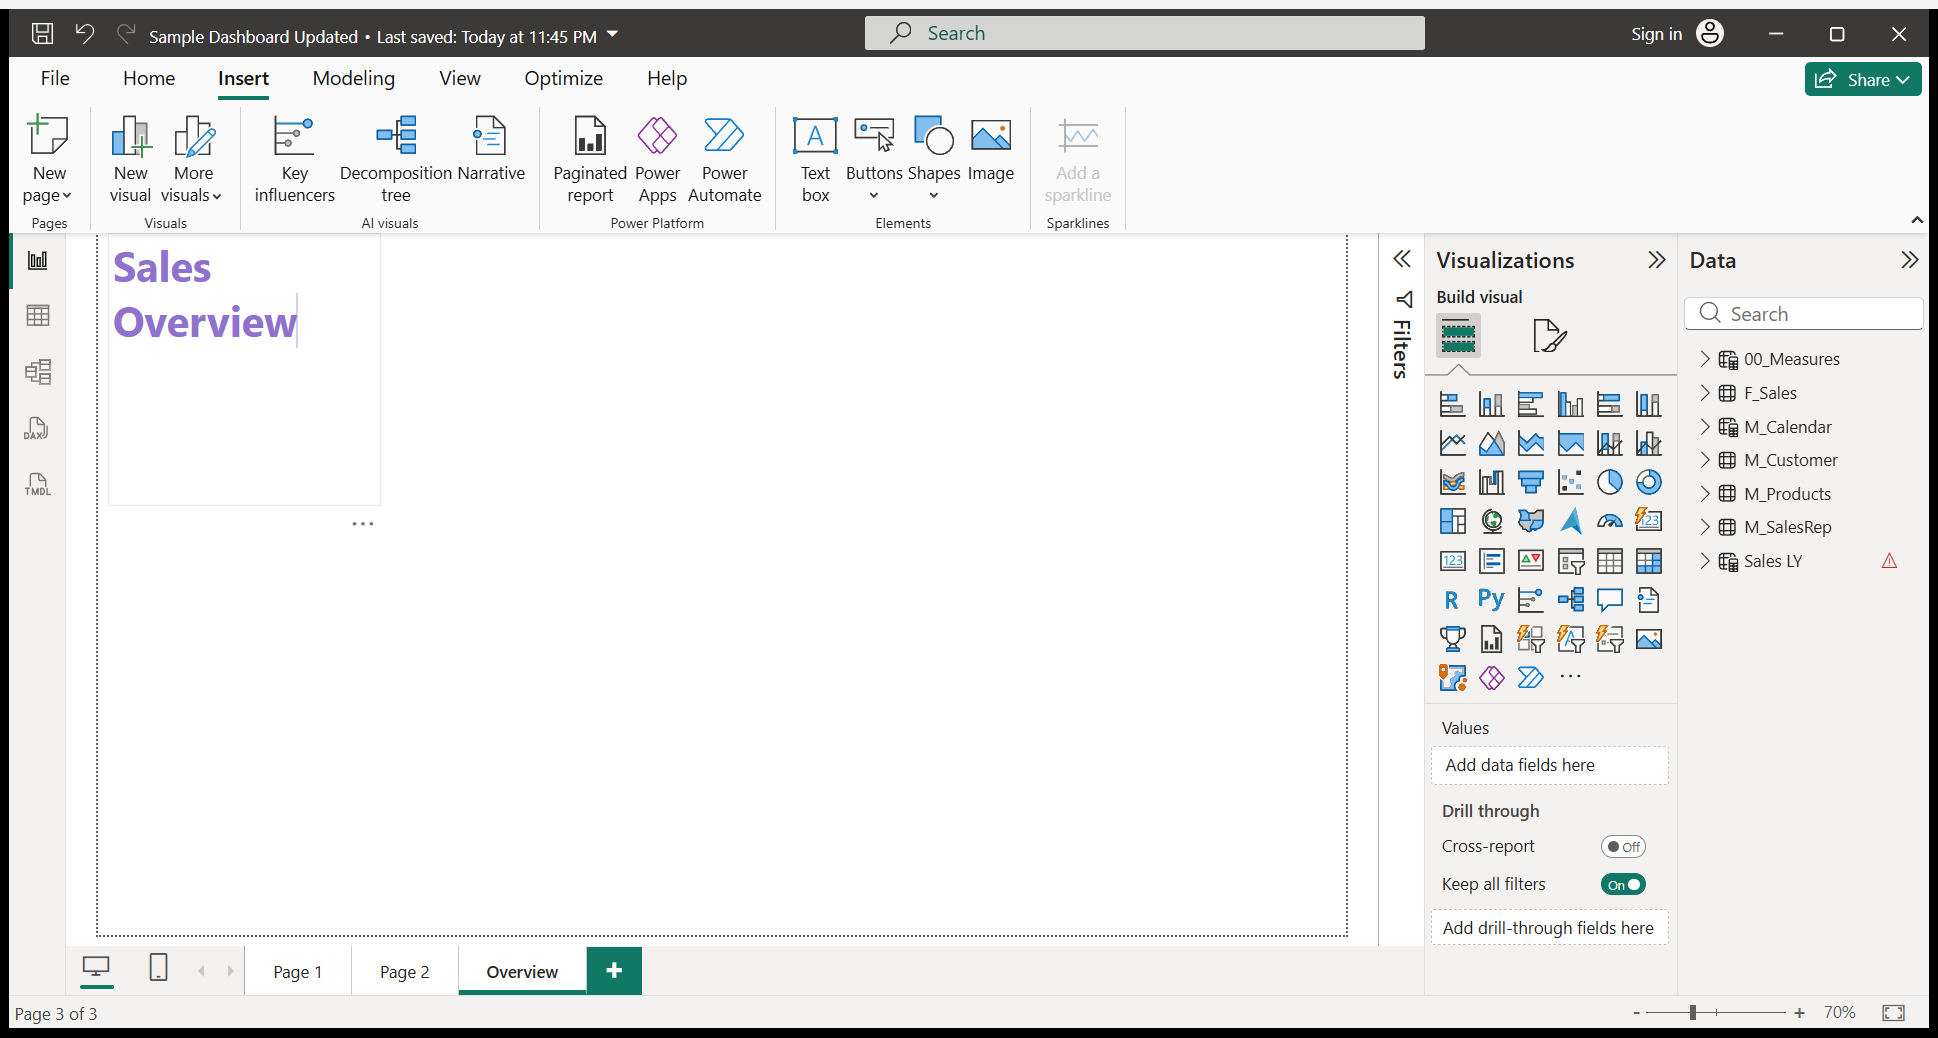
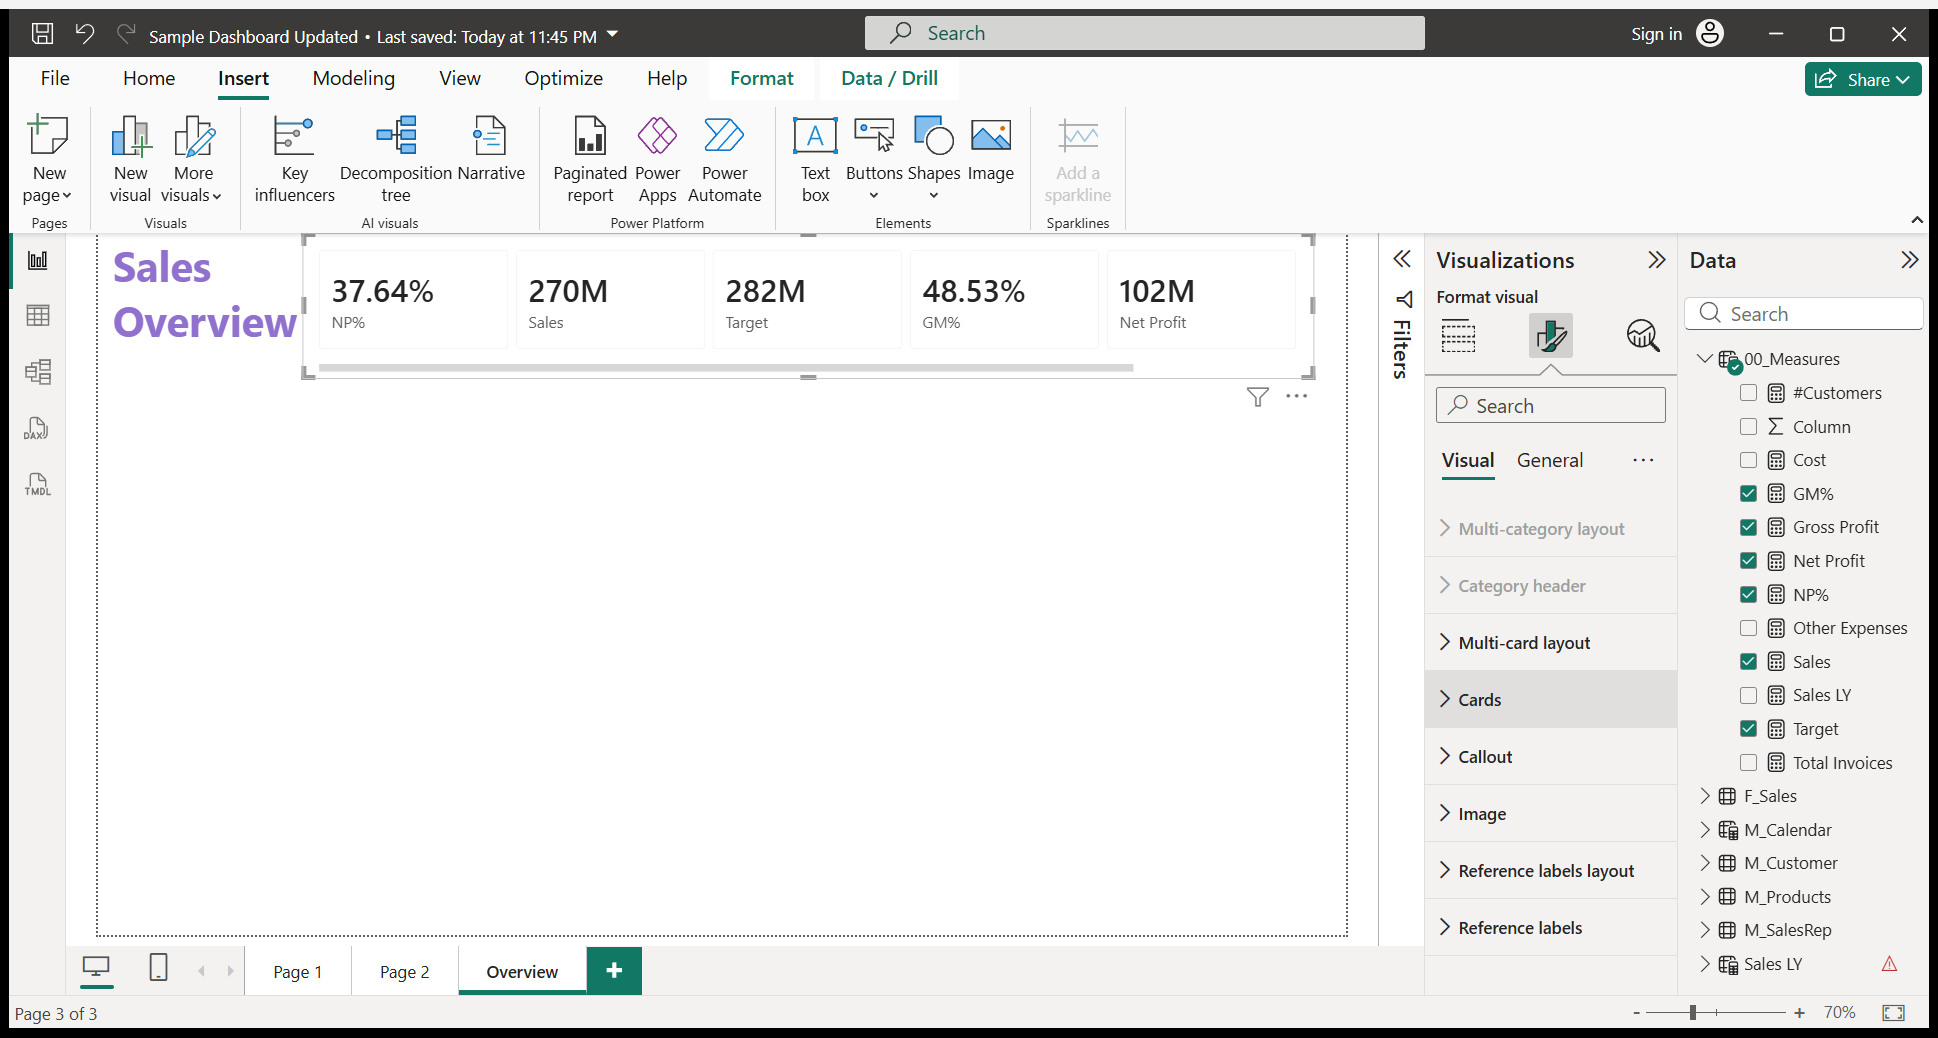
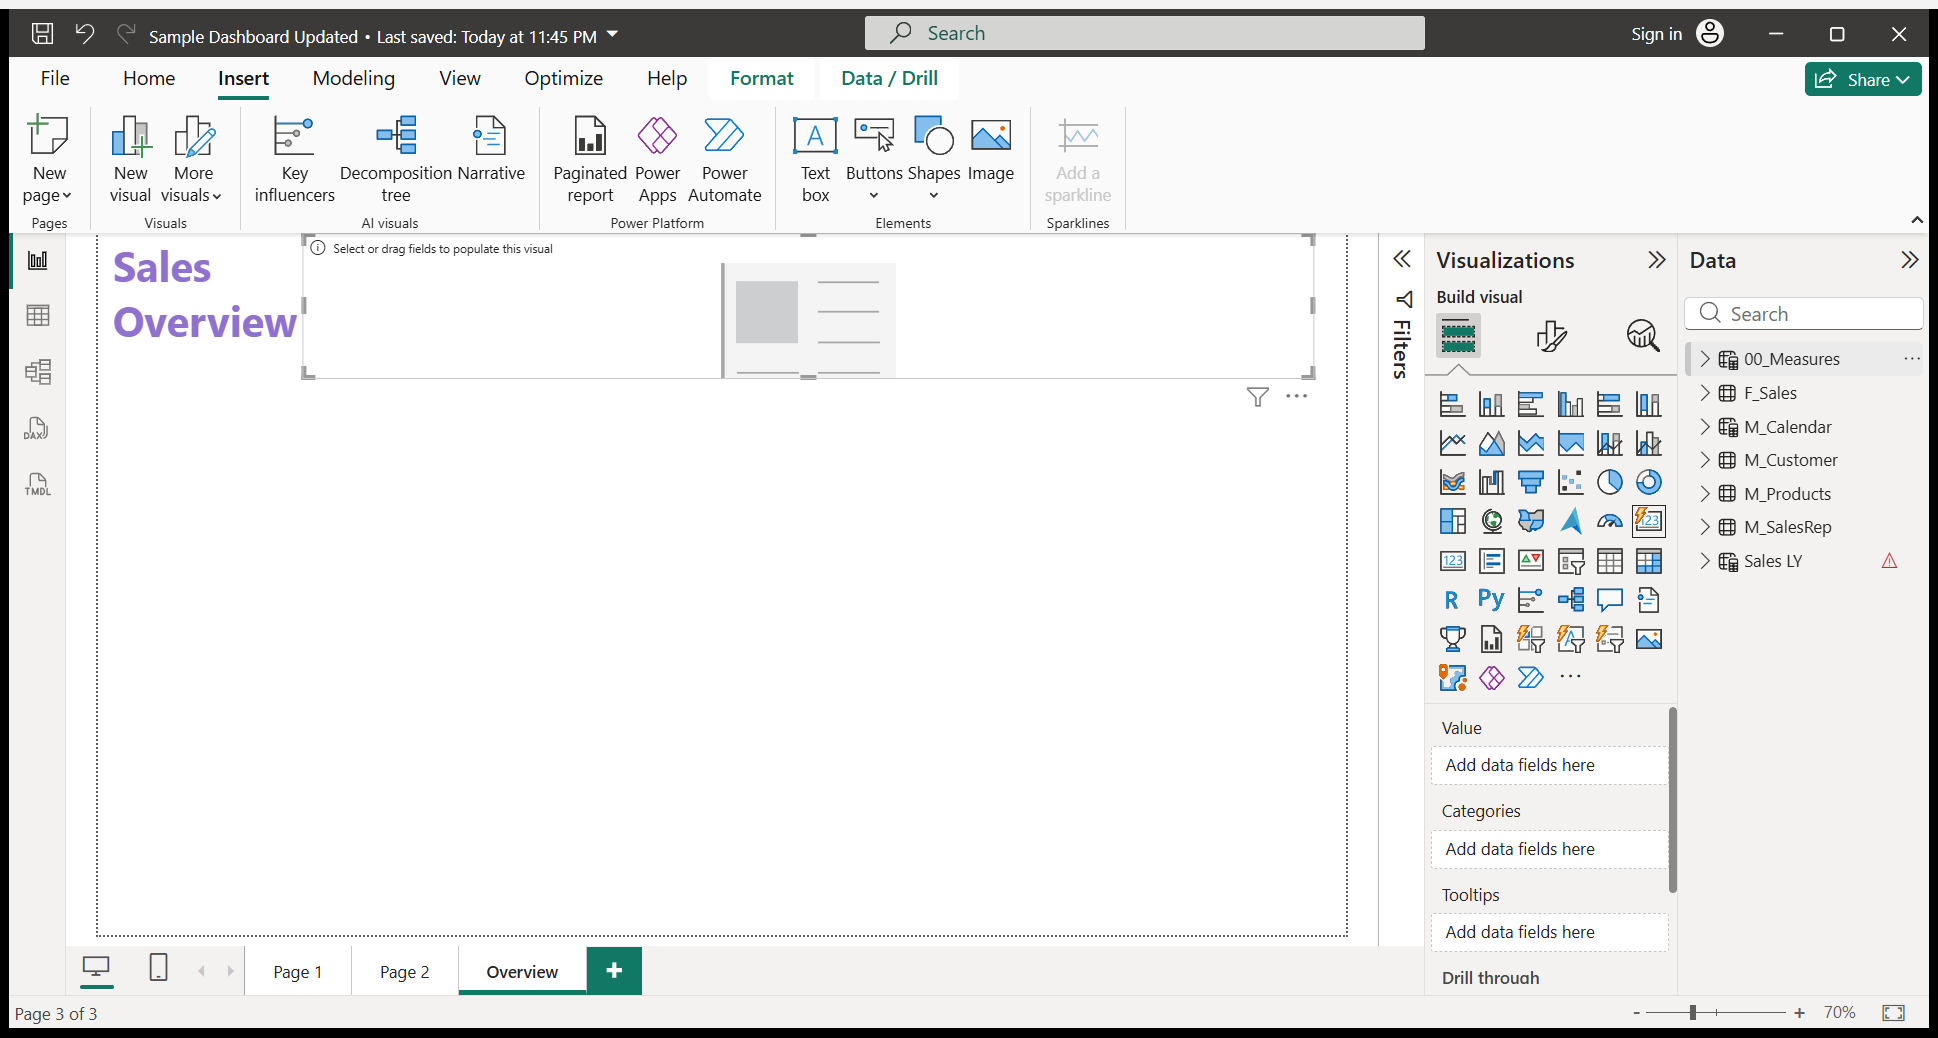
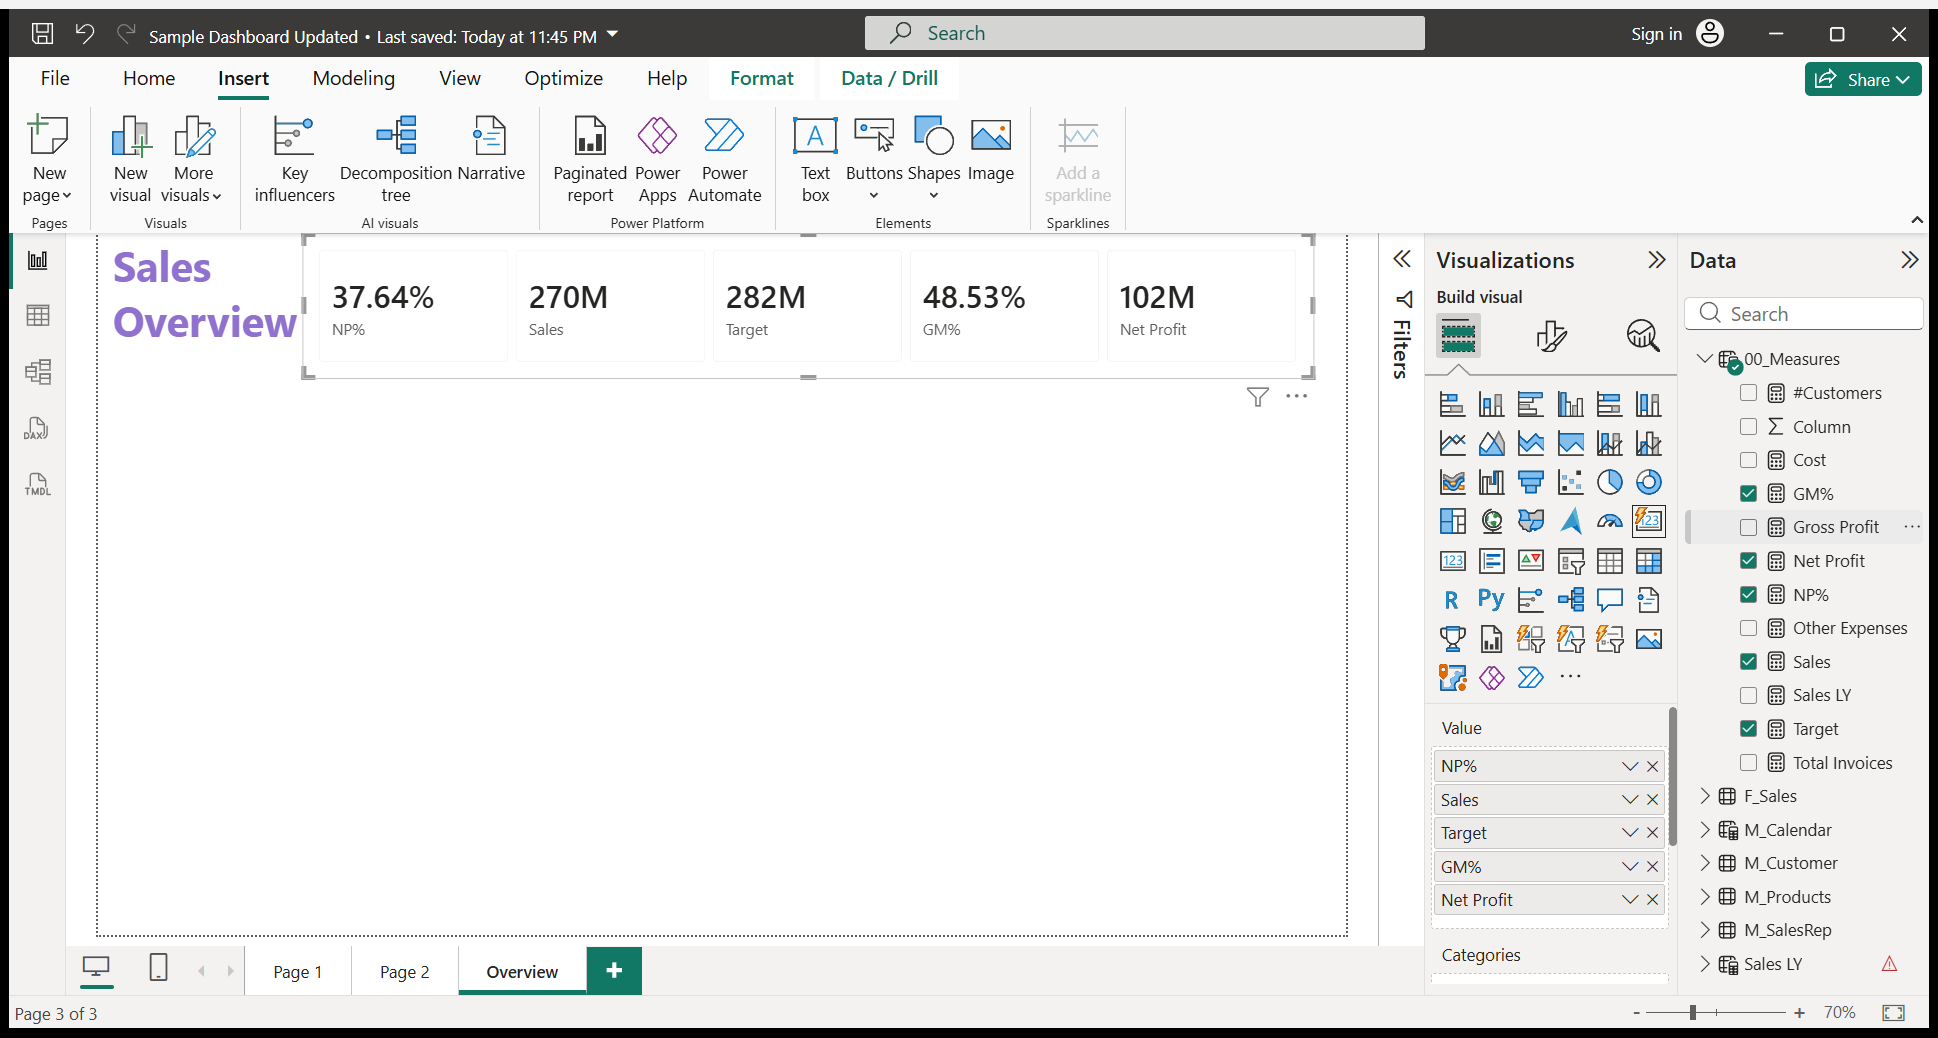
Okay. Now, we will create headers. I need headers on my page to represent KPIs. Okay. To do that, we need to insert a card visual.
Under the visuals, we can see this card. I will click here.

This is the new card visual enabled by Power BI.
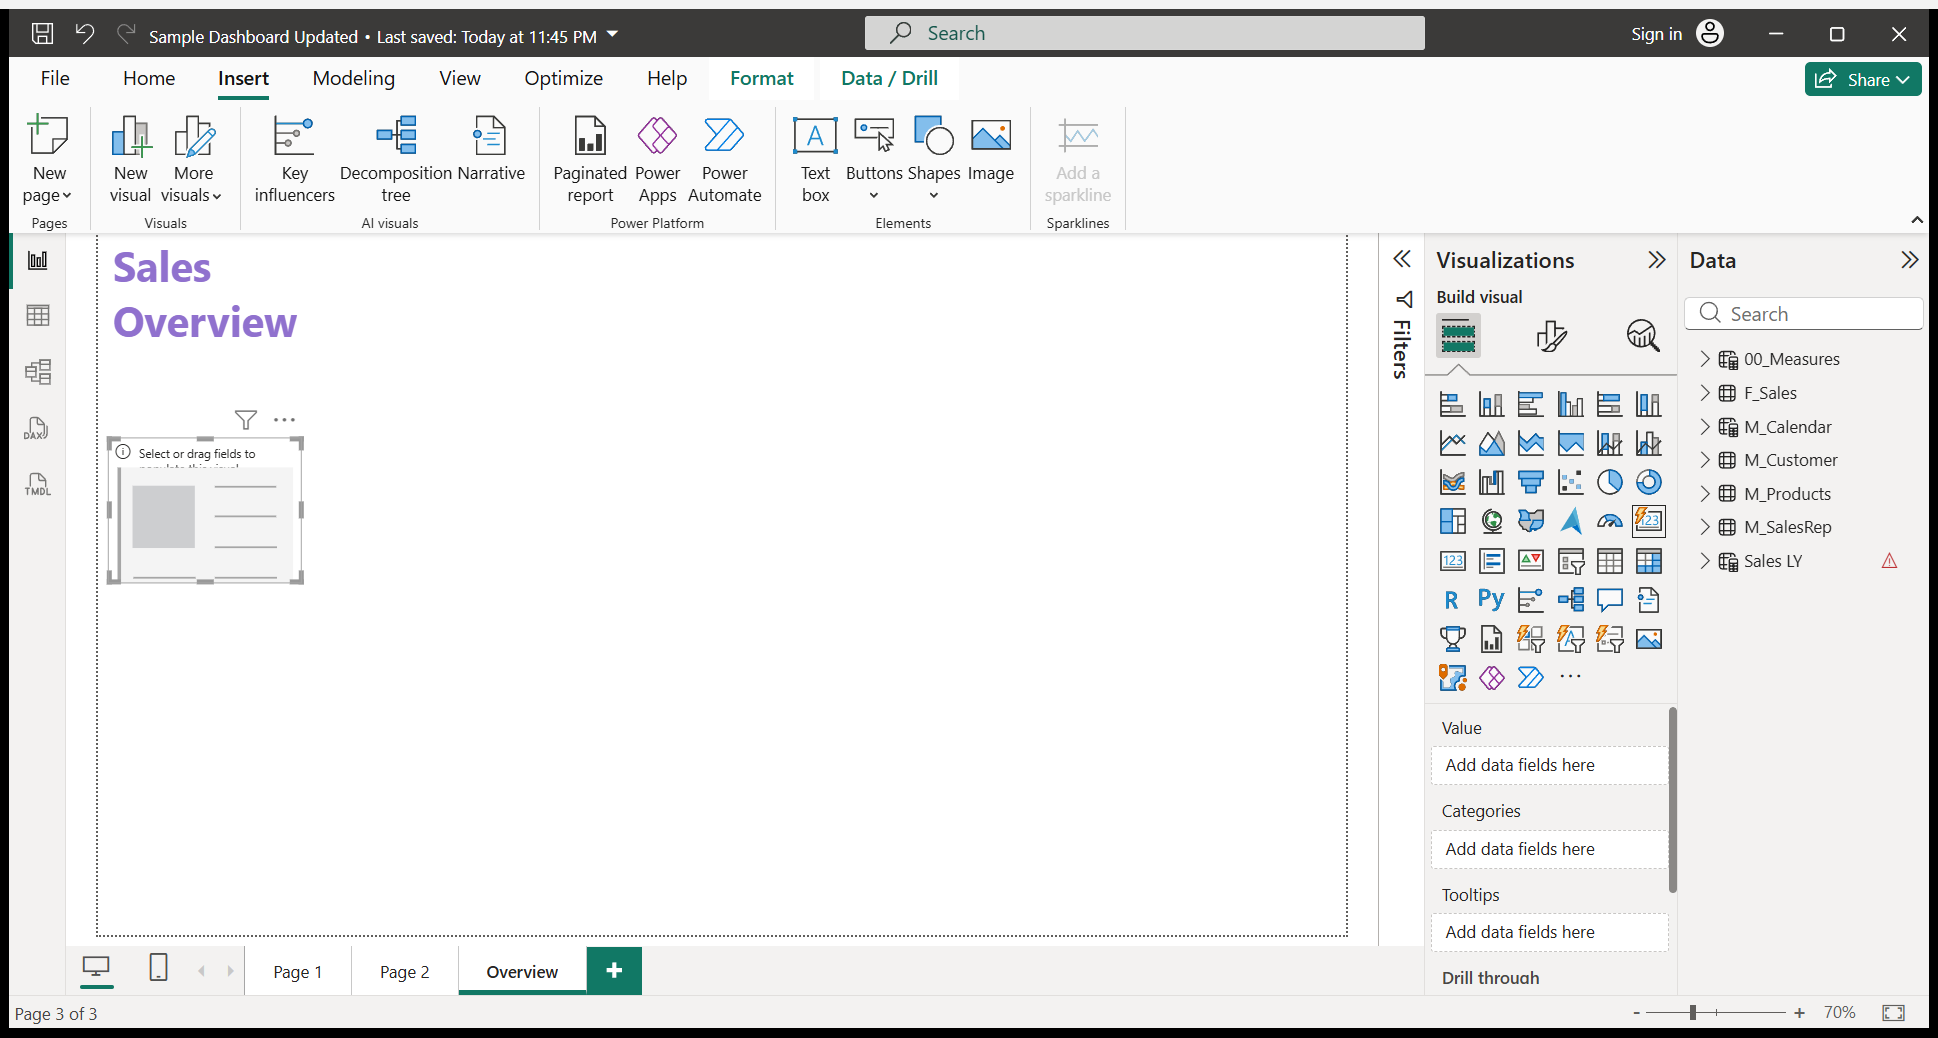
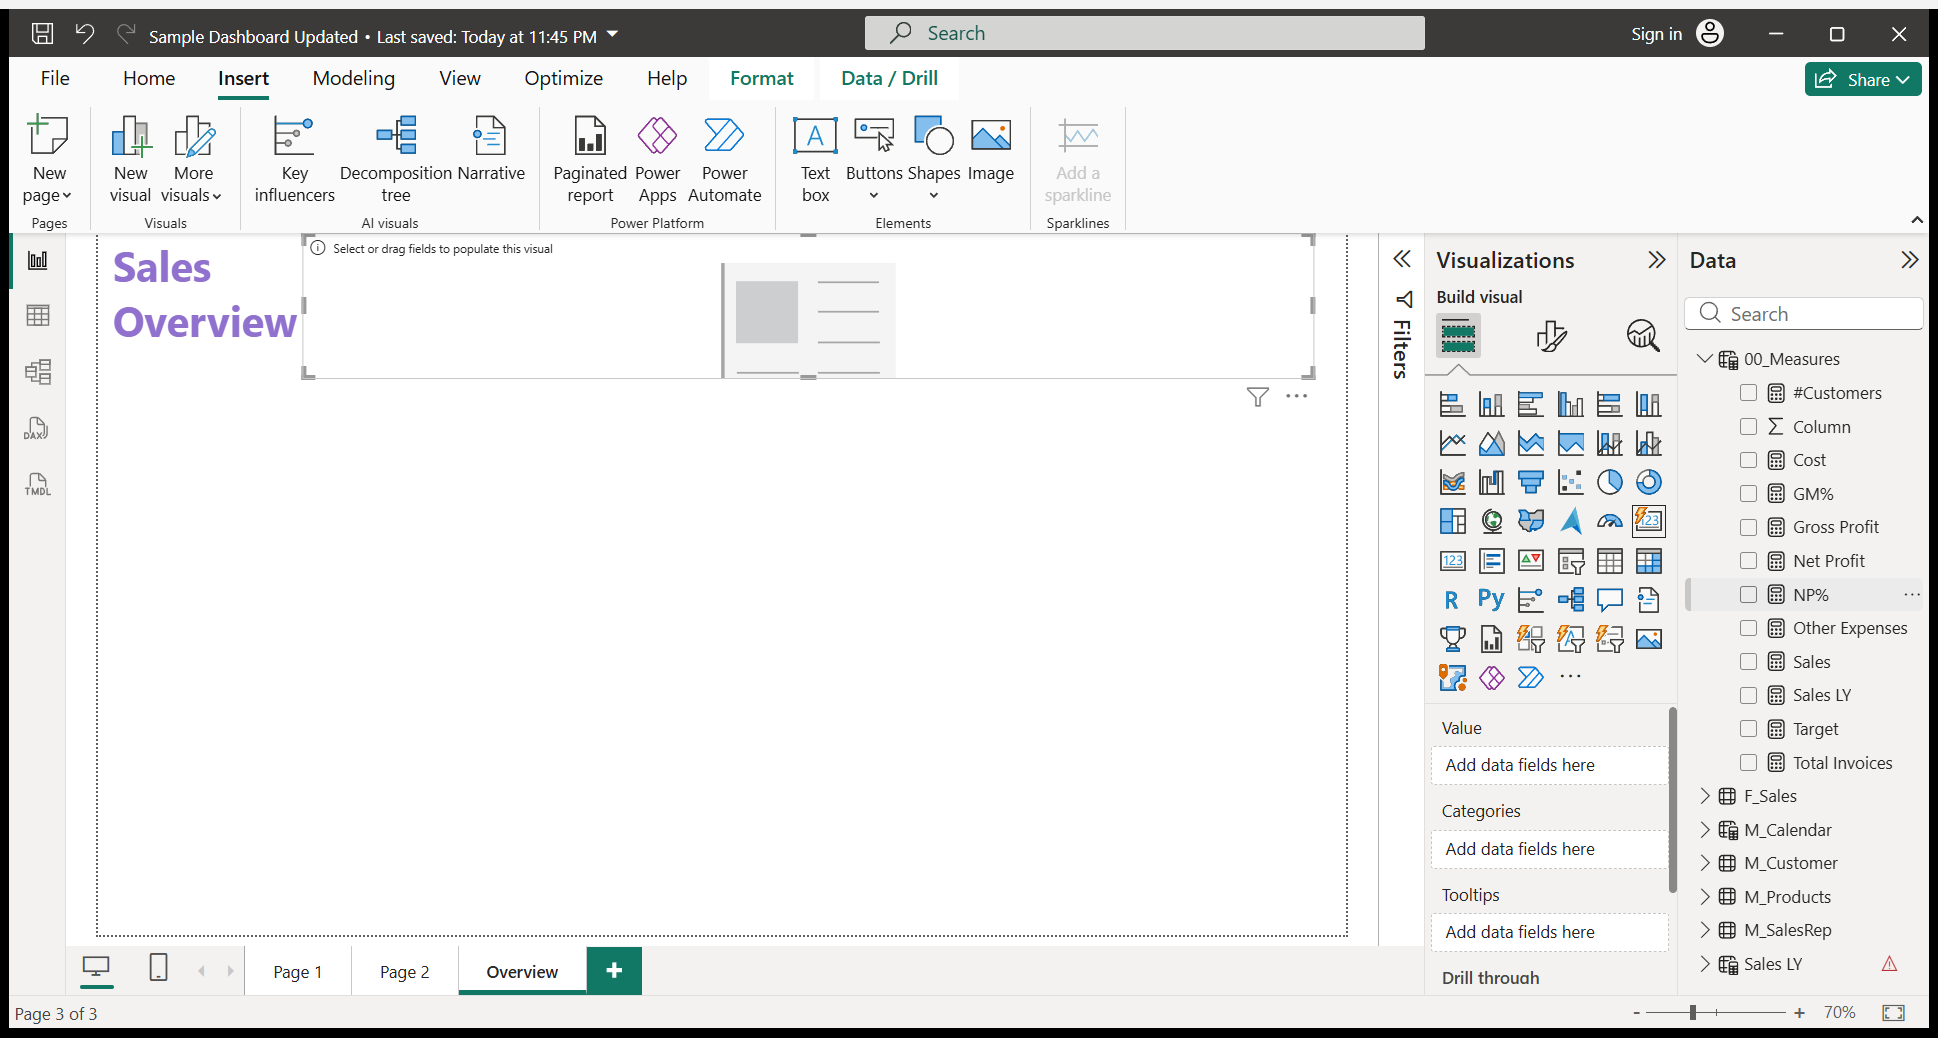
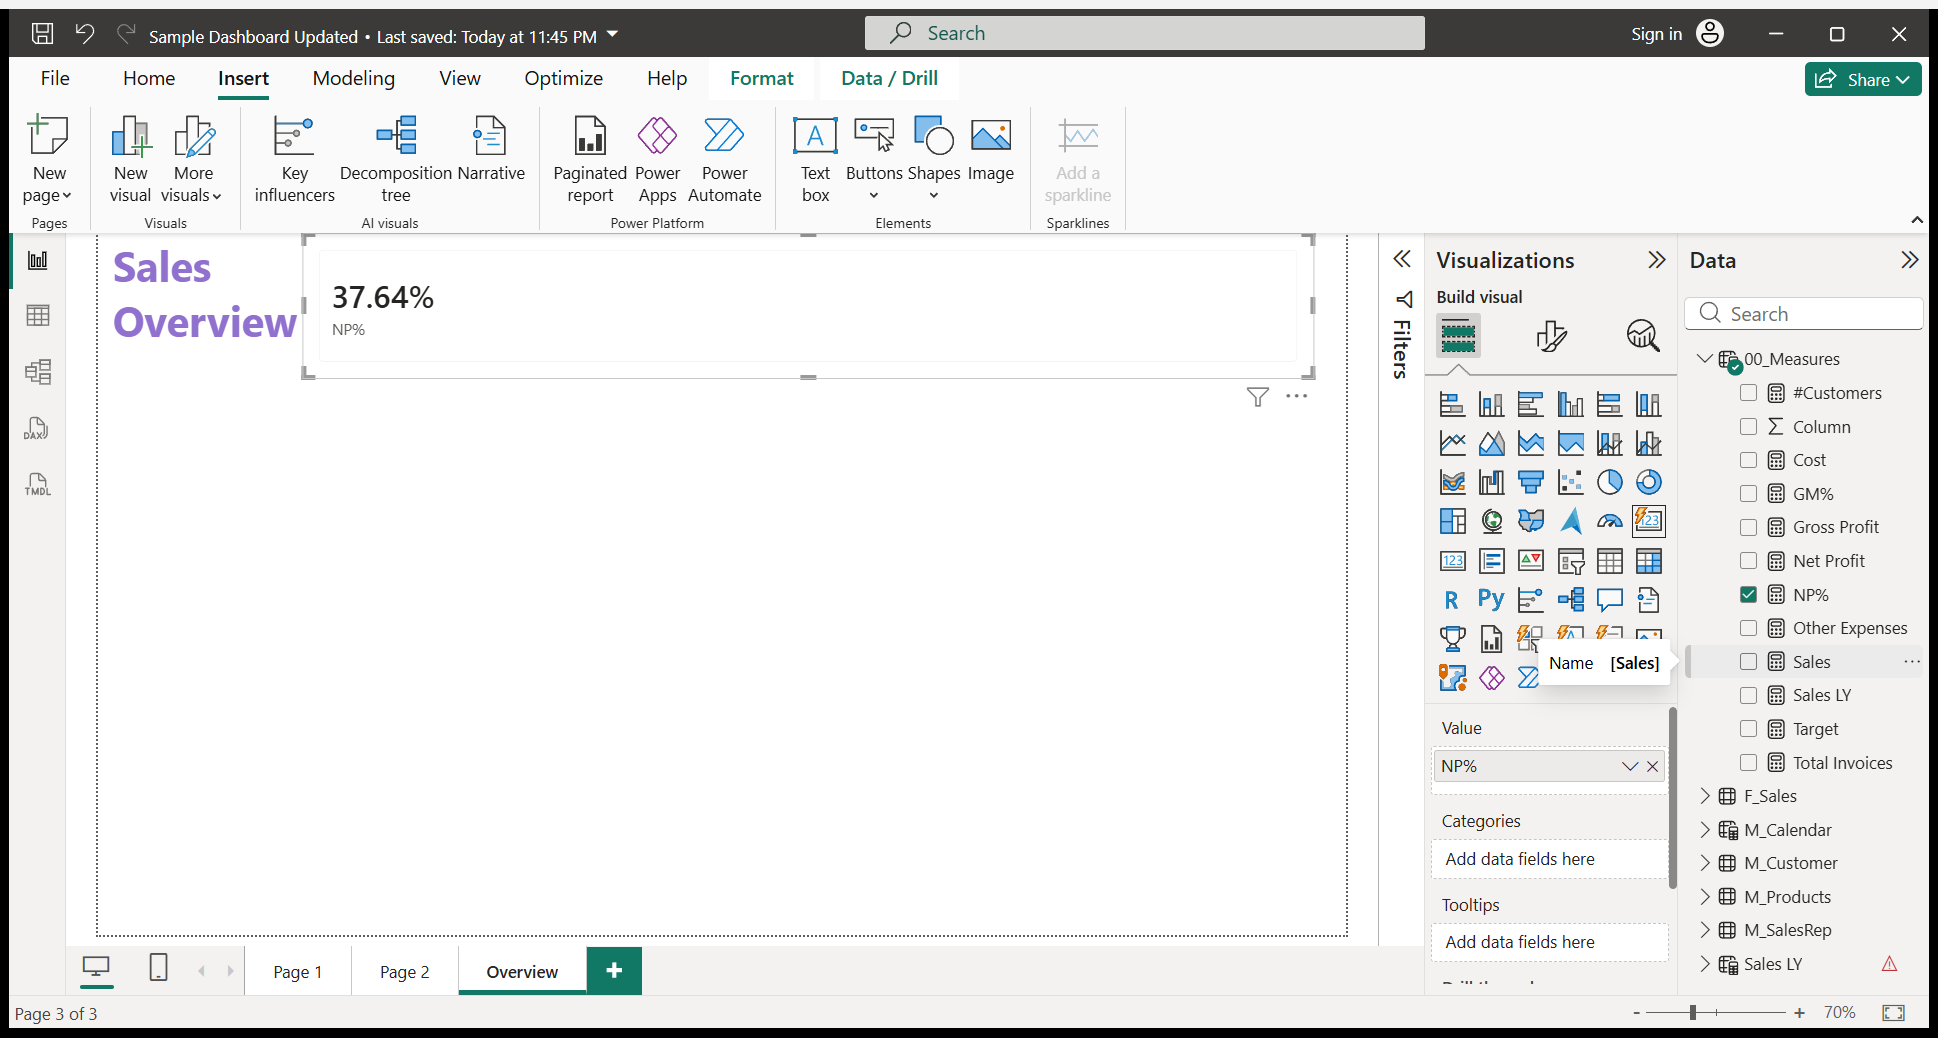
Now, we will select the KPIs we want to display in this card visual.
I need net profit percentage, sales, target, gross margin percentage, net profit, and gross profit.


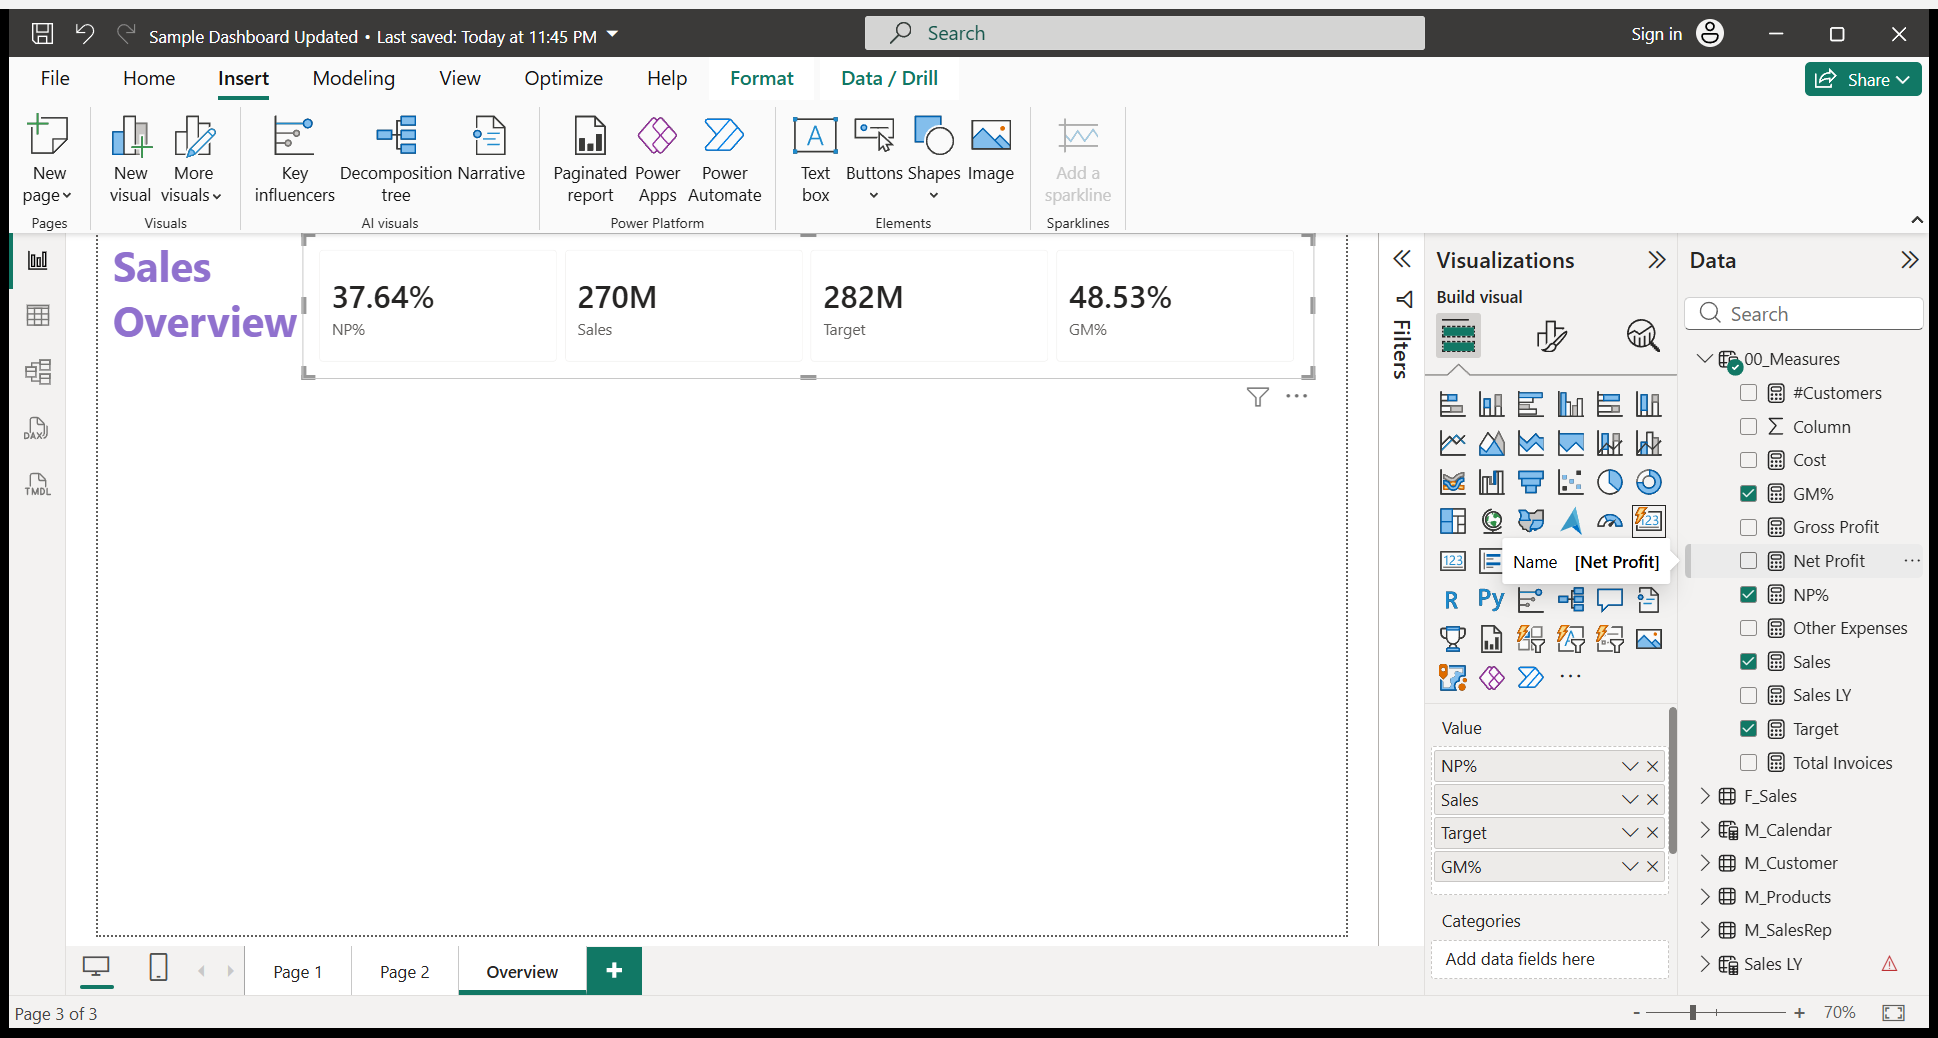
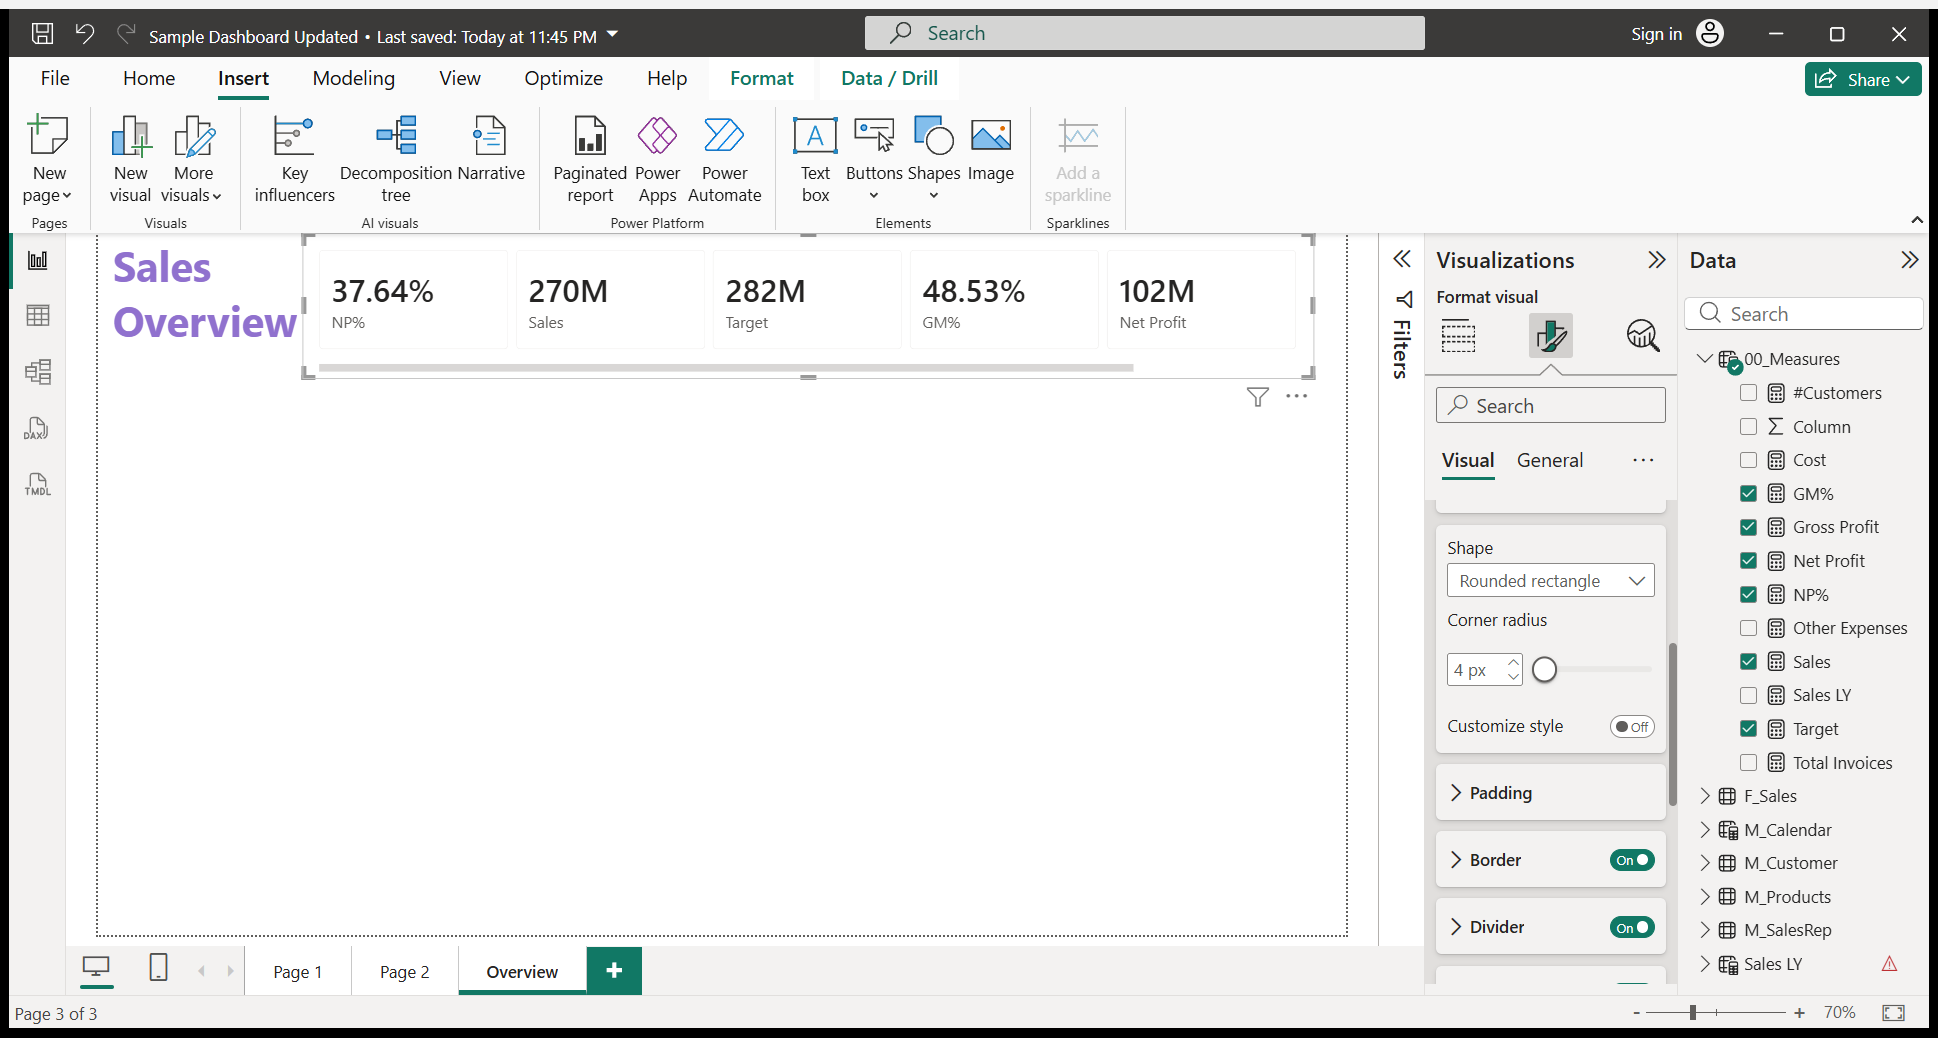
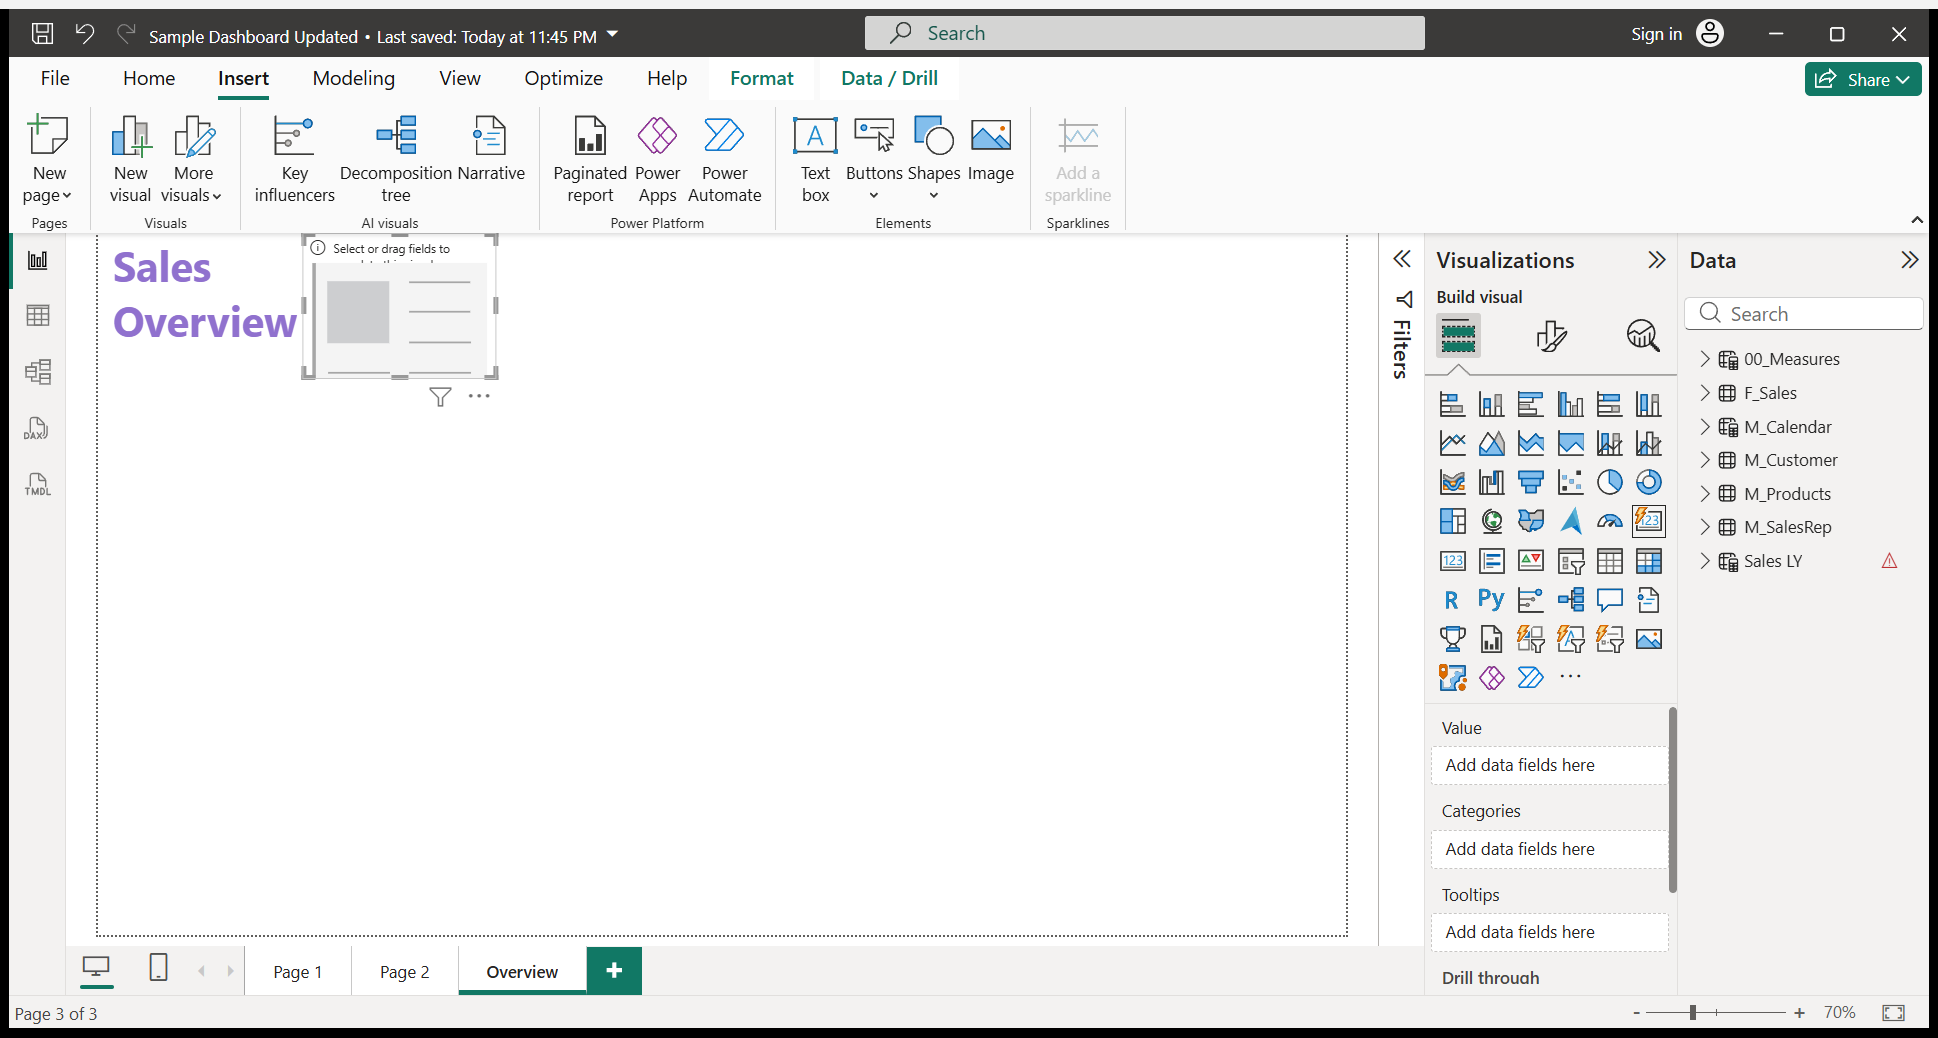
Okay. I need all of these cards. I notice that I cannot see all six cards in this single frame. I will go to format your visual.
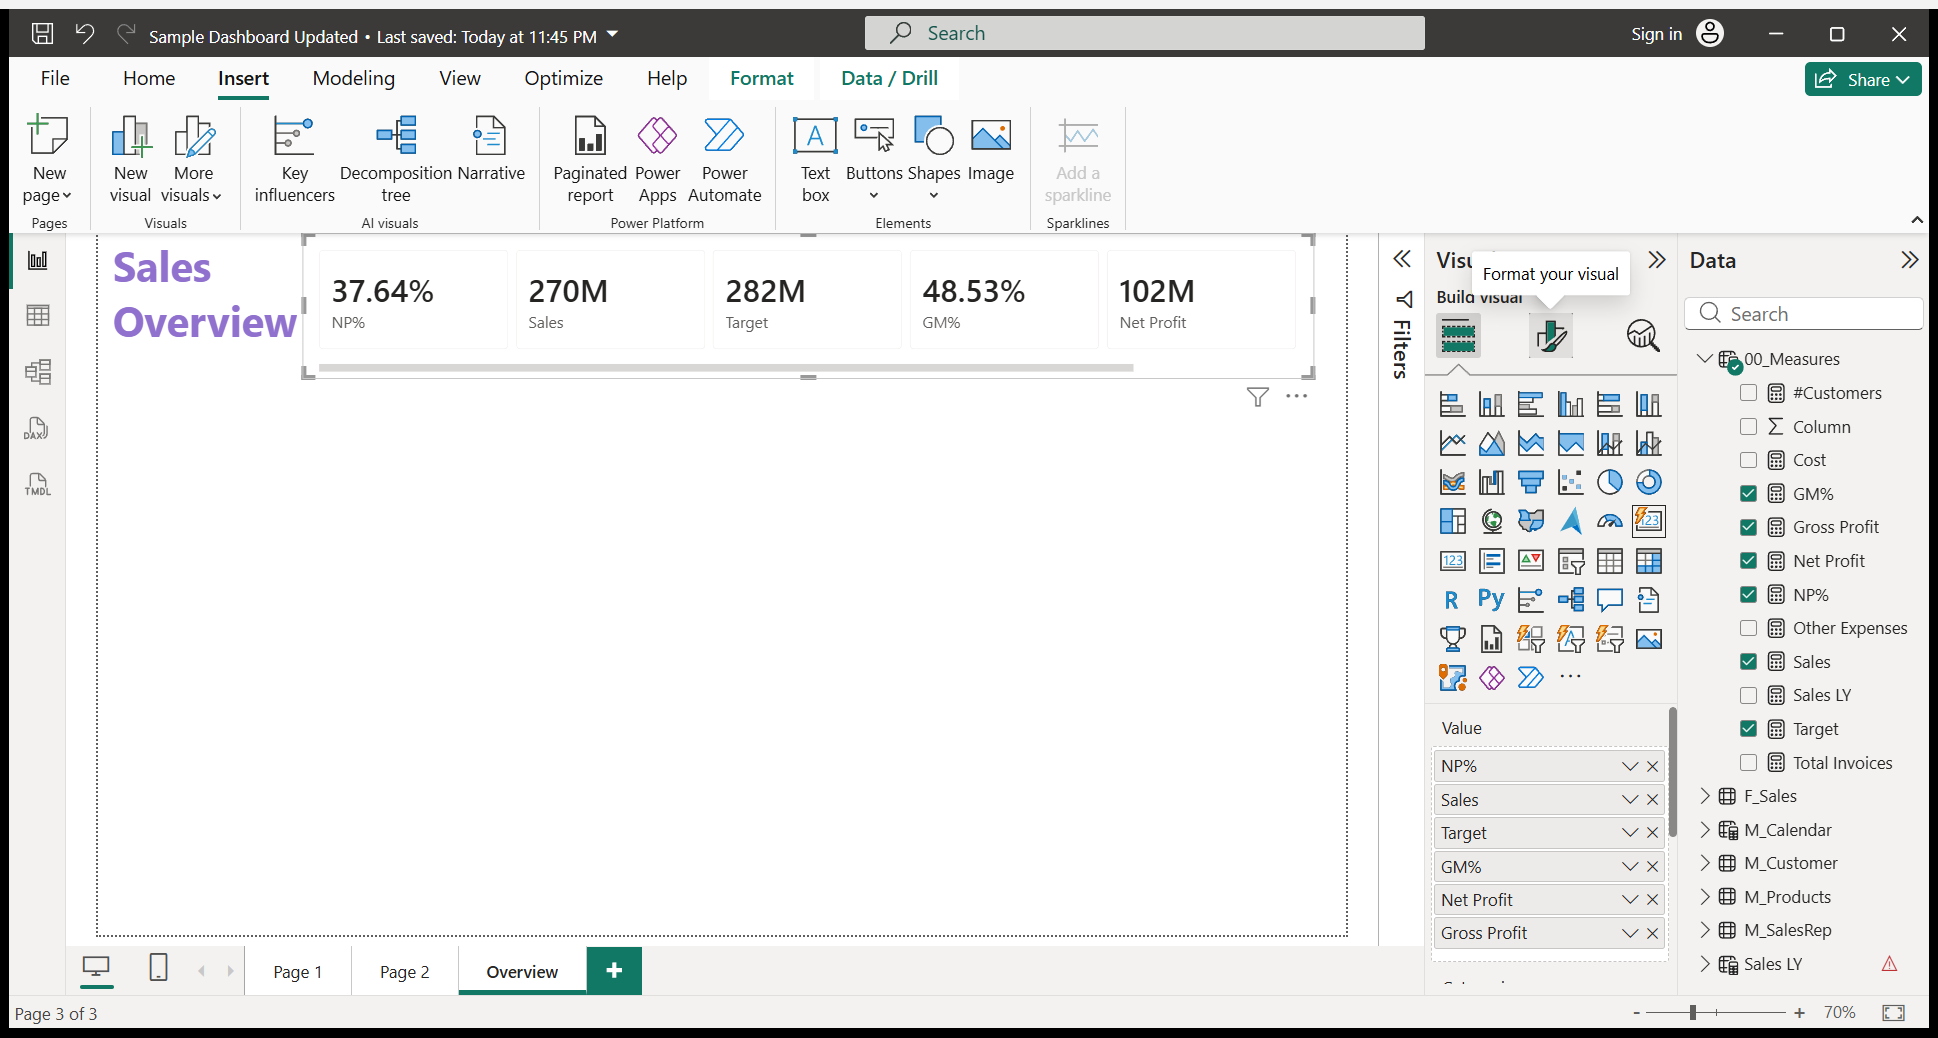
Below the cards, there will be an option.