How to Open and Analyze Customer Satisfaction Survey Reports in C4C
Learn how to access and analyze customer satisfaction survey reports in C4C. This guide covers steps to view FCR and CSAT scores, and how to interpret the results.
In this guide, we'll learn how to open and analyze the customer satisfaction survey report in C4C. Understanding how to access and interpret these reports is crucial for monitoring and improving customer service performance. We'll cover how to locate the report, set it as a favorite for quick access, and navigate through different views to analyze satisfaction scores and detailed feedback.
Let's get started
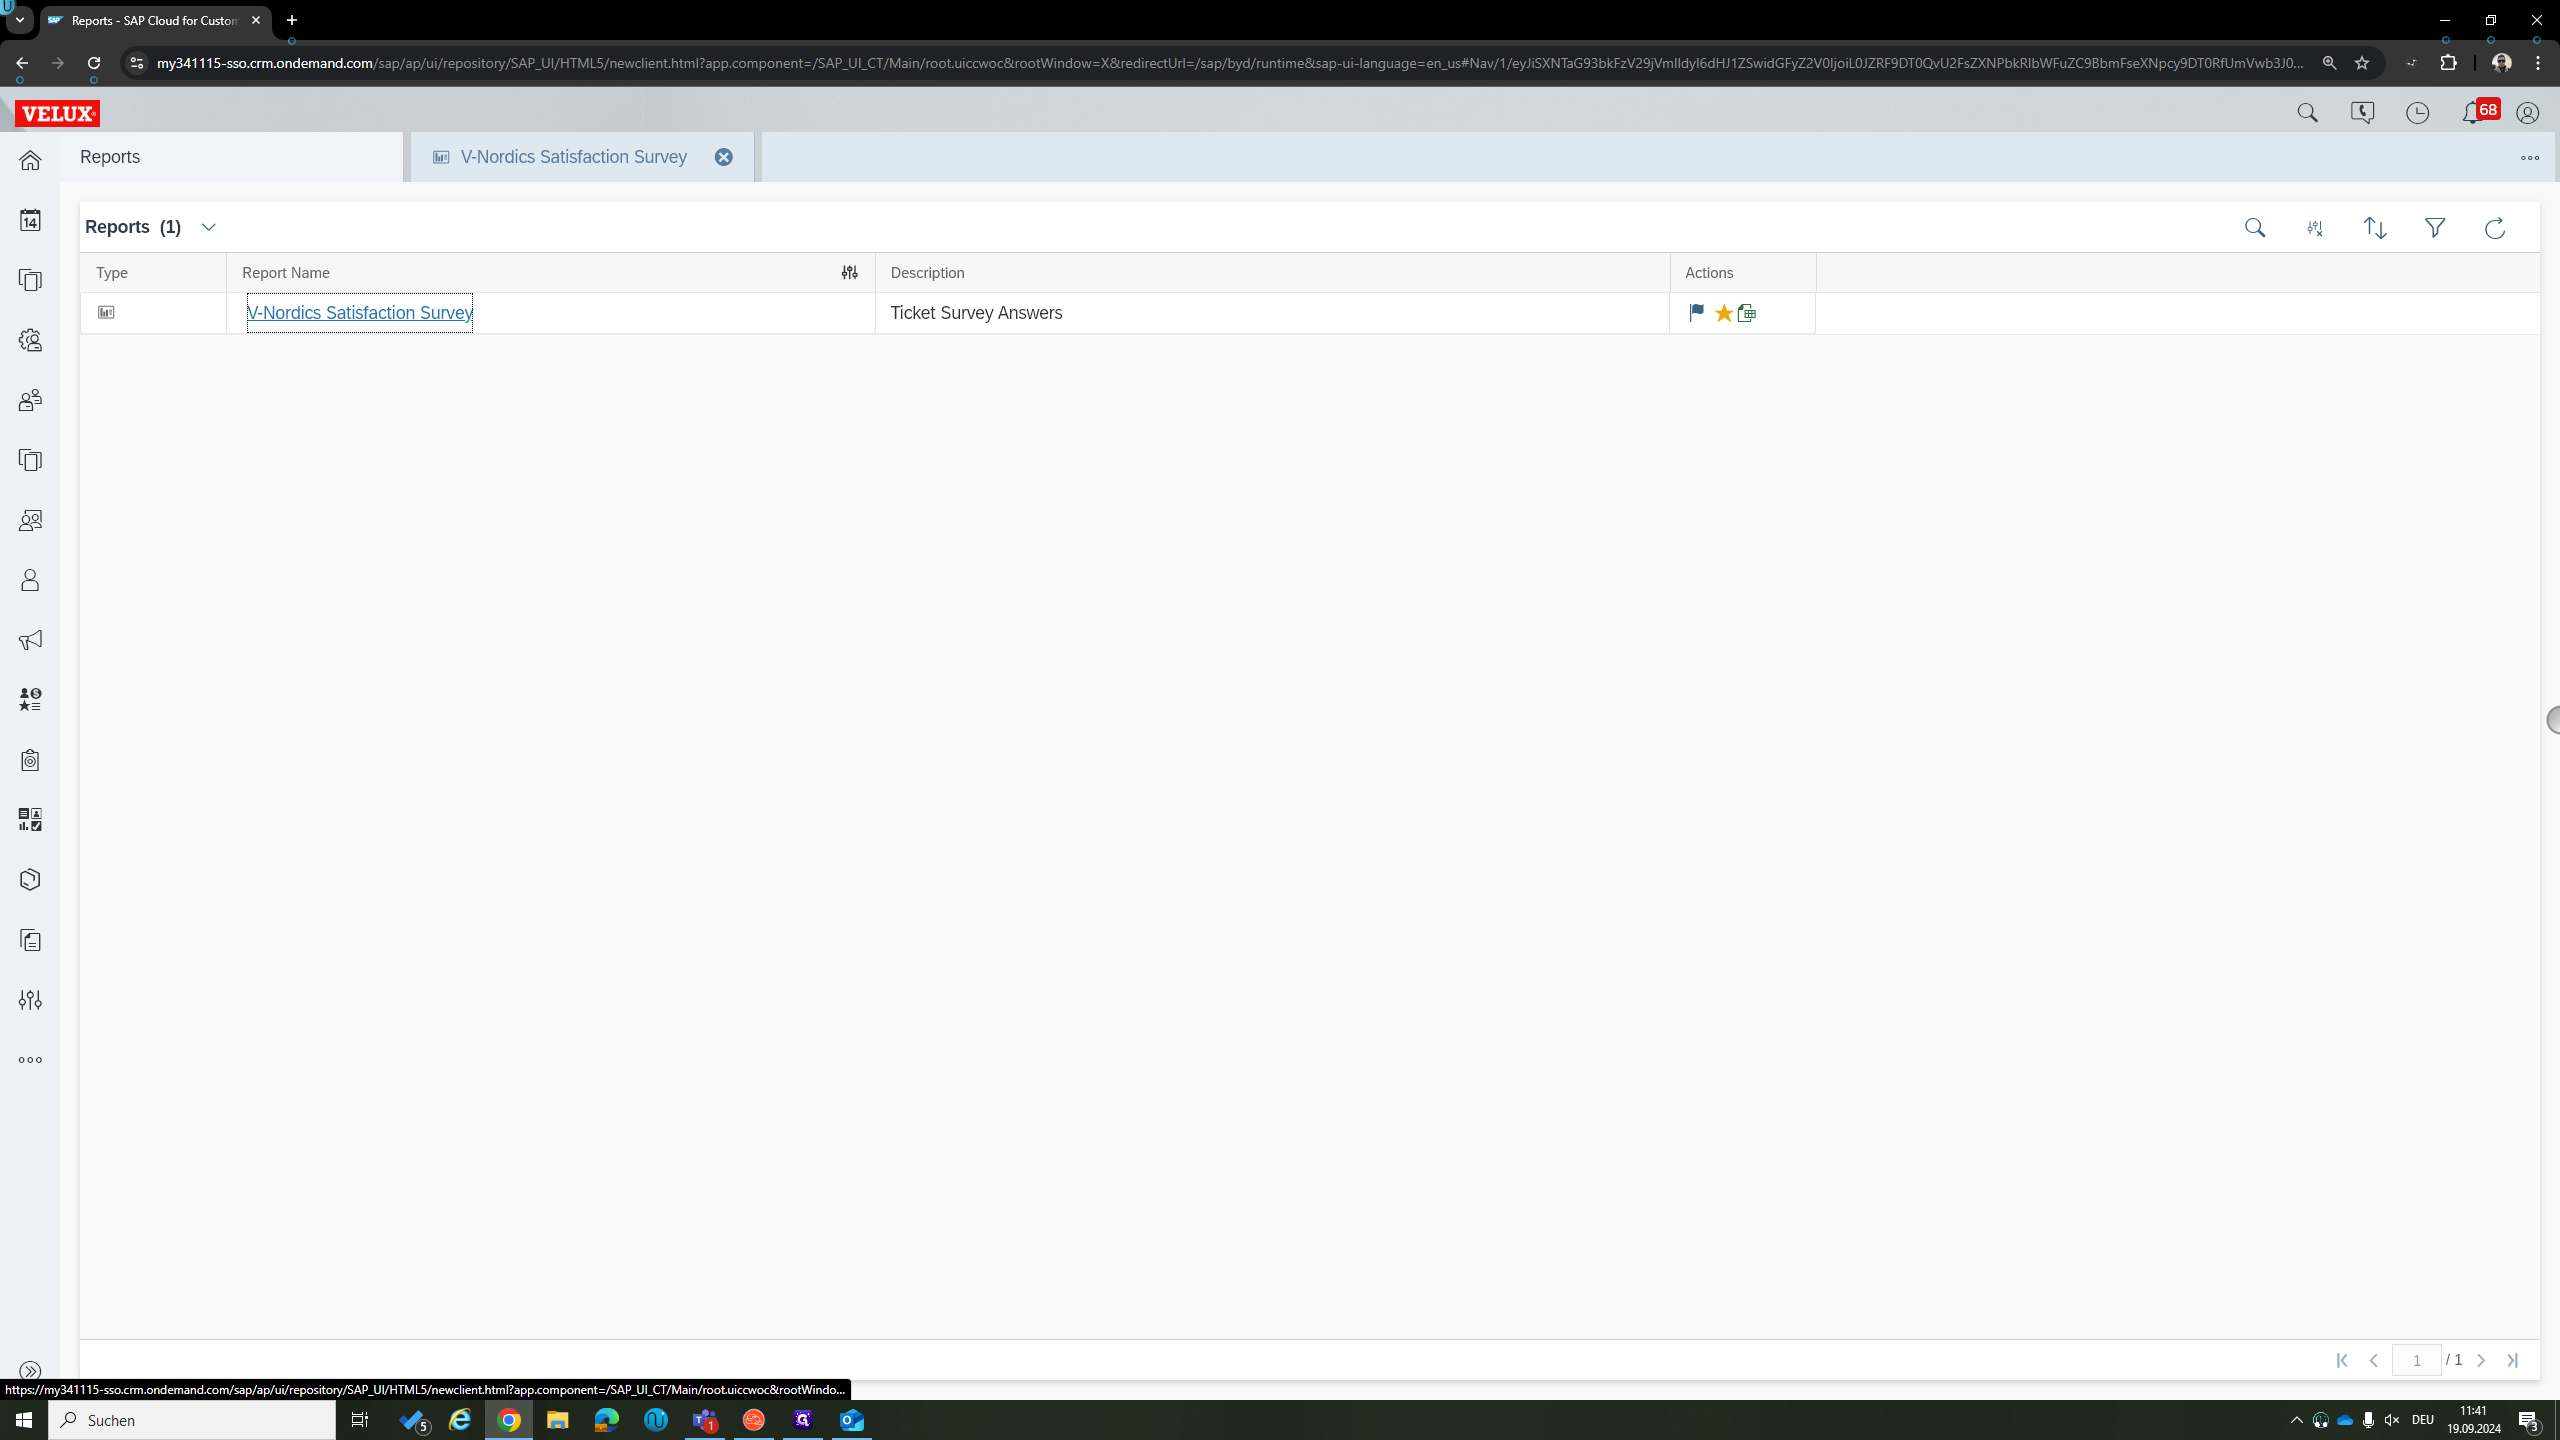
In this guide, I will show you how to open the customer satisfaction survey report in C4C. First, go to Analysis in the C4C panel. On the left side, open Reports.
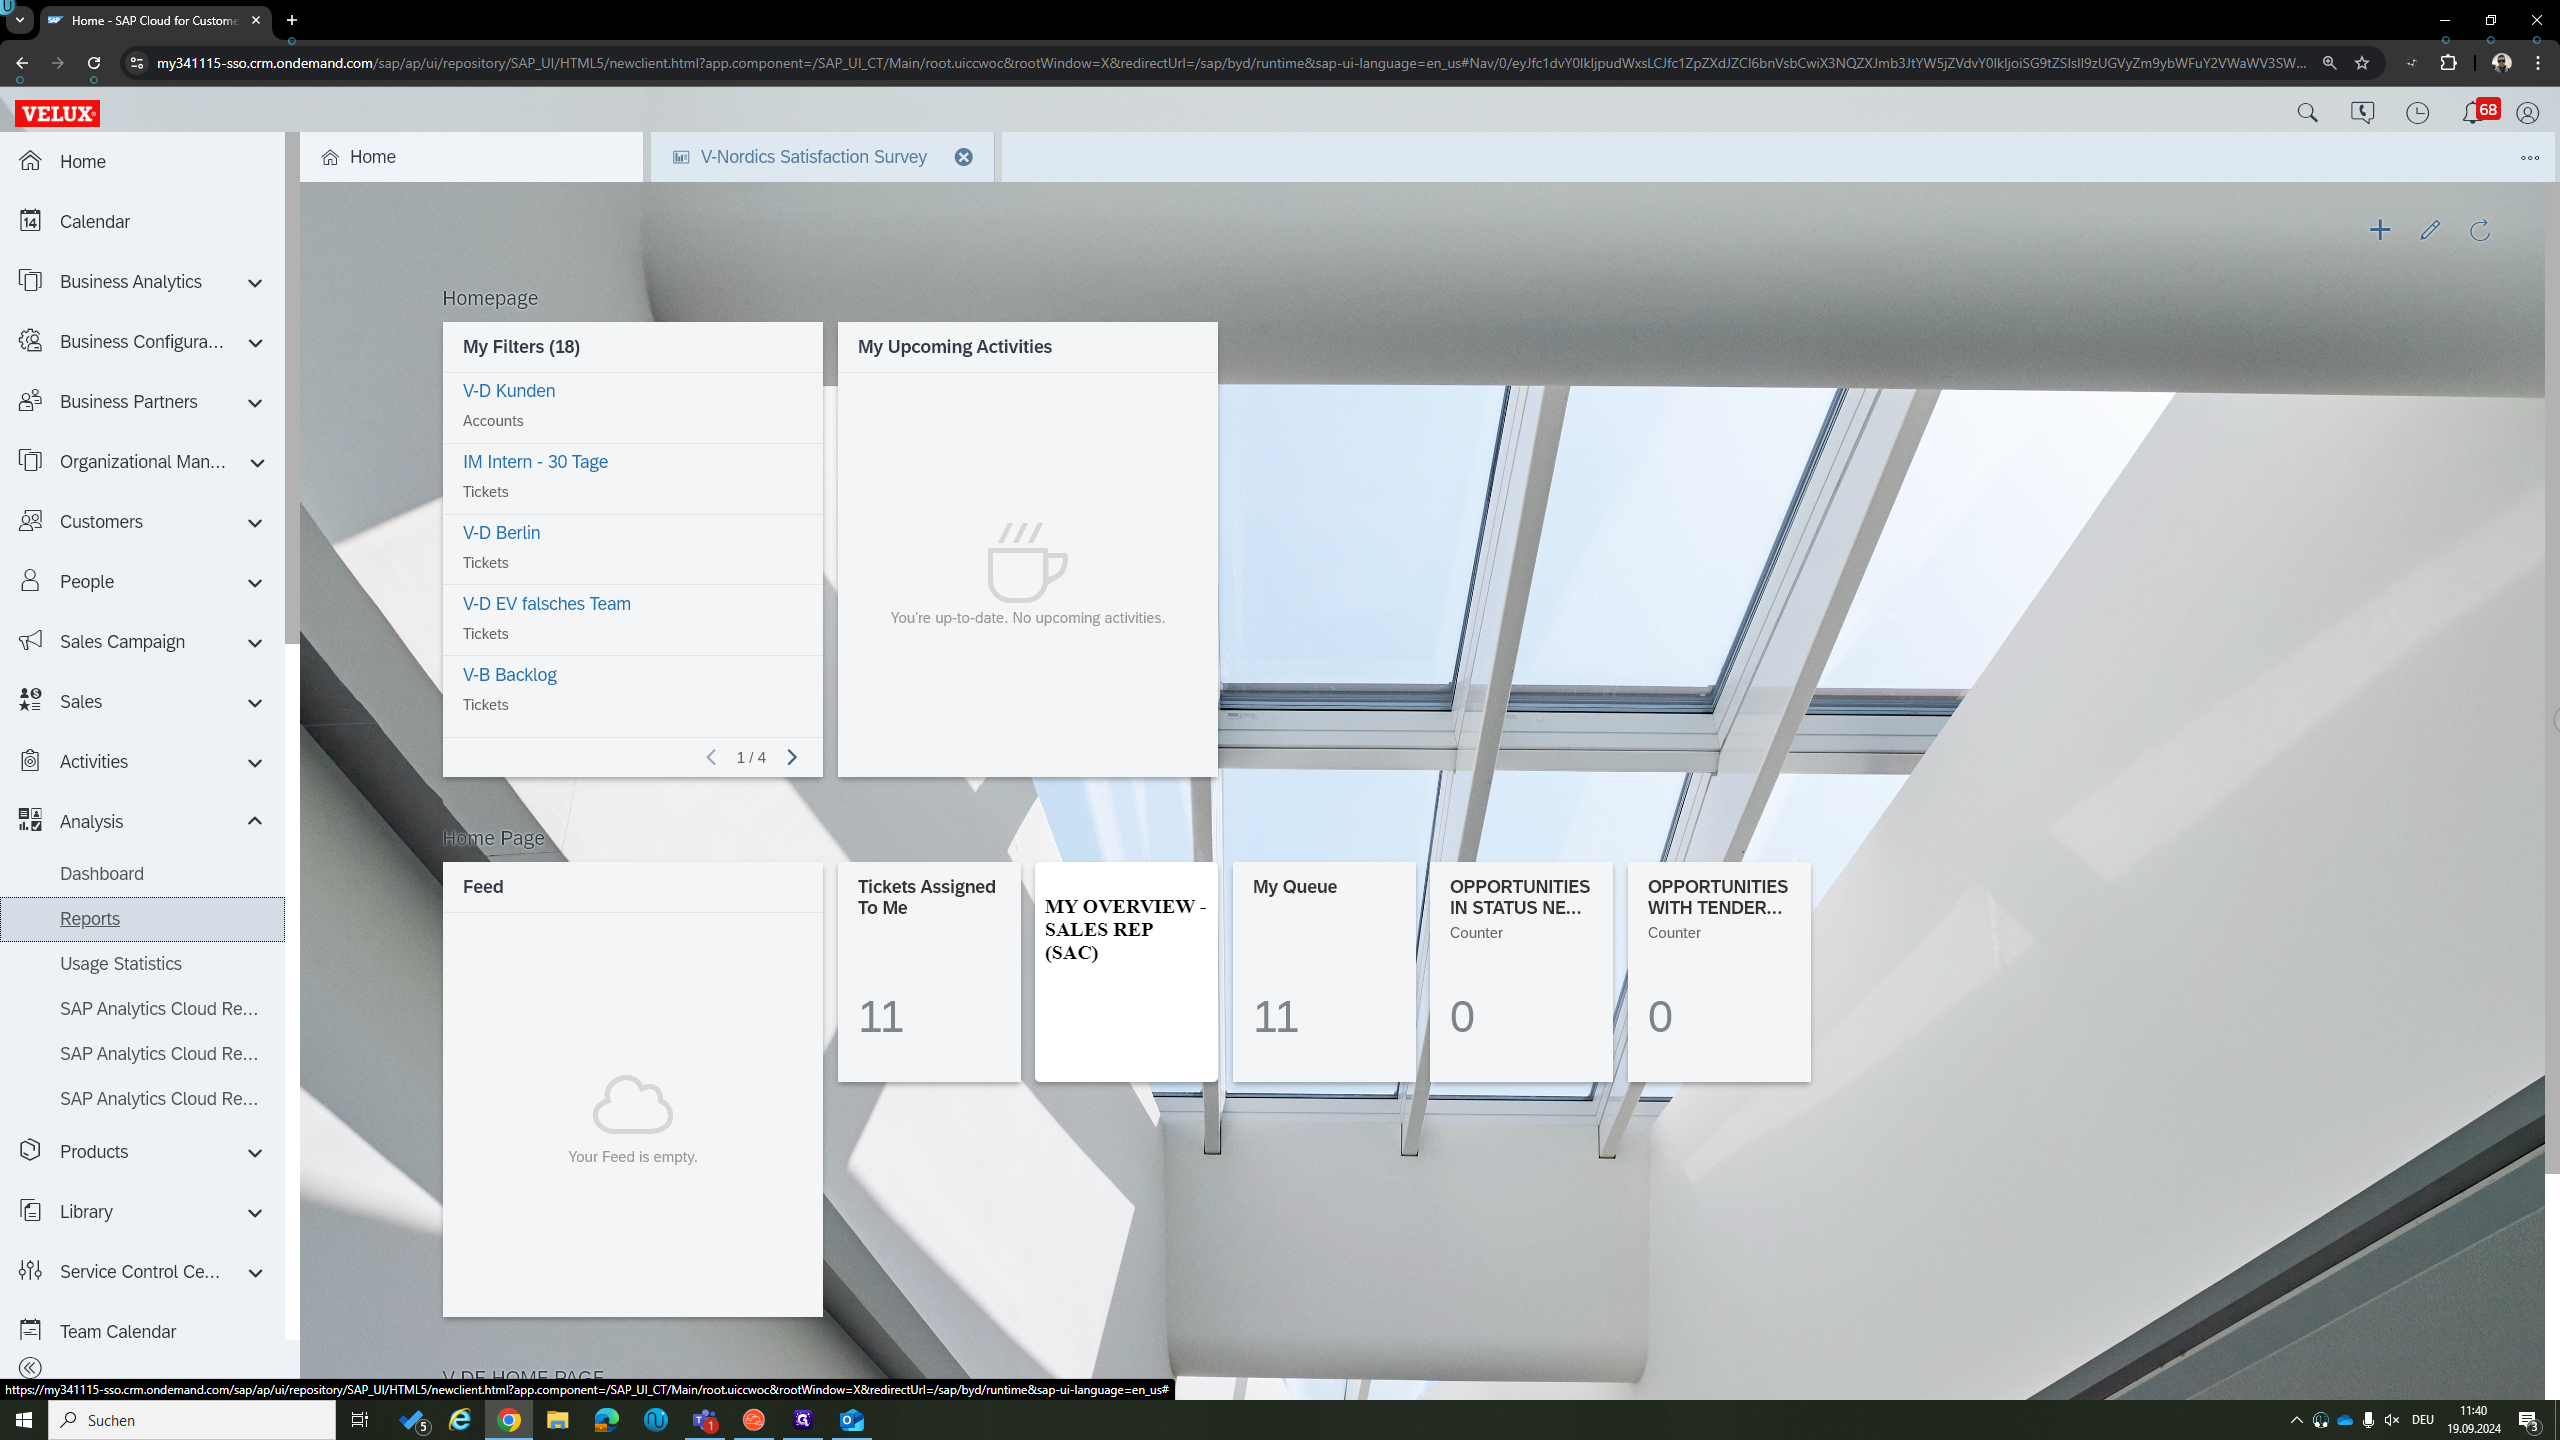
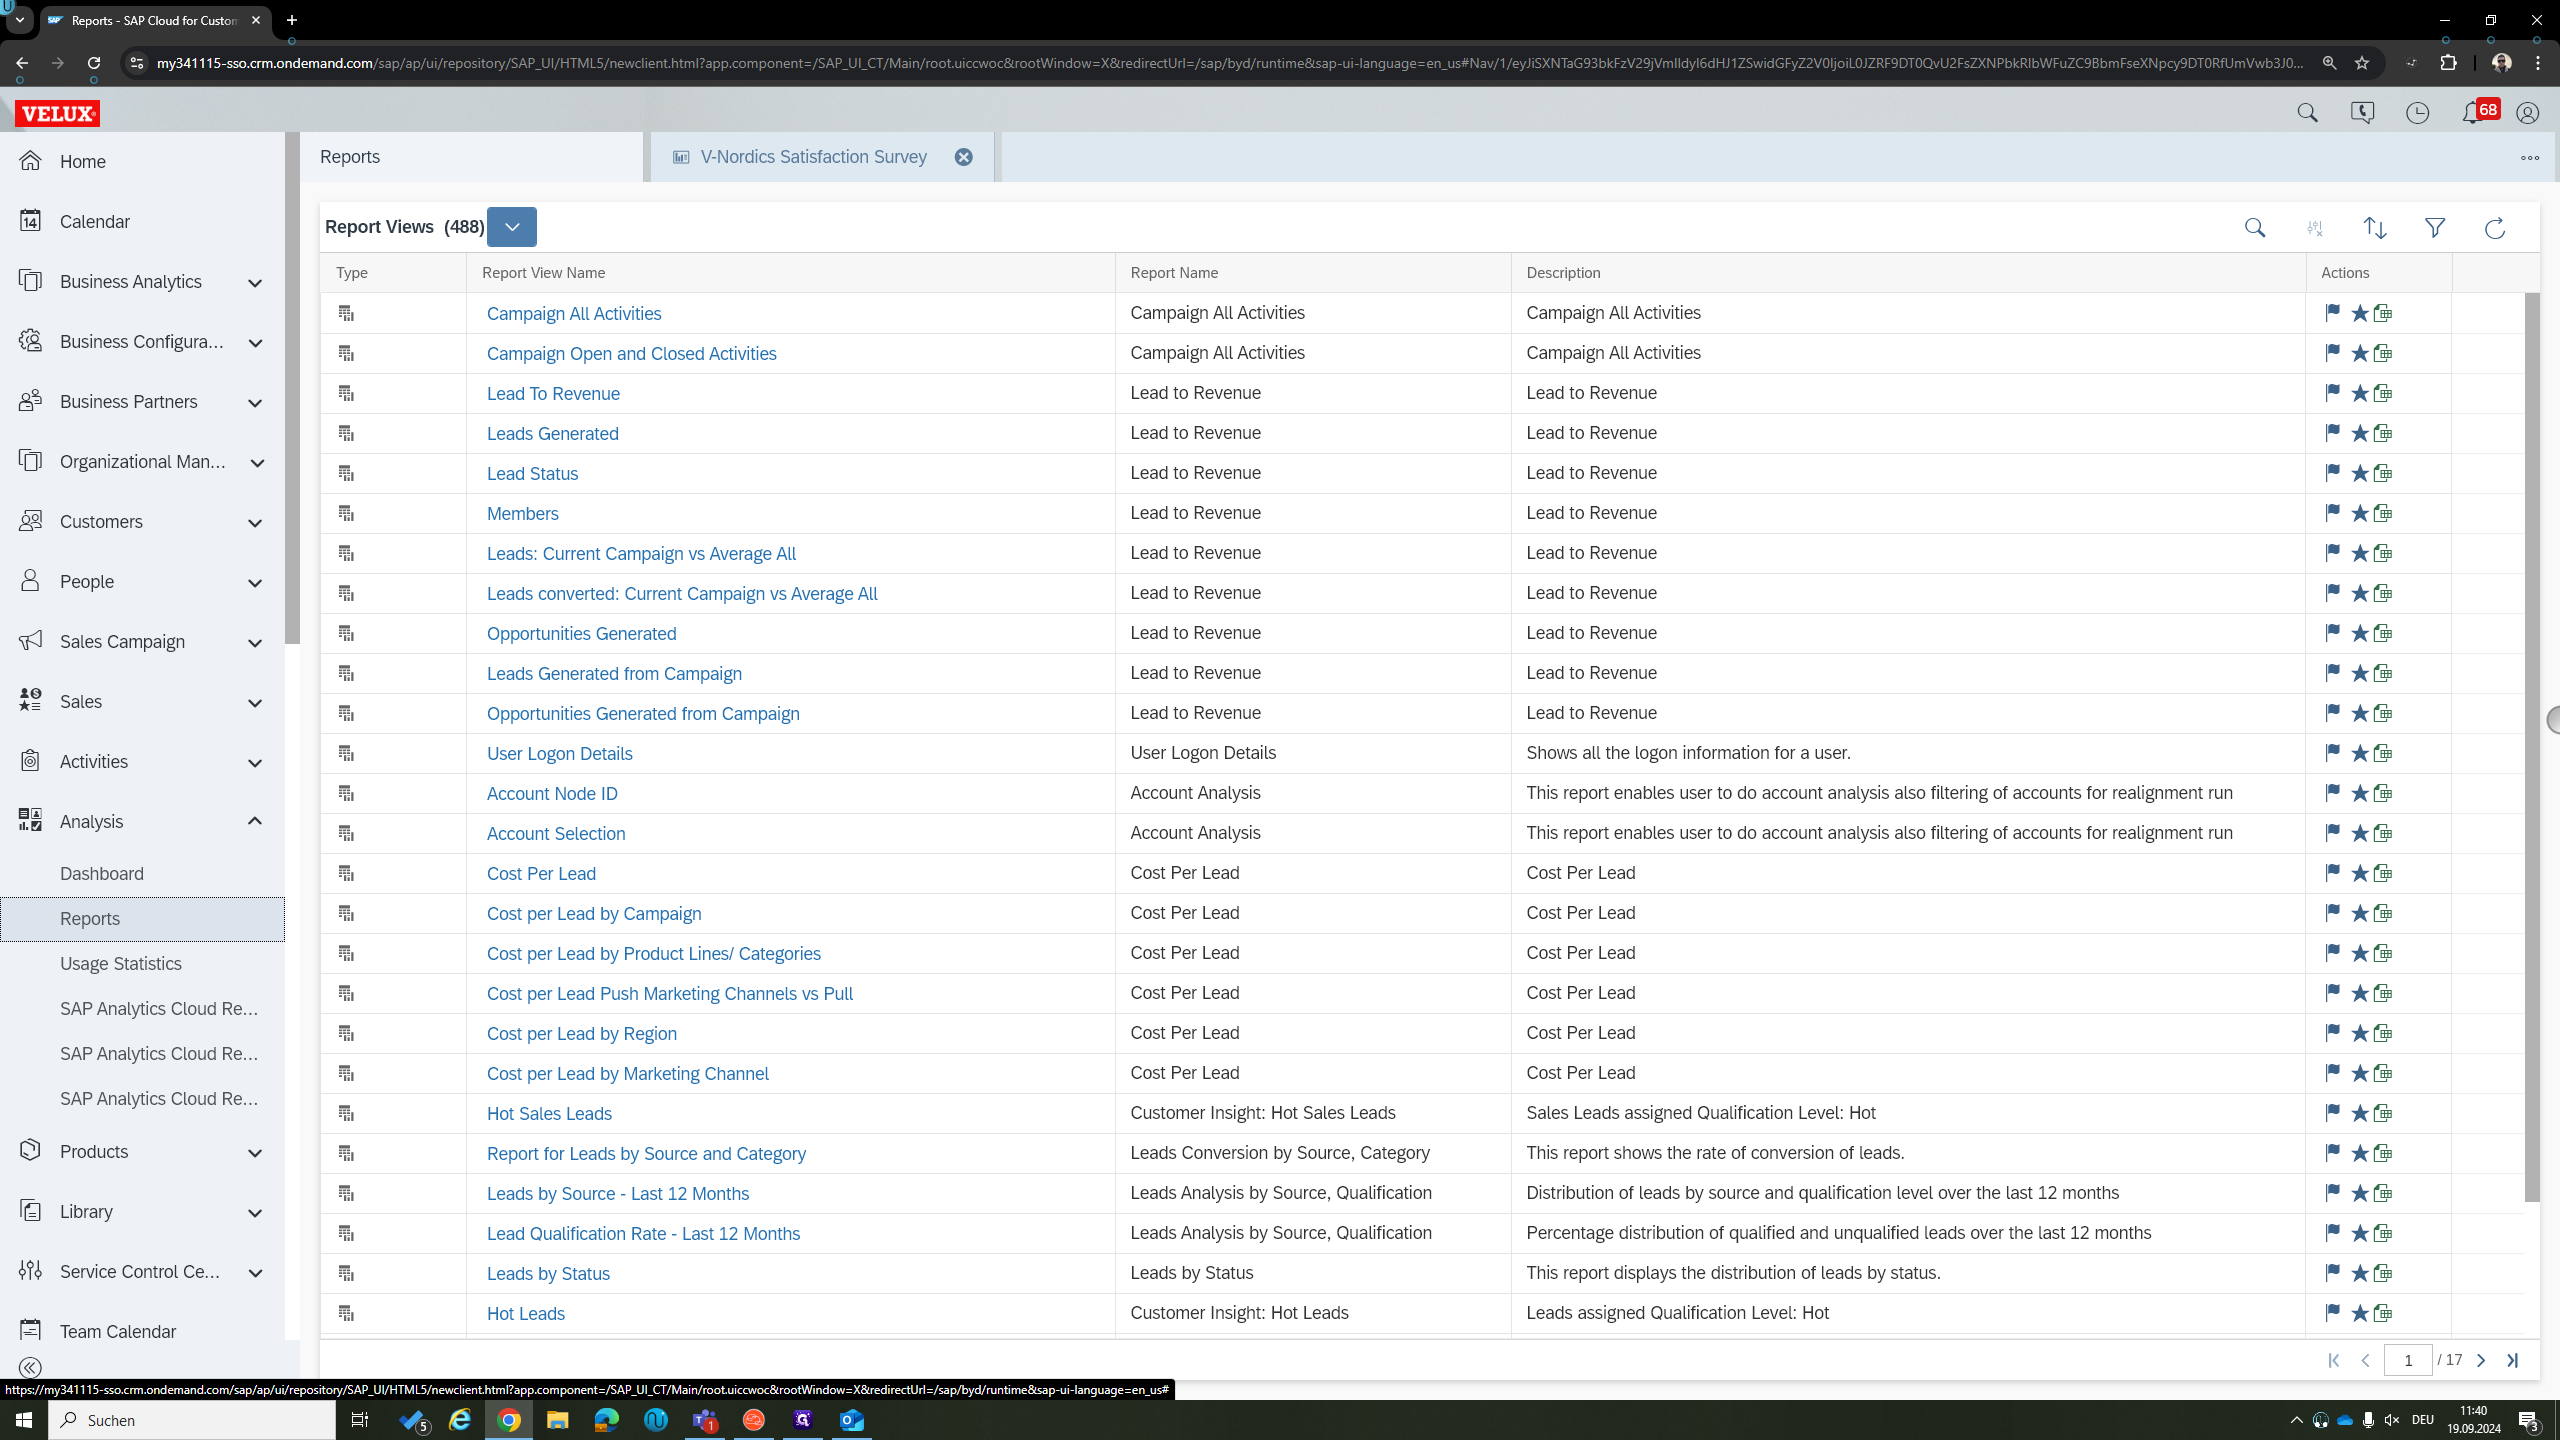
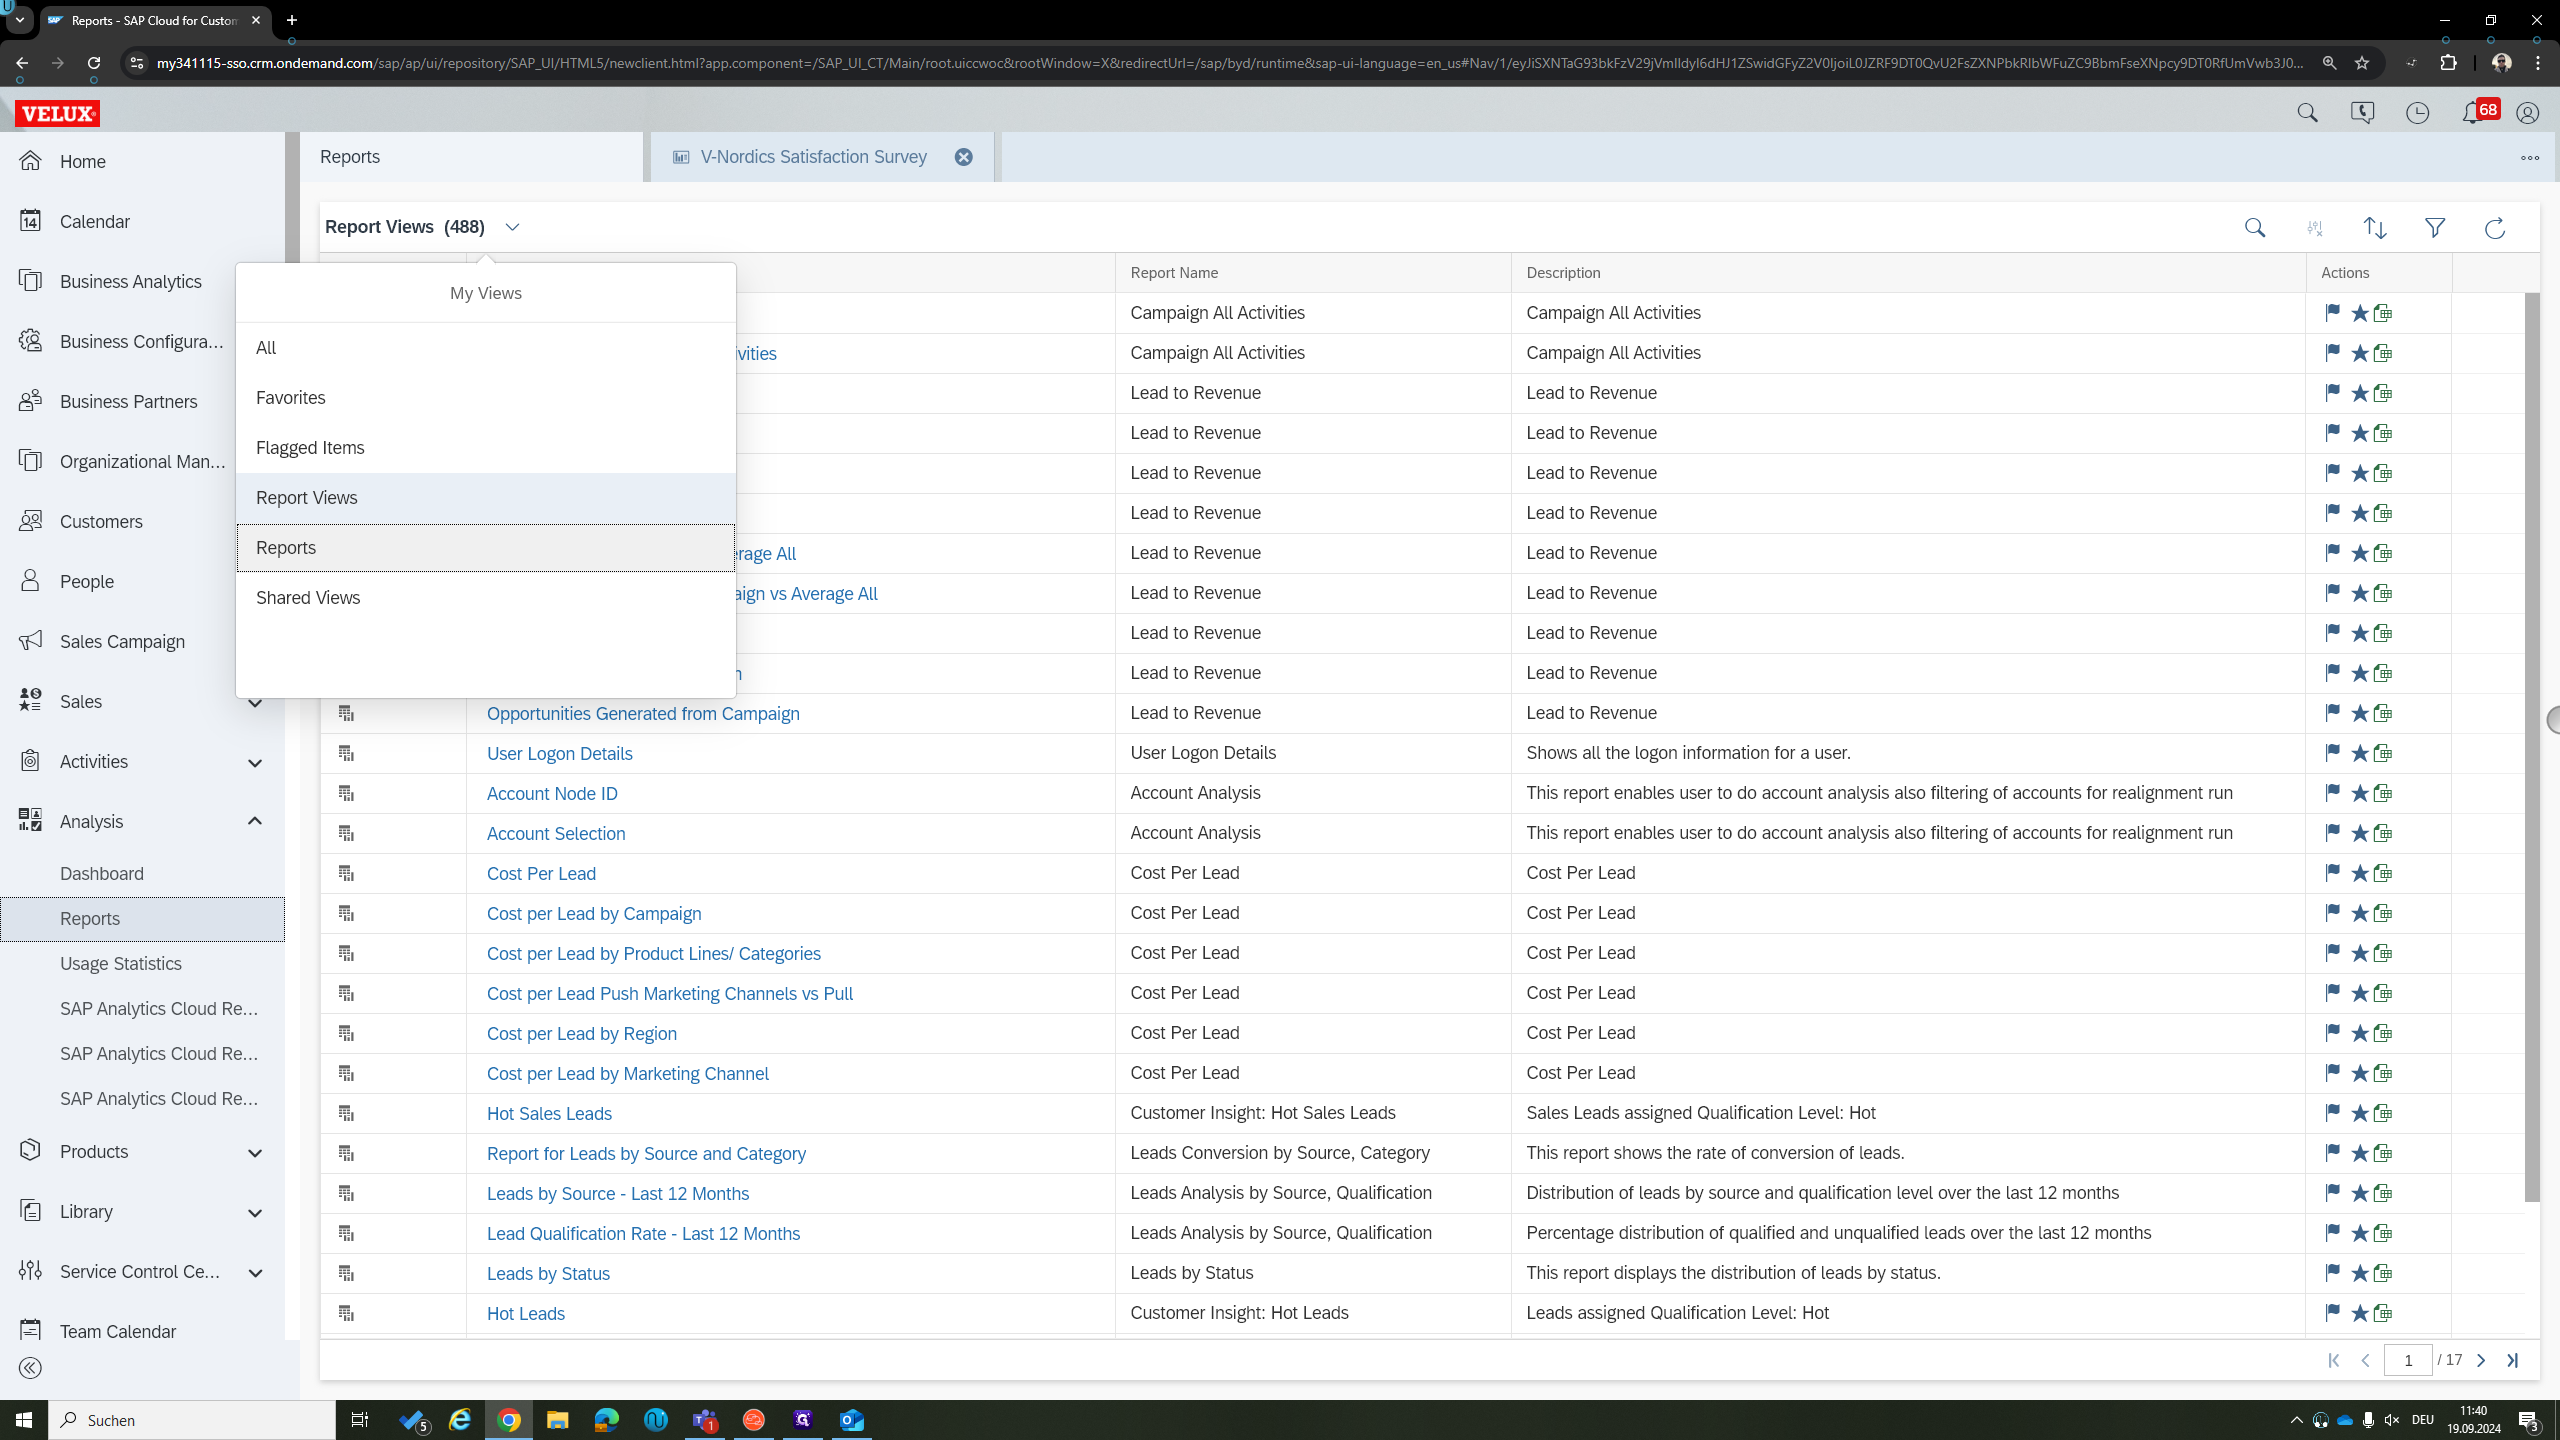
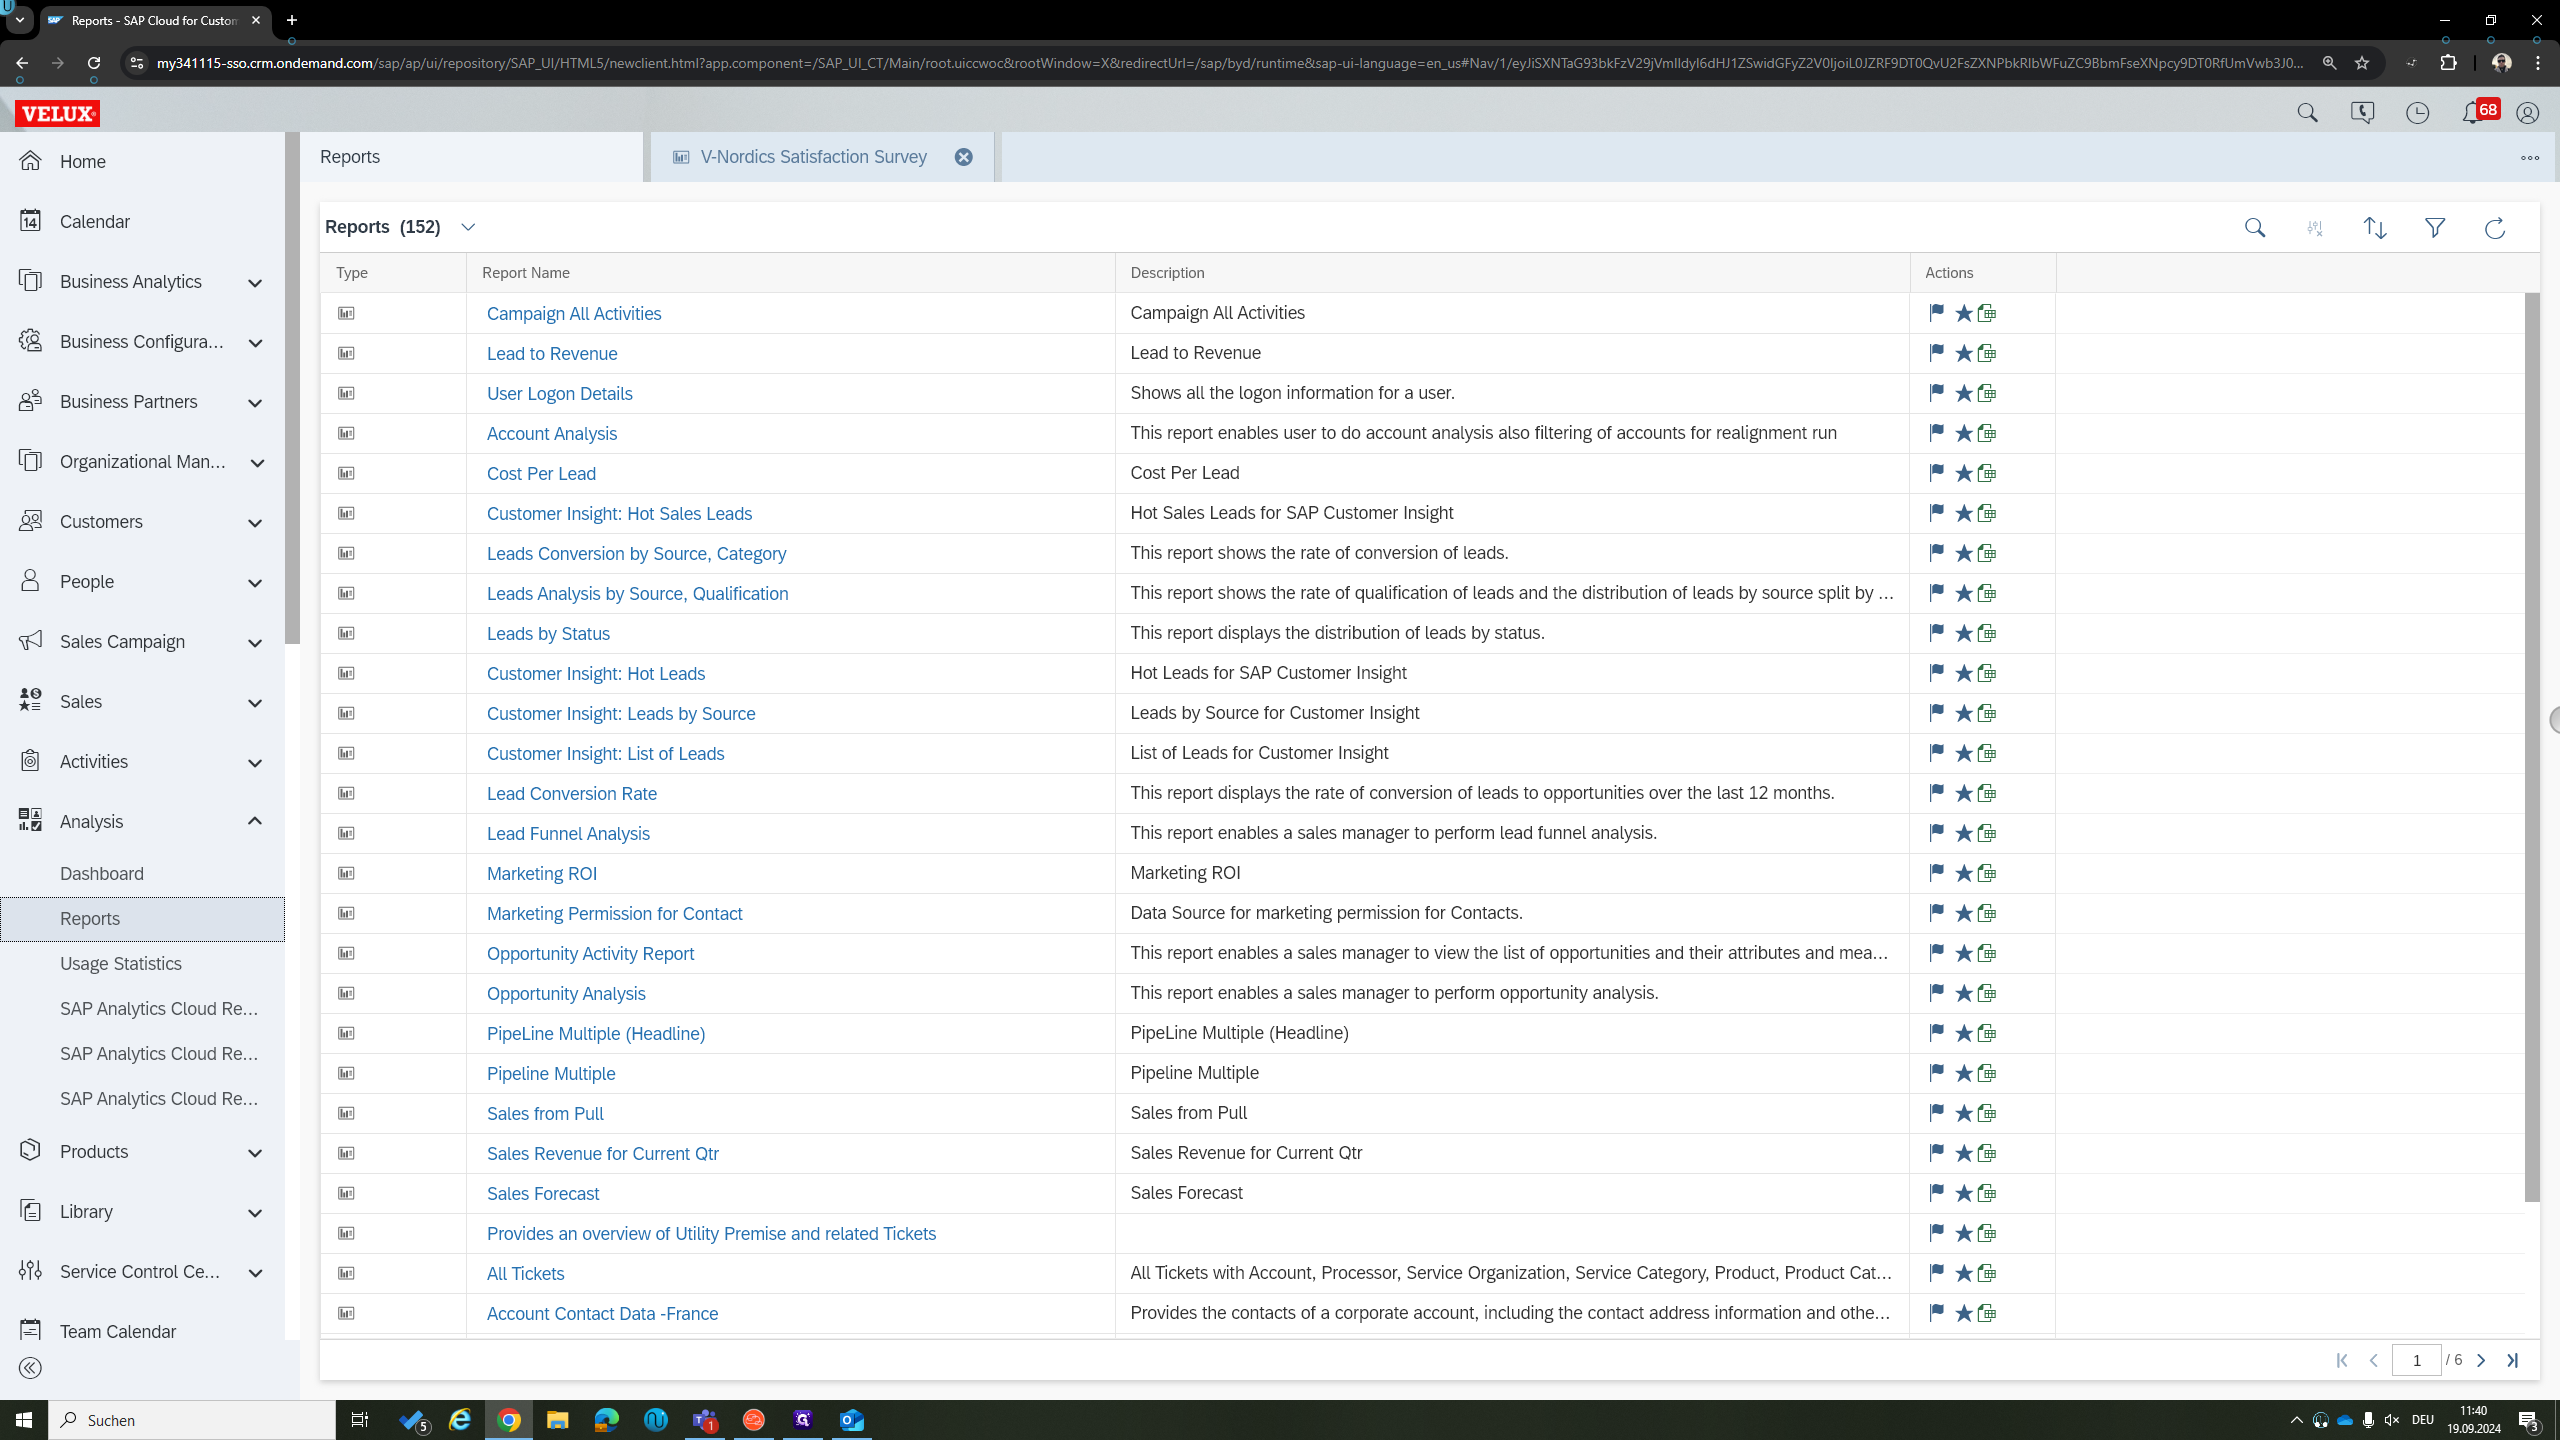
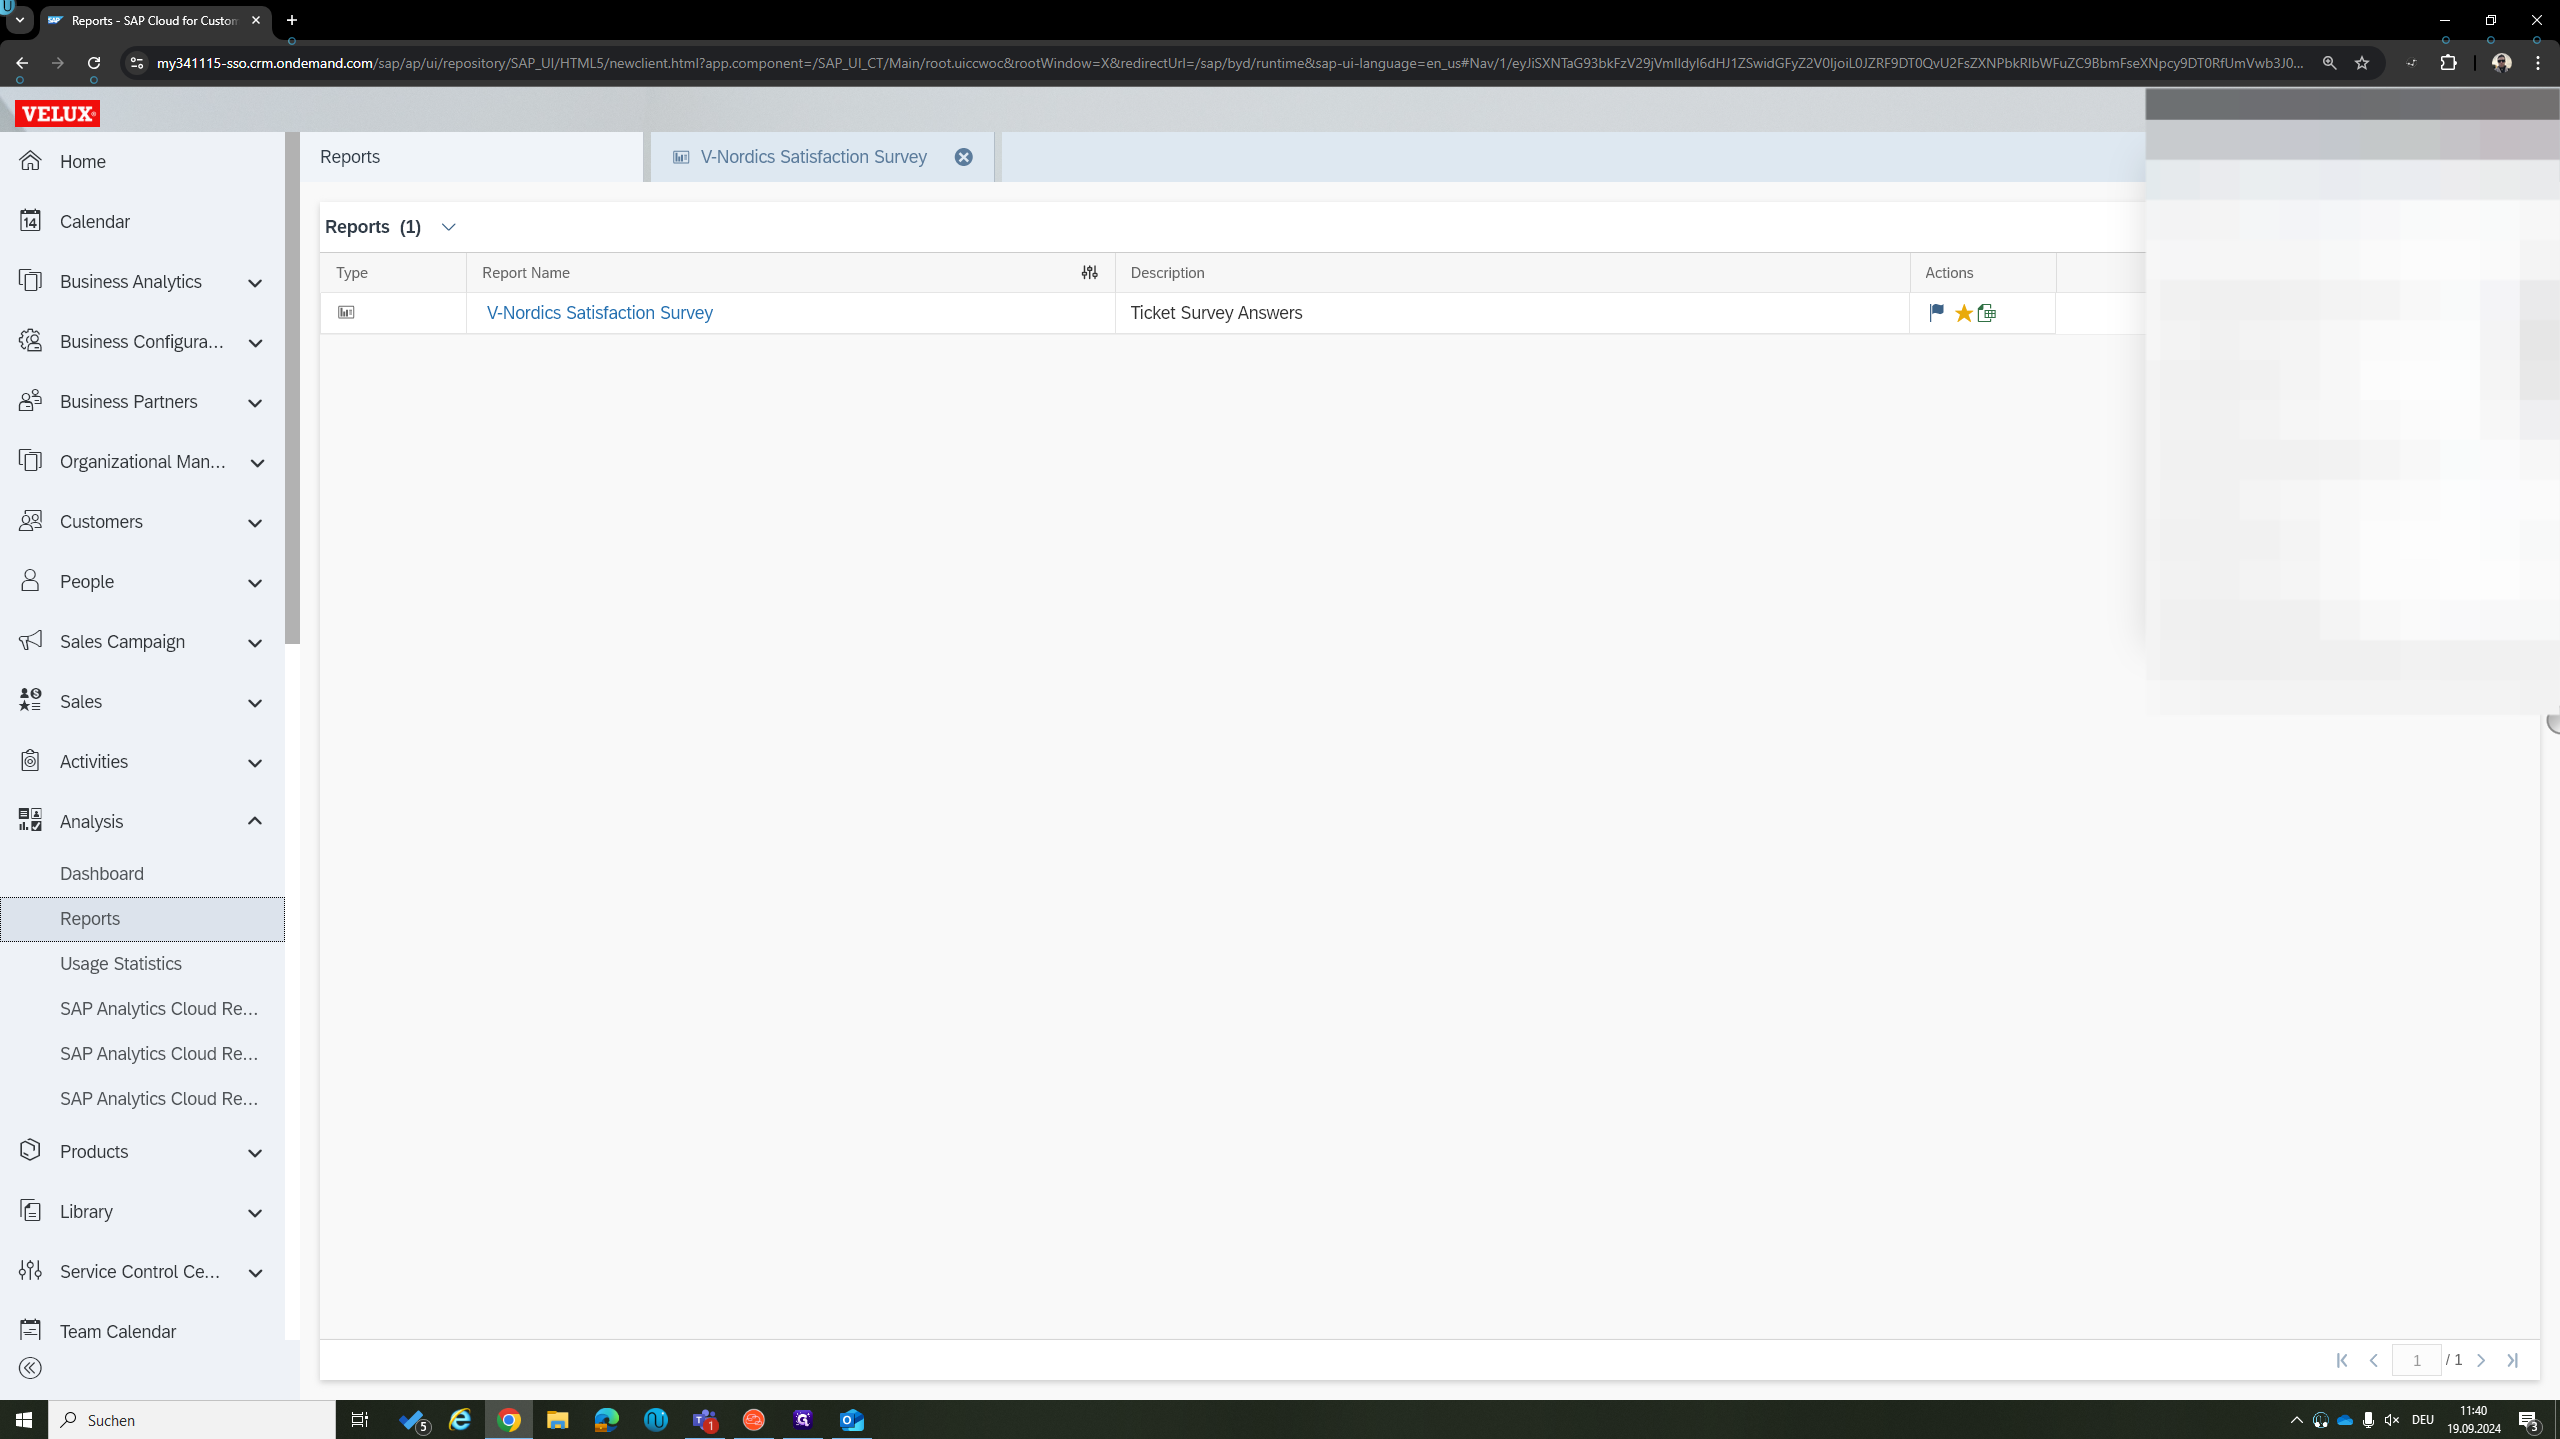
You can search for satisfaction in this case.
Enable this report as a favorite. This will save it under productivity with the clock and in favorites.
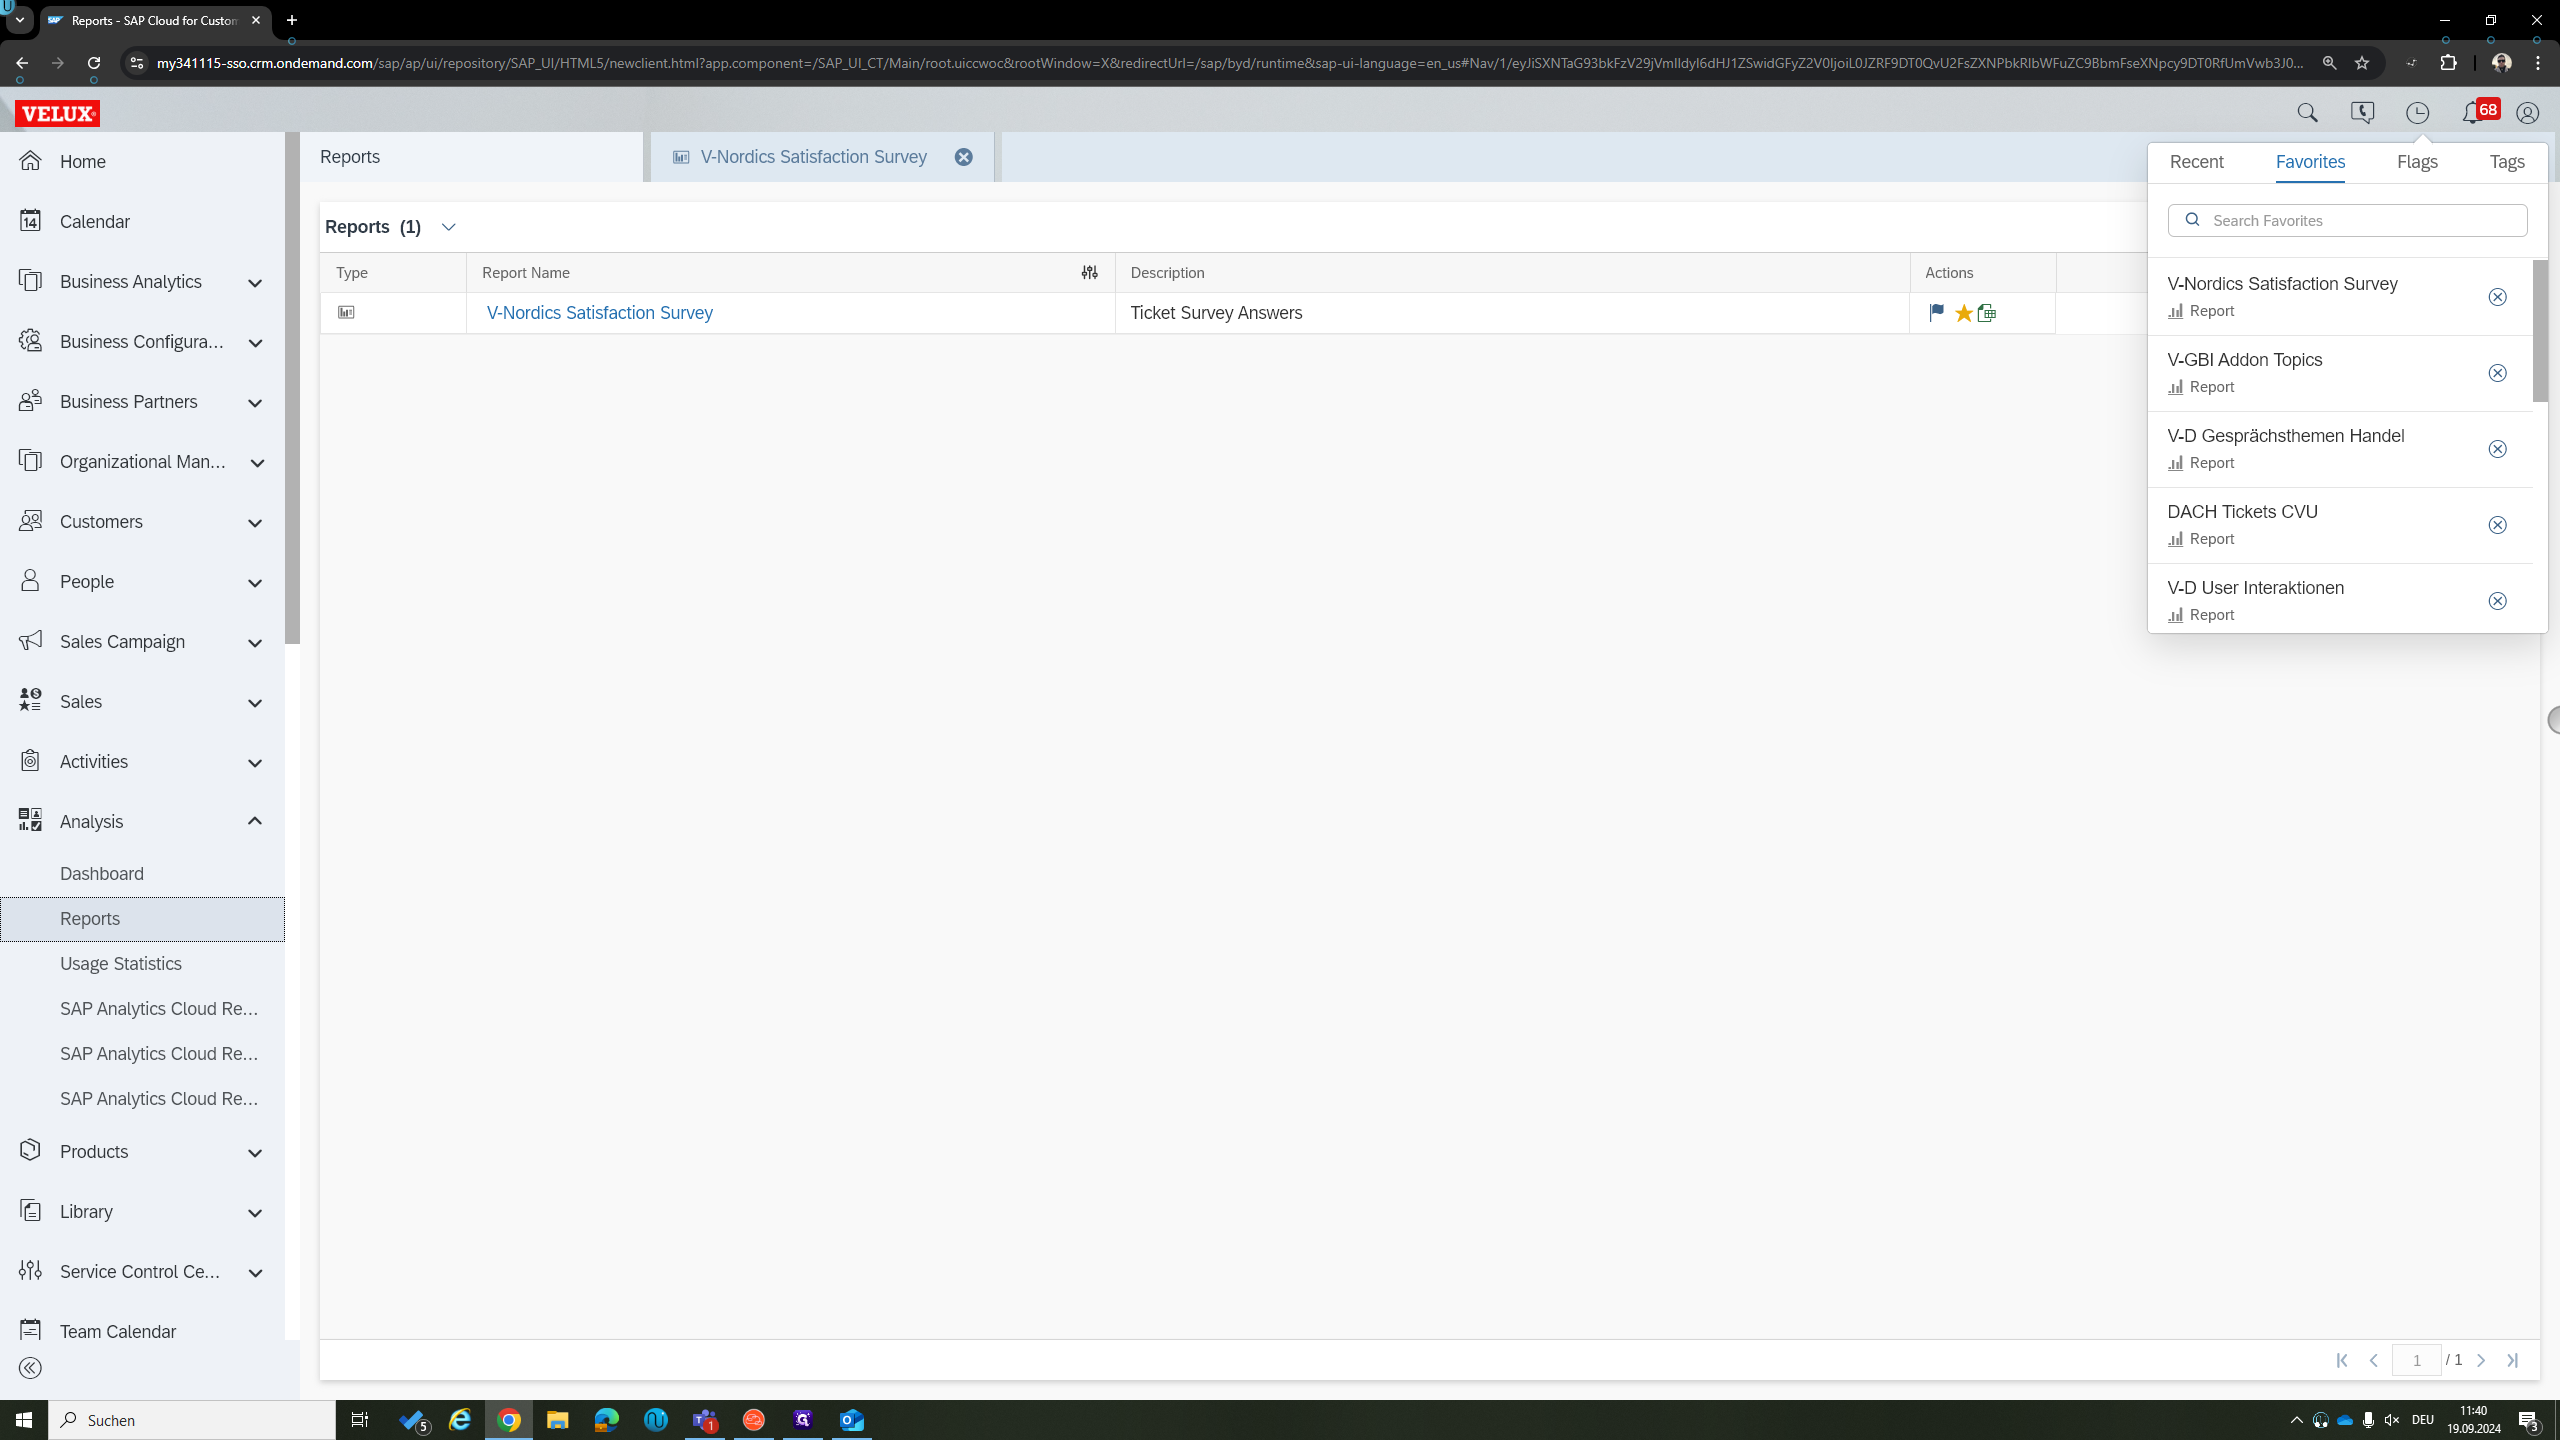
That's where these reports are stored, which you mark as a favorite.
You can always access them quickly without going to the analysis.
Open the report.
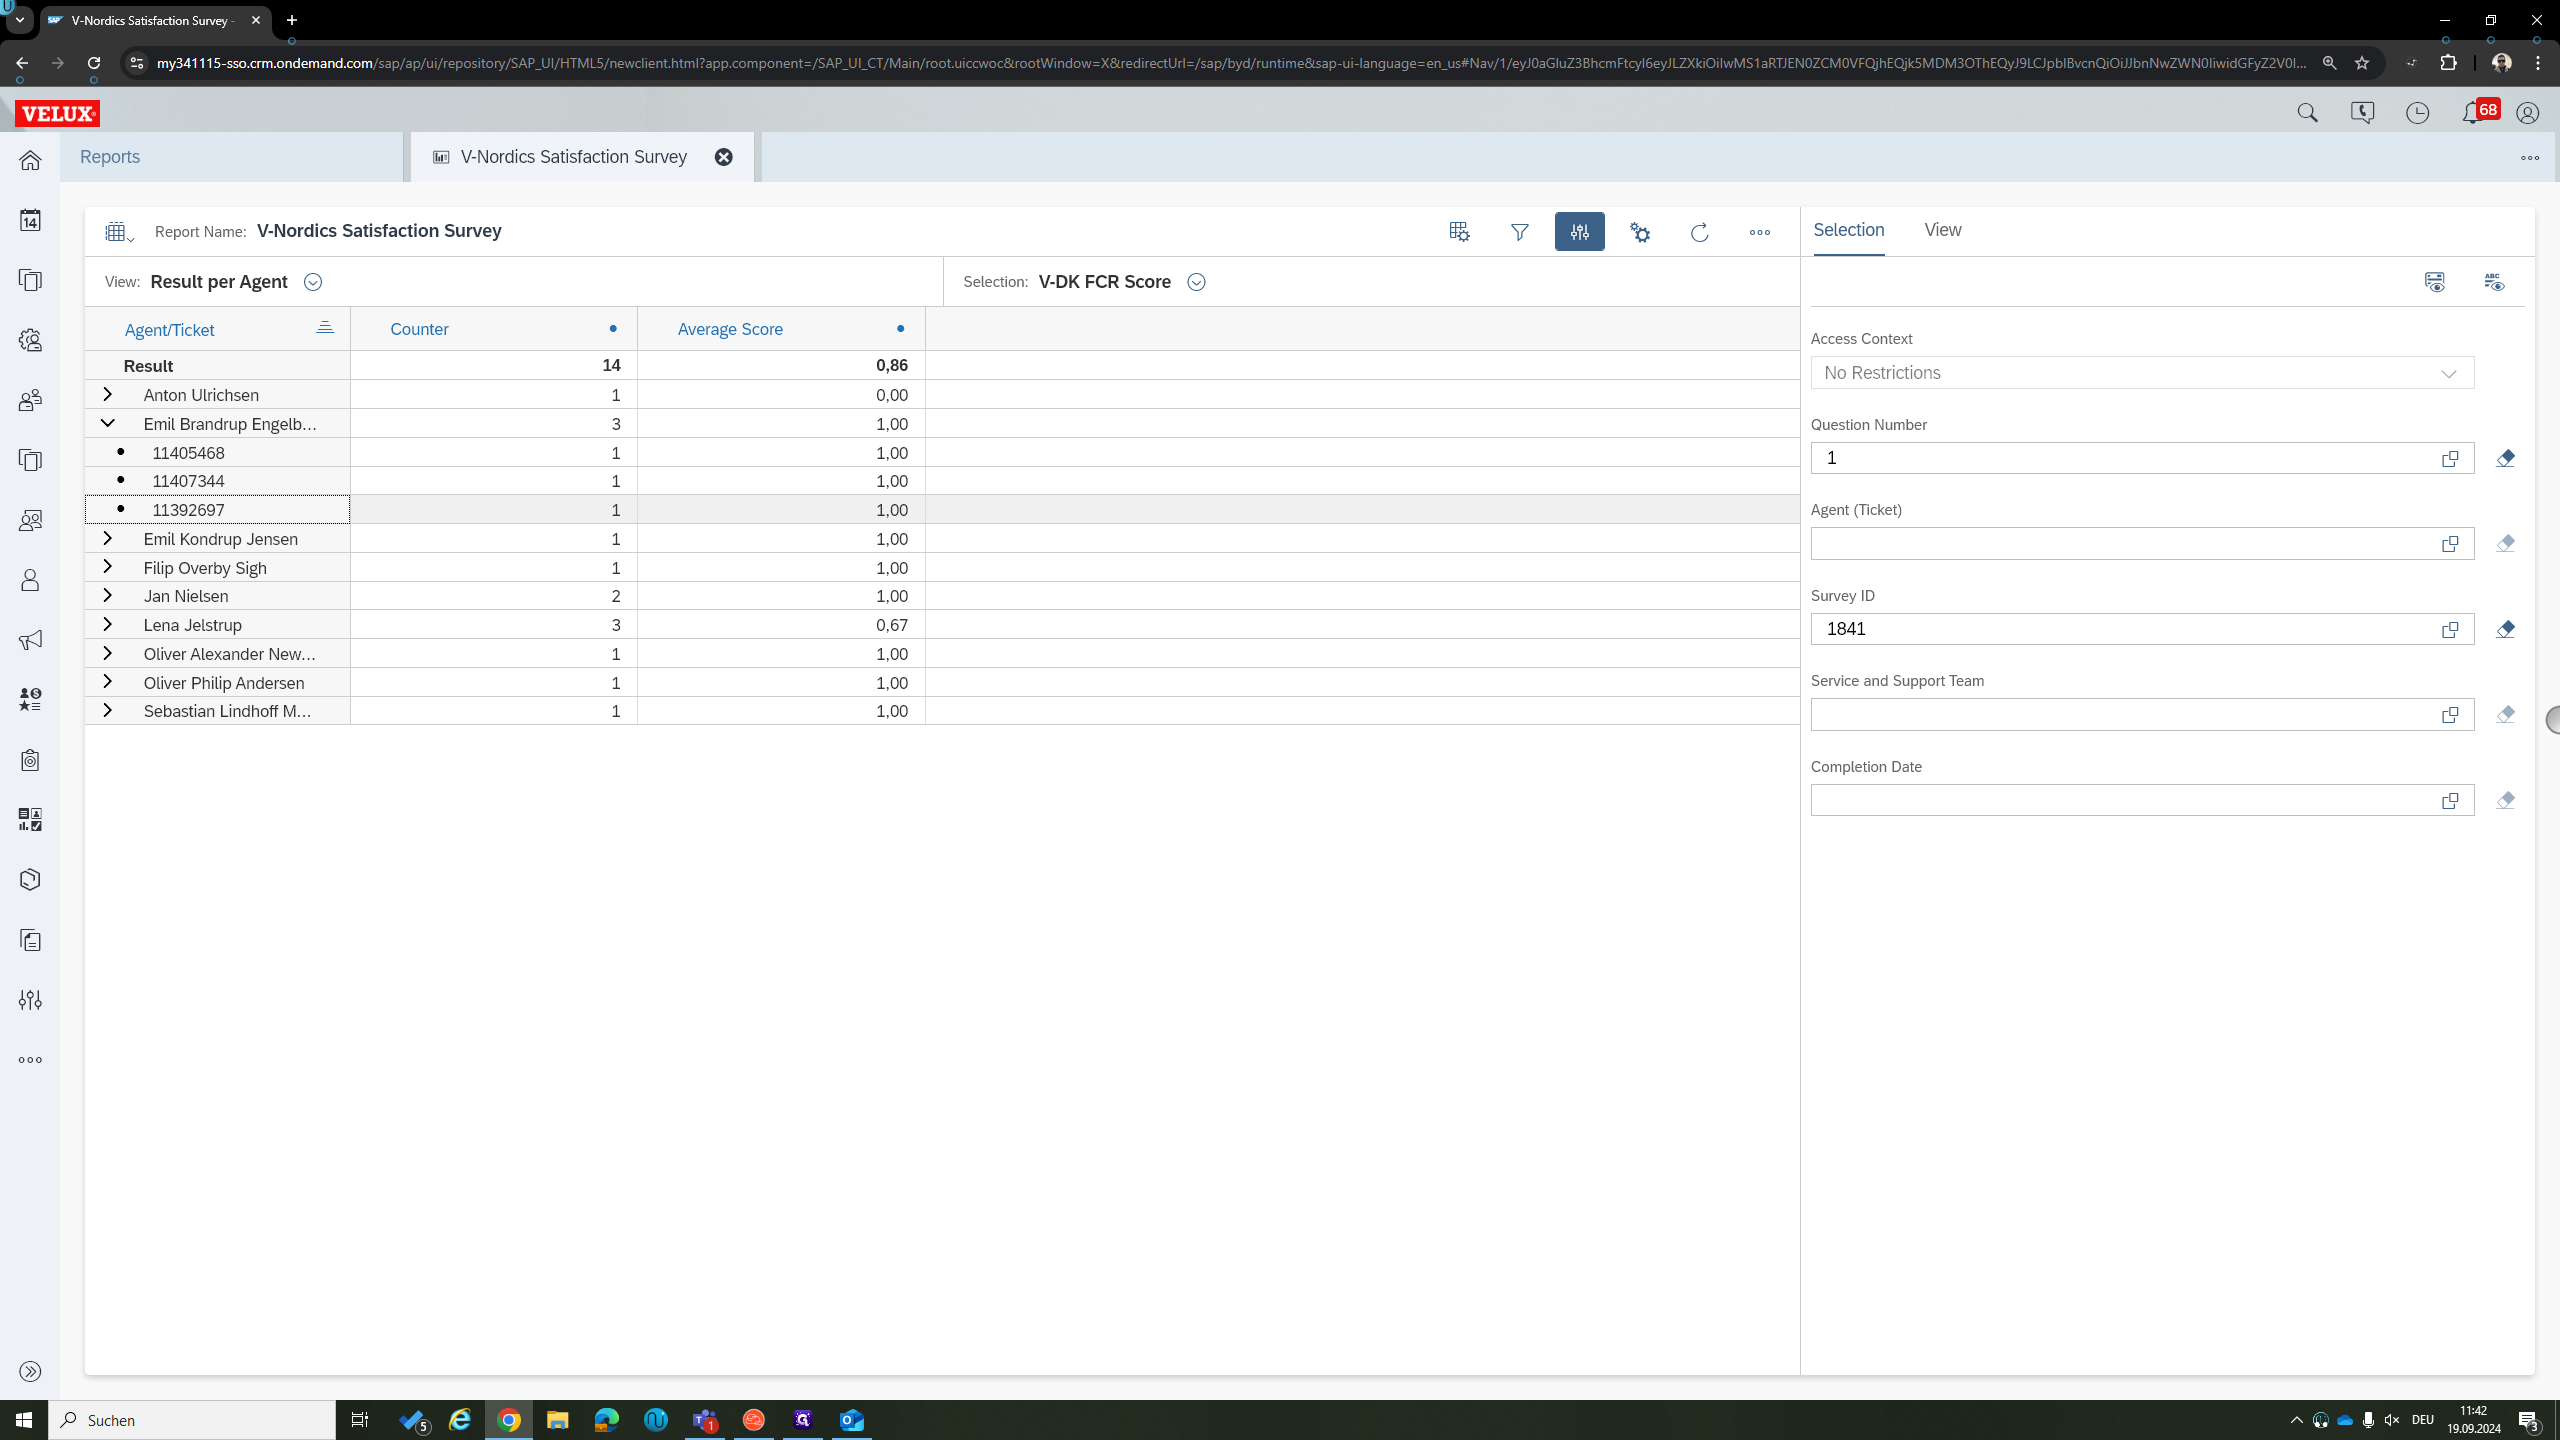
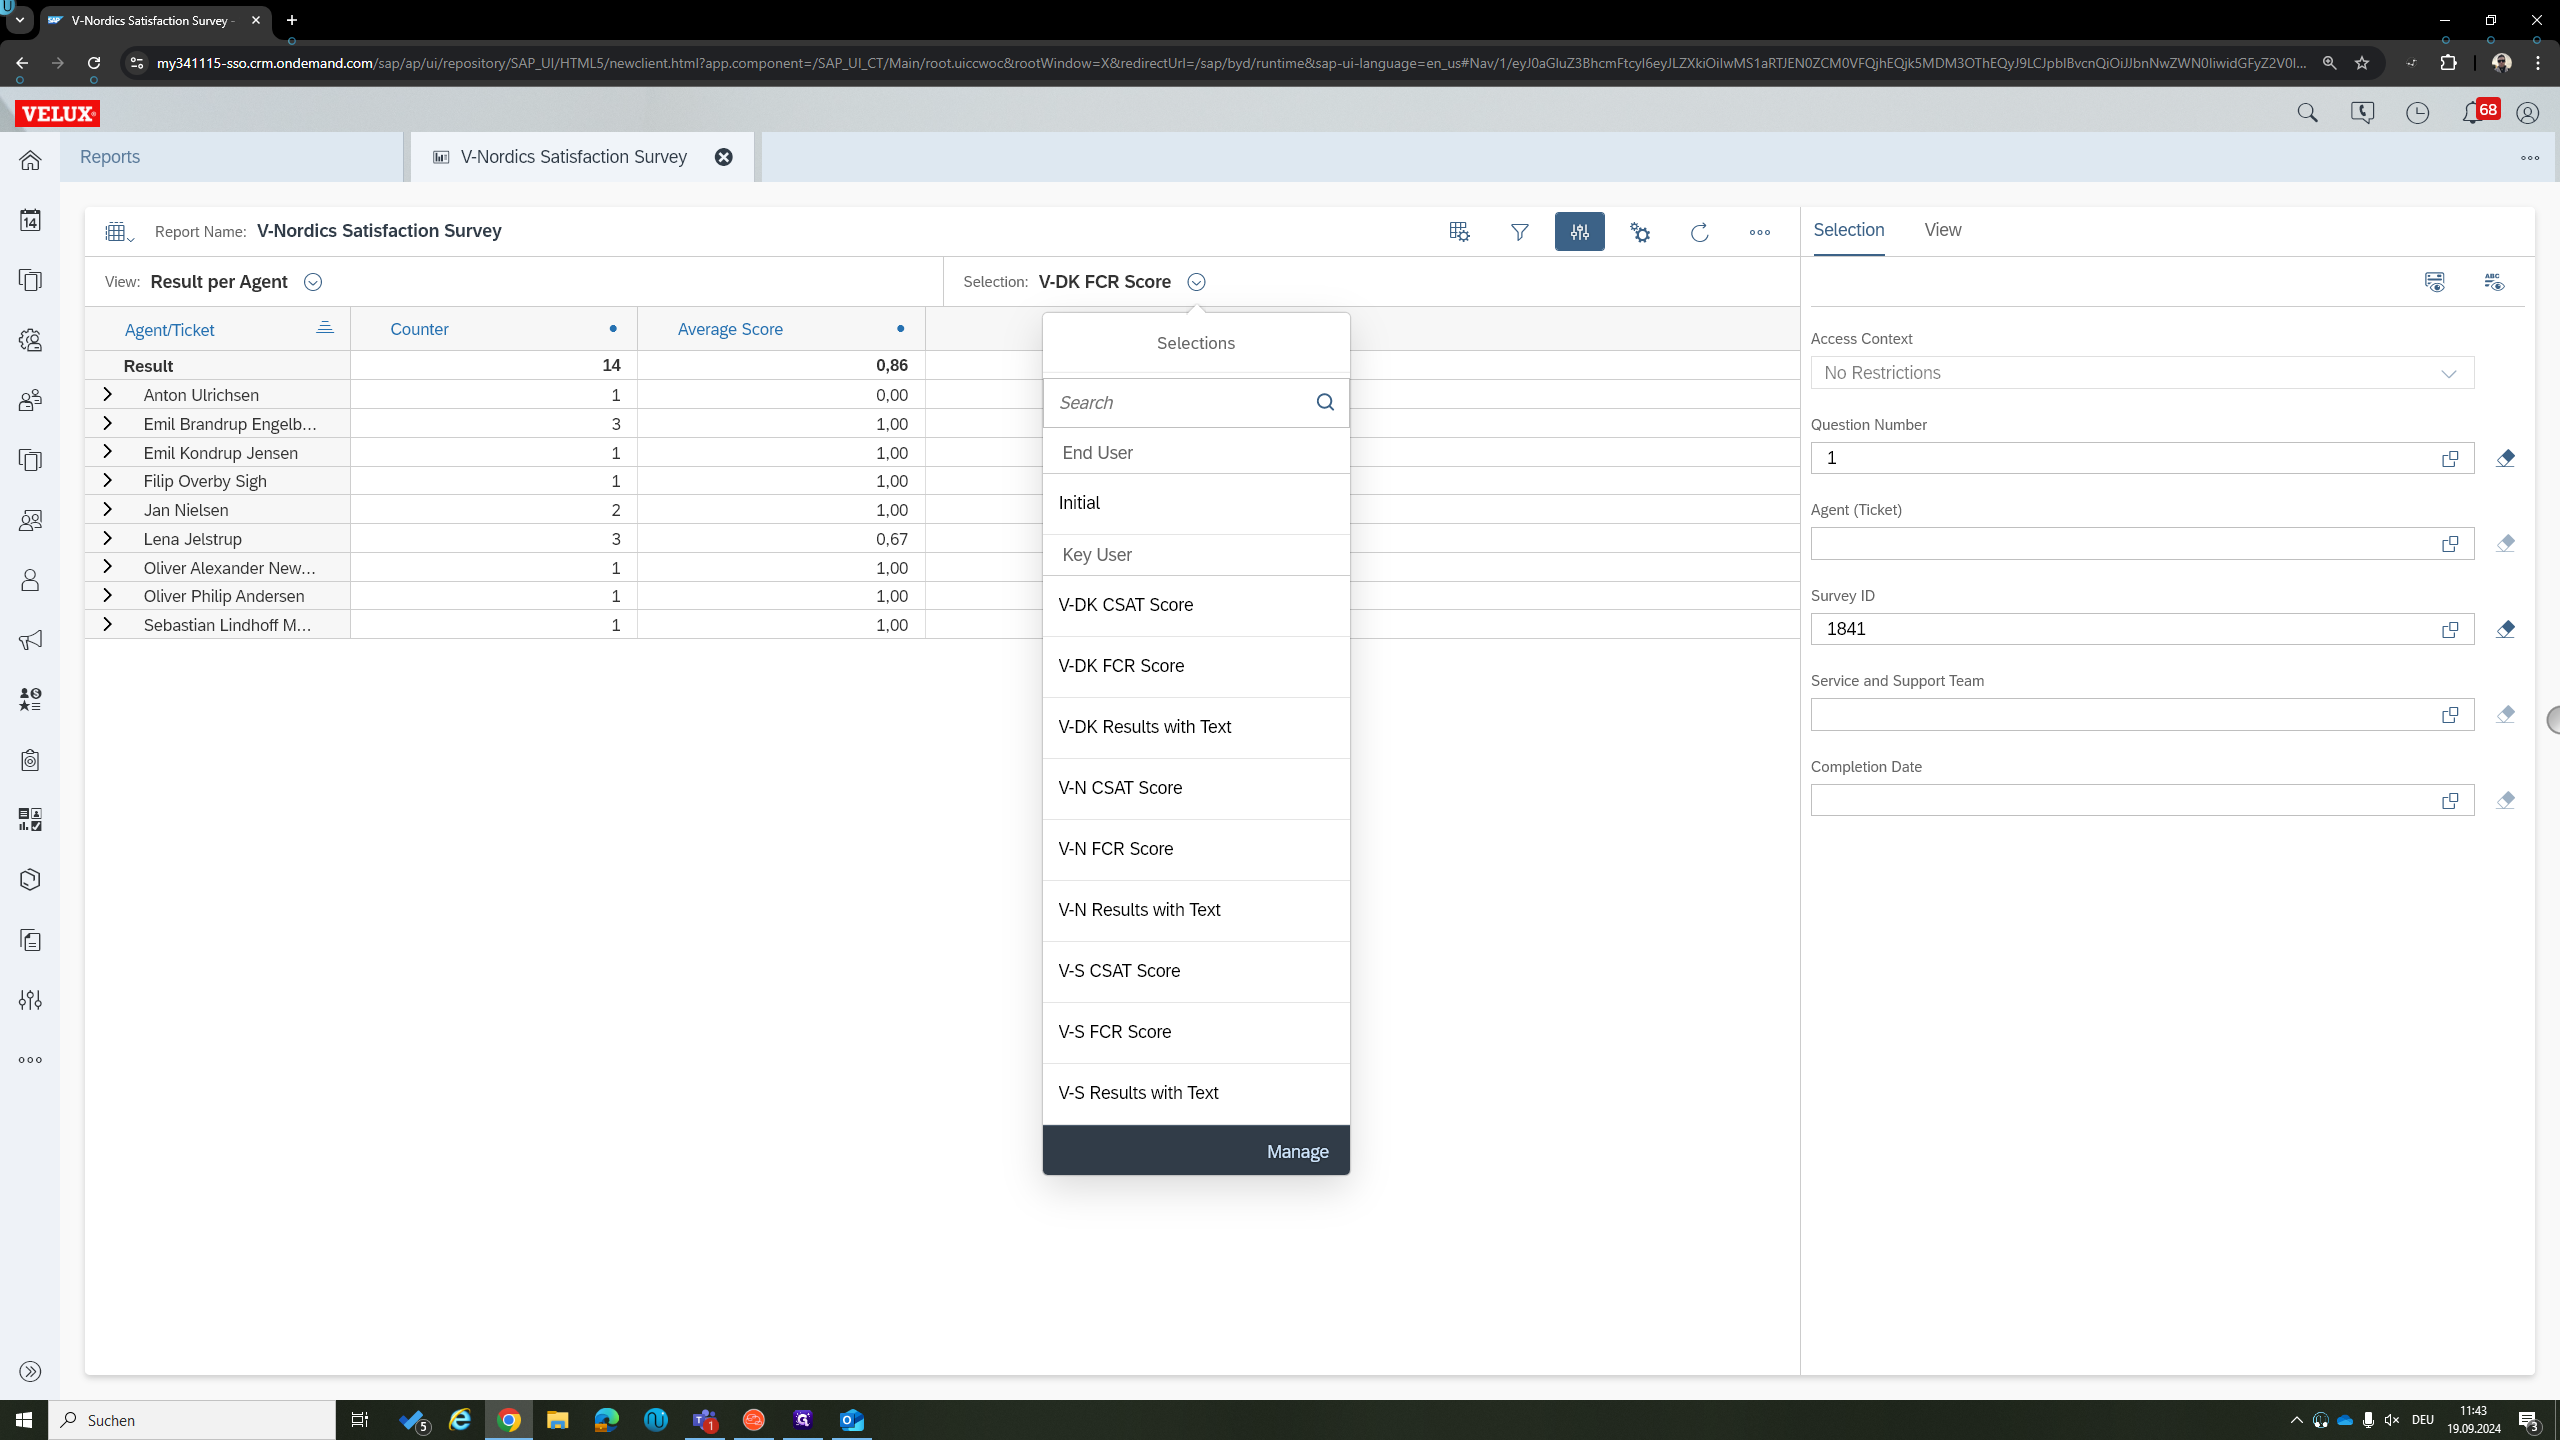
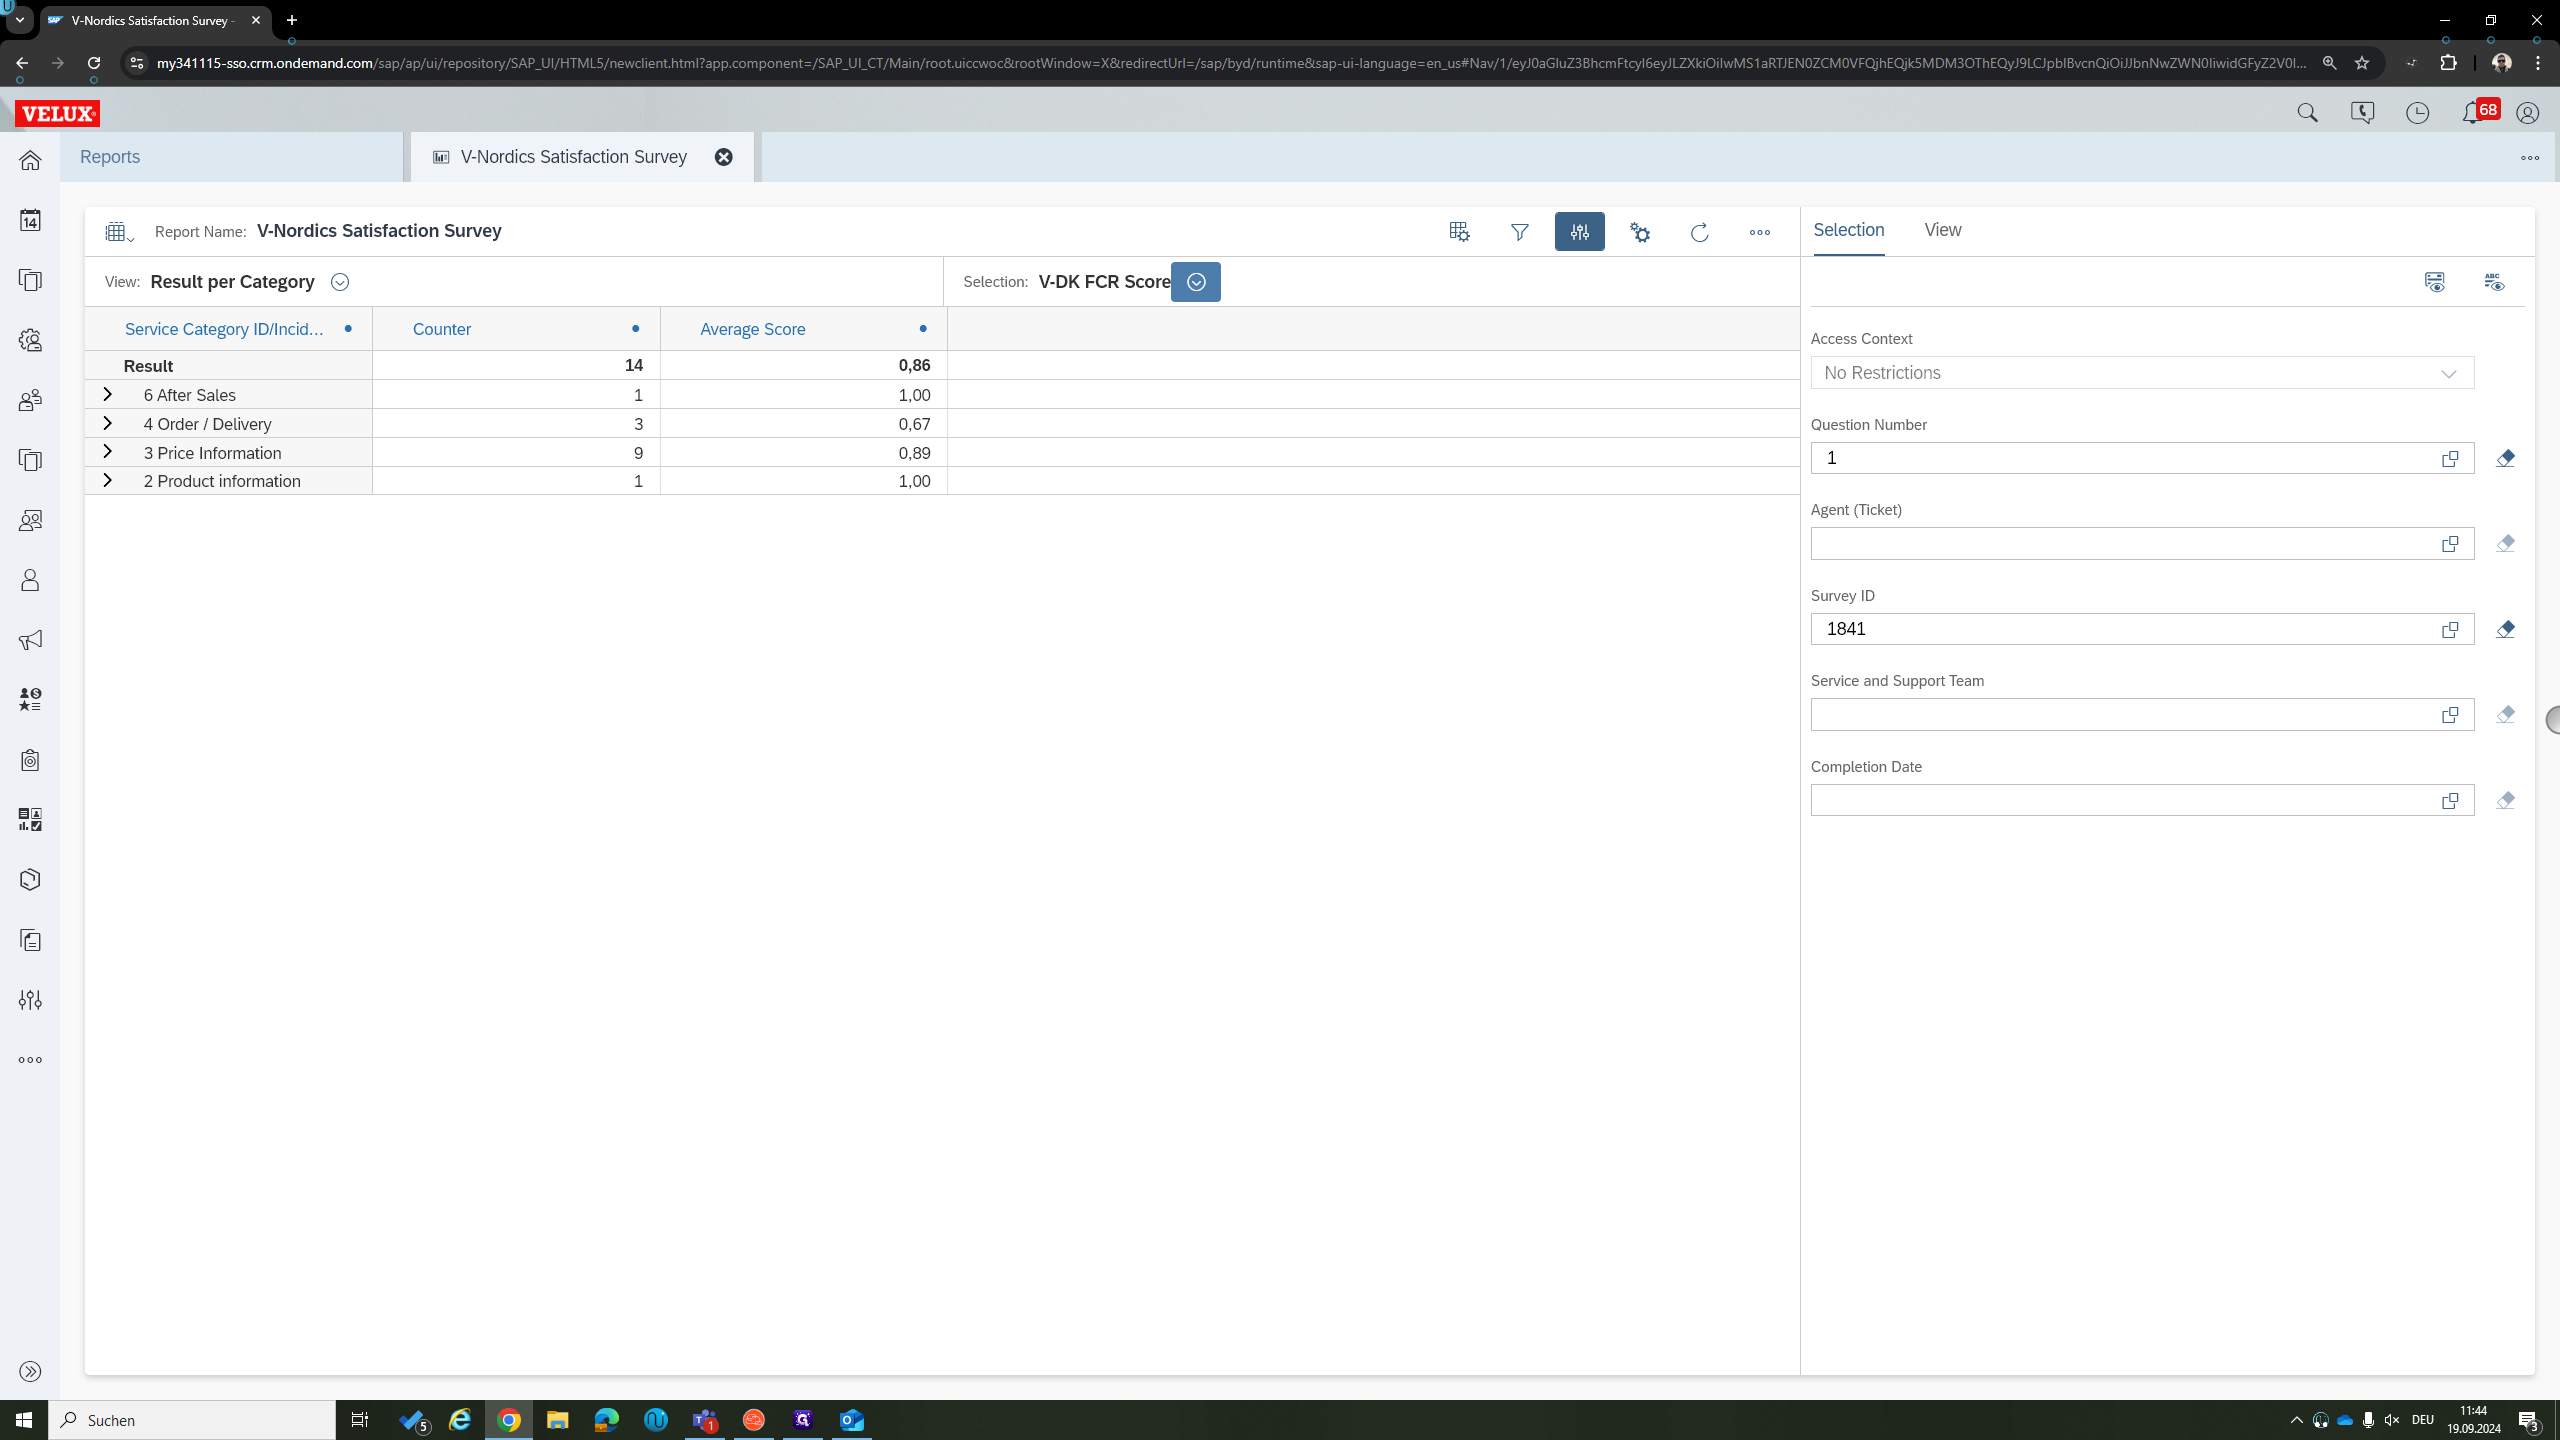
When you do, it will first load in a standard view. For the Nordic satisfaction survey, we select the Denmark FCR score. On the left-hand side, you can see the results per agent.
That is the standard view when the report opens: results per agent and the FCR score.
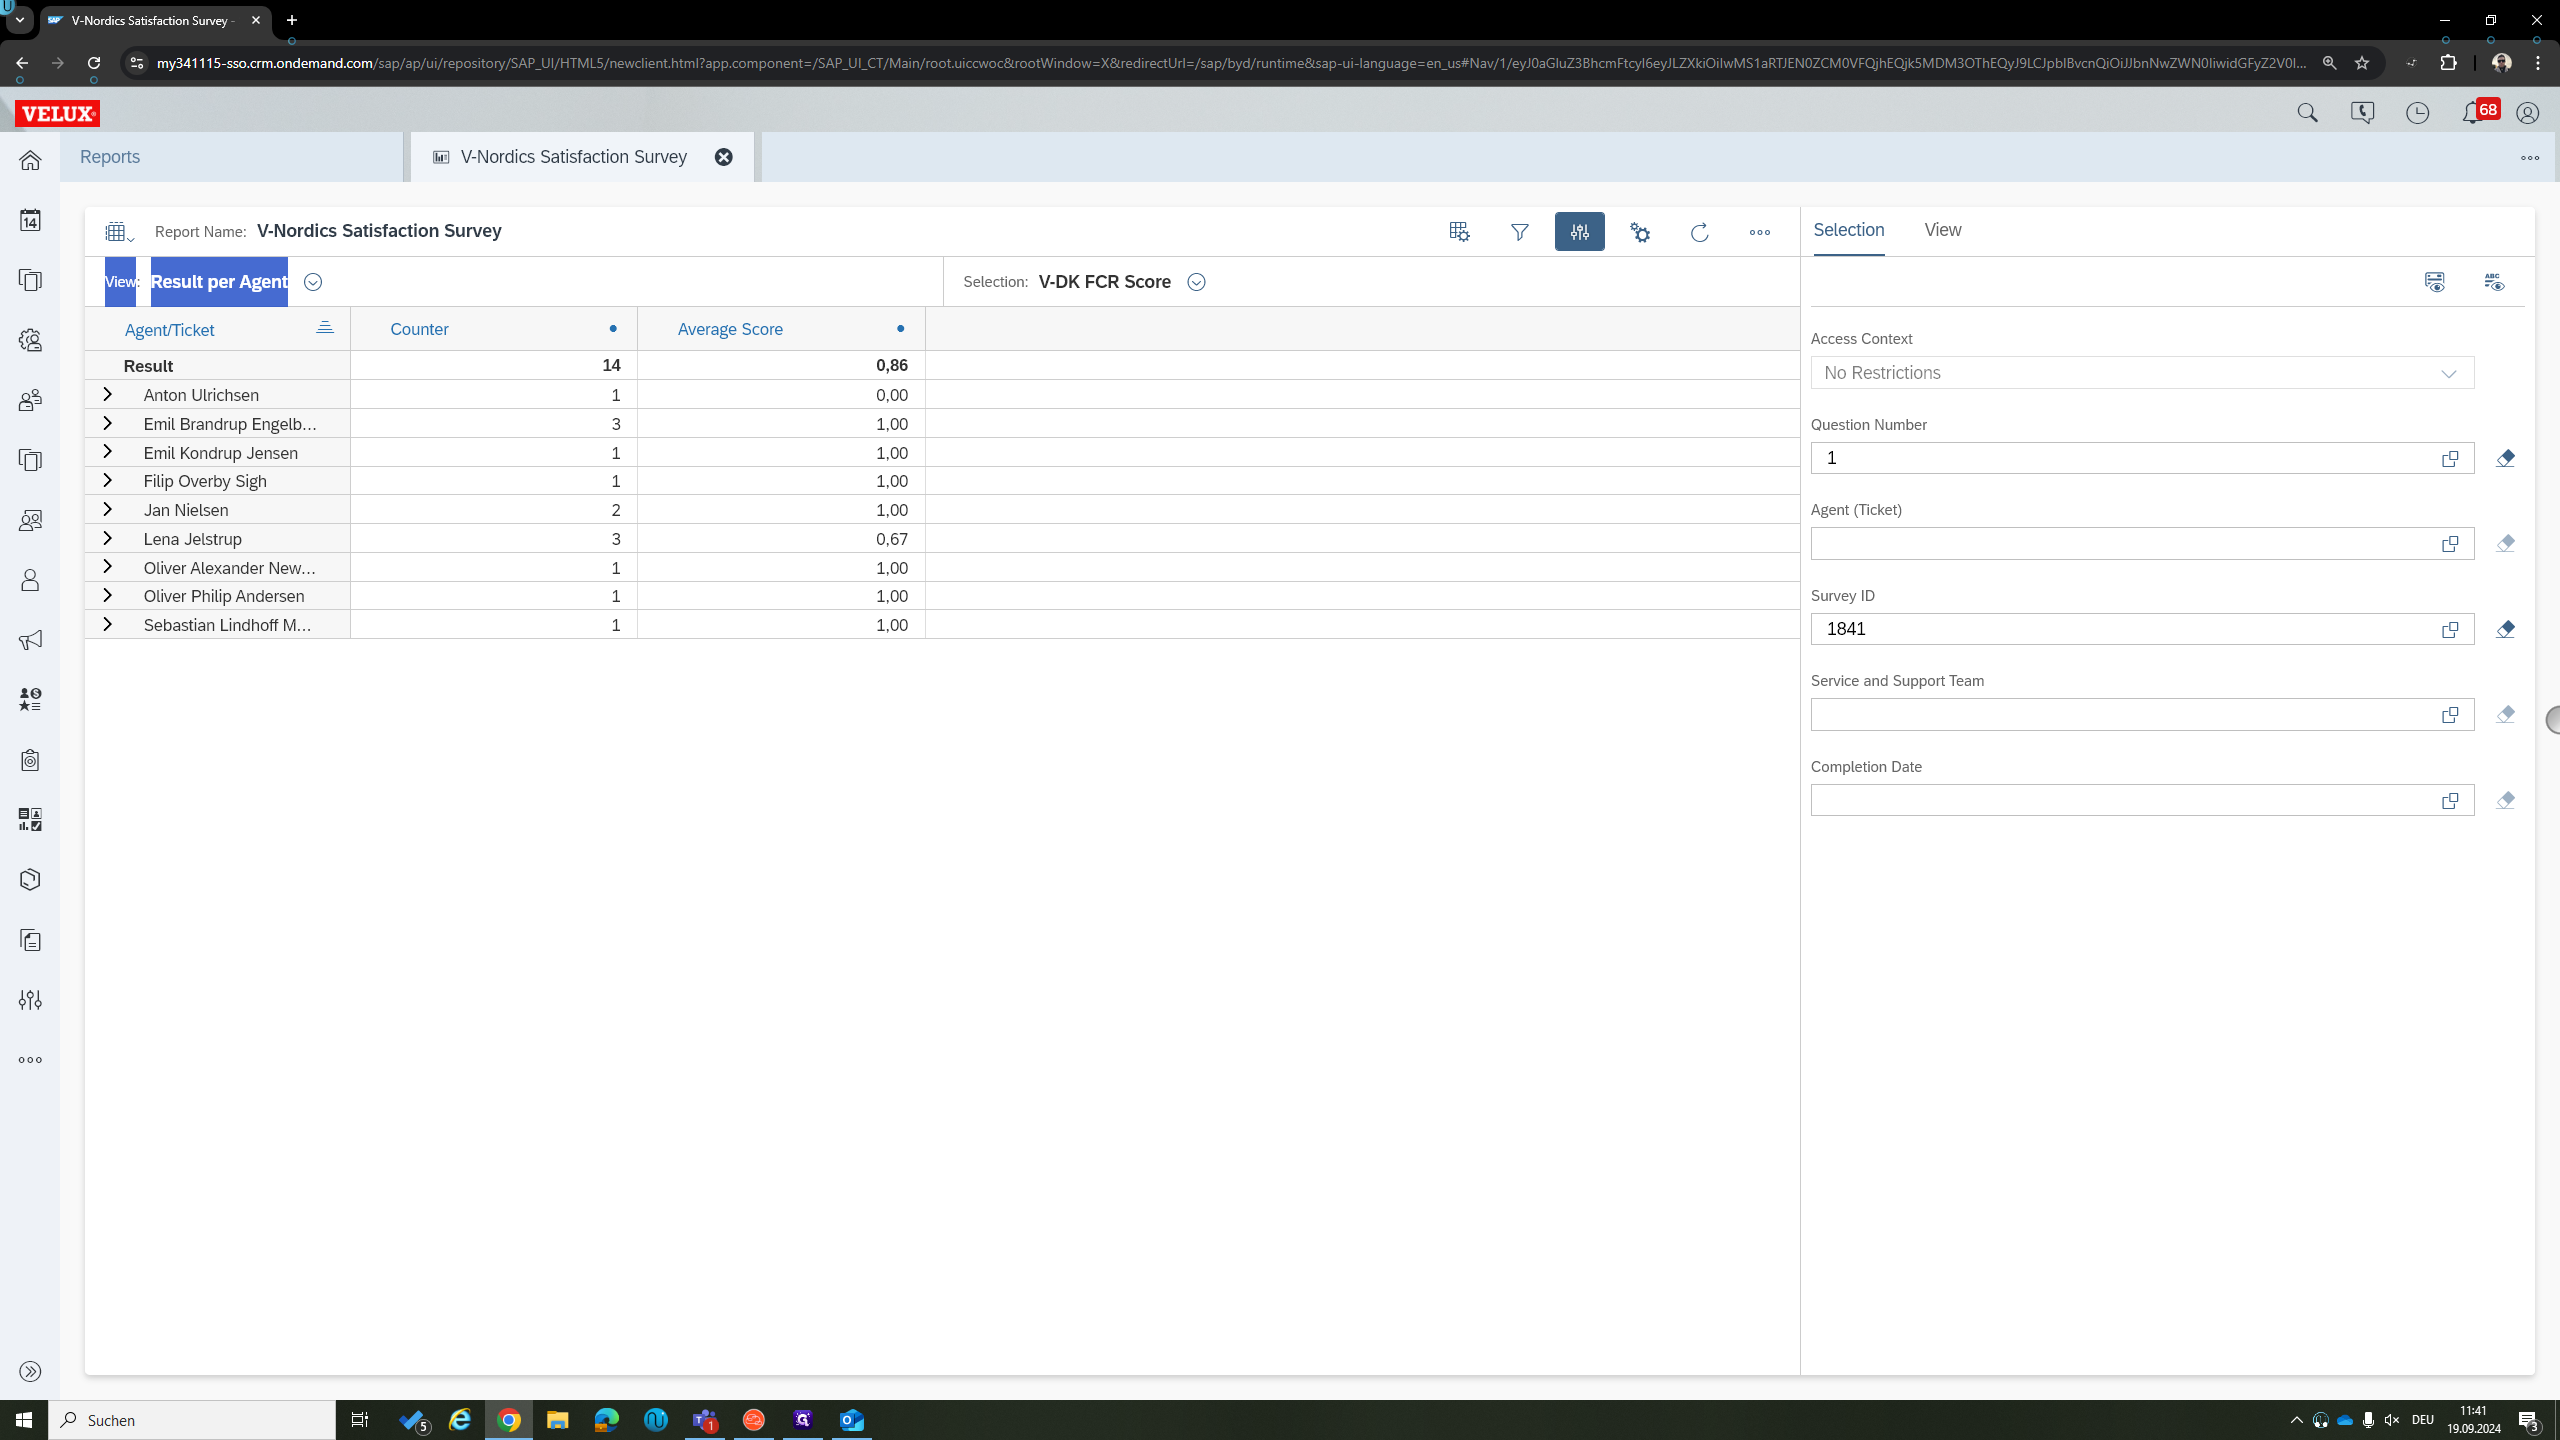
FCR score is the first question: Did we resolve your request to your satisfaction today? A "yes" is counted as one, and a "no" is counted as zero.
In this case, you can see that the average score for this agent is one.
All of their requests, three in total (counter = 3), have been resolved with a 100% success rate. You can always find the average in the average column.
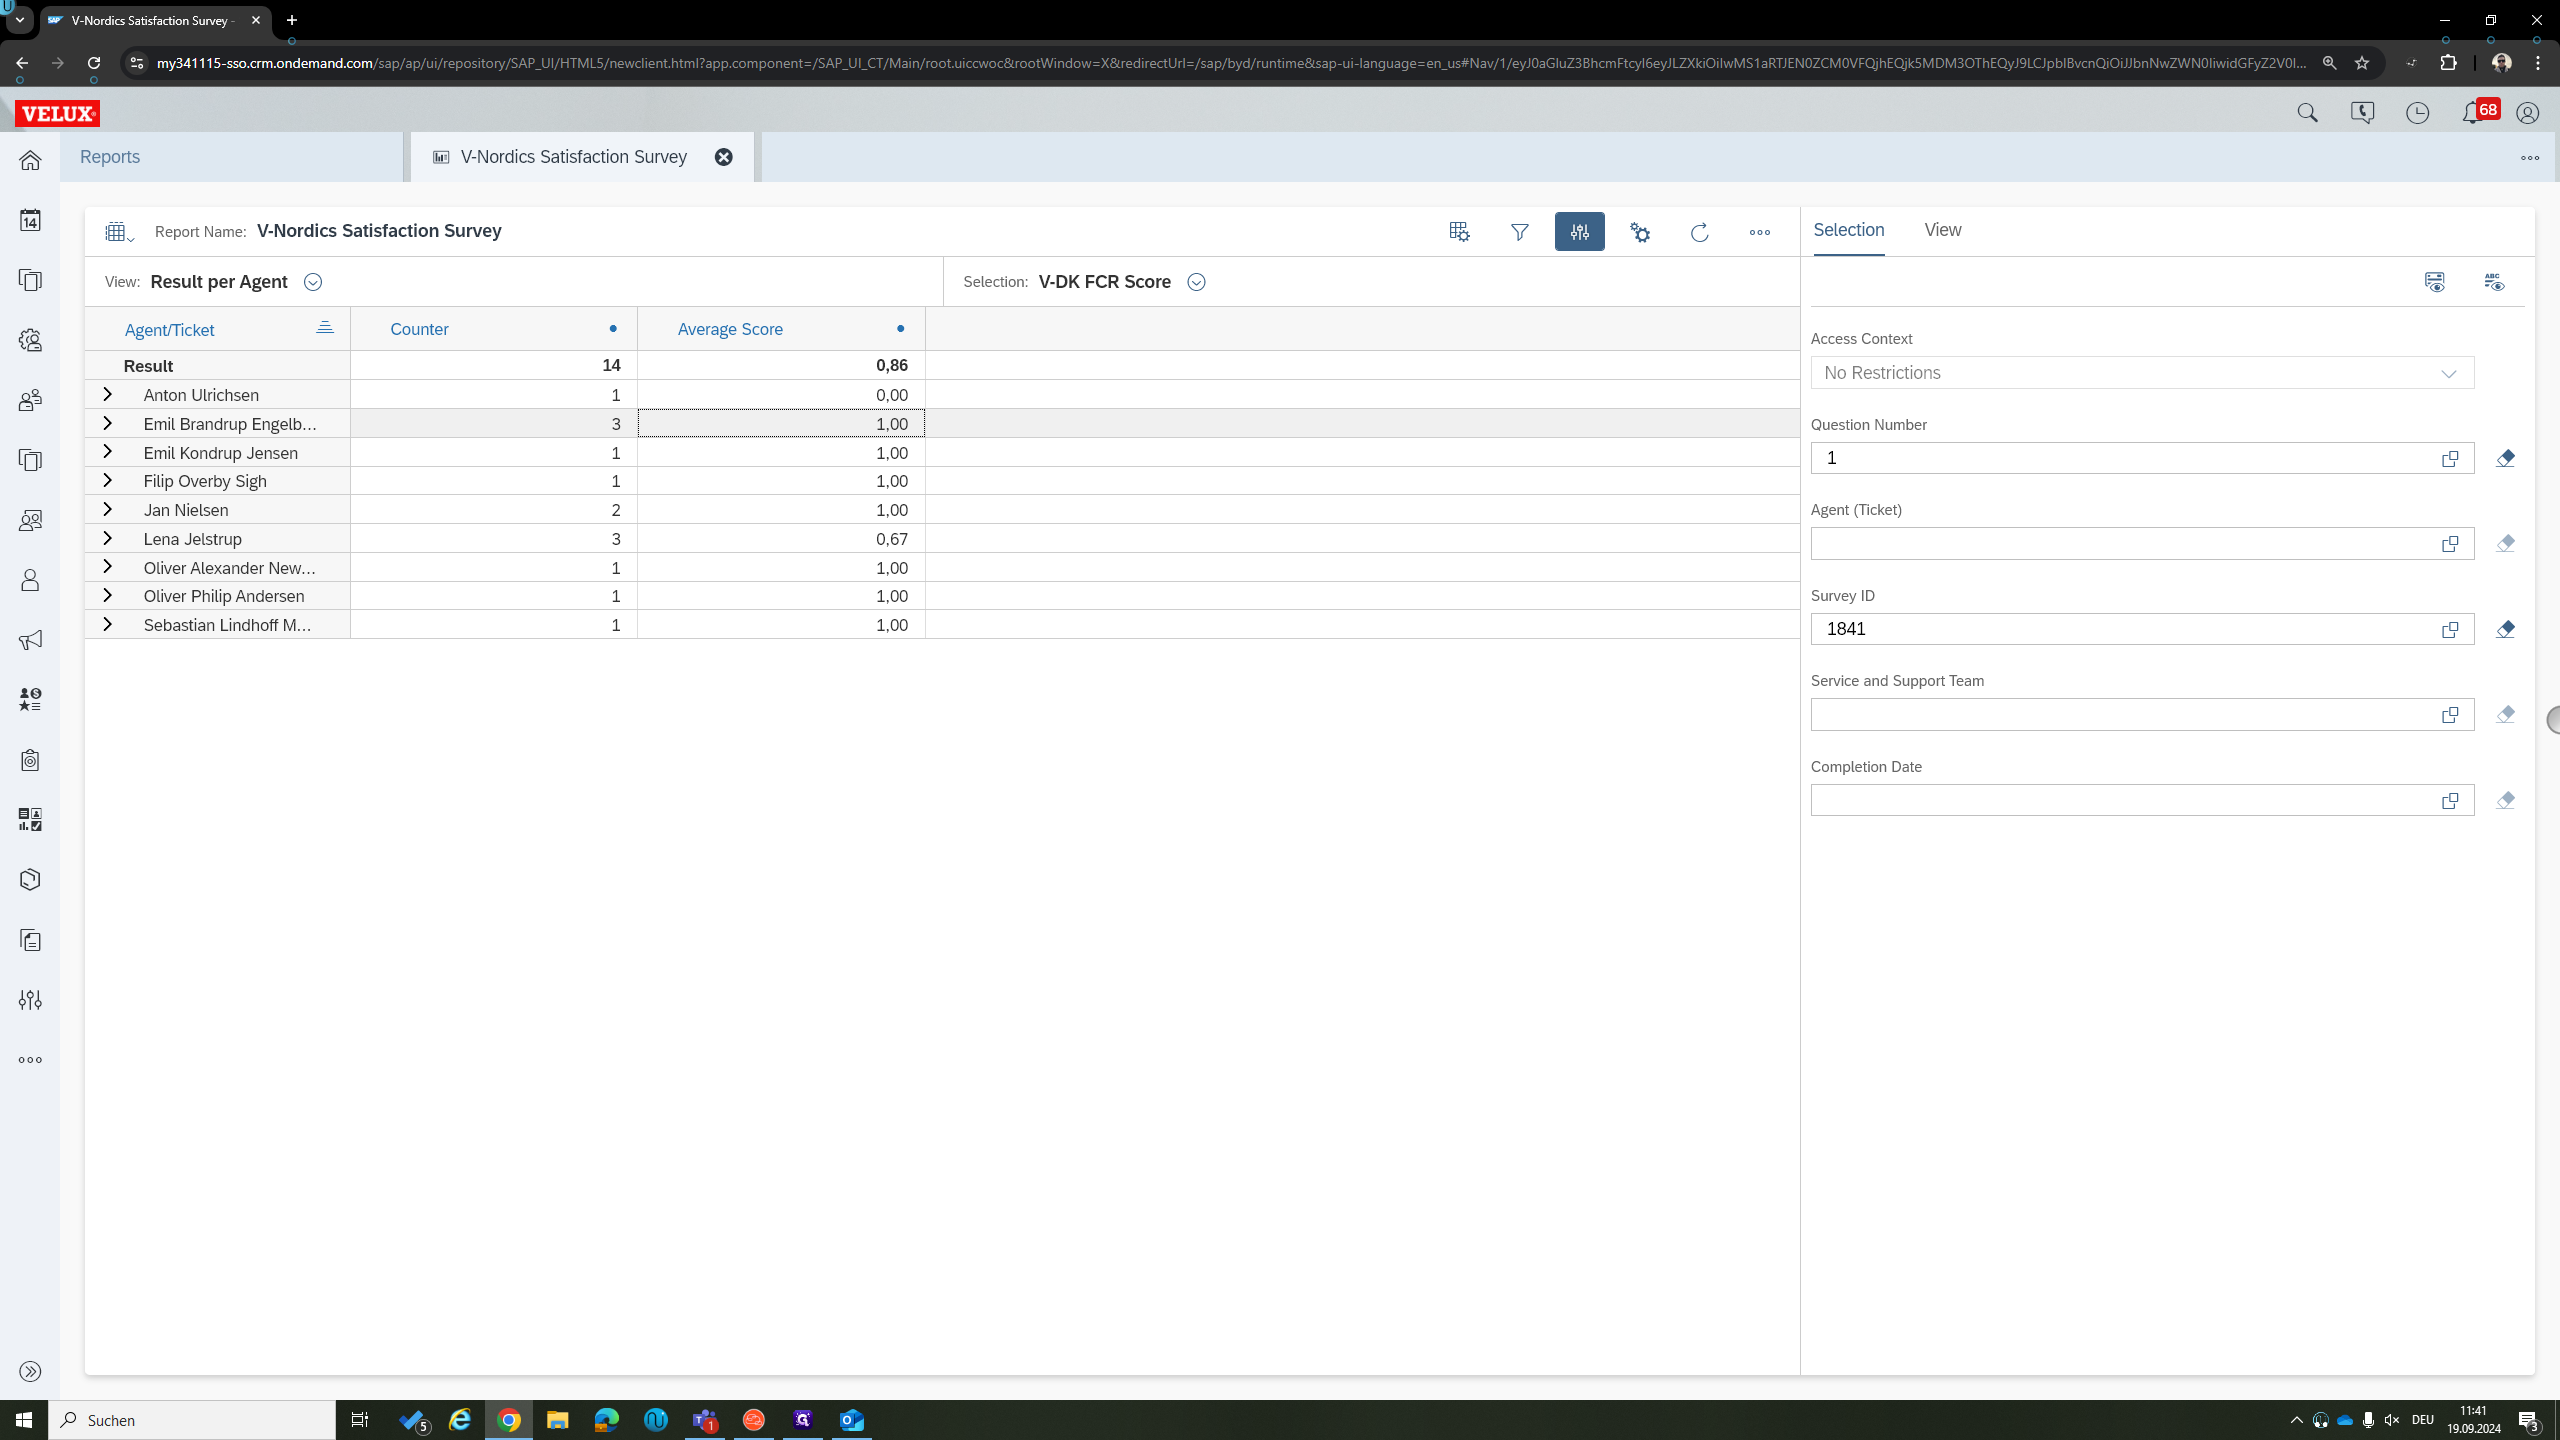
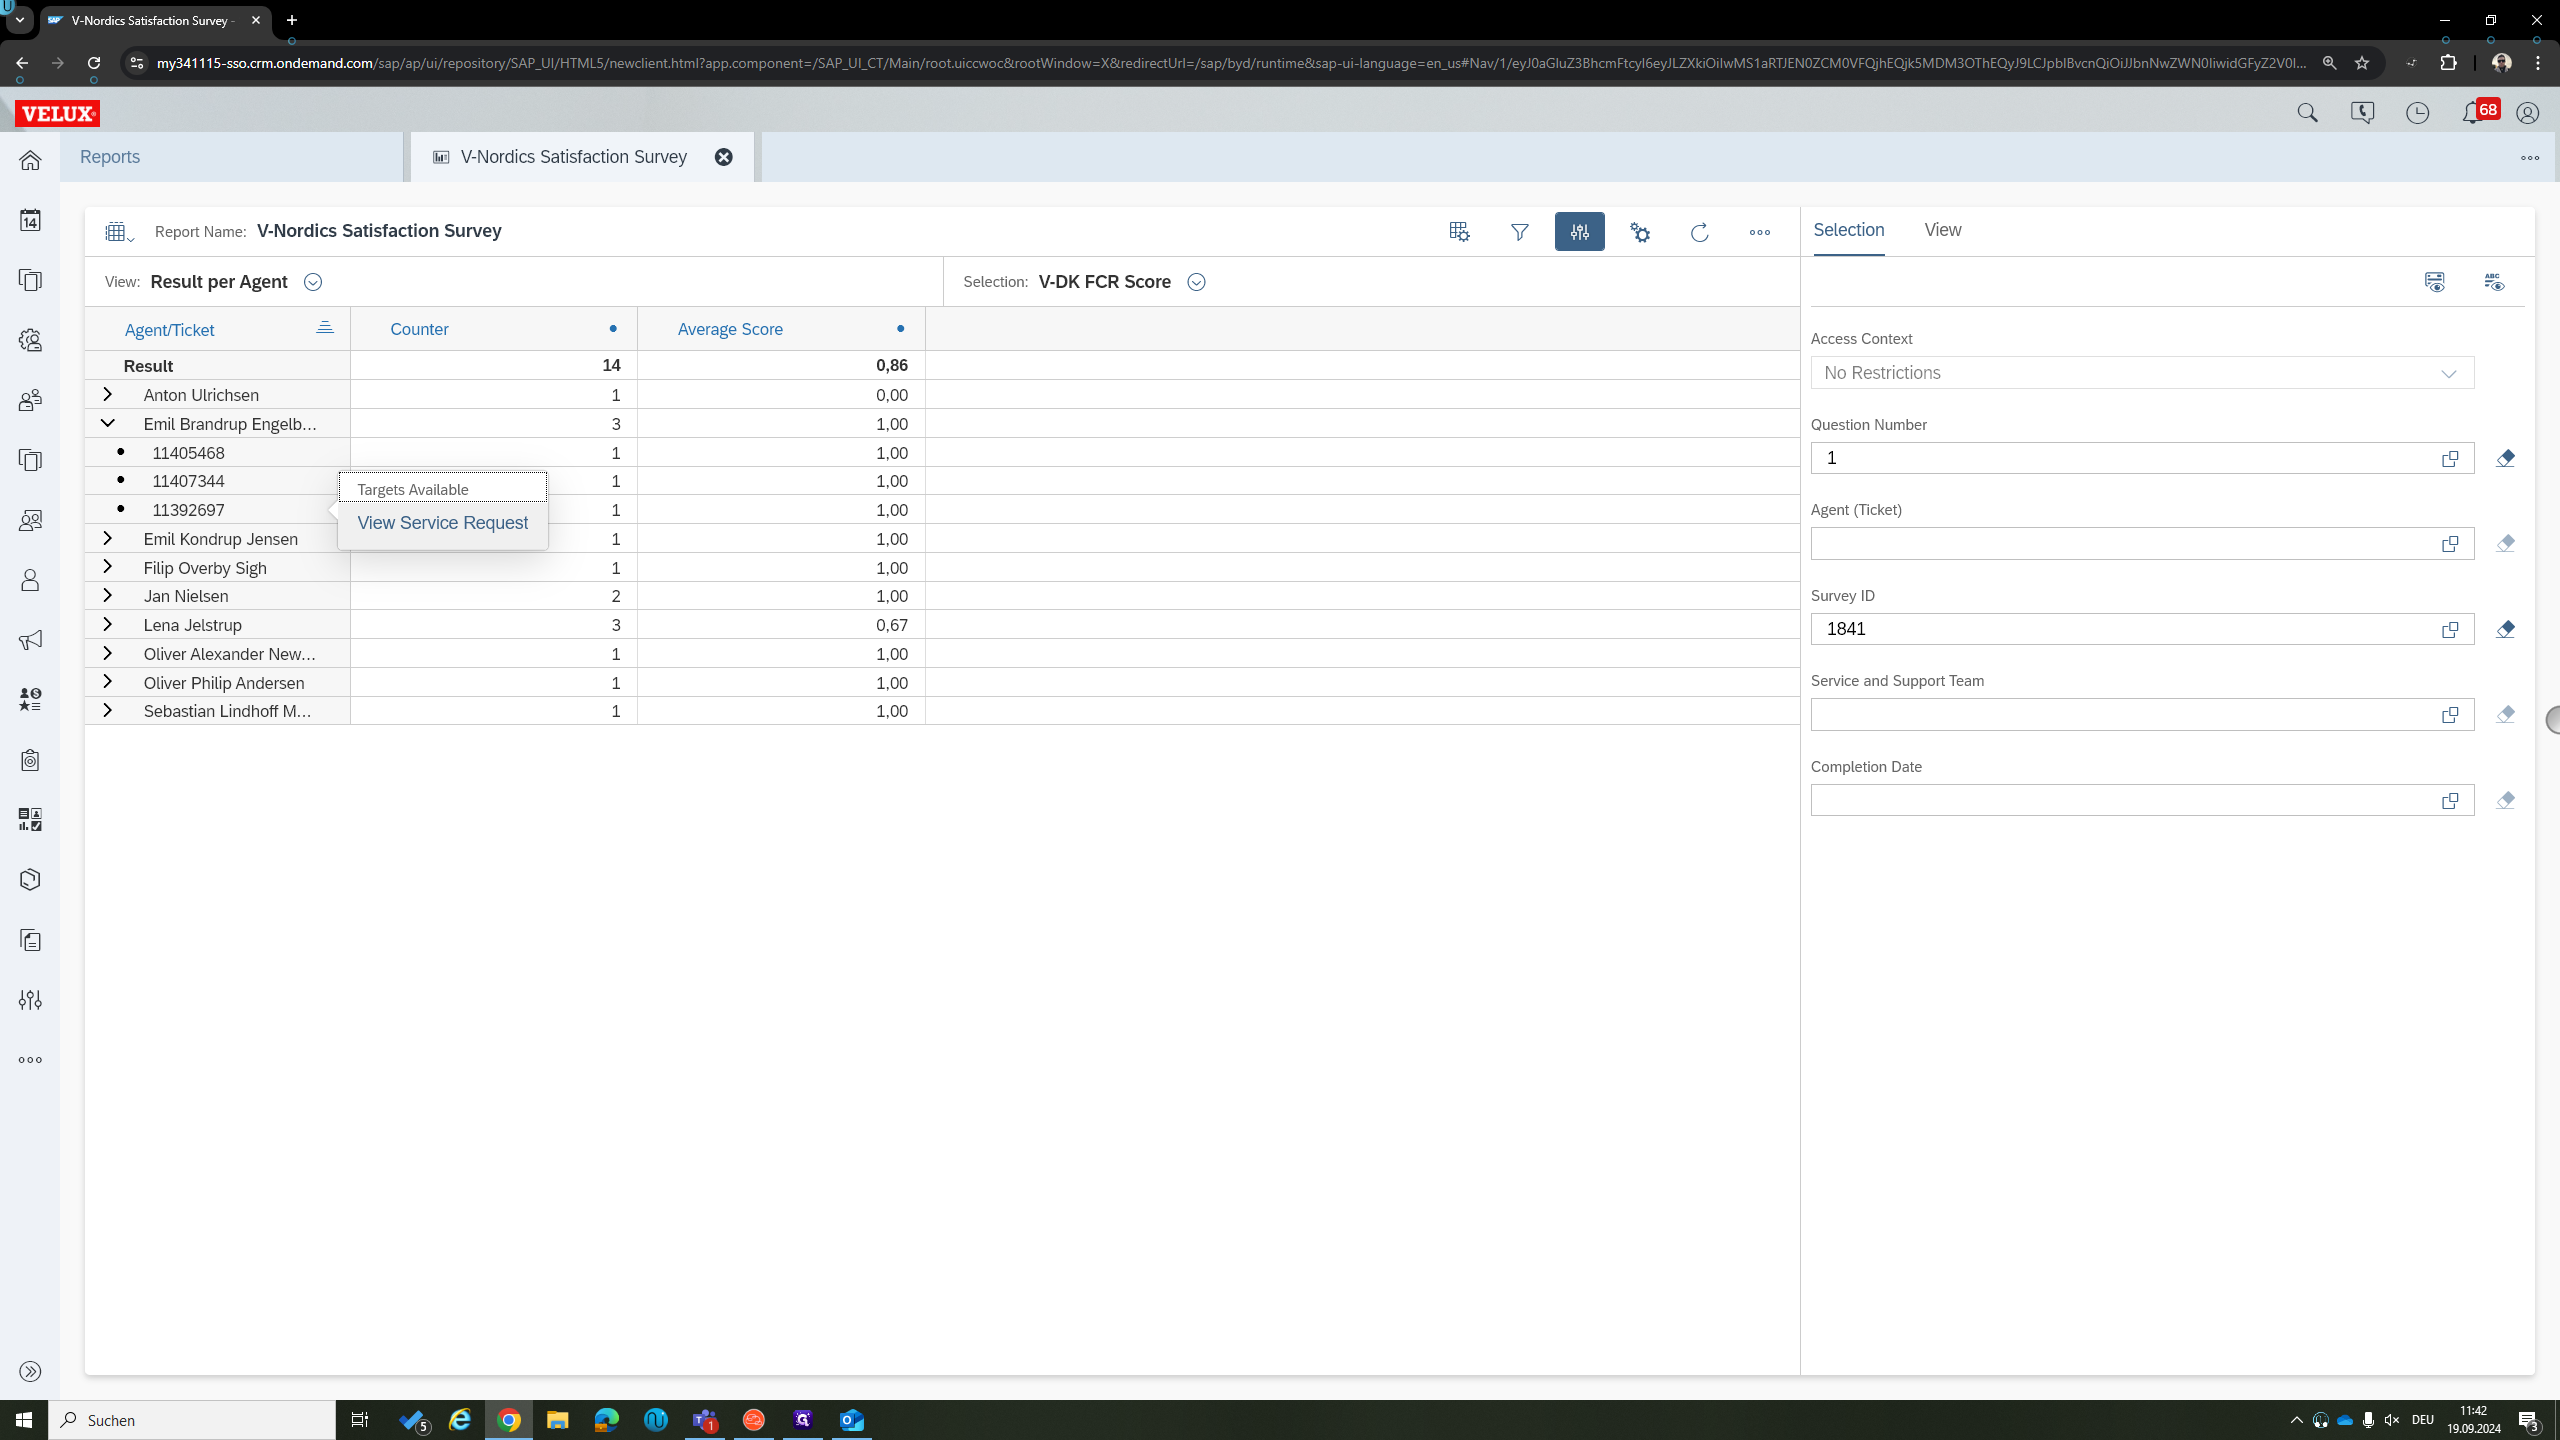
You can even drill down to the ticket level. If you expand the agent, for example, you can see the relevant tickets and the specific results for each ticket.
Each result is shown here on every ticket.
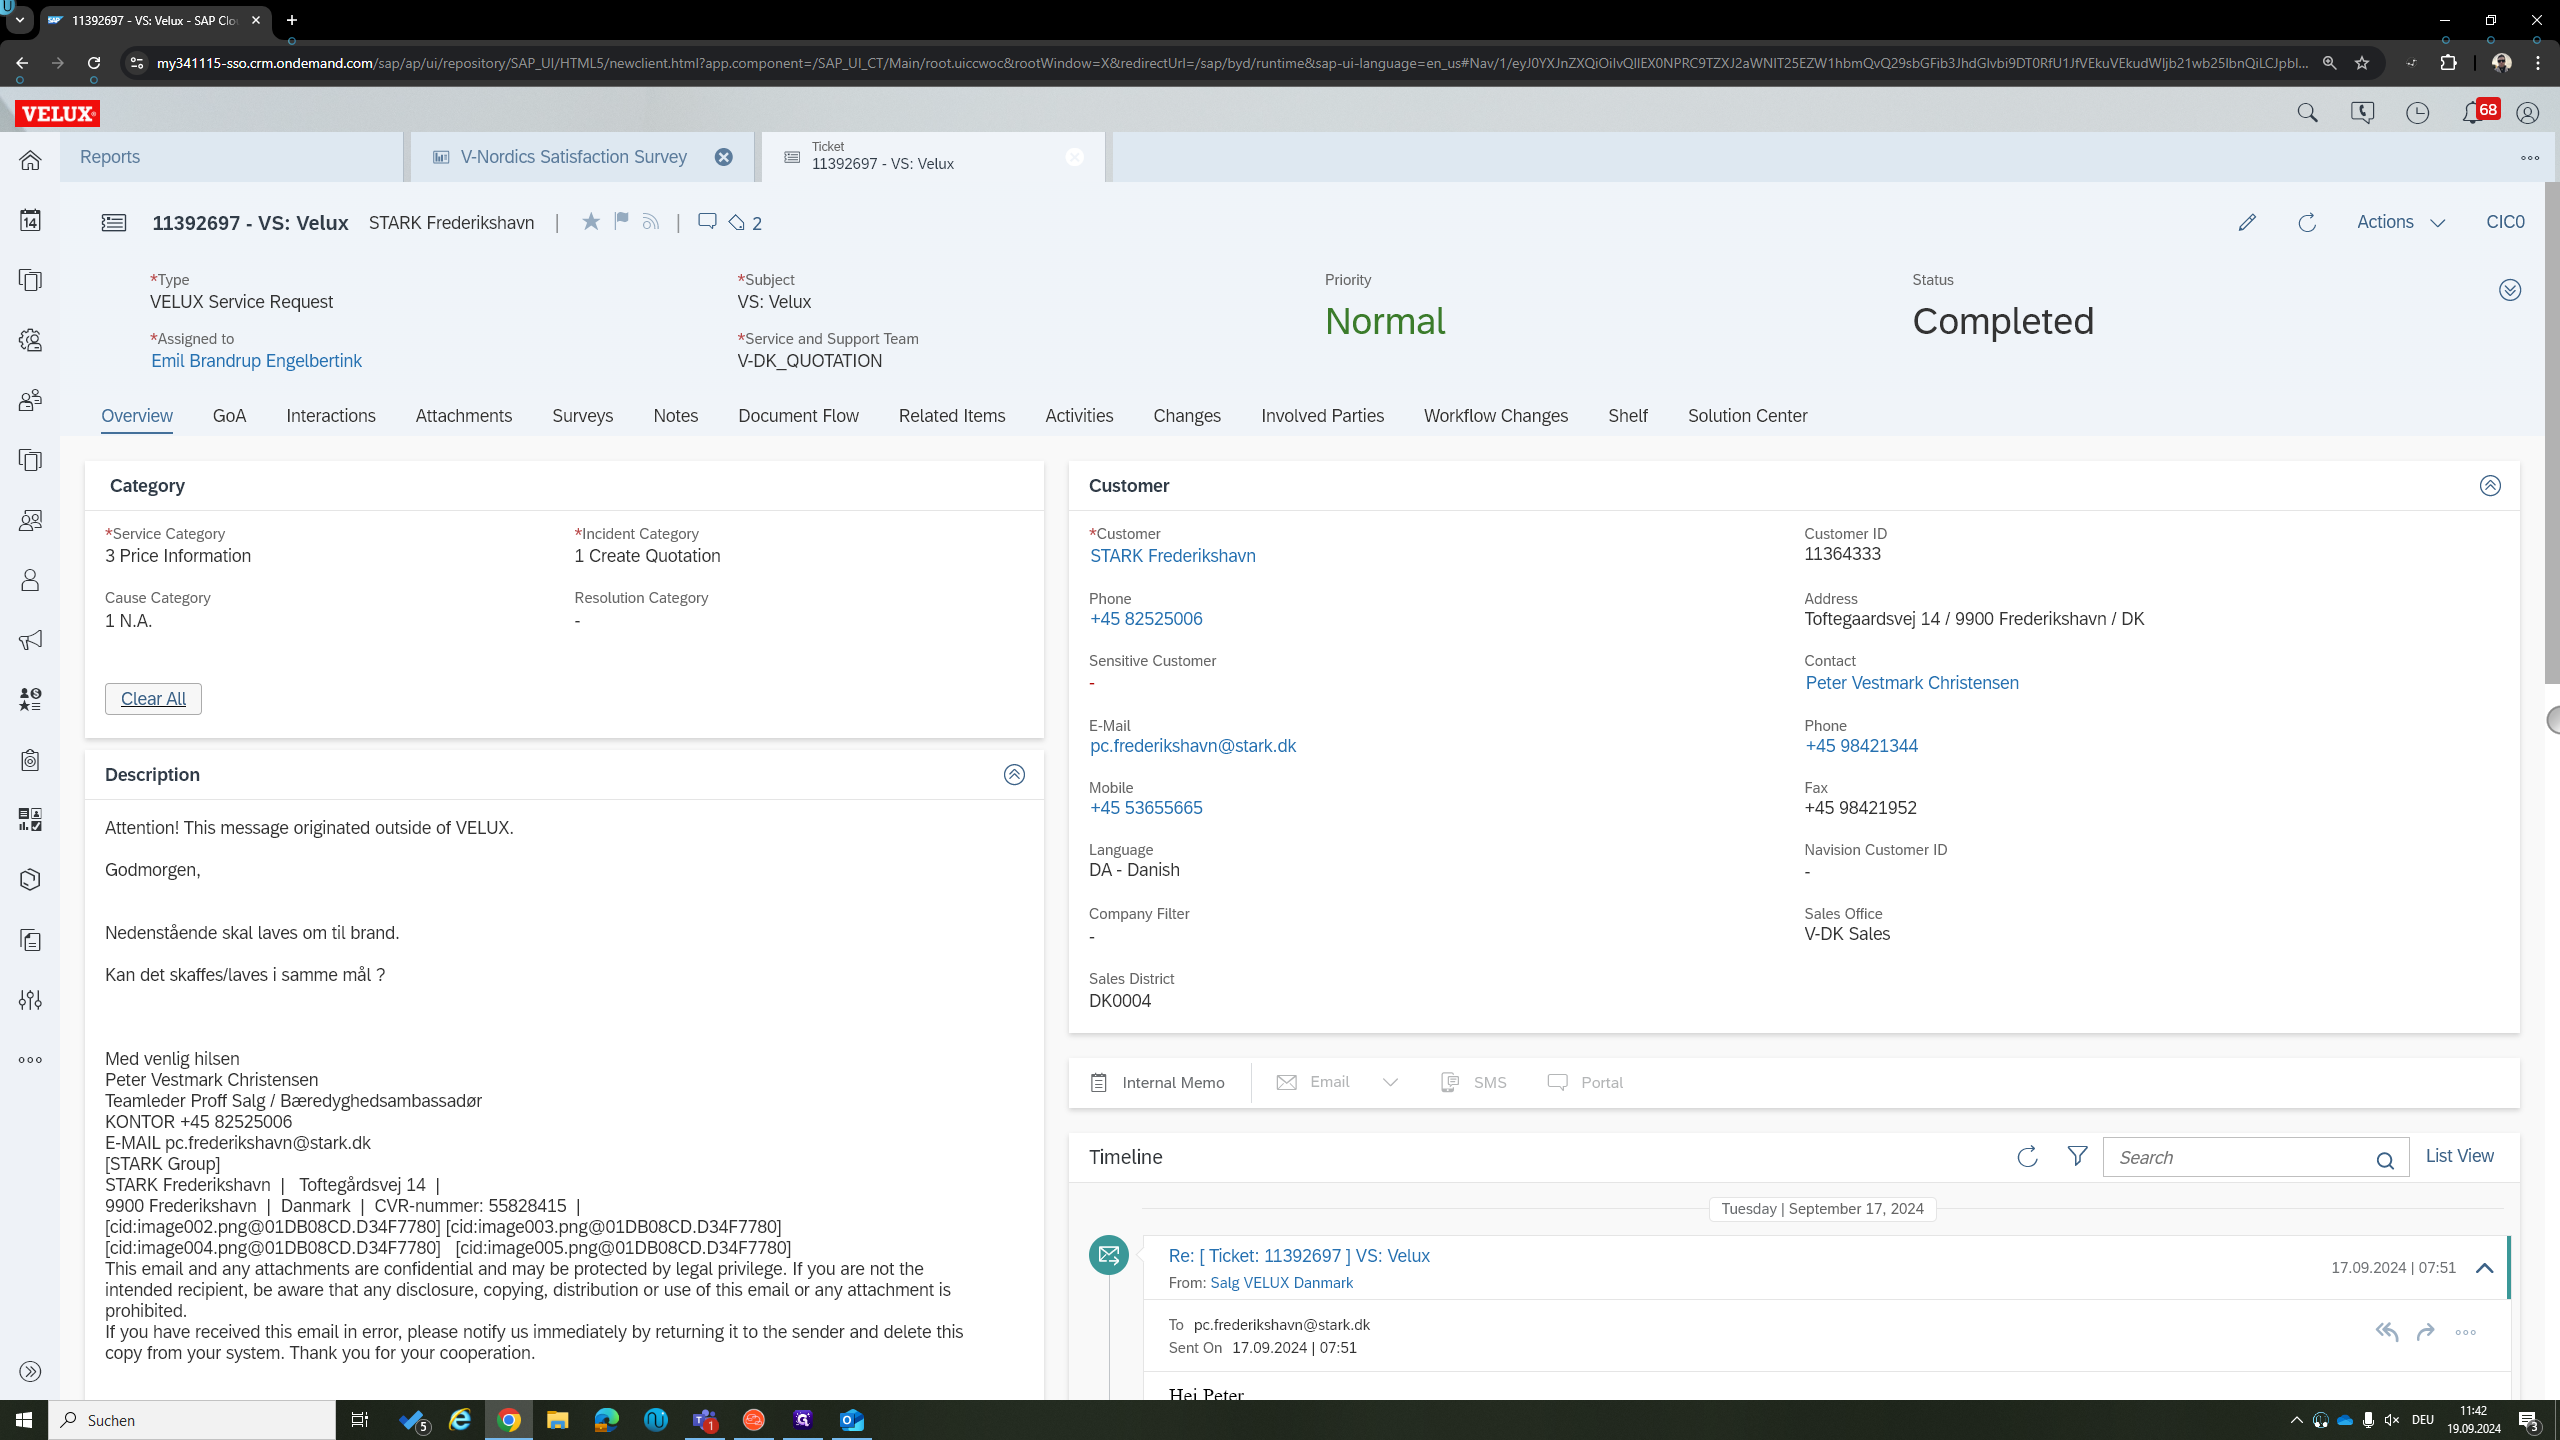
You can click on the ticket ID to open the ticket.
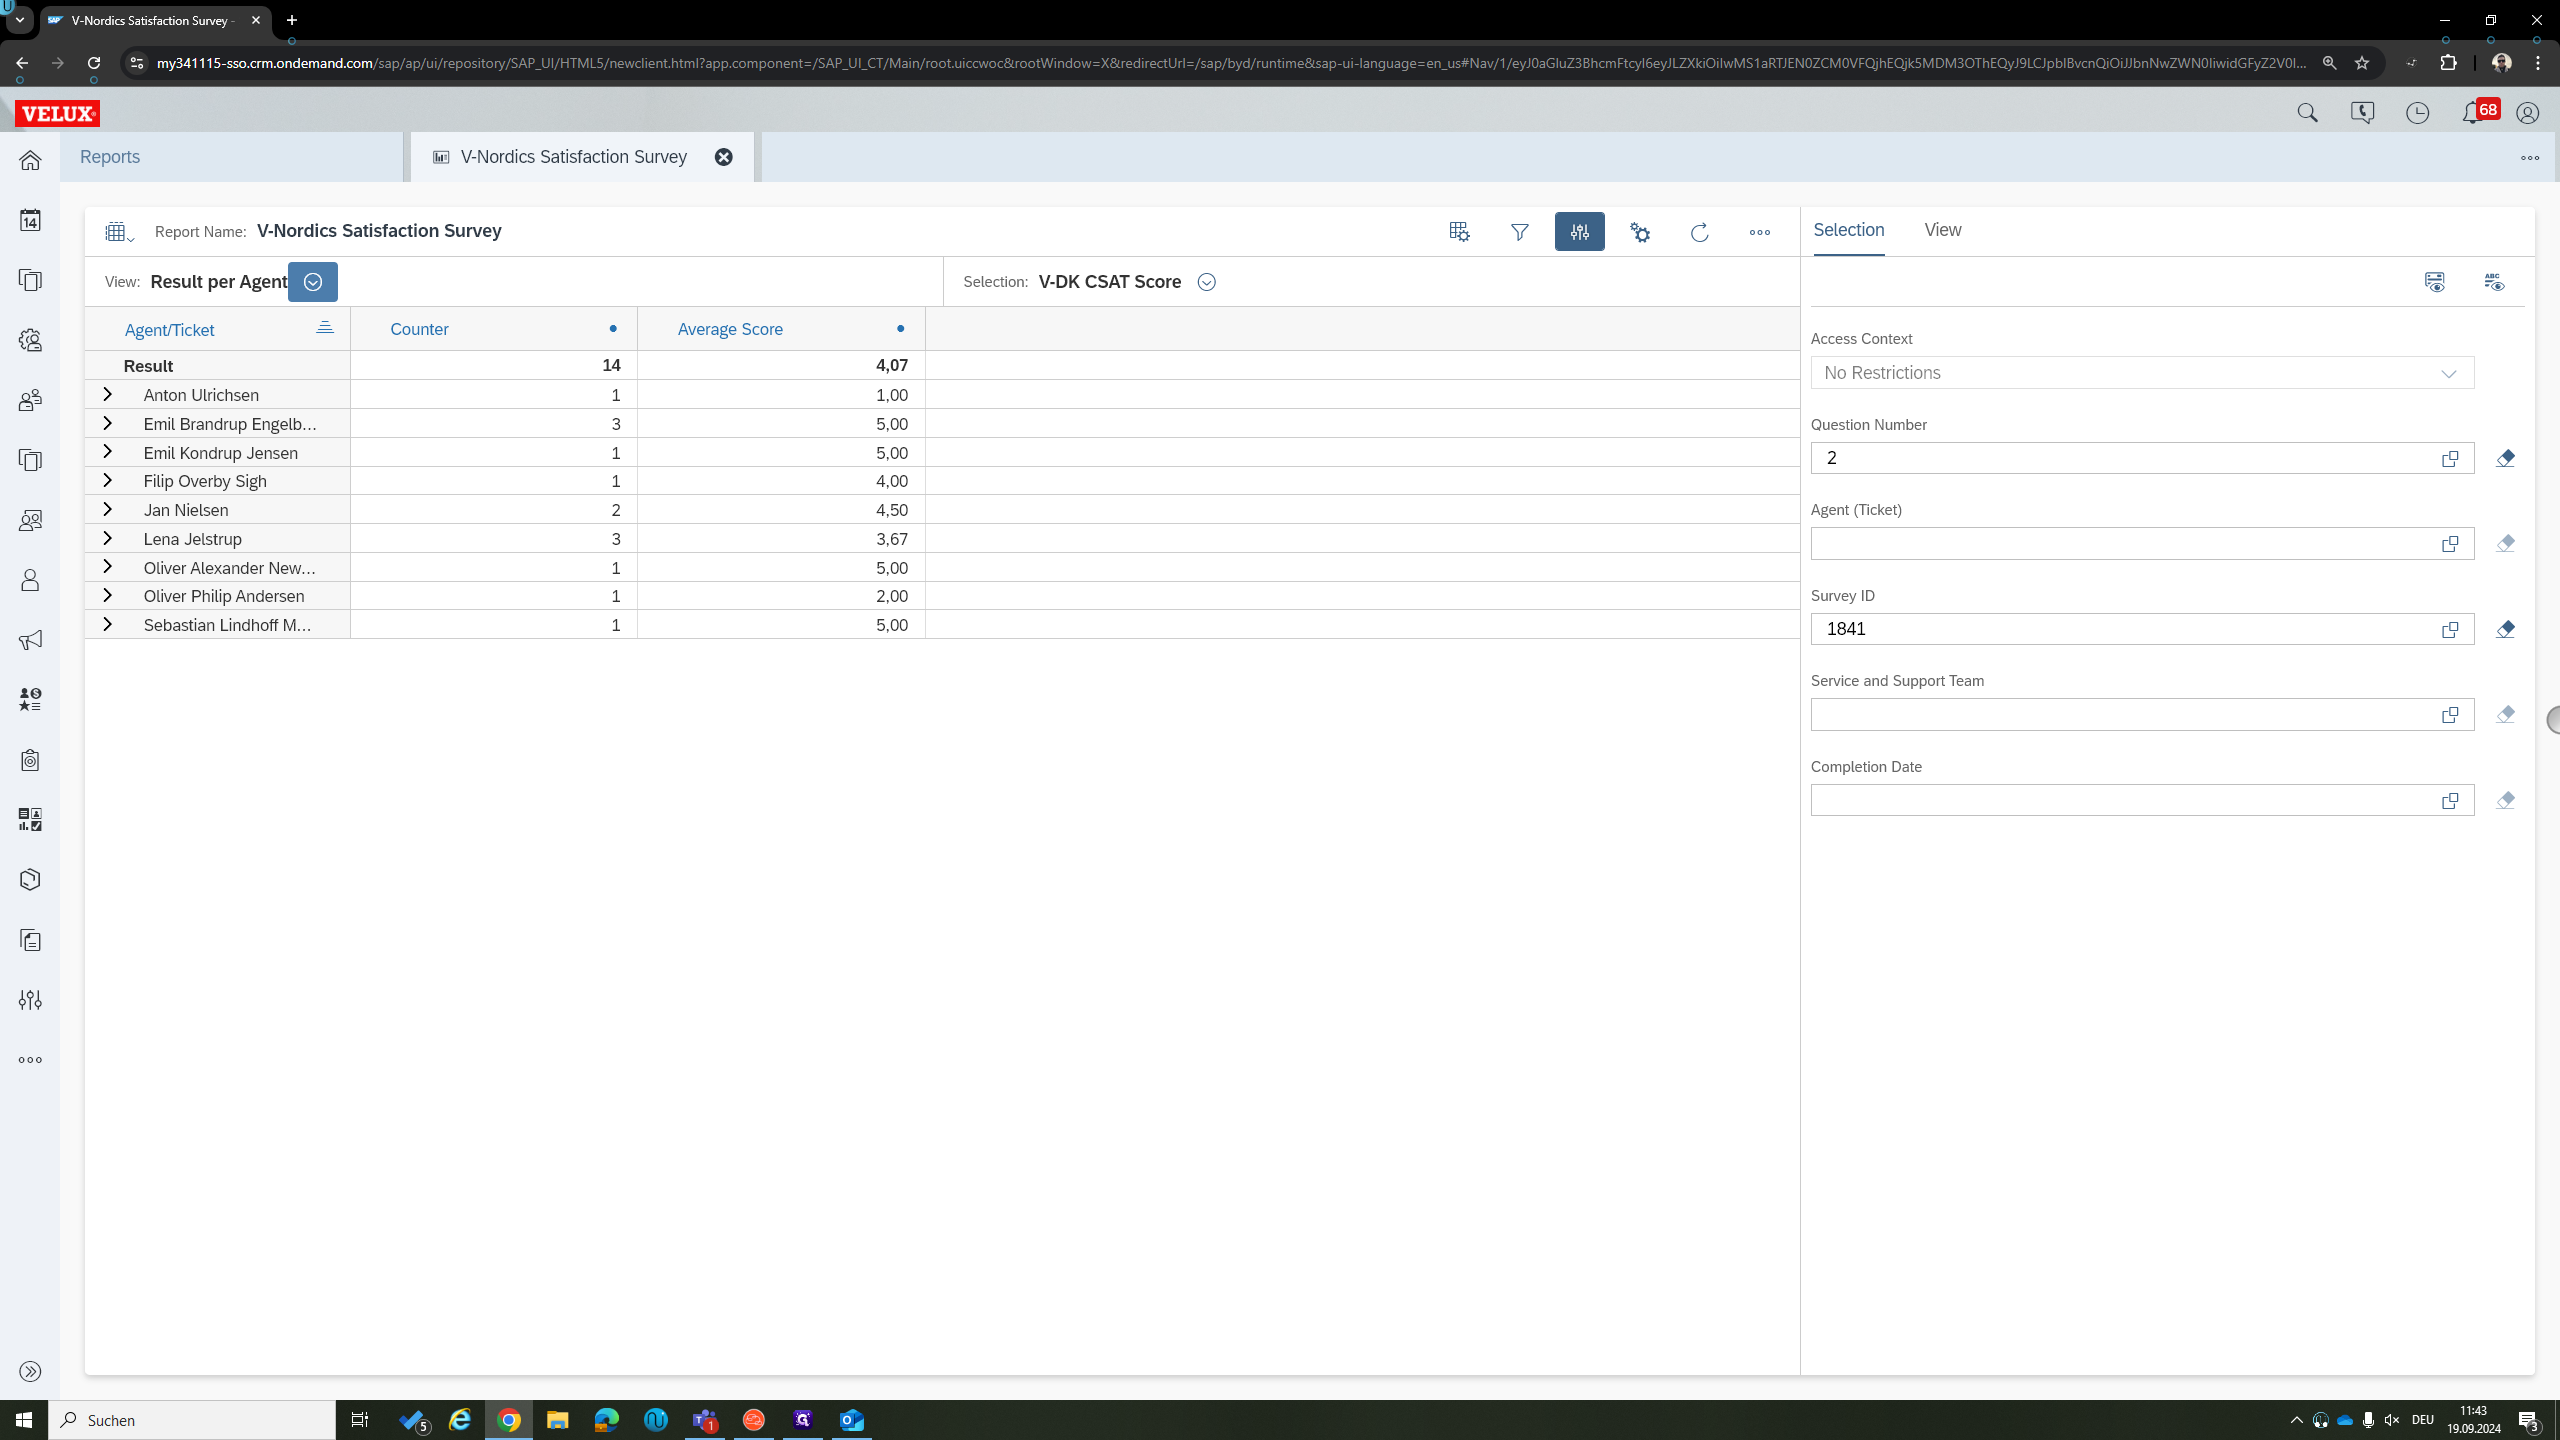
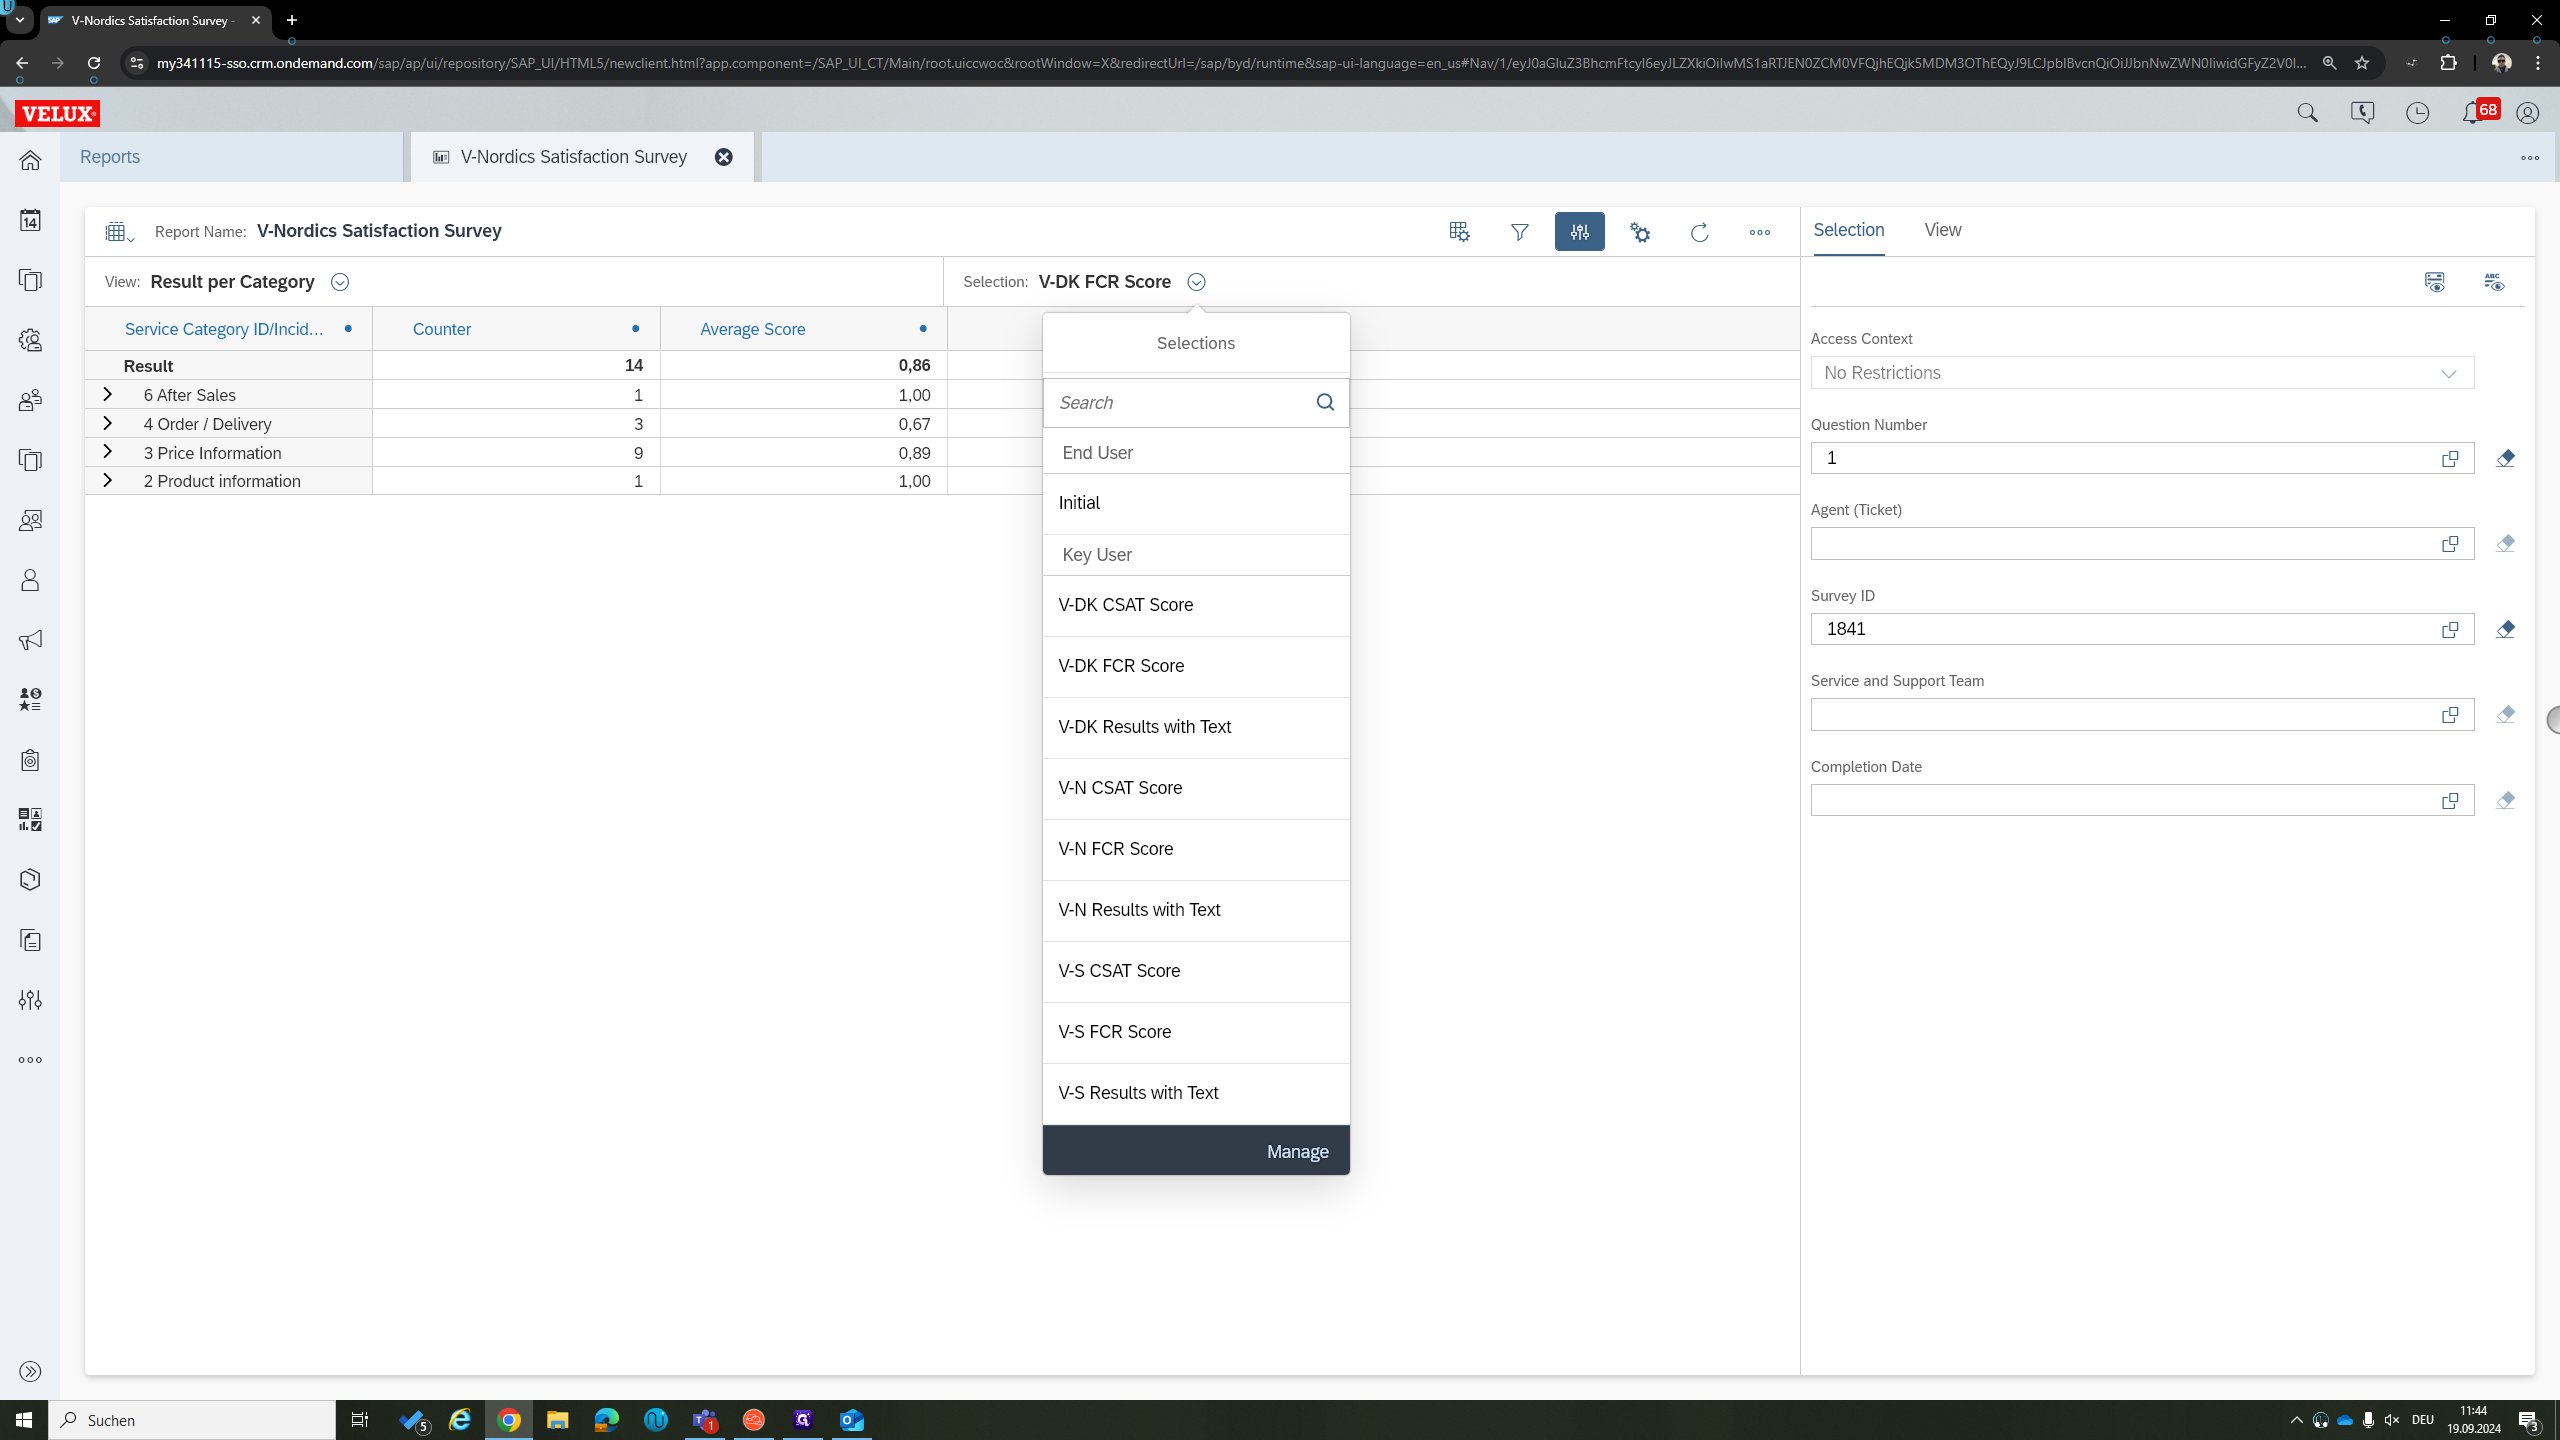
Next, we want to open the CSAT score.
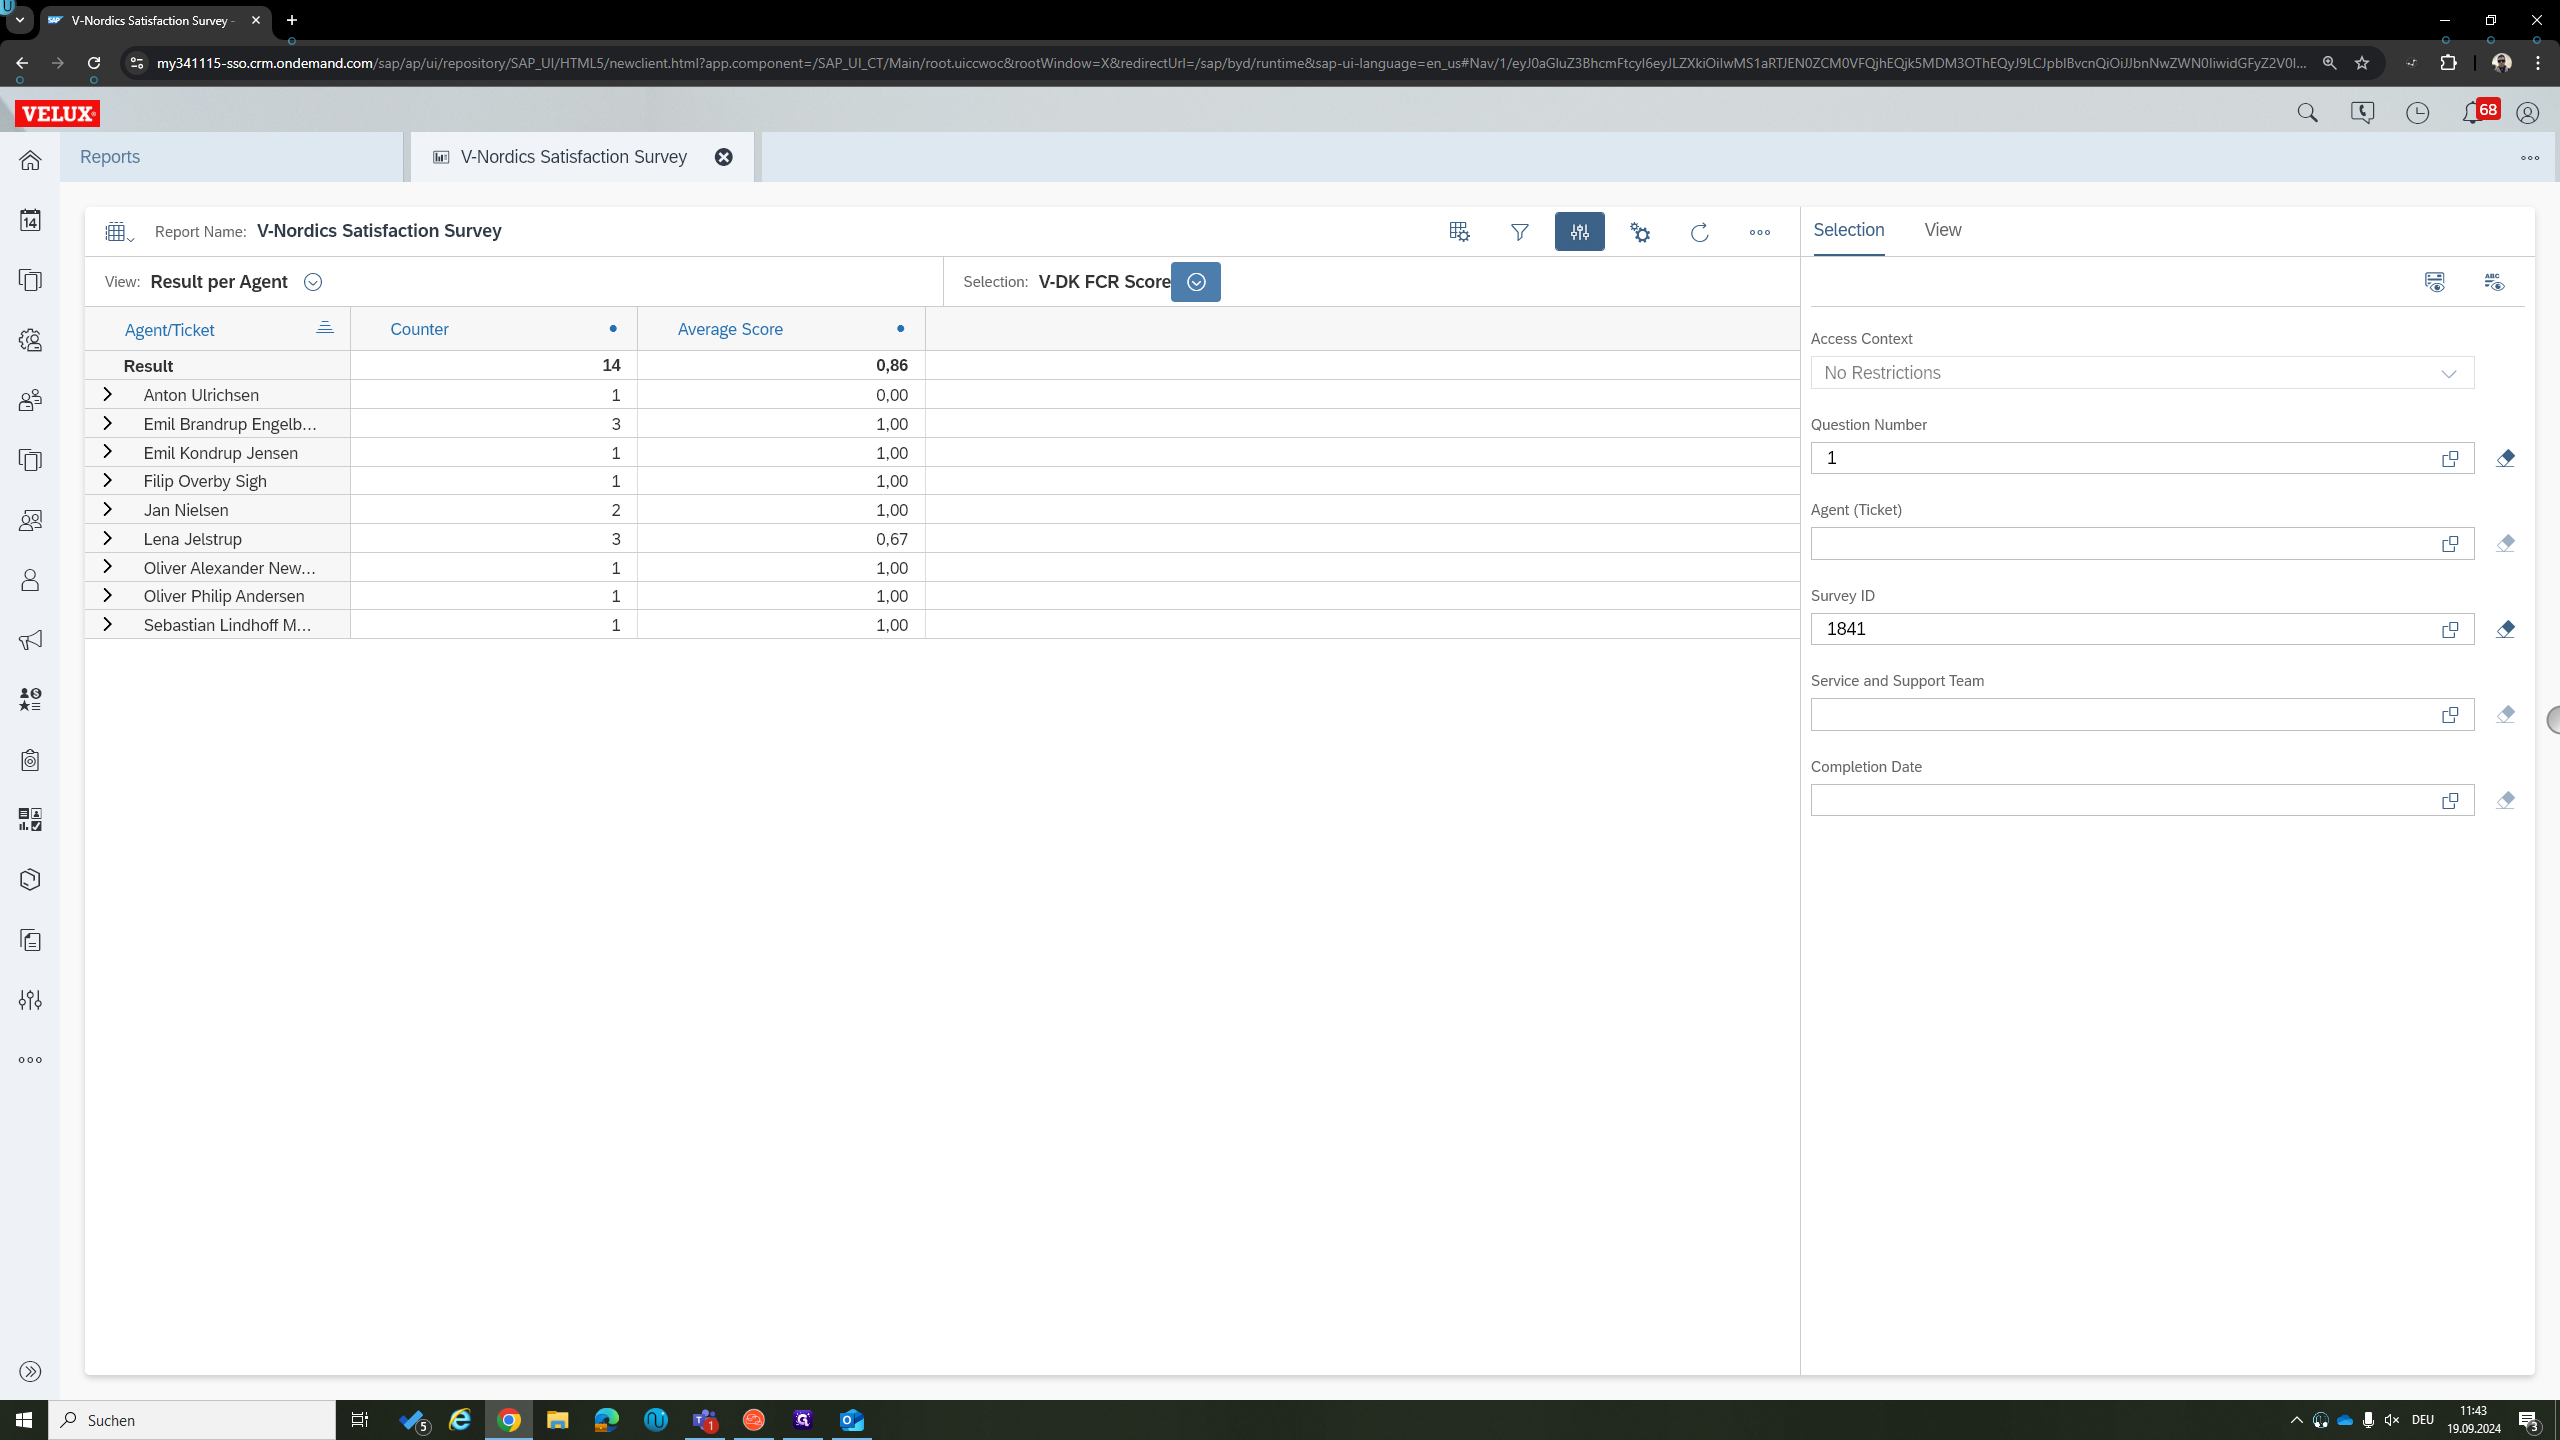
From the FCR score, we move to the CSAT score. This measures how satisfied the customers were with the overall service.
The rating is between 1 and 5. We switch to that score, and the view remains the same. We can see the results per agent again.
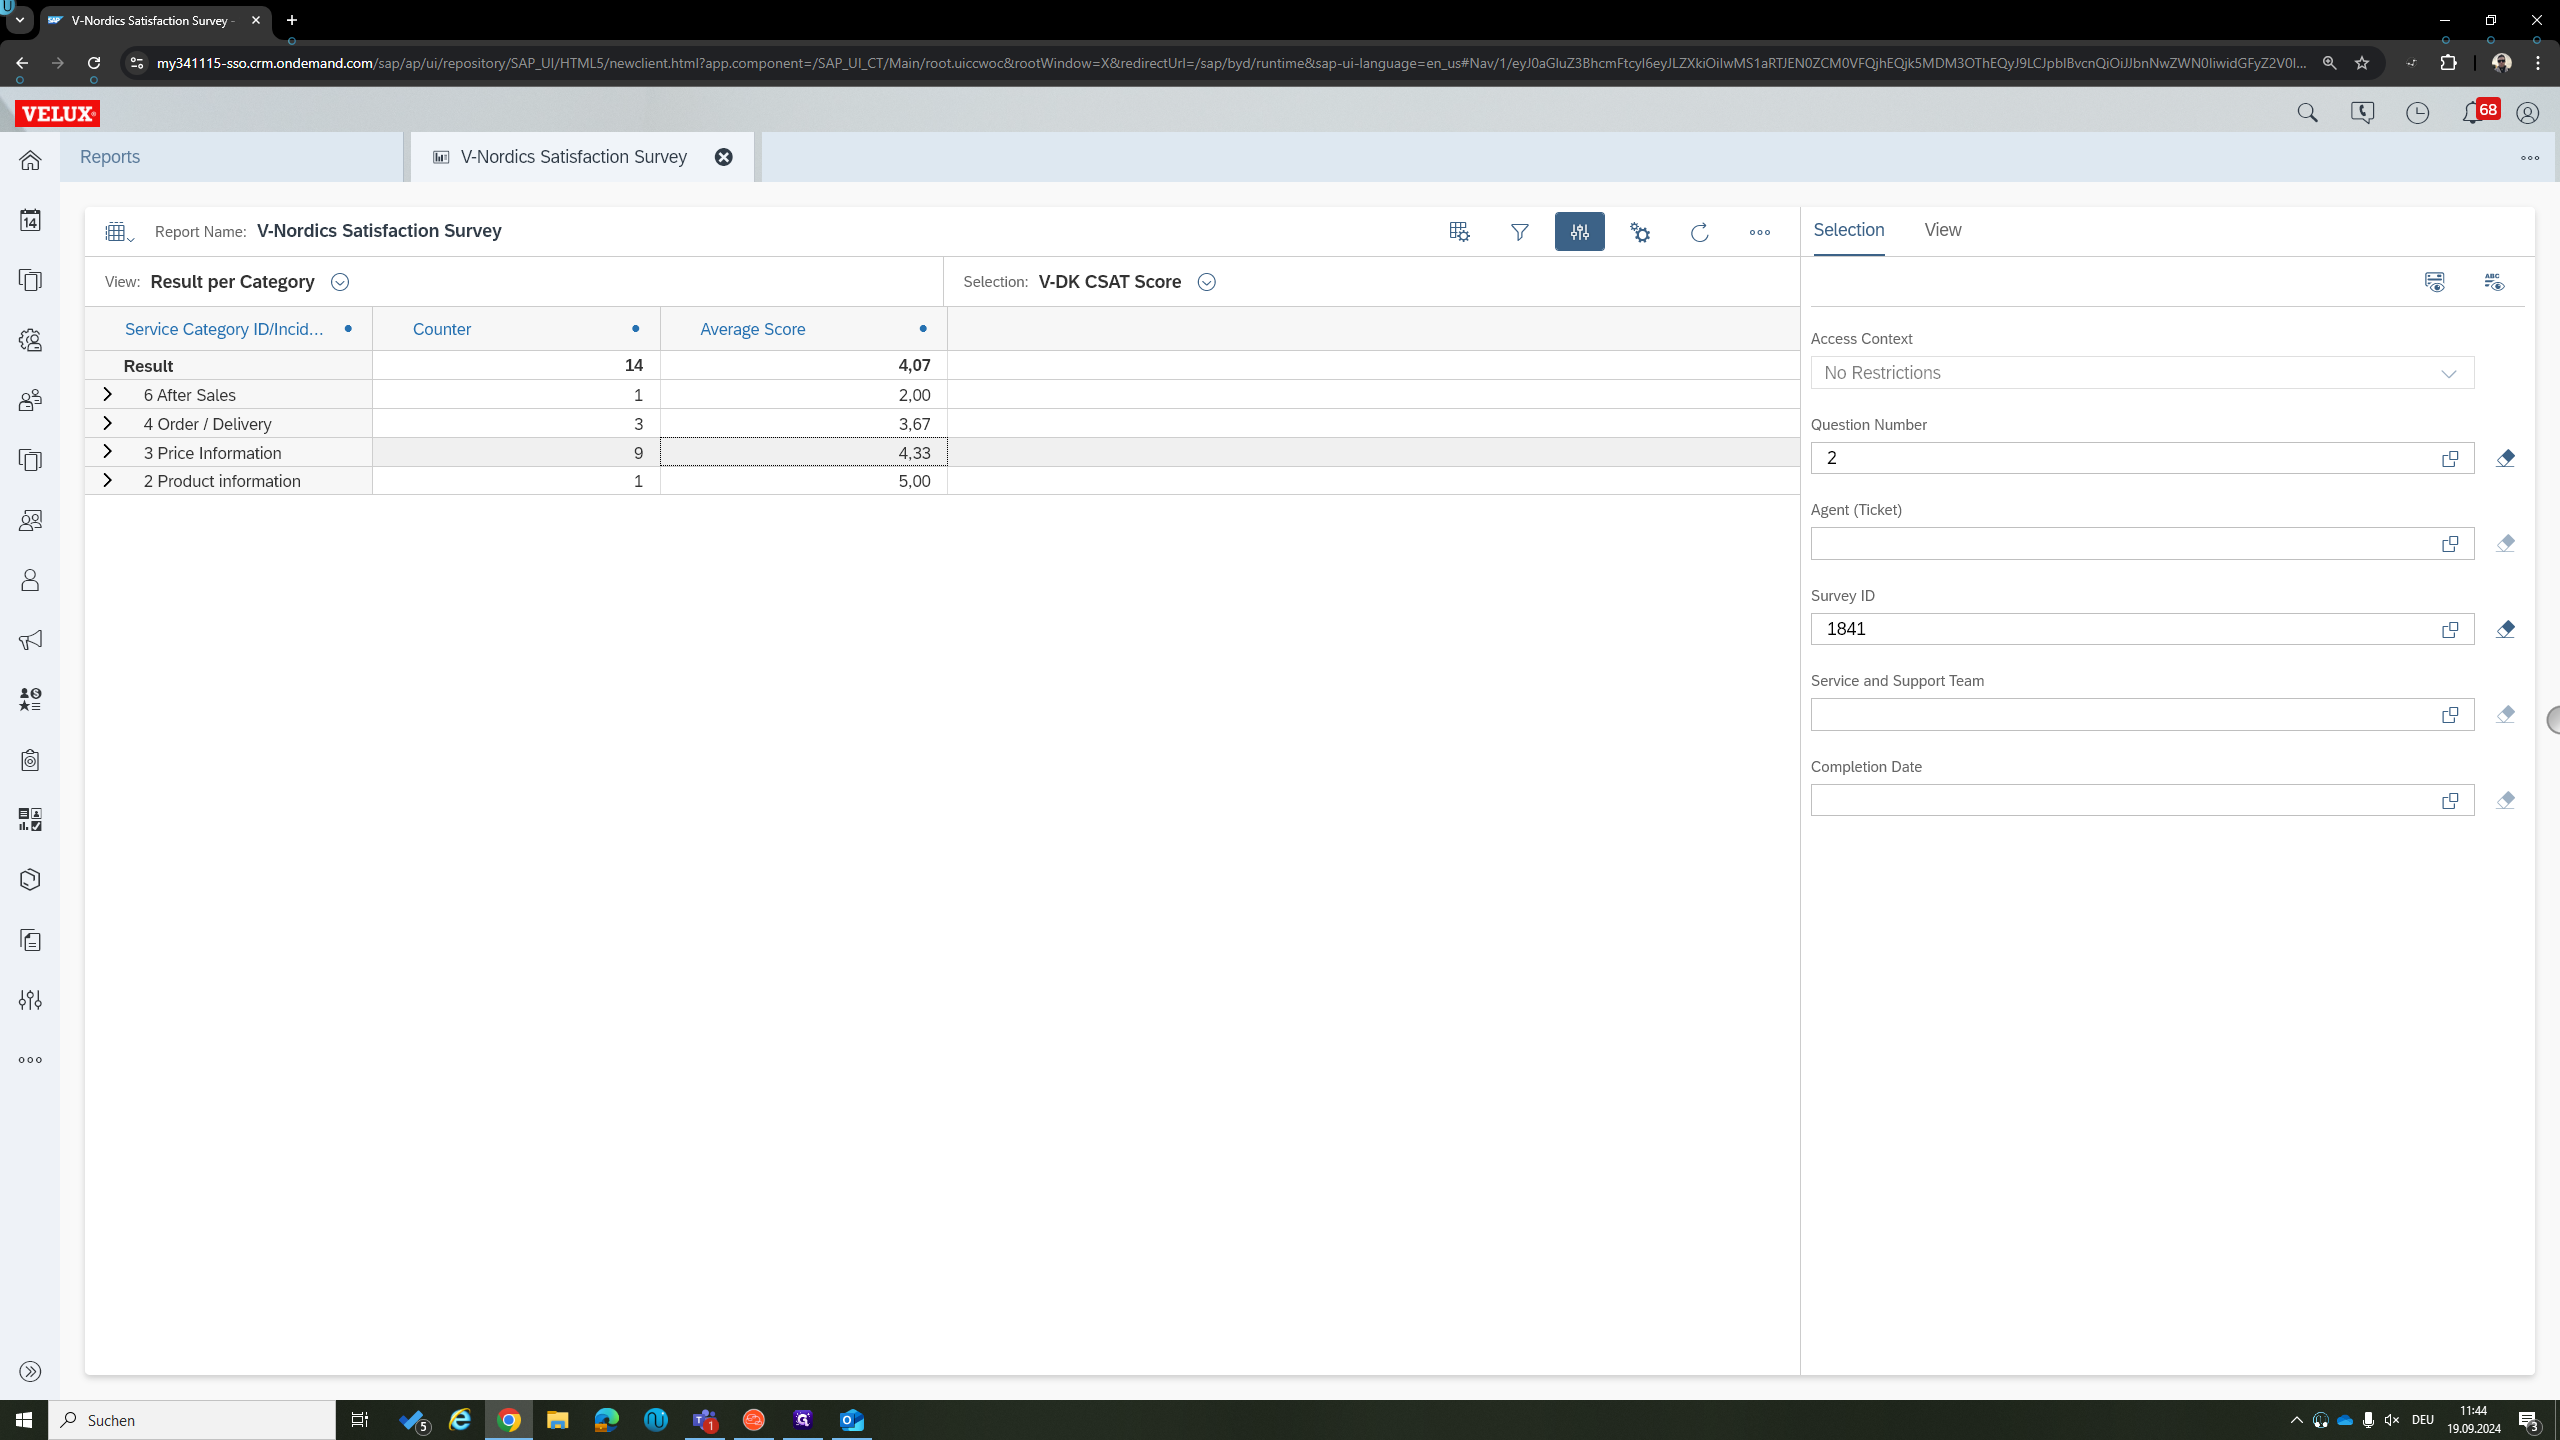
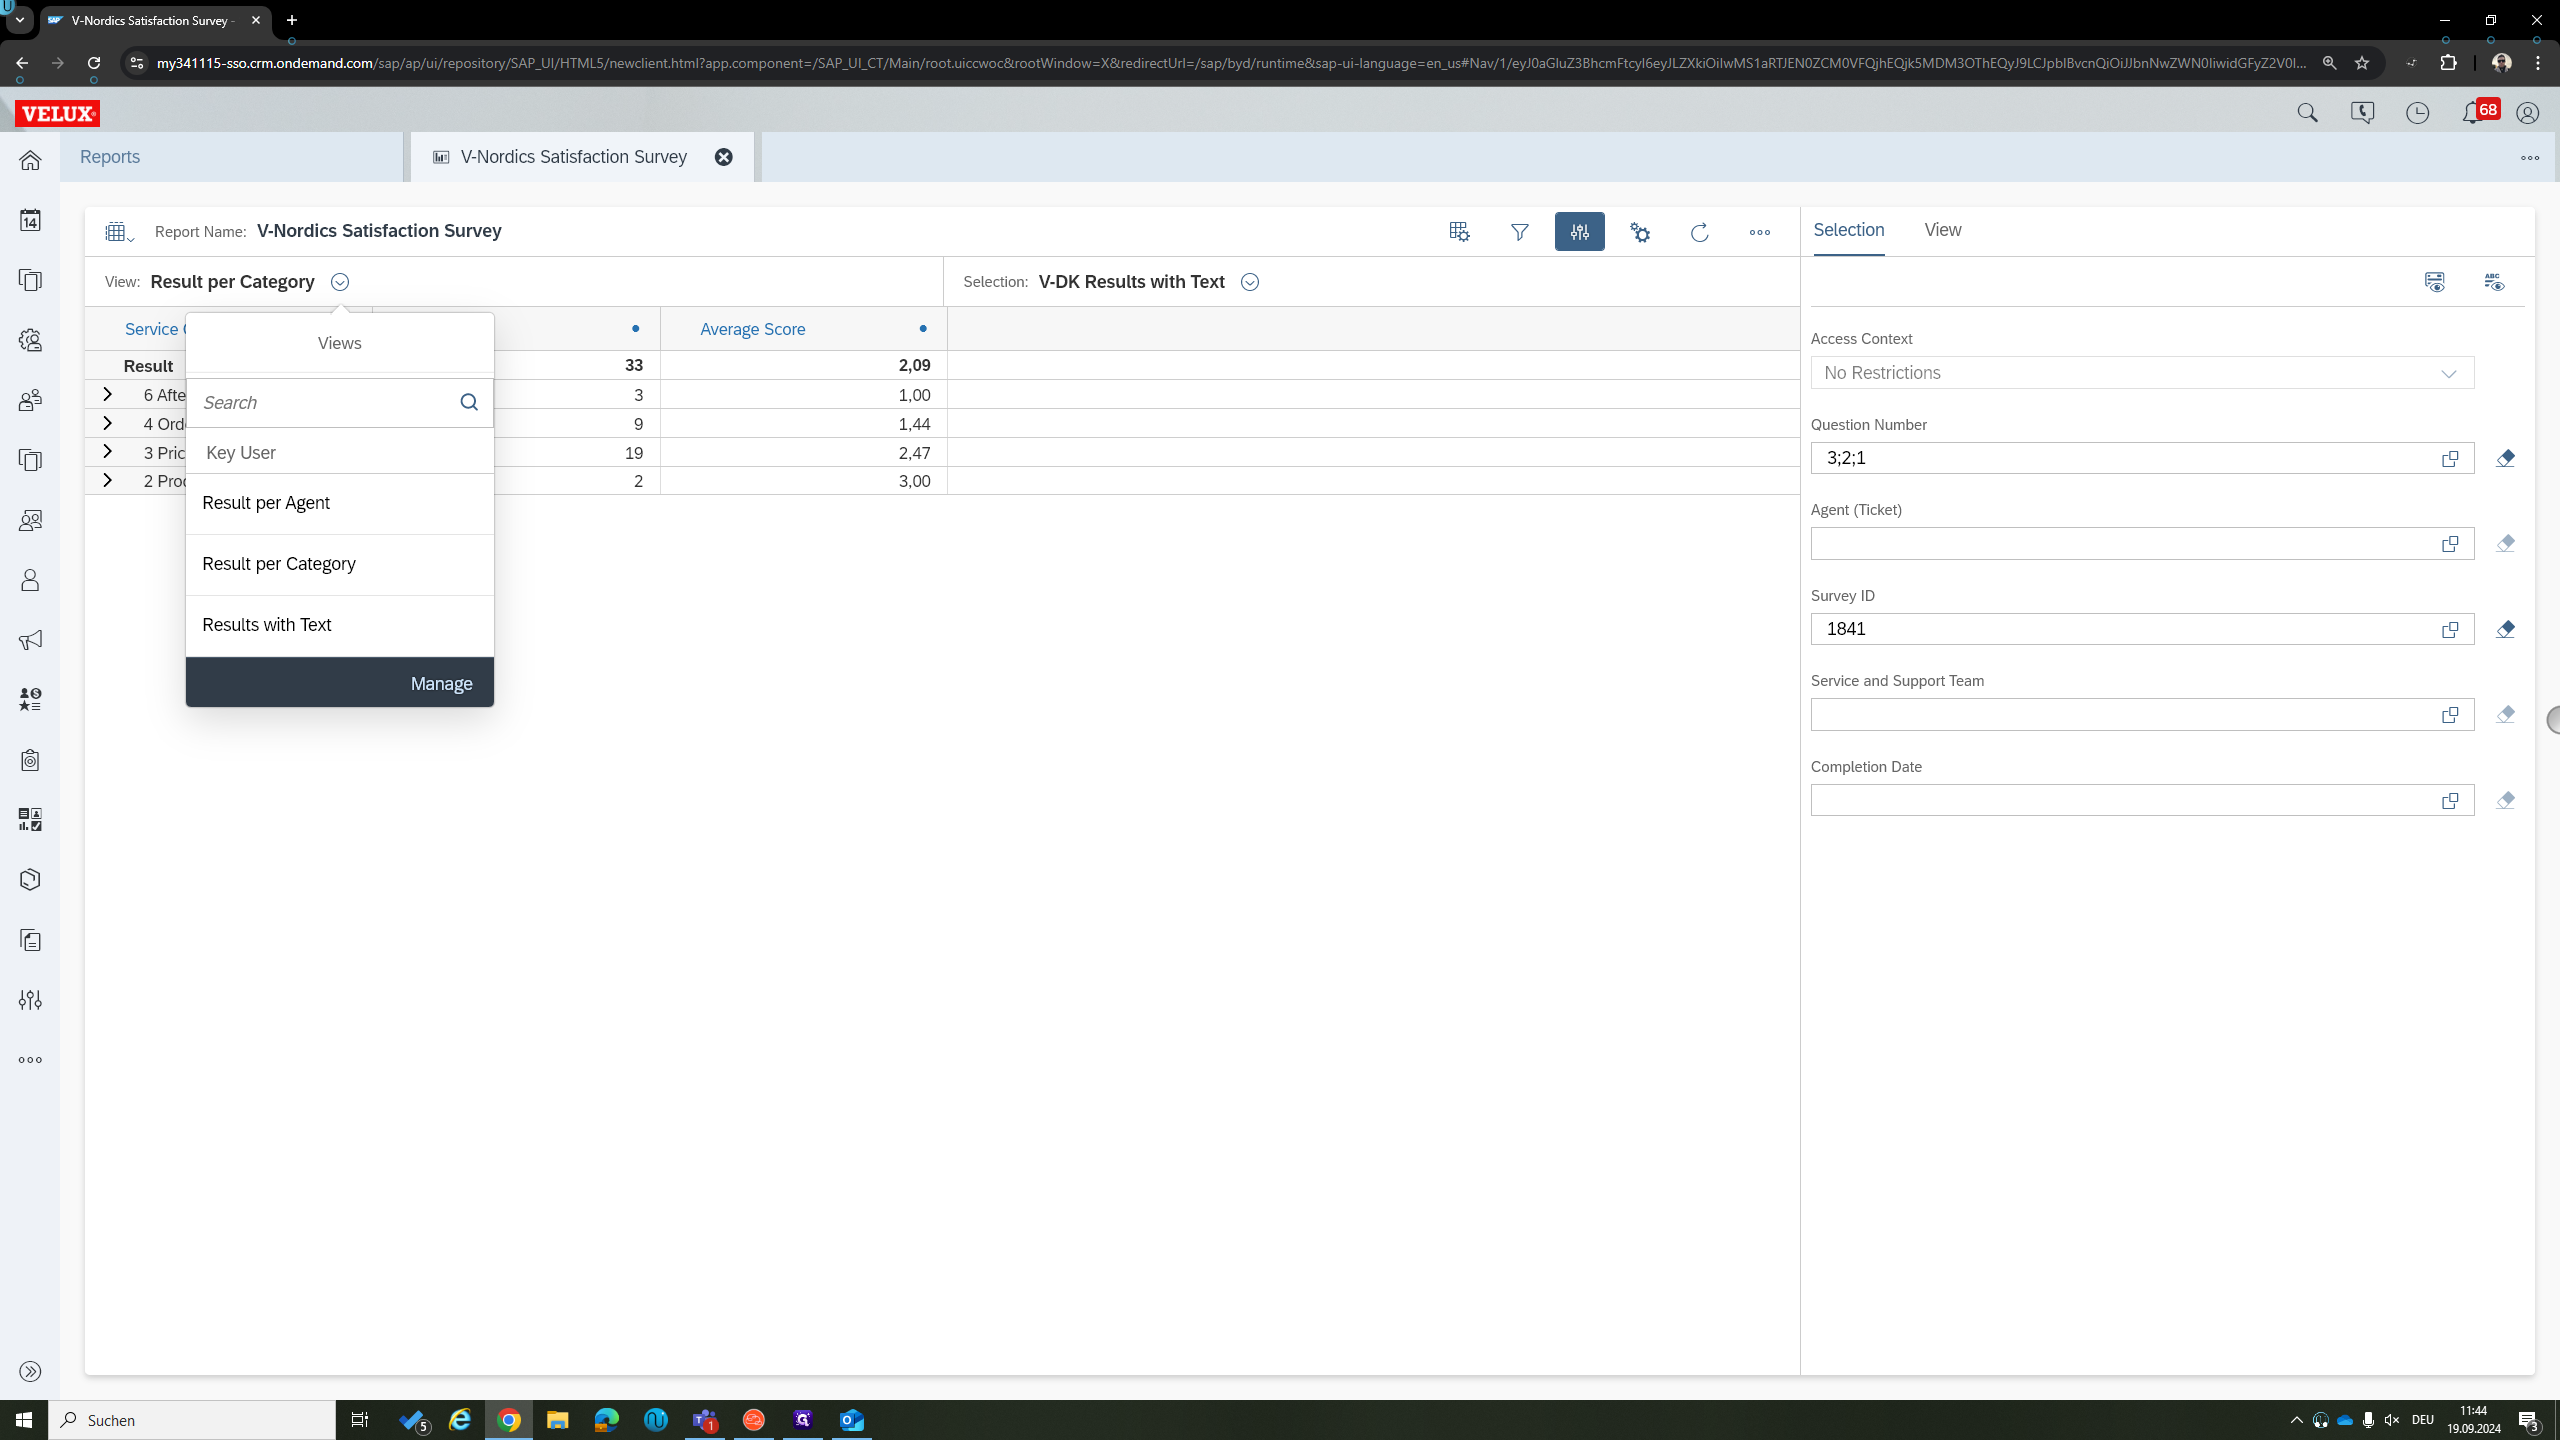
You can also switch to the view called "results per category."
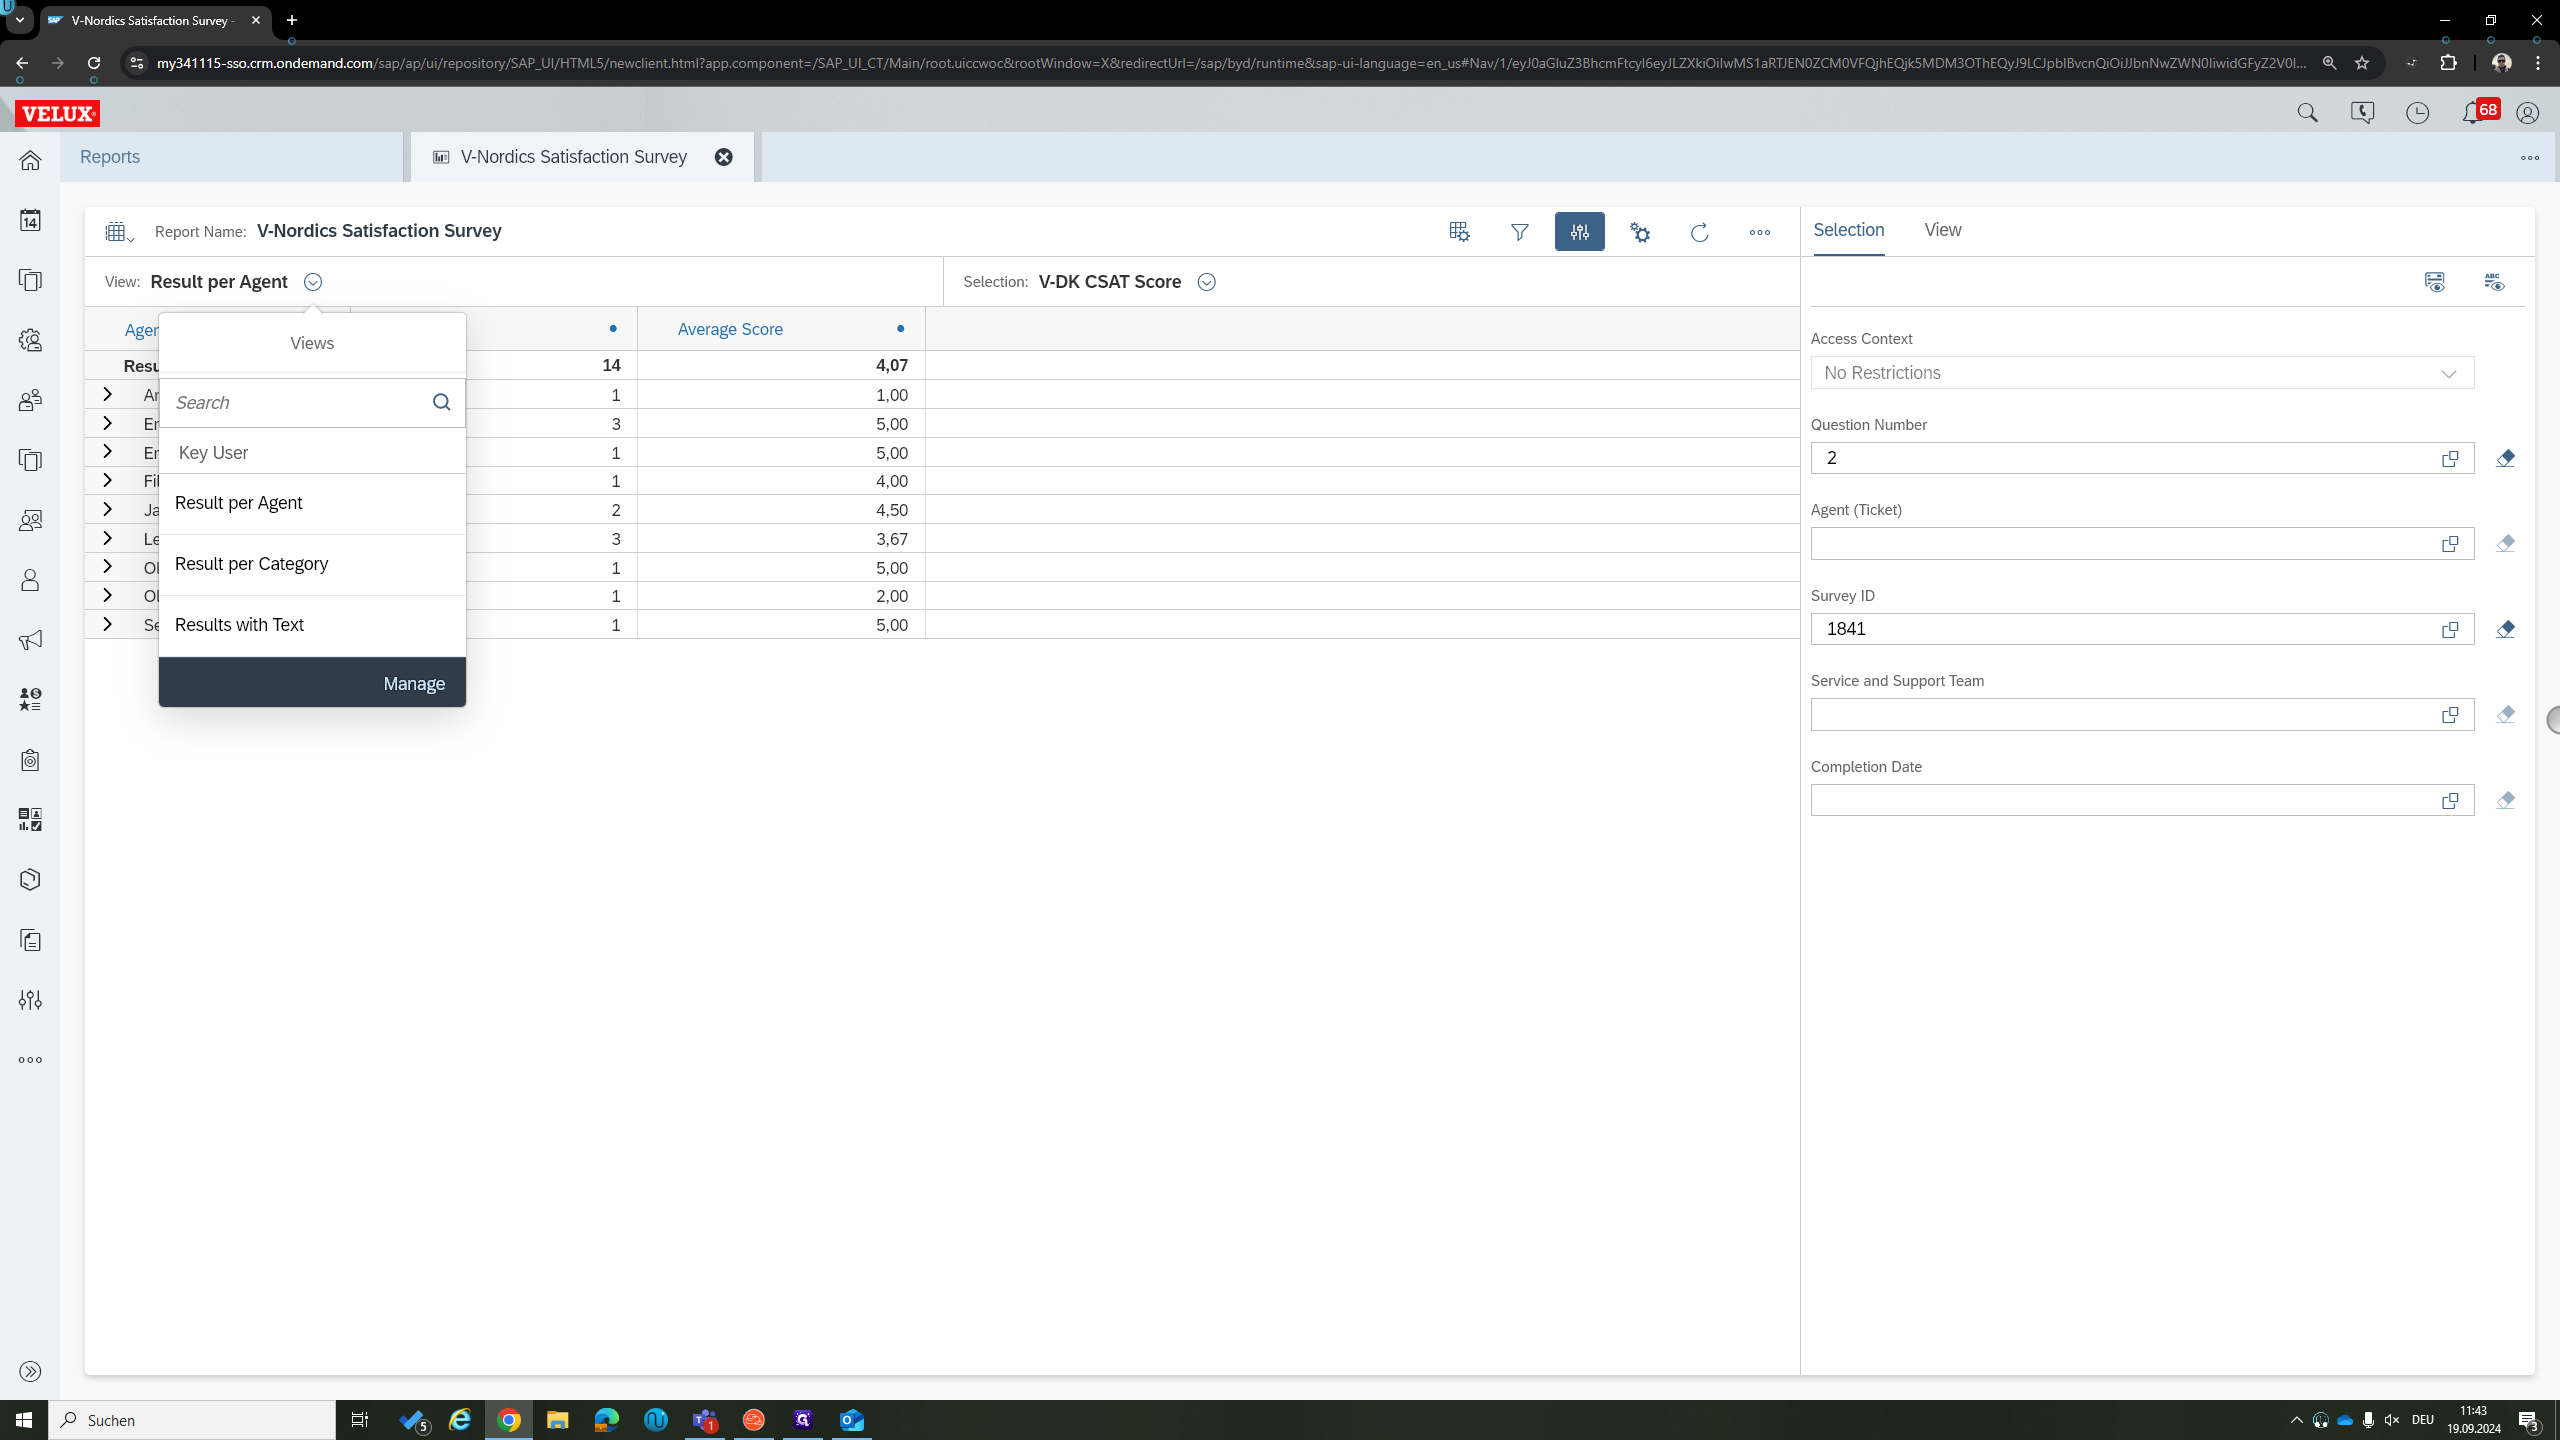
You can select either the FCR score or the CSAT score.
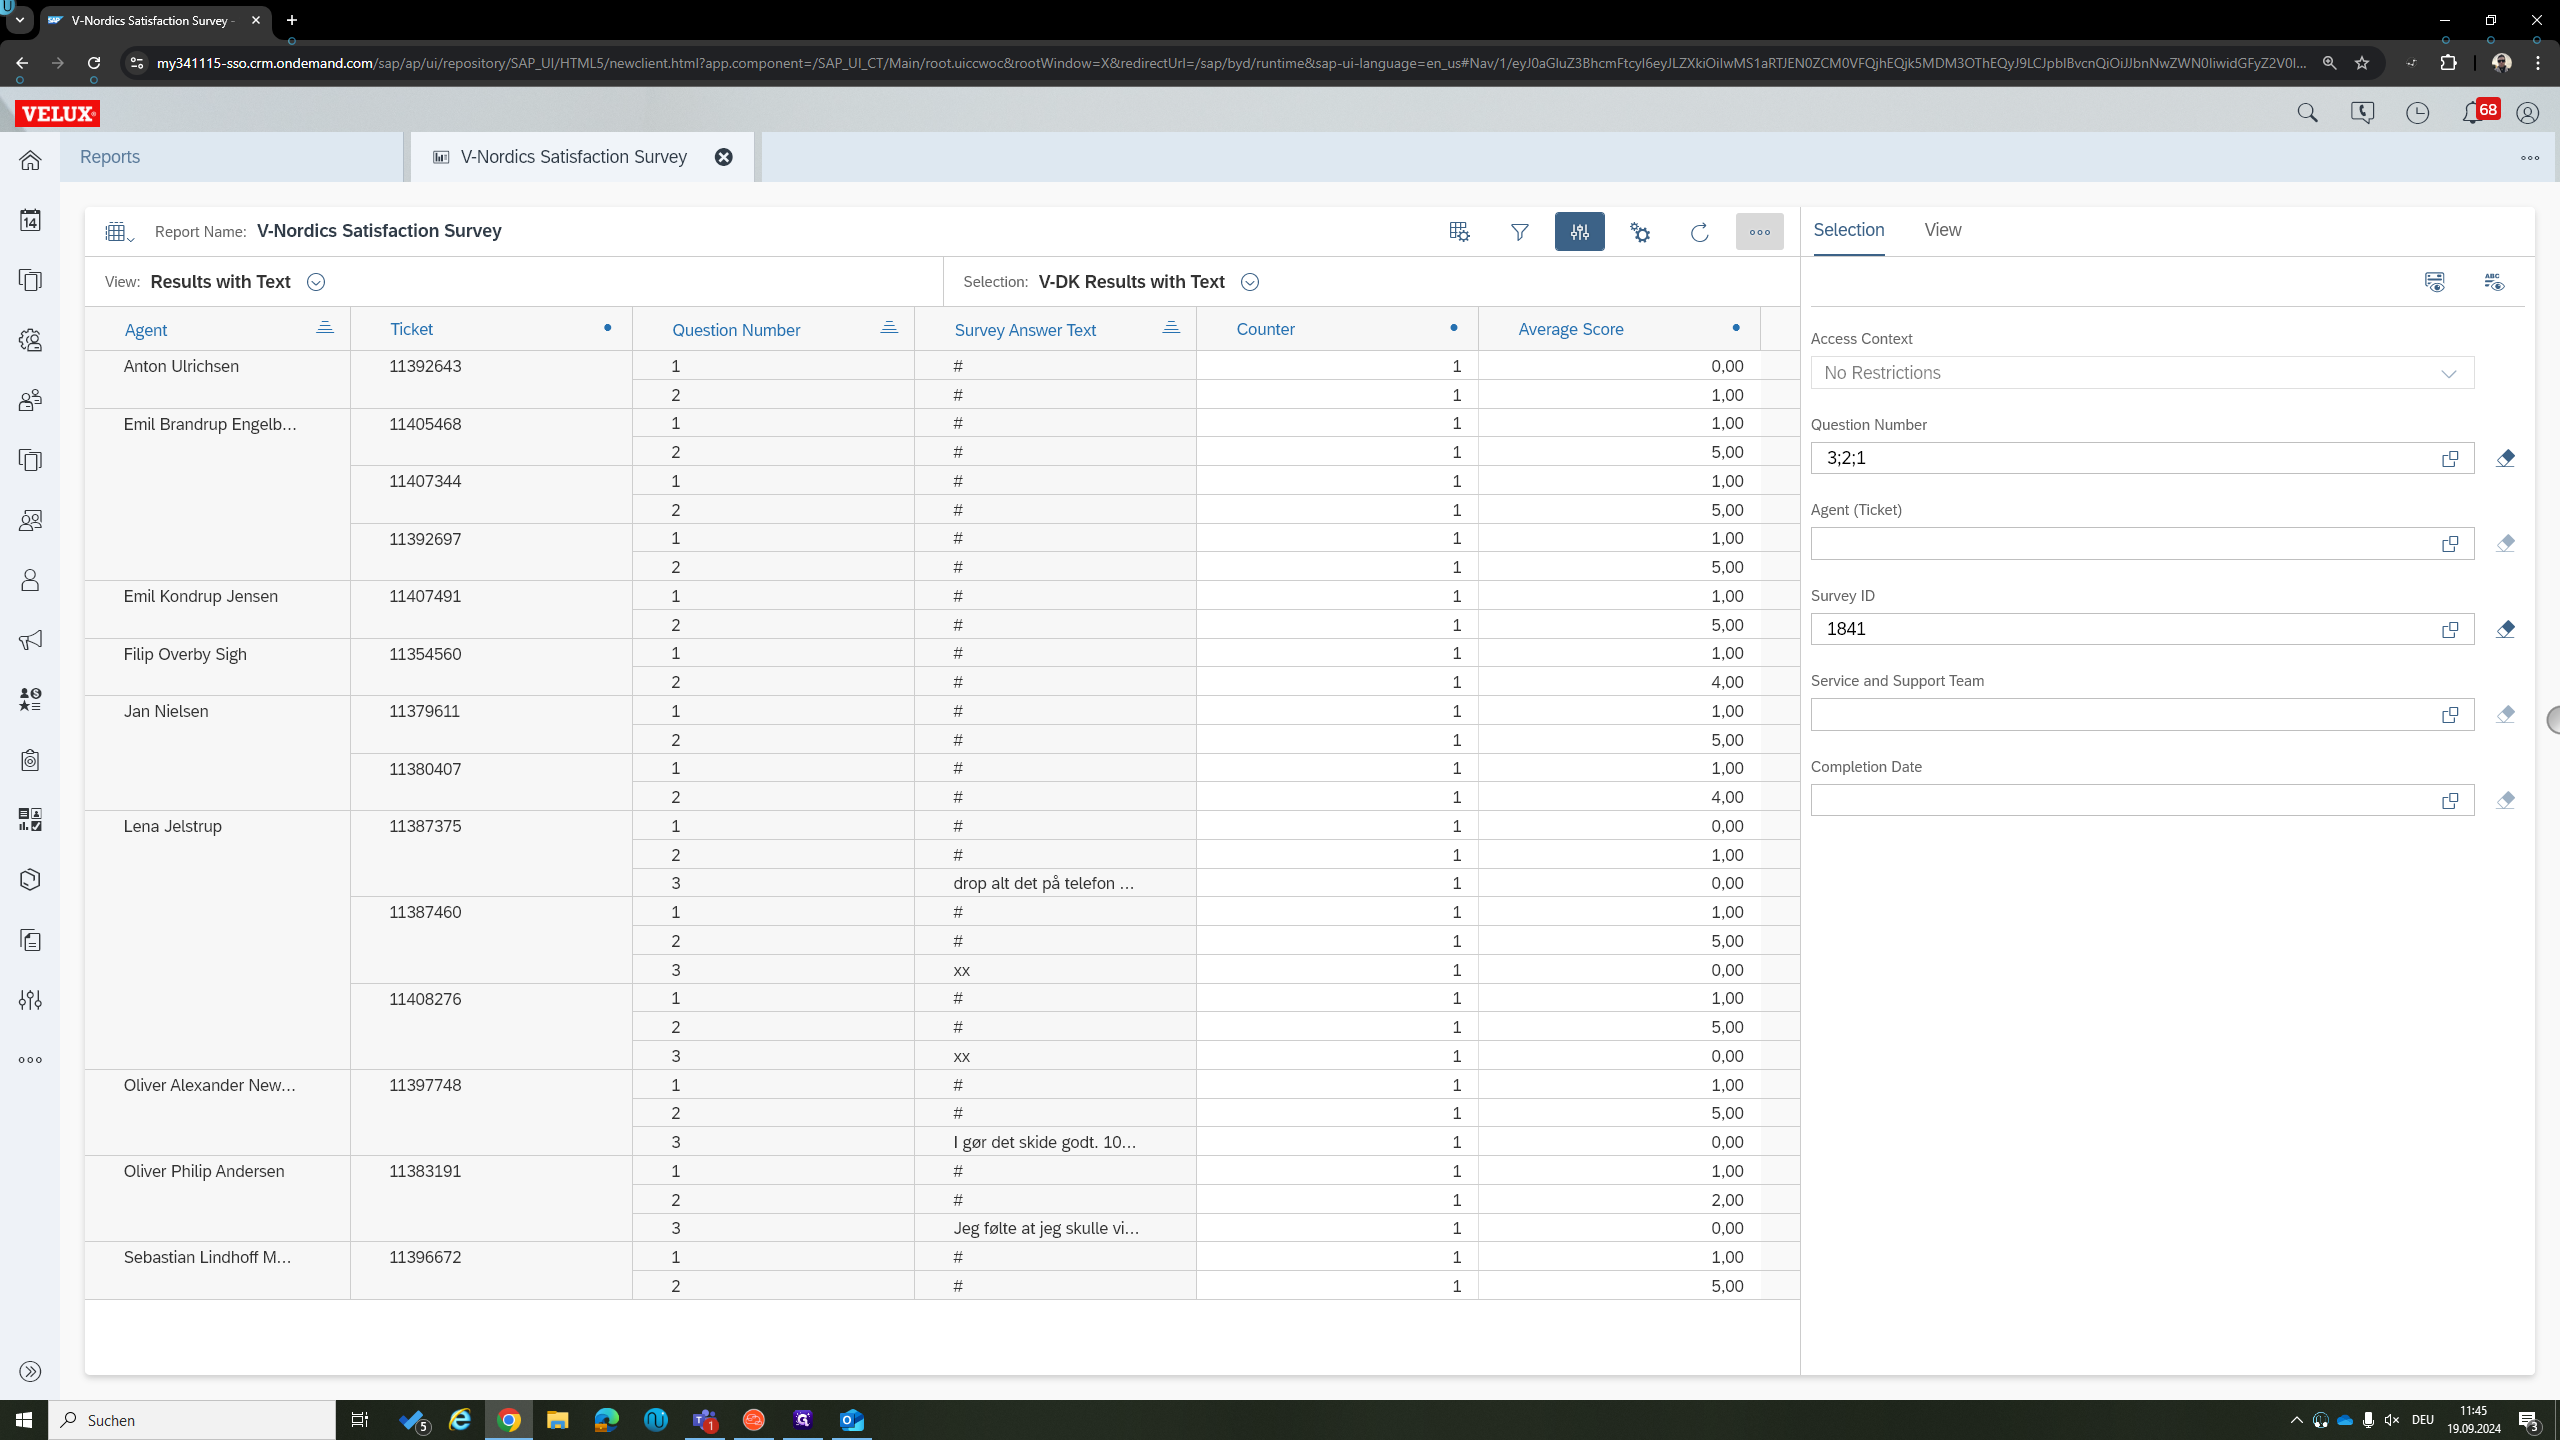
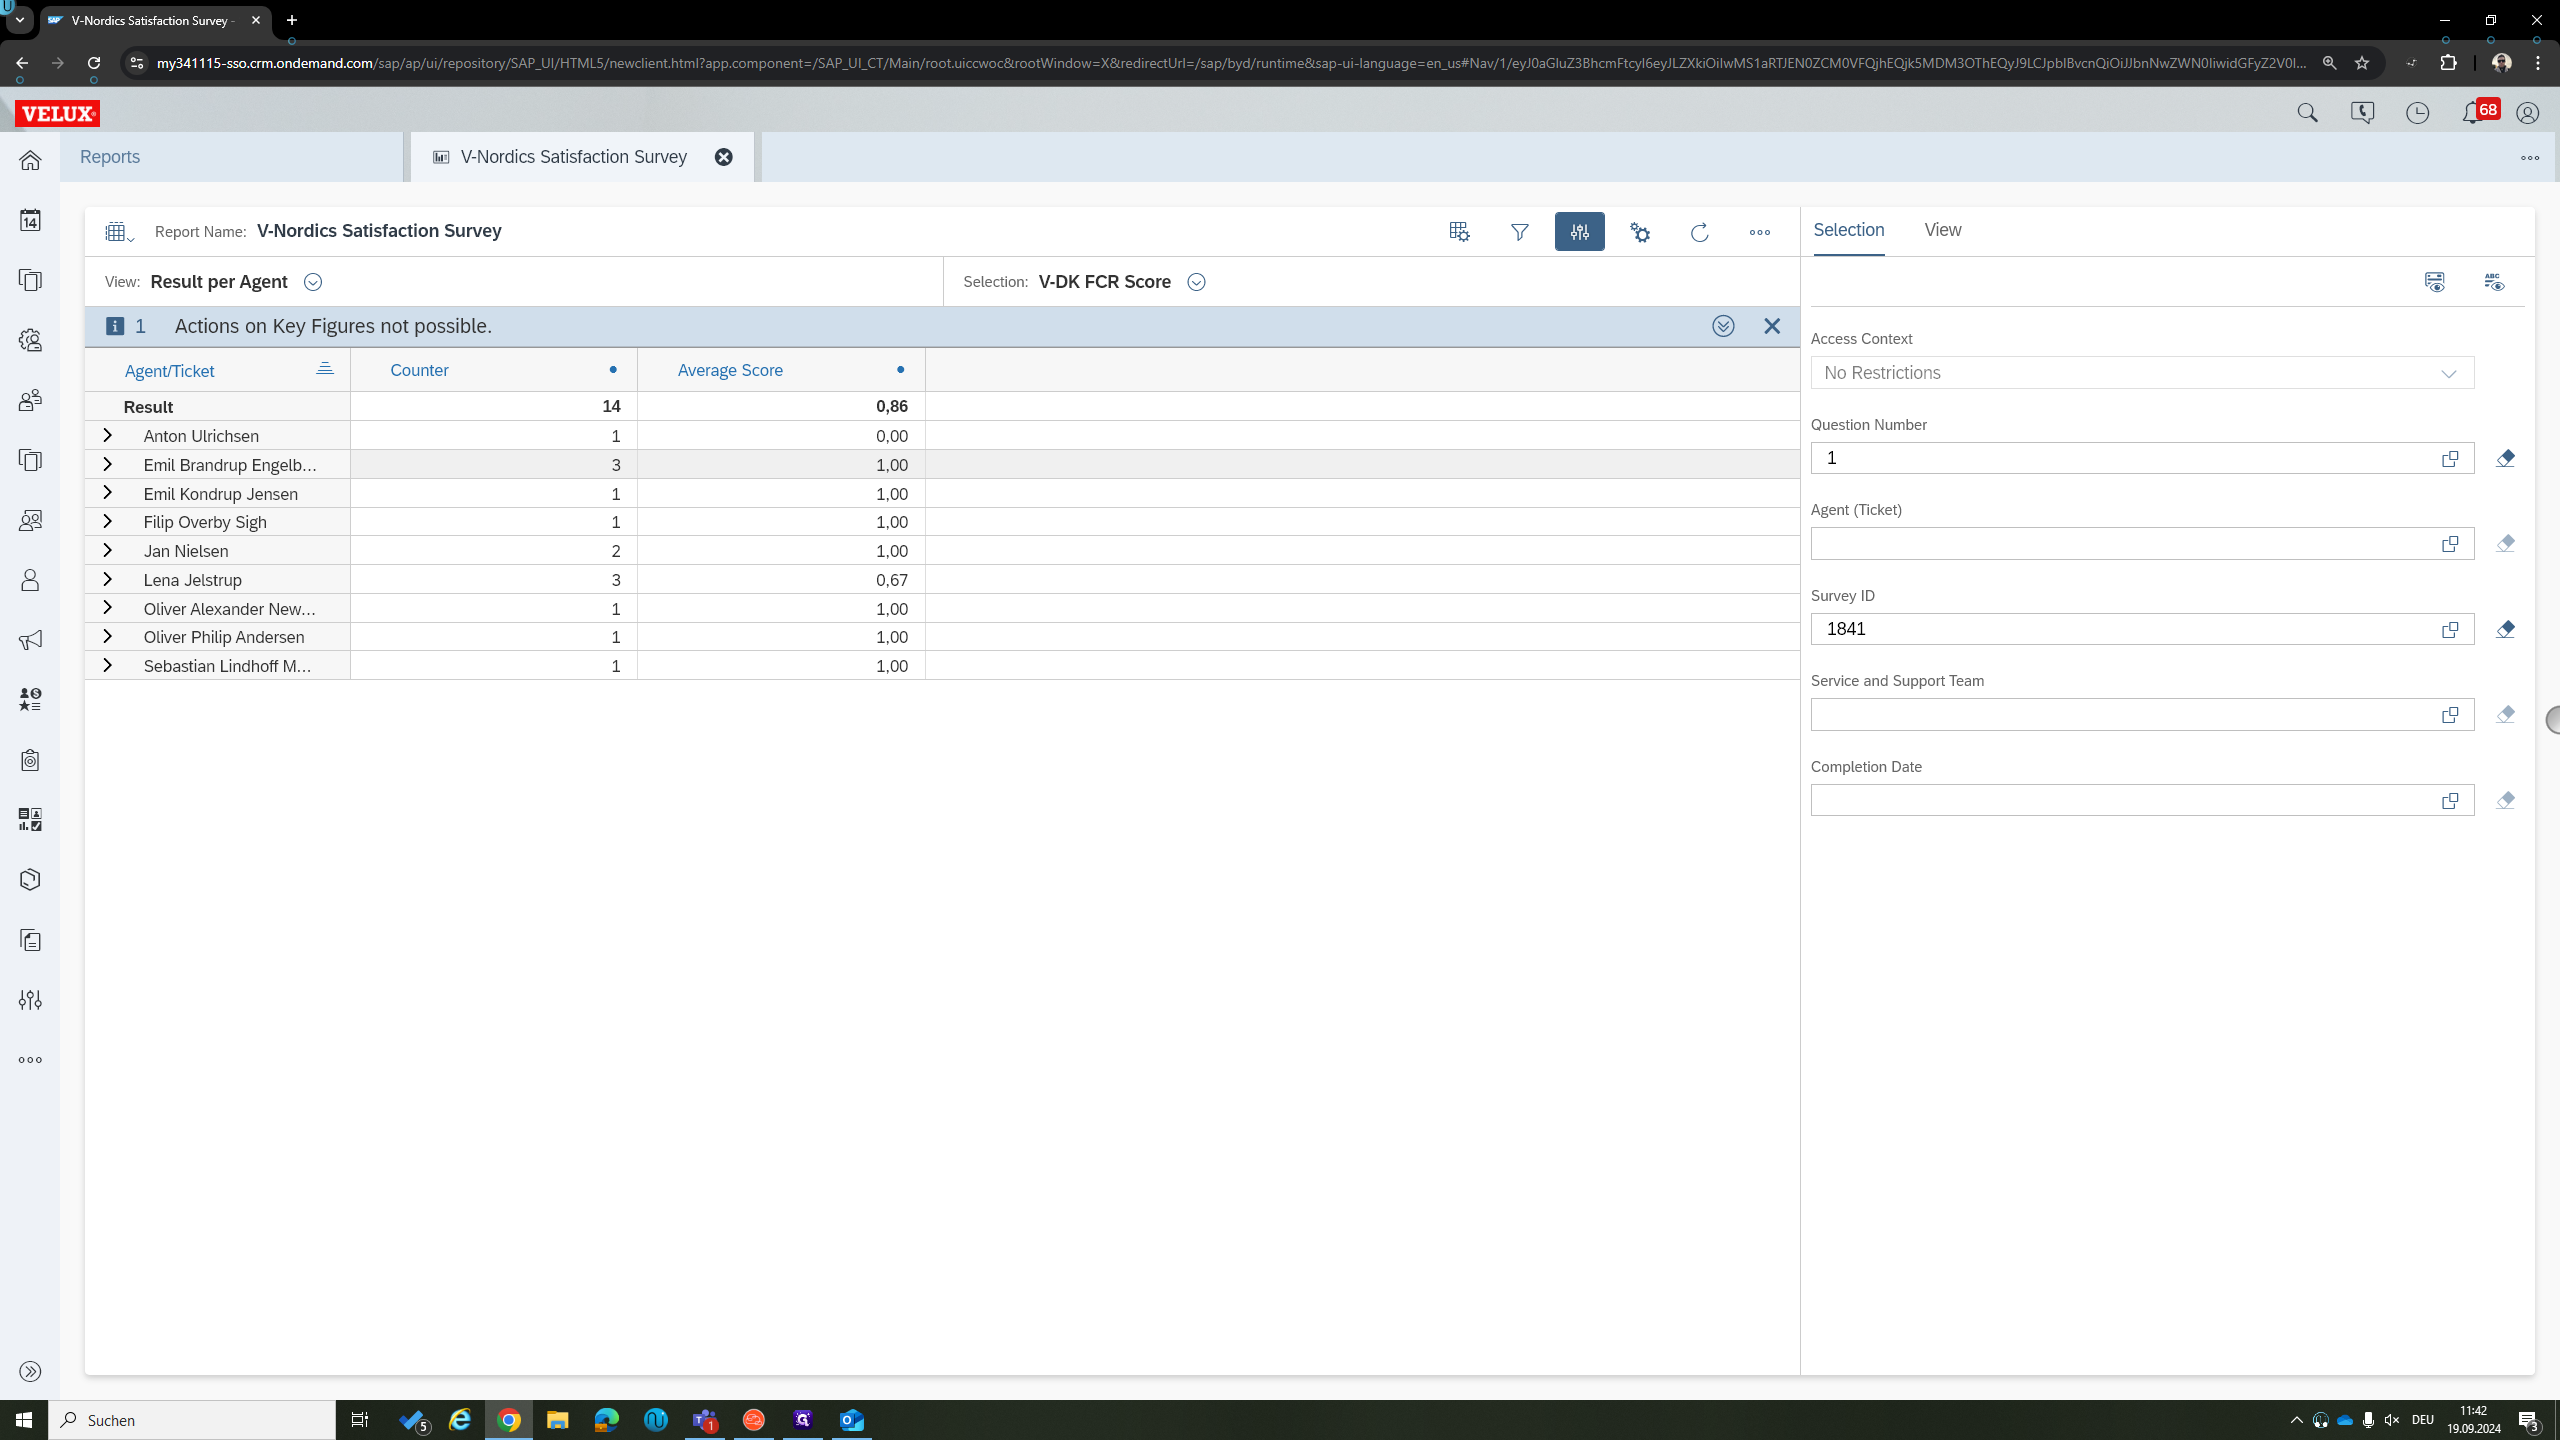
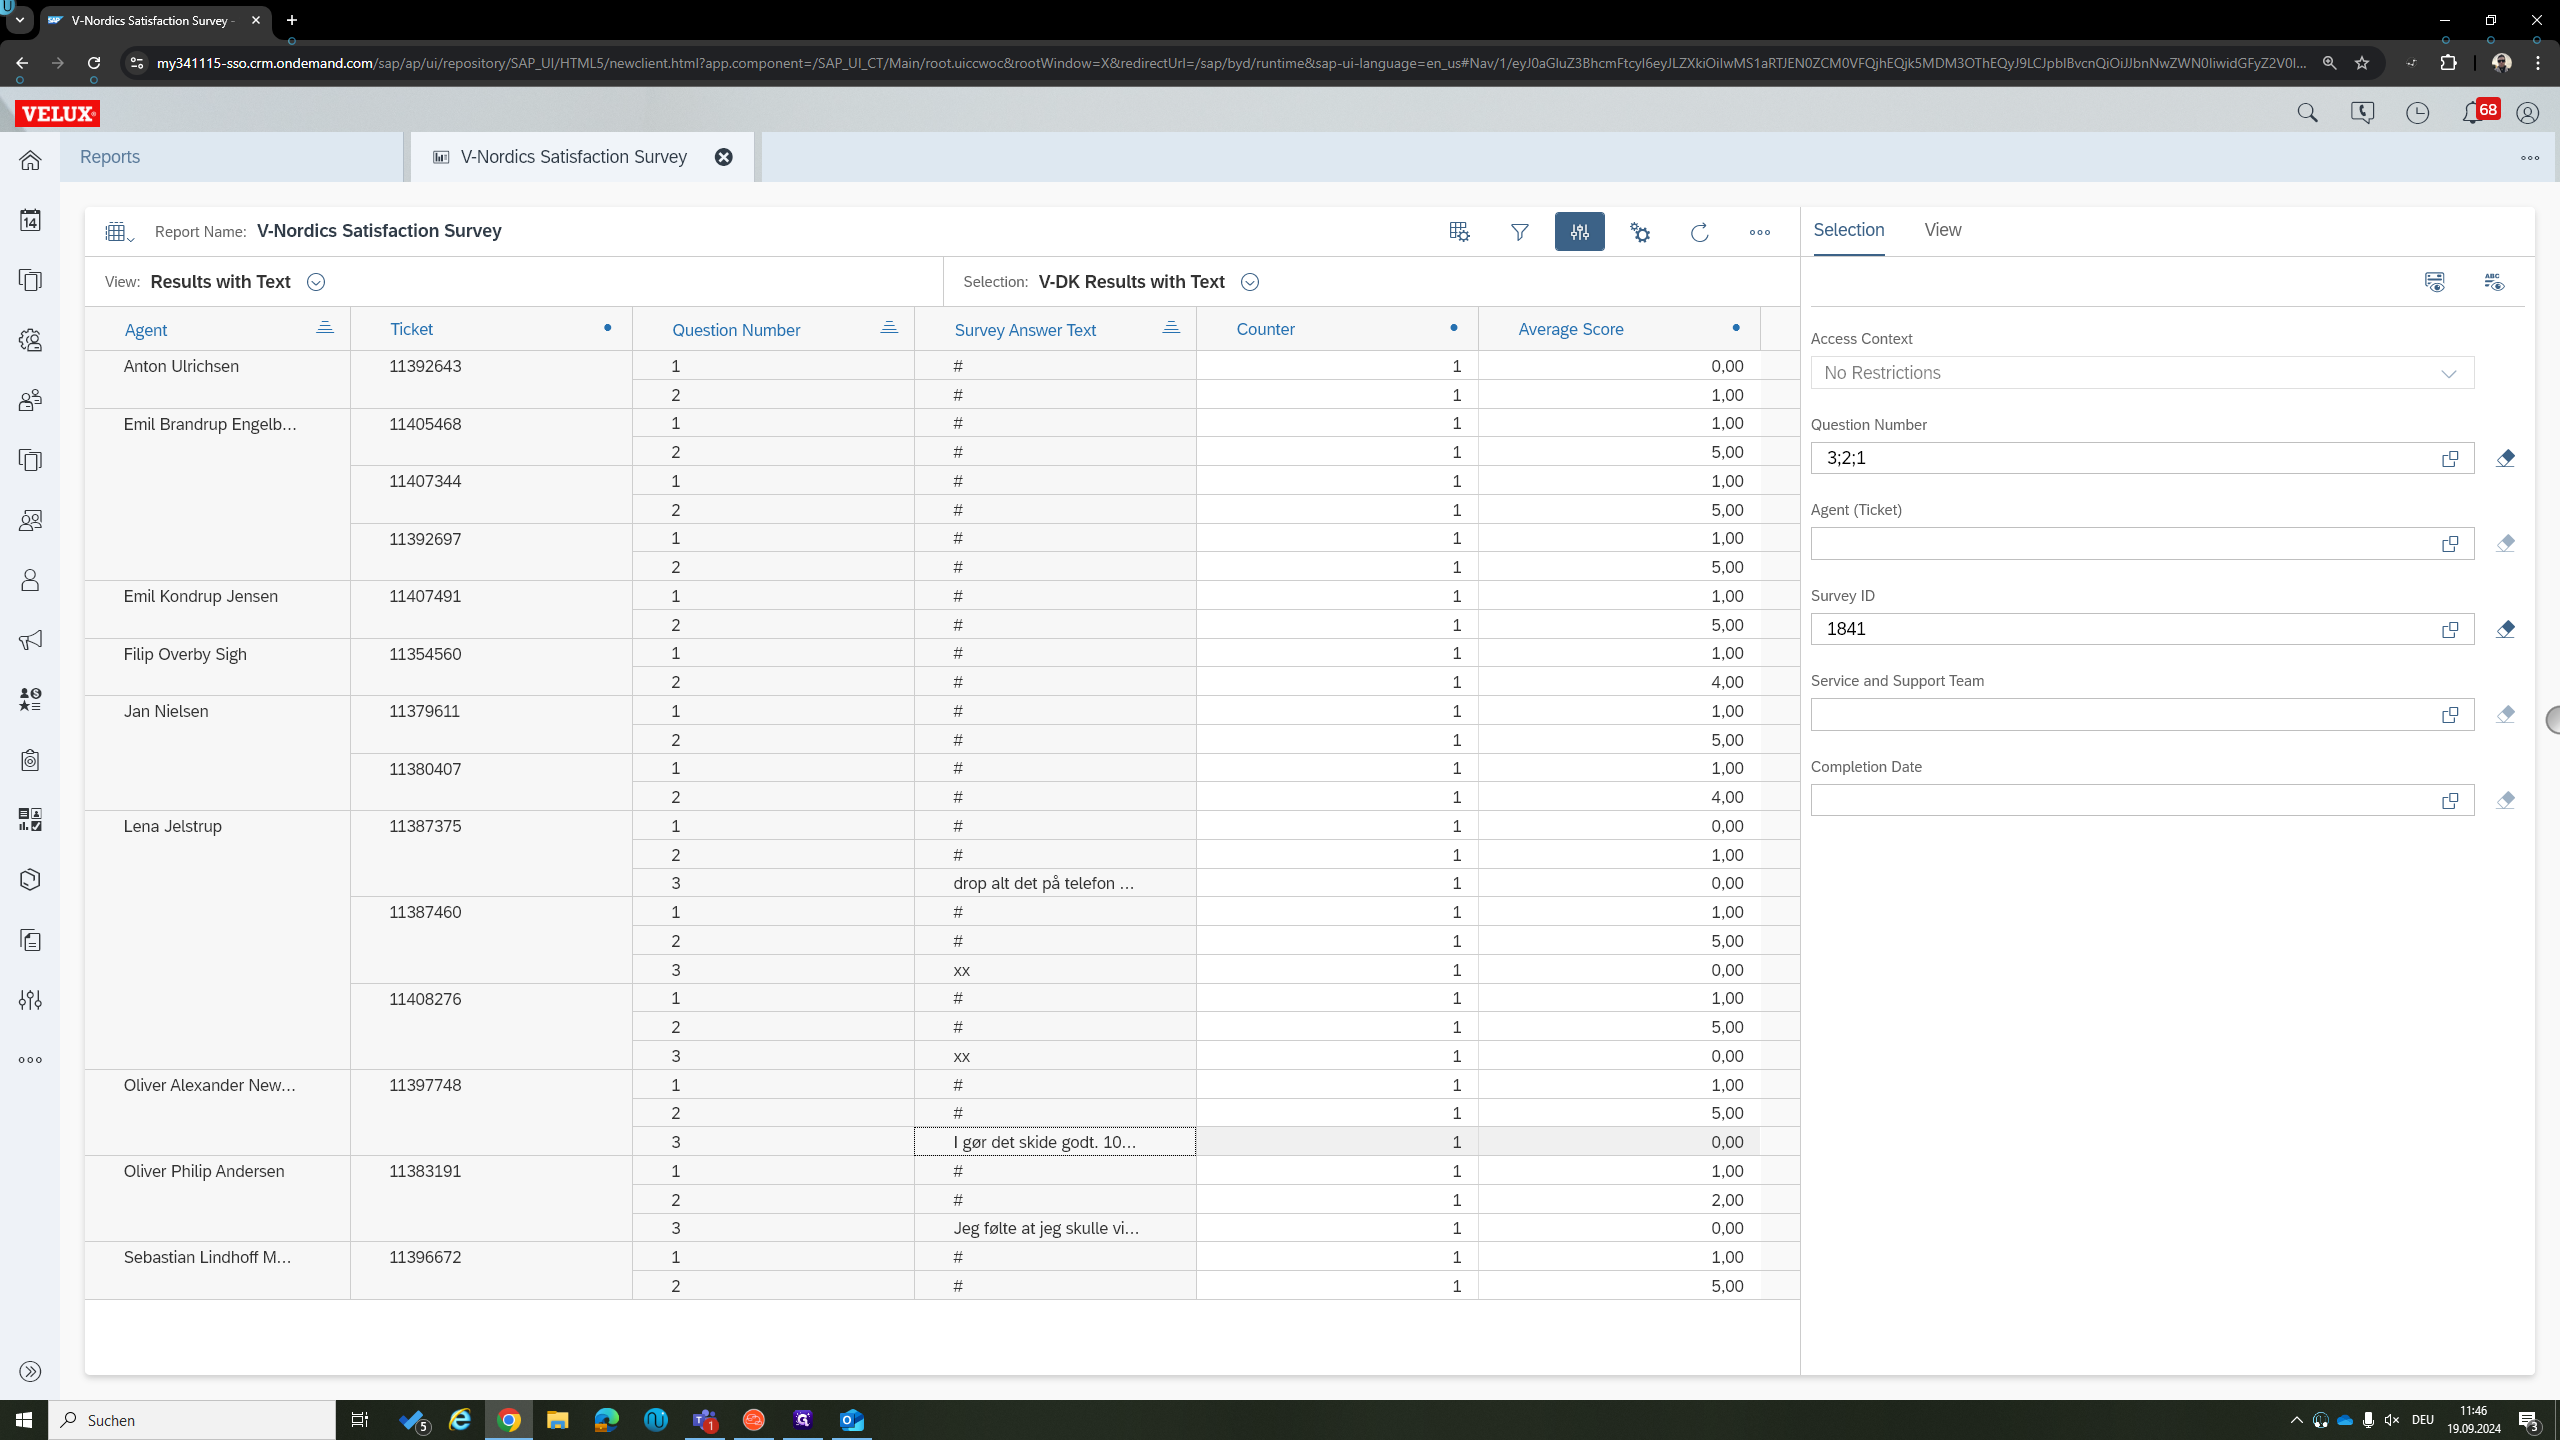
We also have question number three, which is free text. To display Text results, we need to change both the selection and the view!
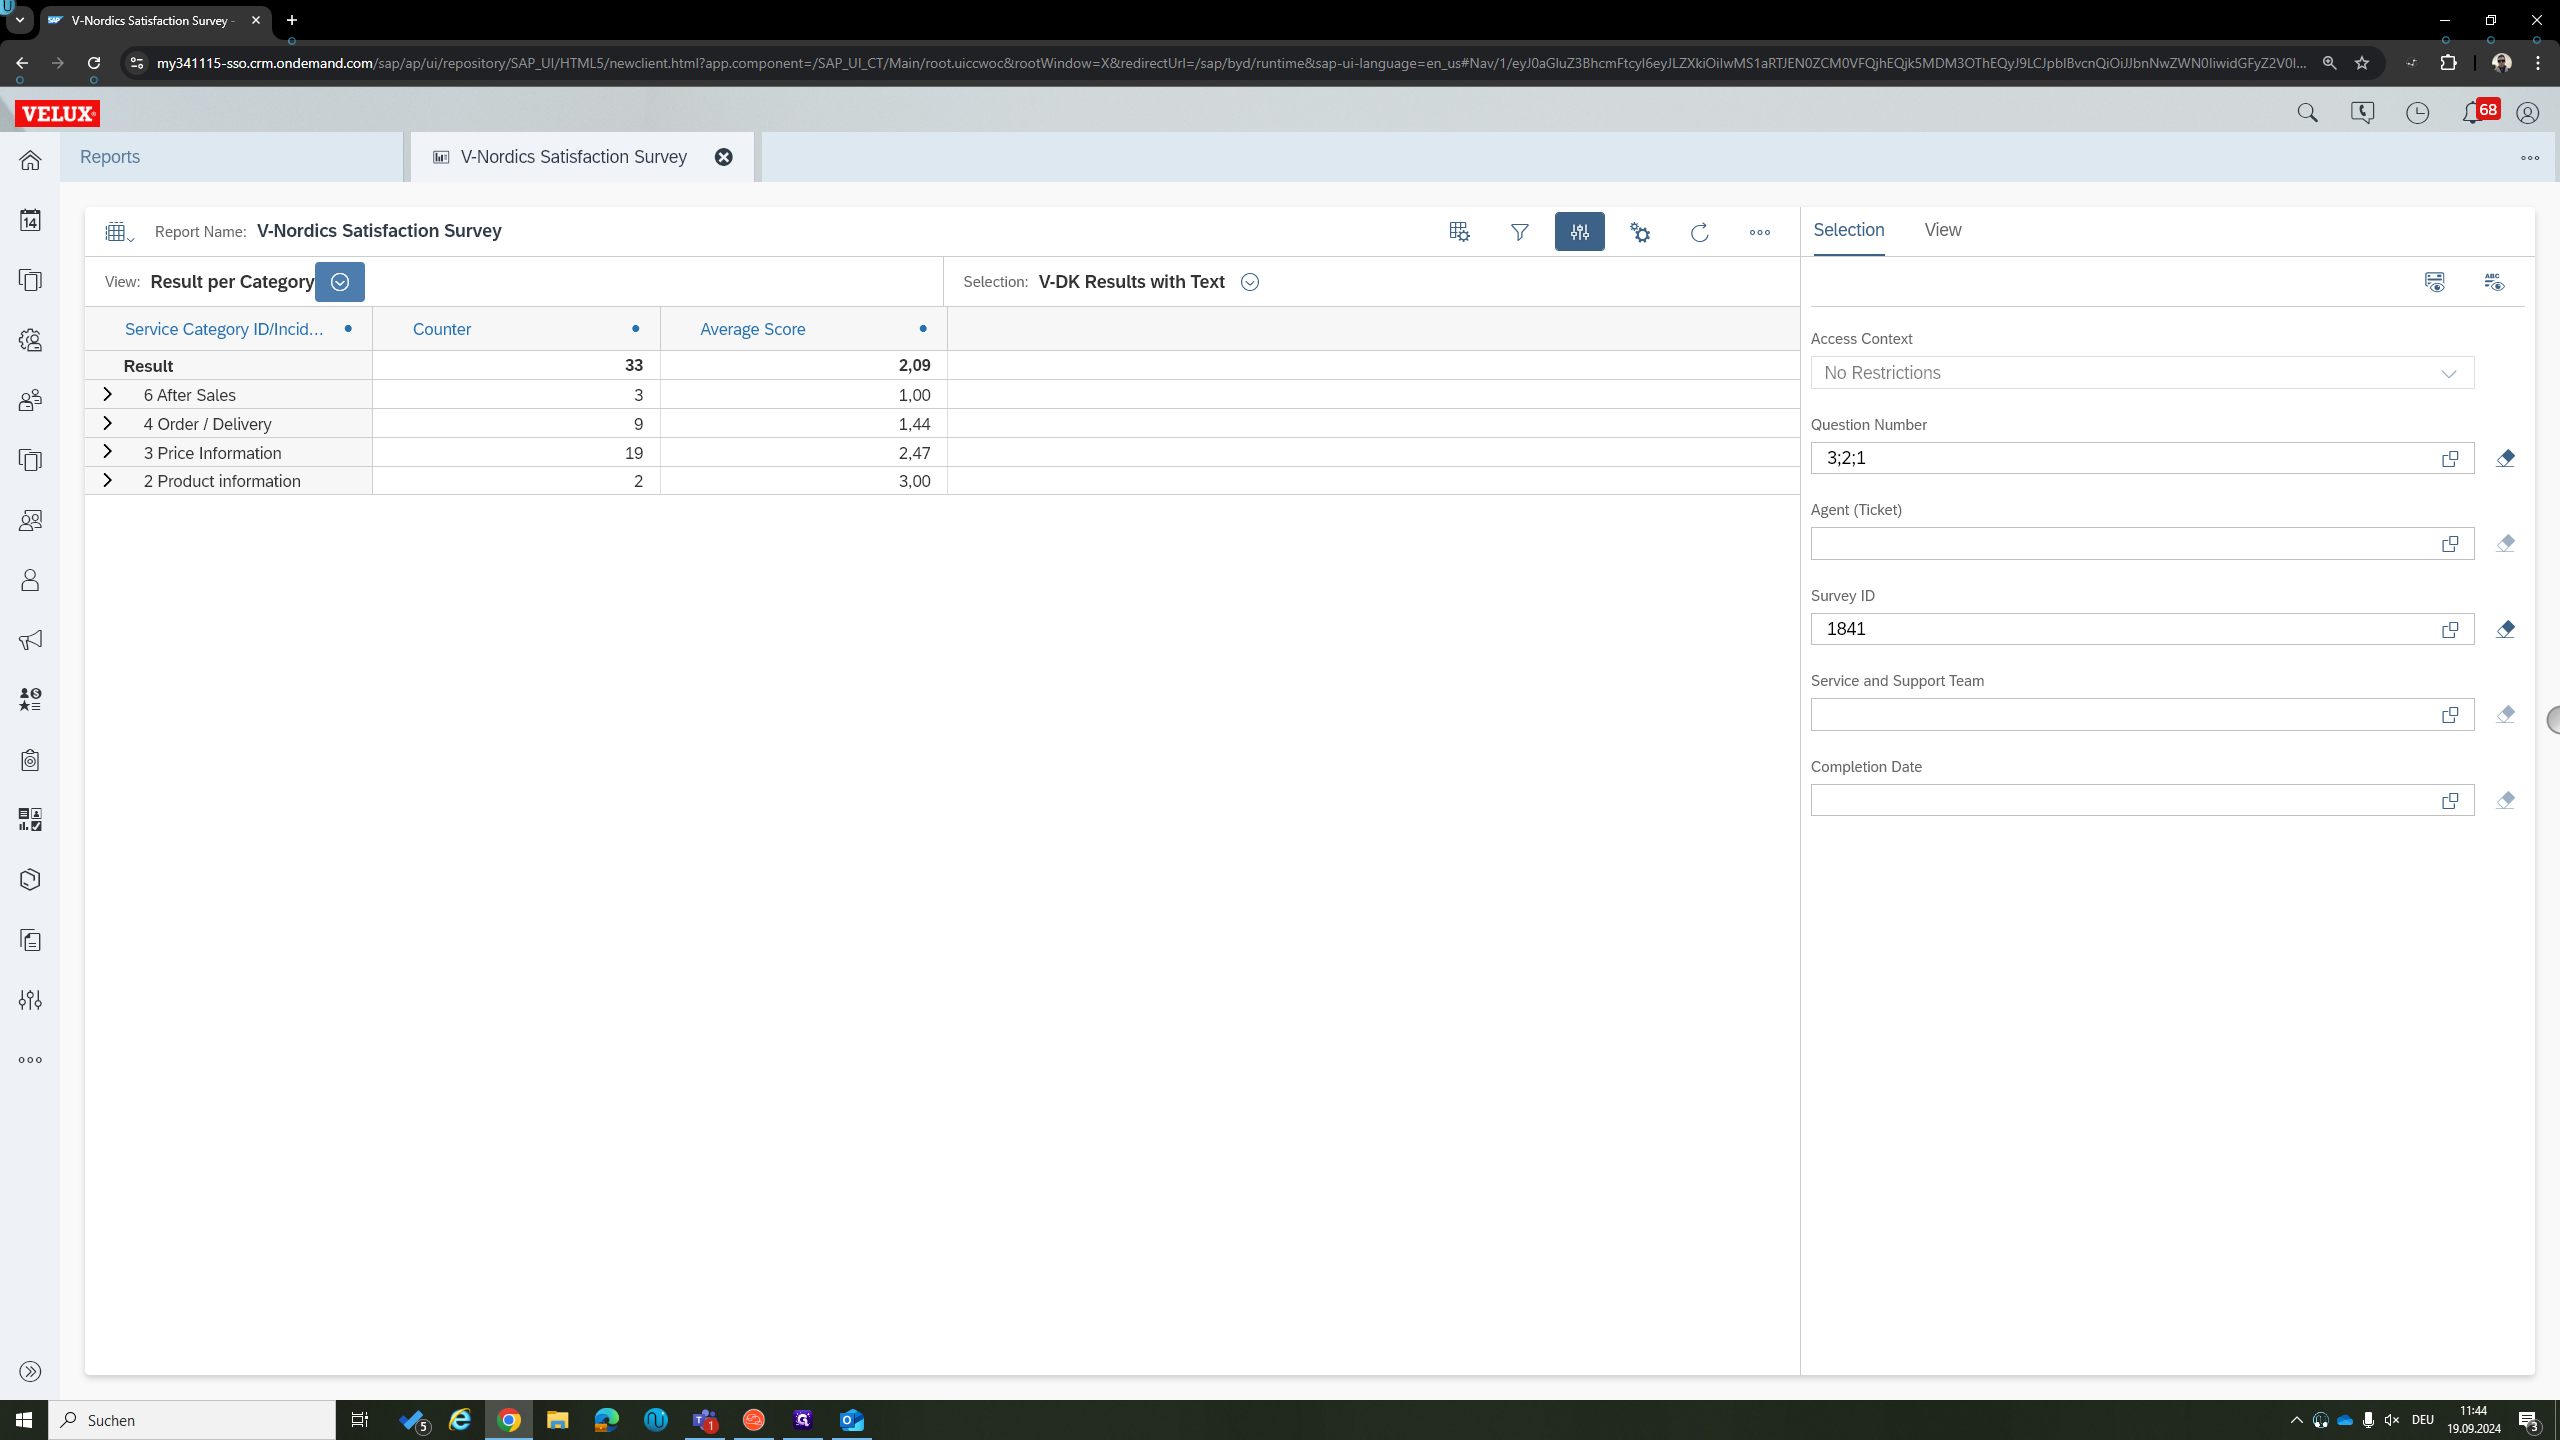
There is no other way to display this and put it into context. There are no filters you can set (for example only show results with CSAT below 3).
Every time question number three is filled, the text is displayed. You can hover the mouse over it to see the entire text.
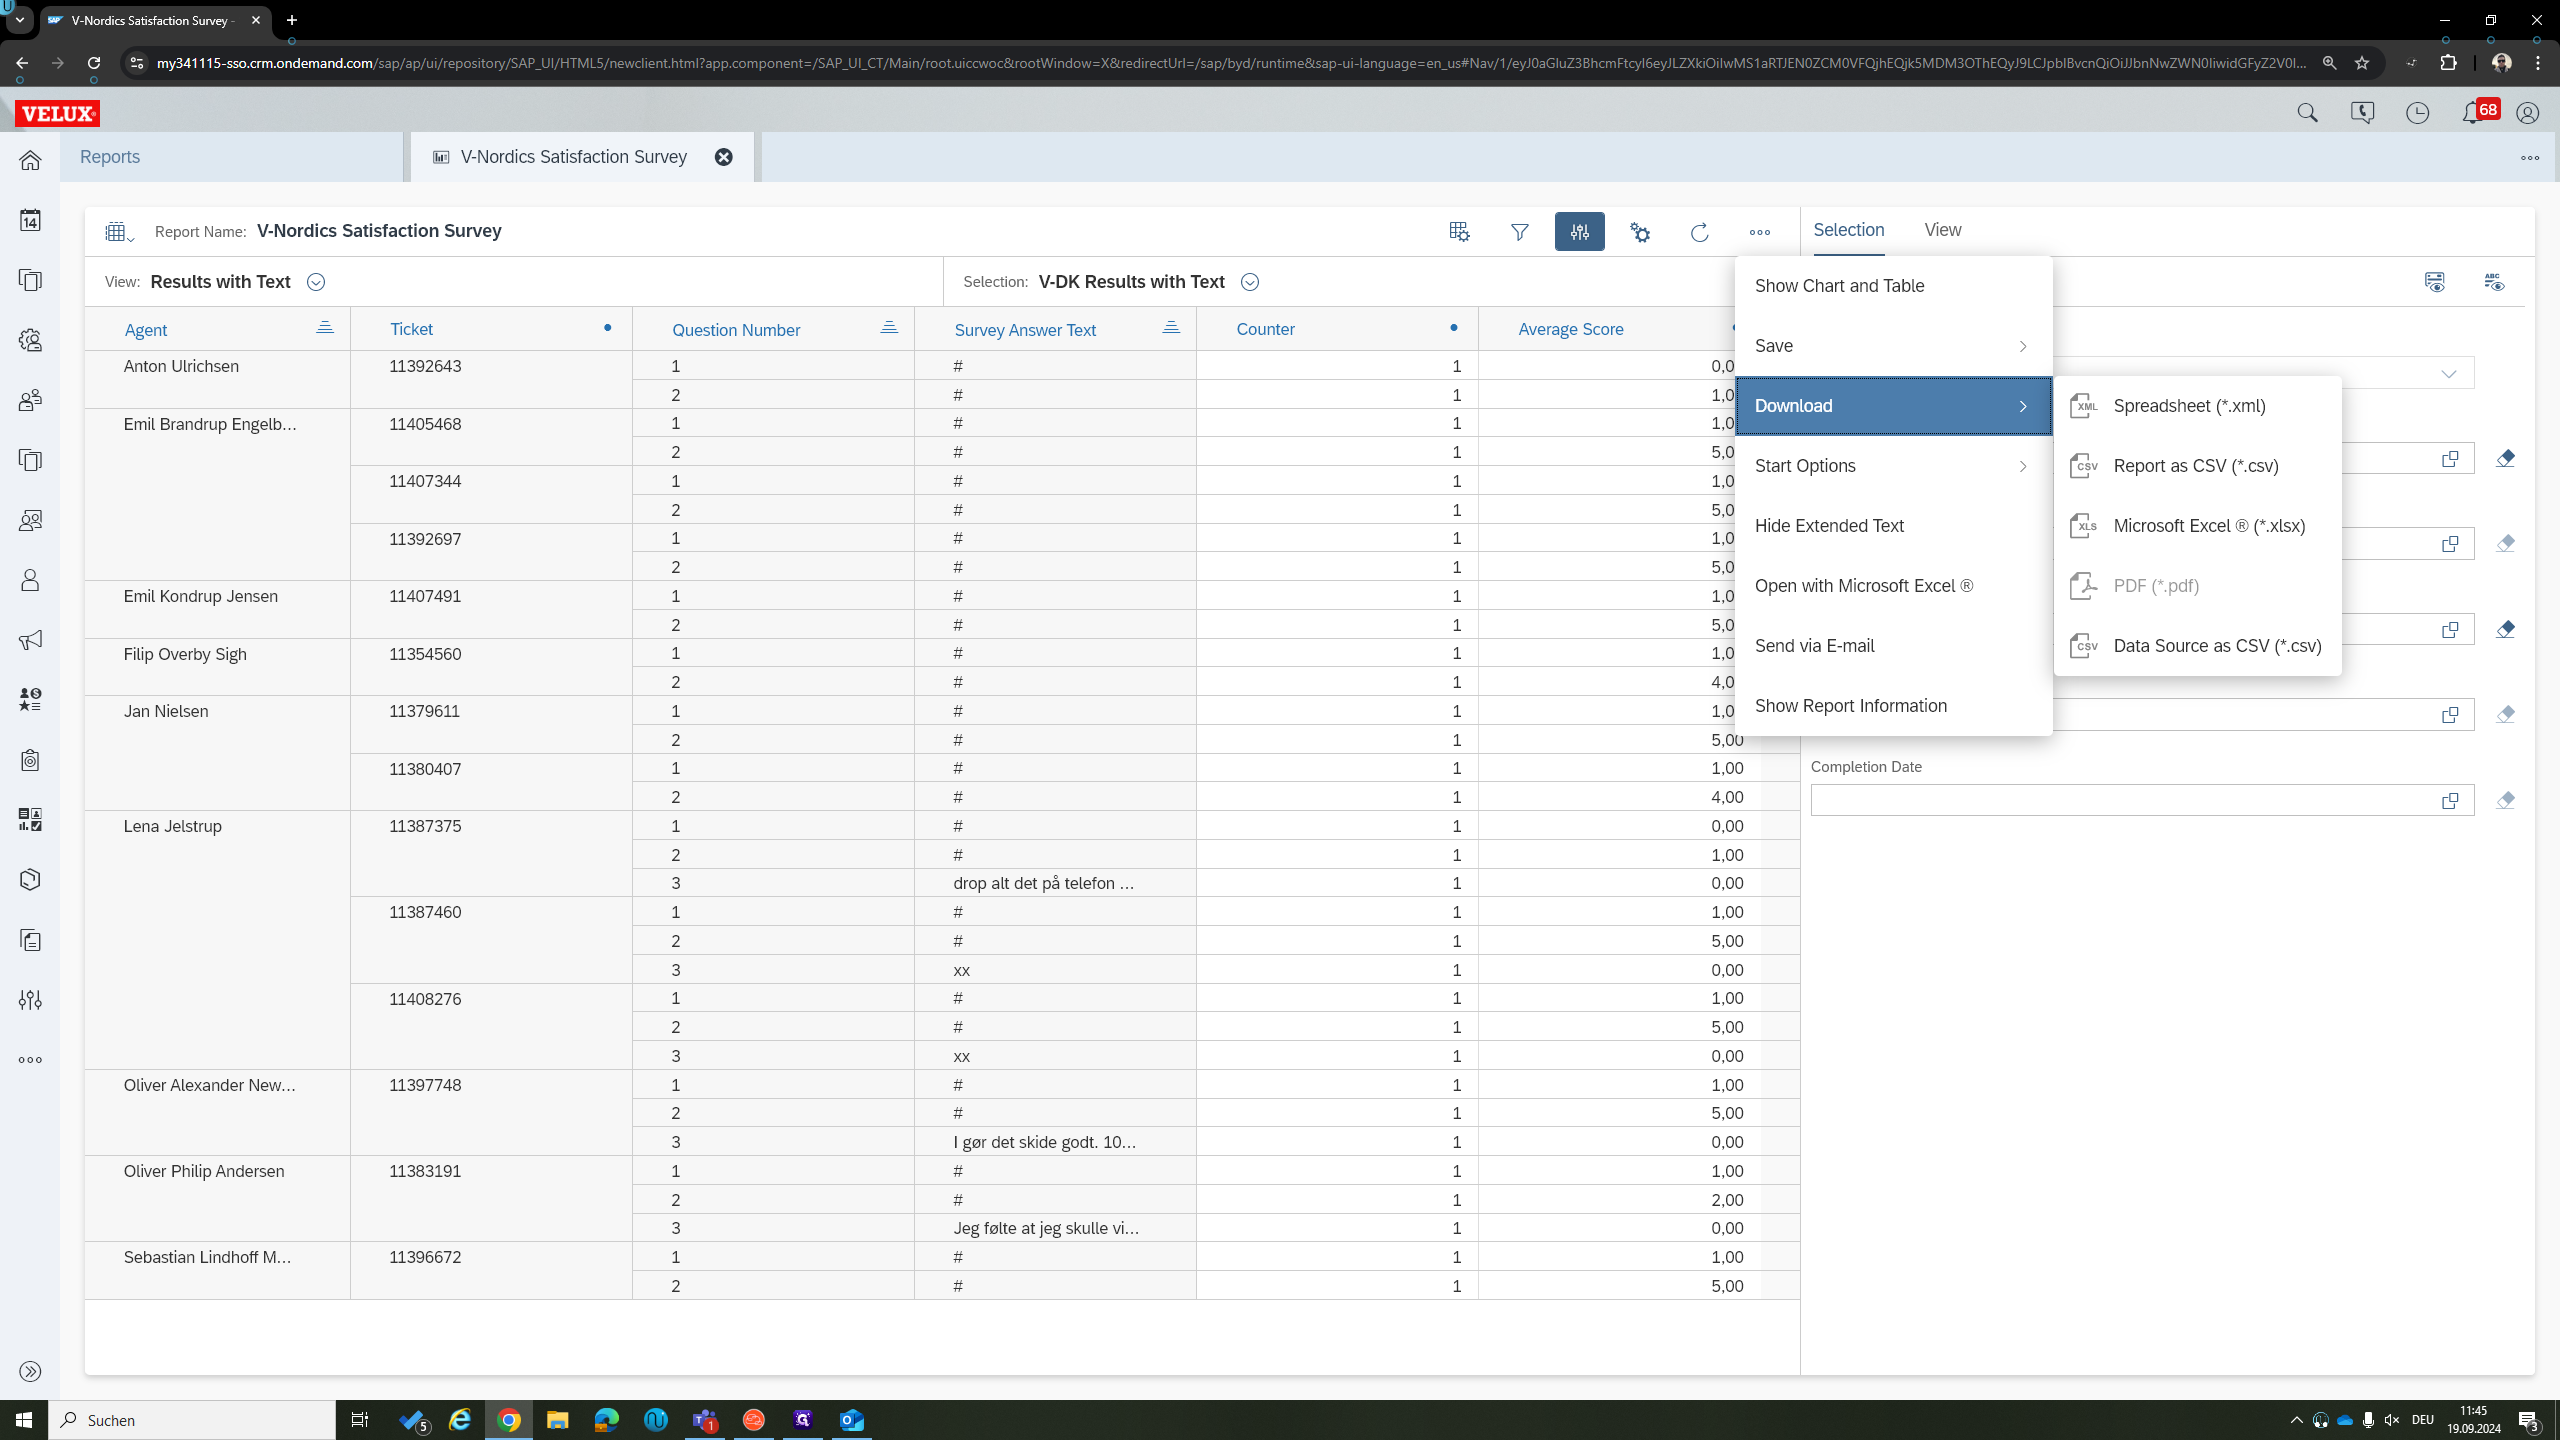
You can download it as an Excel spreadsheet or CSV file. This way, you have everything in context.