How to Review and Analyze Call Statistics
Learn how to access, filter, and interpret call statistics for your business, including inbound and outbound calls, call duration, lost calls, department breakdowns, and more. Discover how to export call data for further analysis.
By Dominik Black
In this guide, we'll learn how to review and understand call statistics for your store or branches. You will see how to access key data such as call volumes, average durations, waiting times, and call outcomes. We will also look at how to filter and export this information for further analysis.
Let's get started
In this article, we will review the call statistics.
1
To begin, go to Communications.
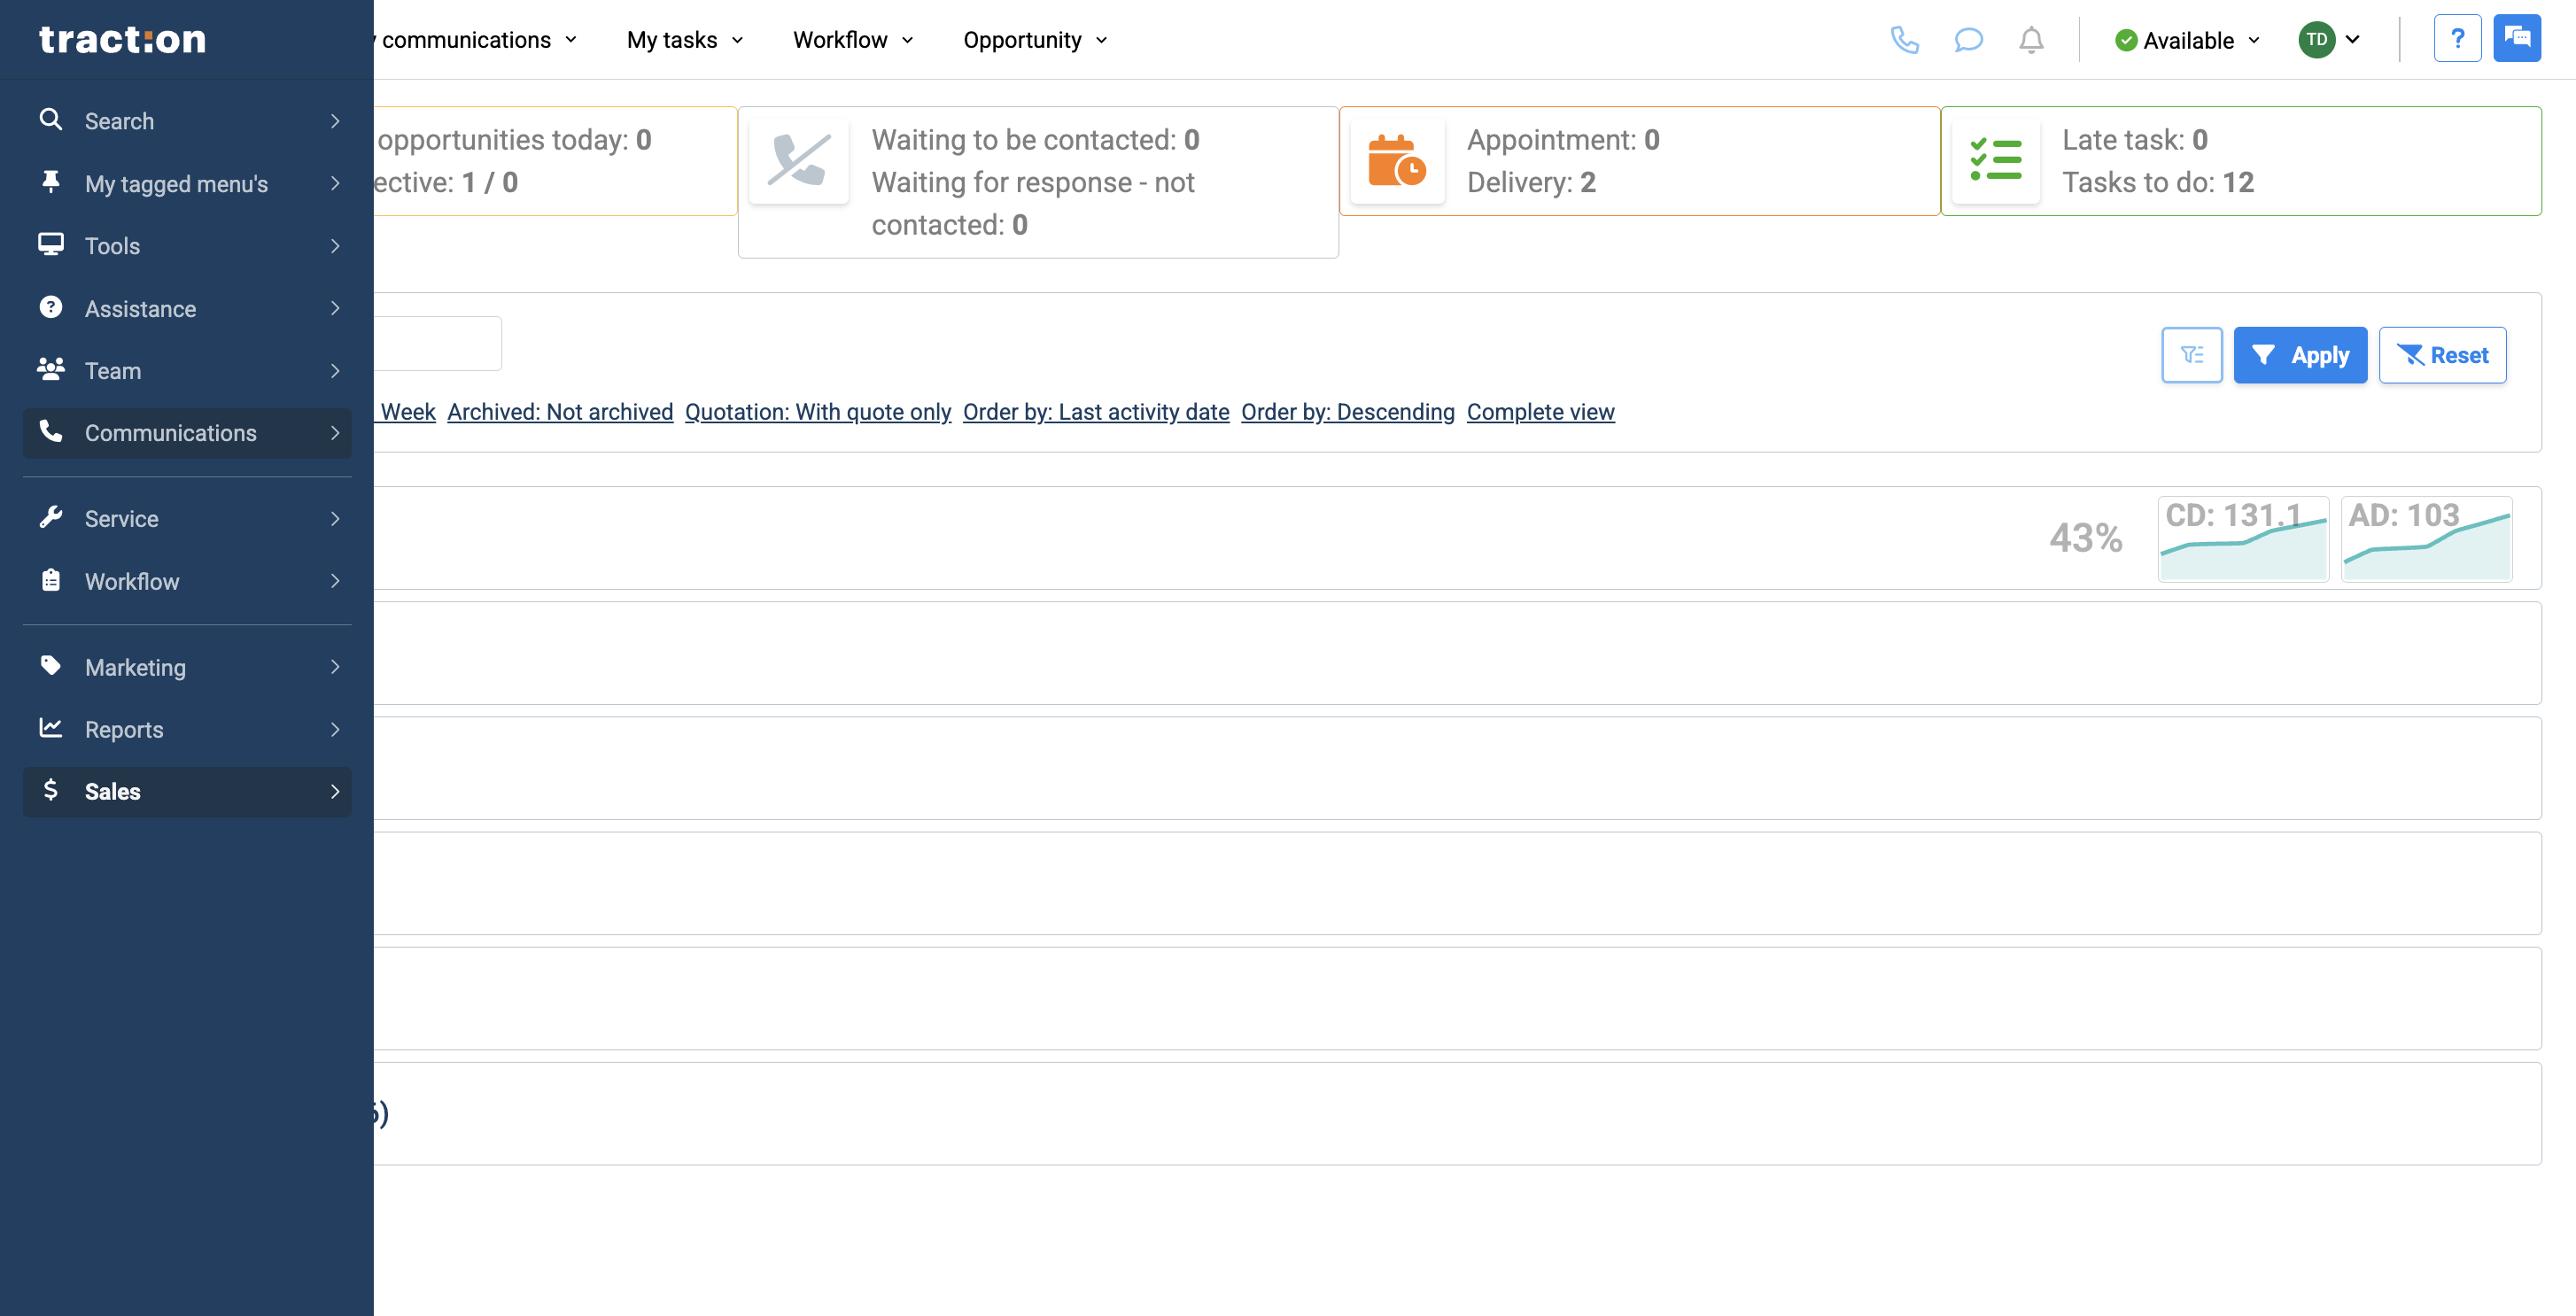
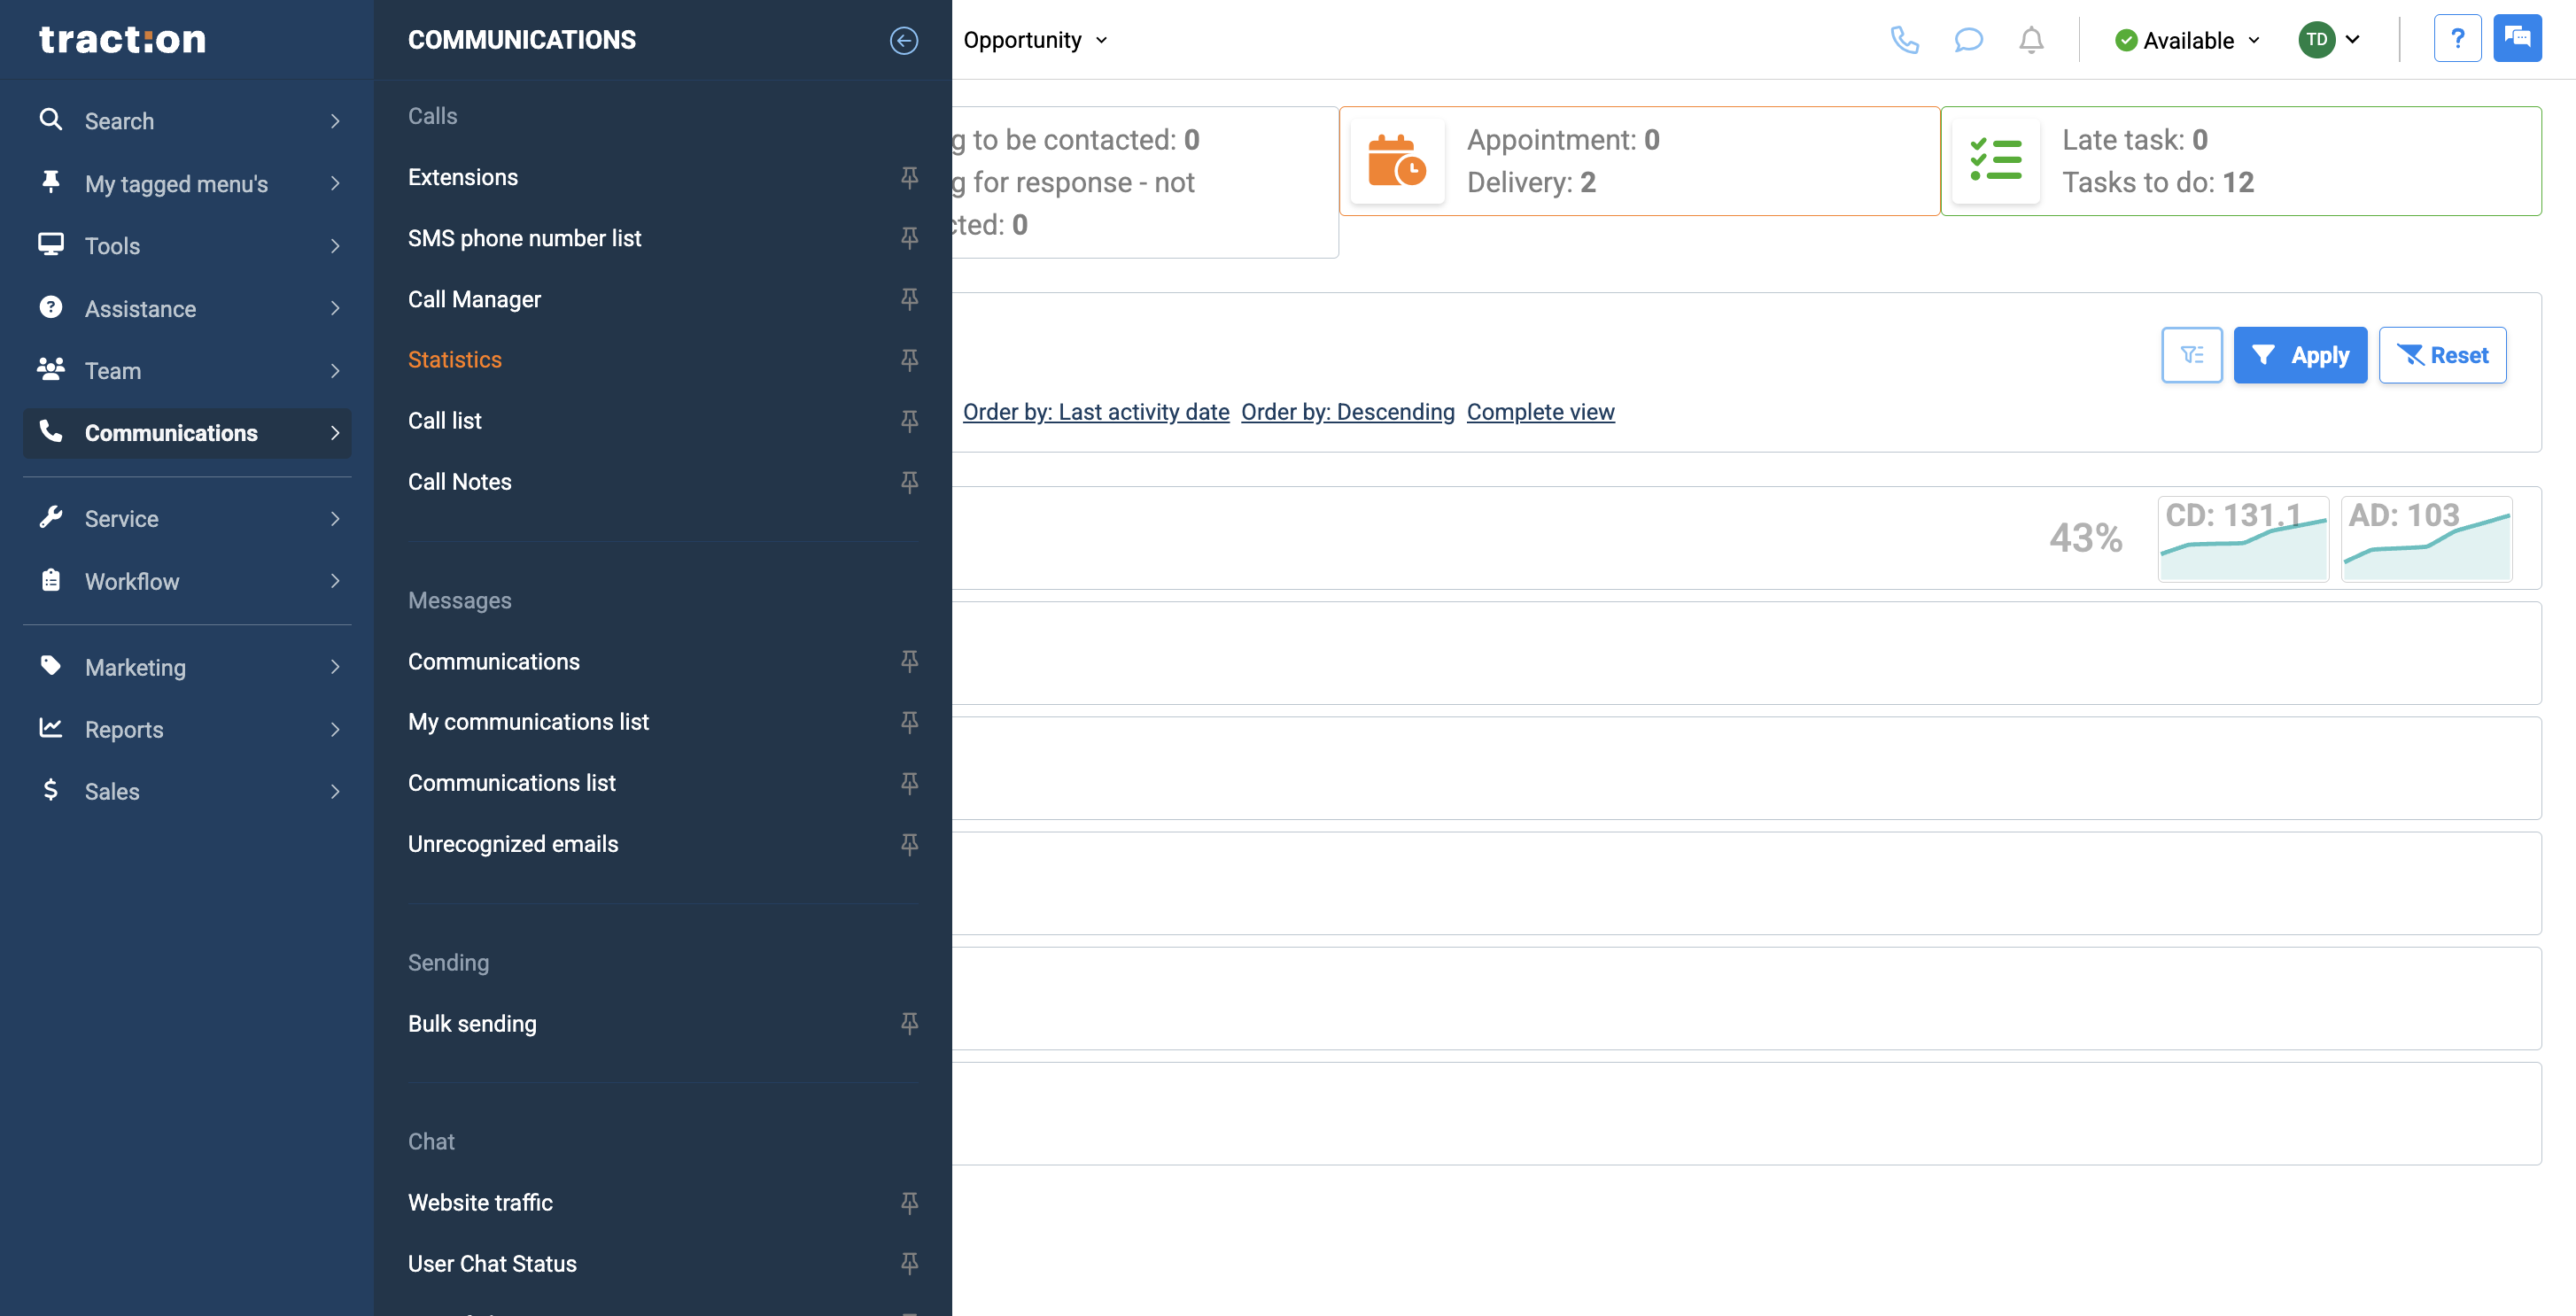
2
Under Calls, click on Statistics.
3
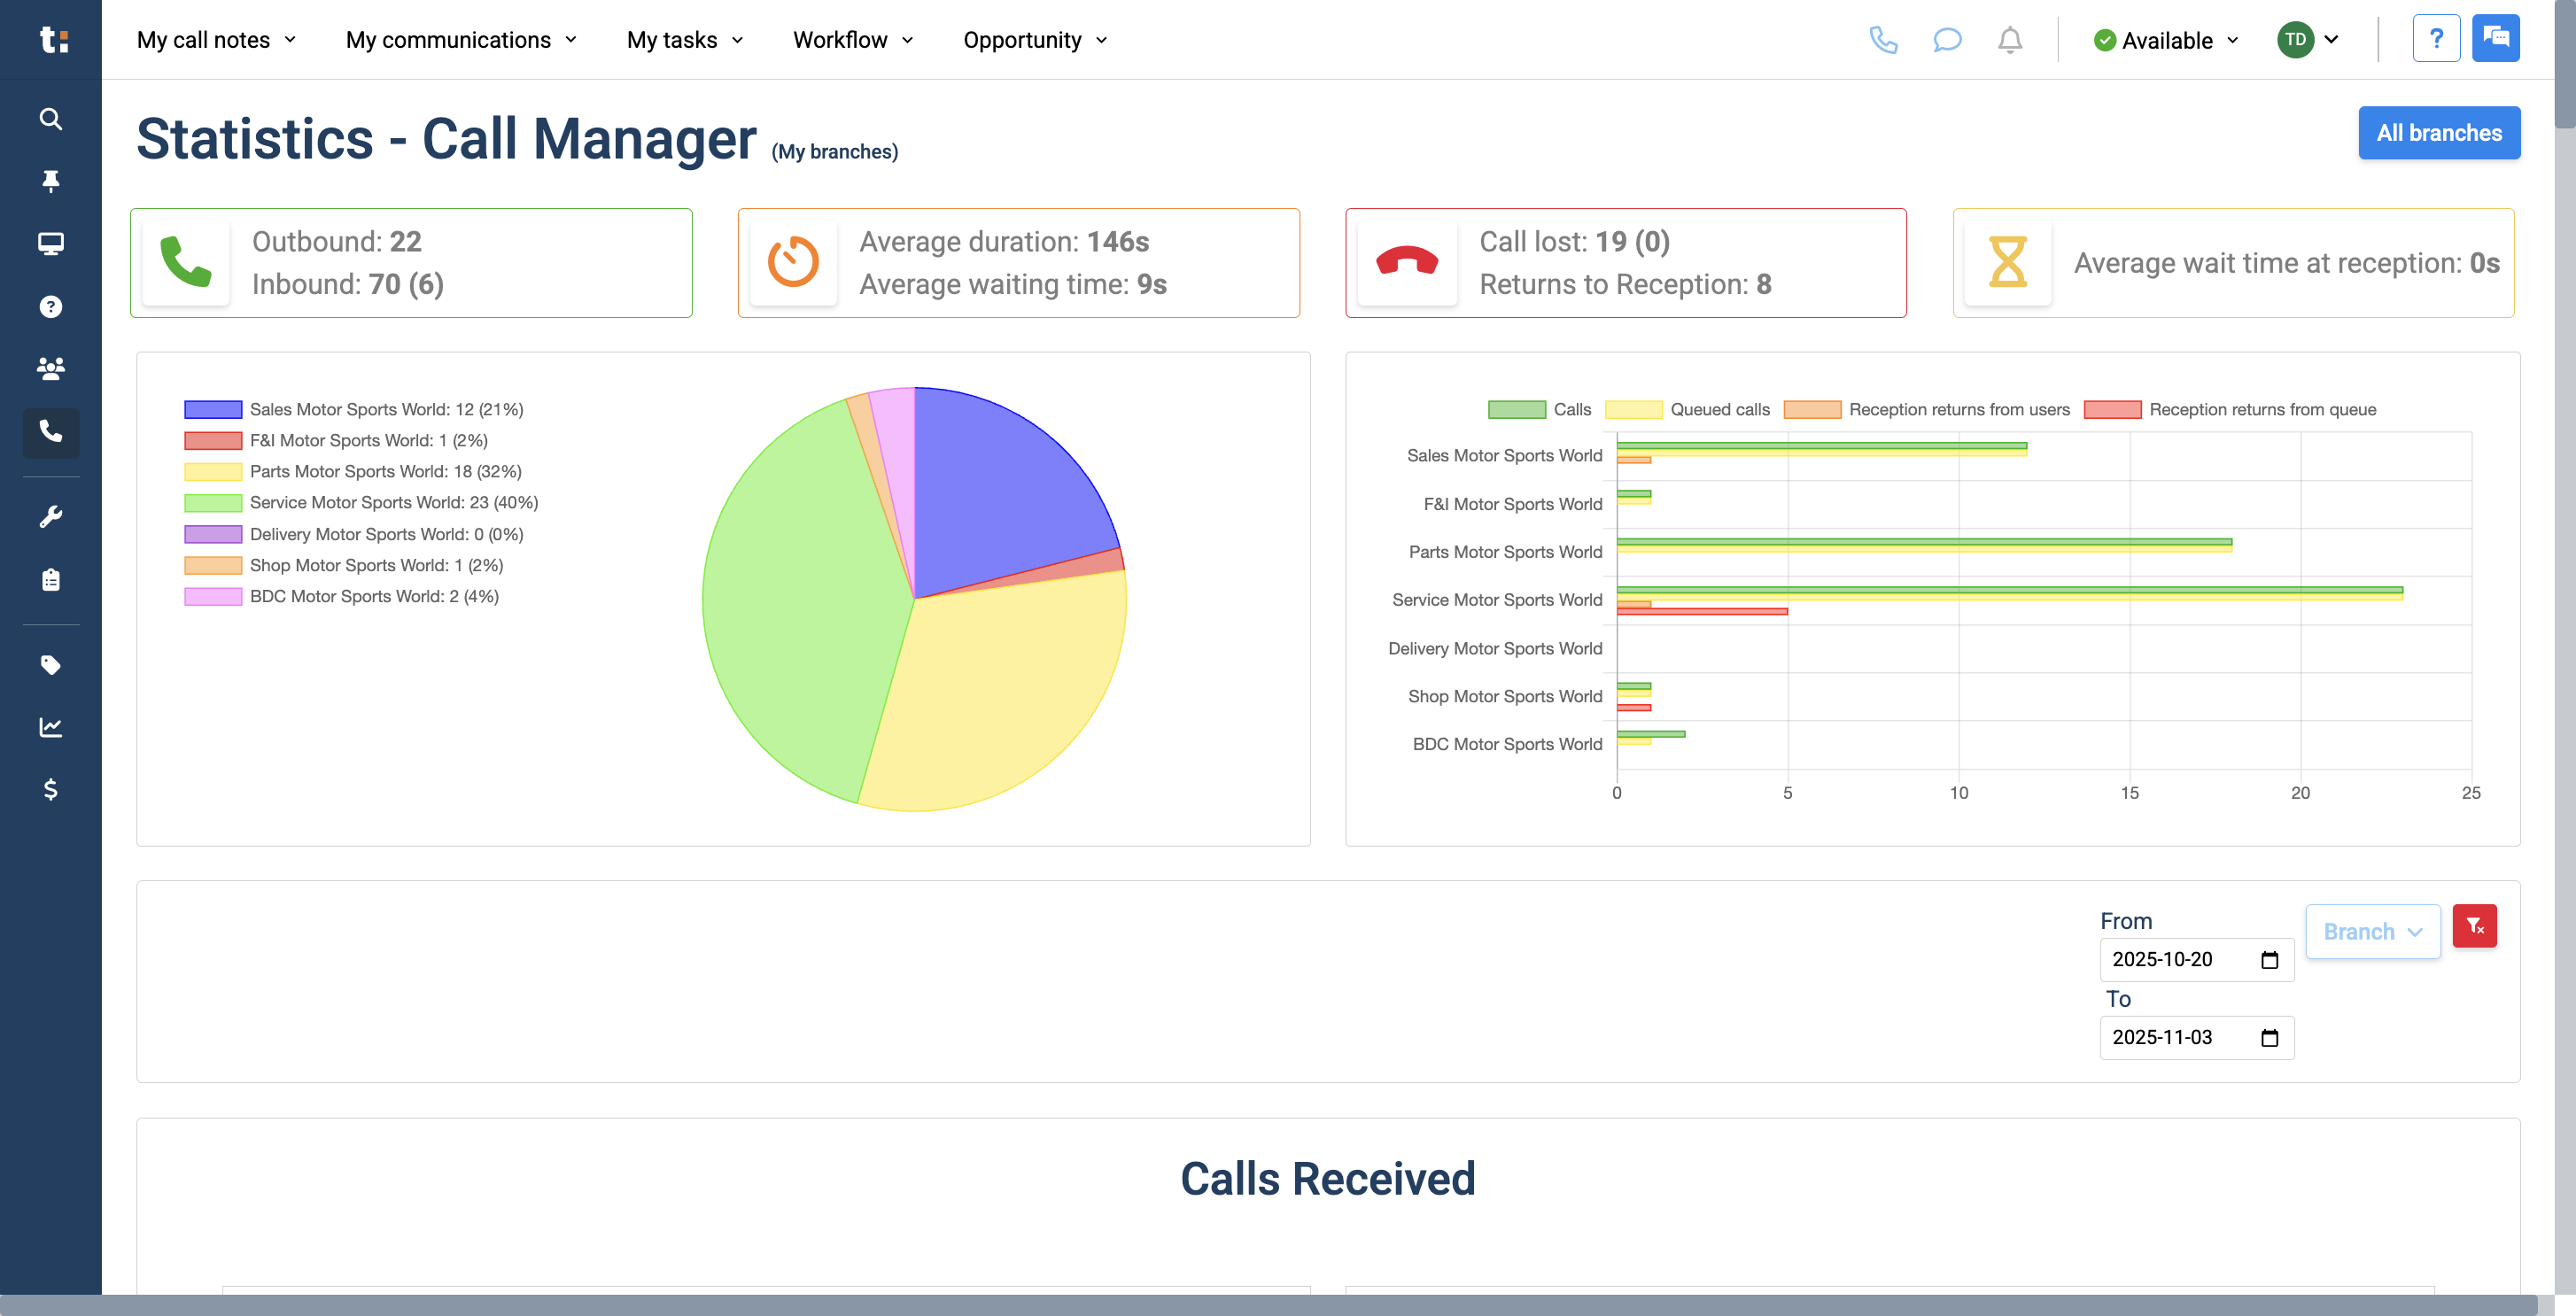
By default, it will display statistics for your branch only.
4
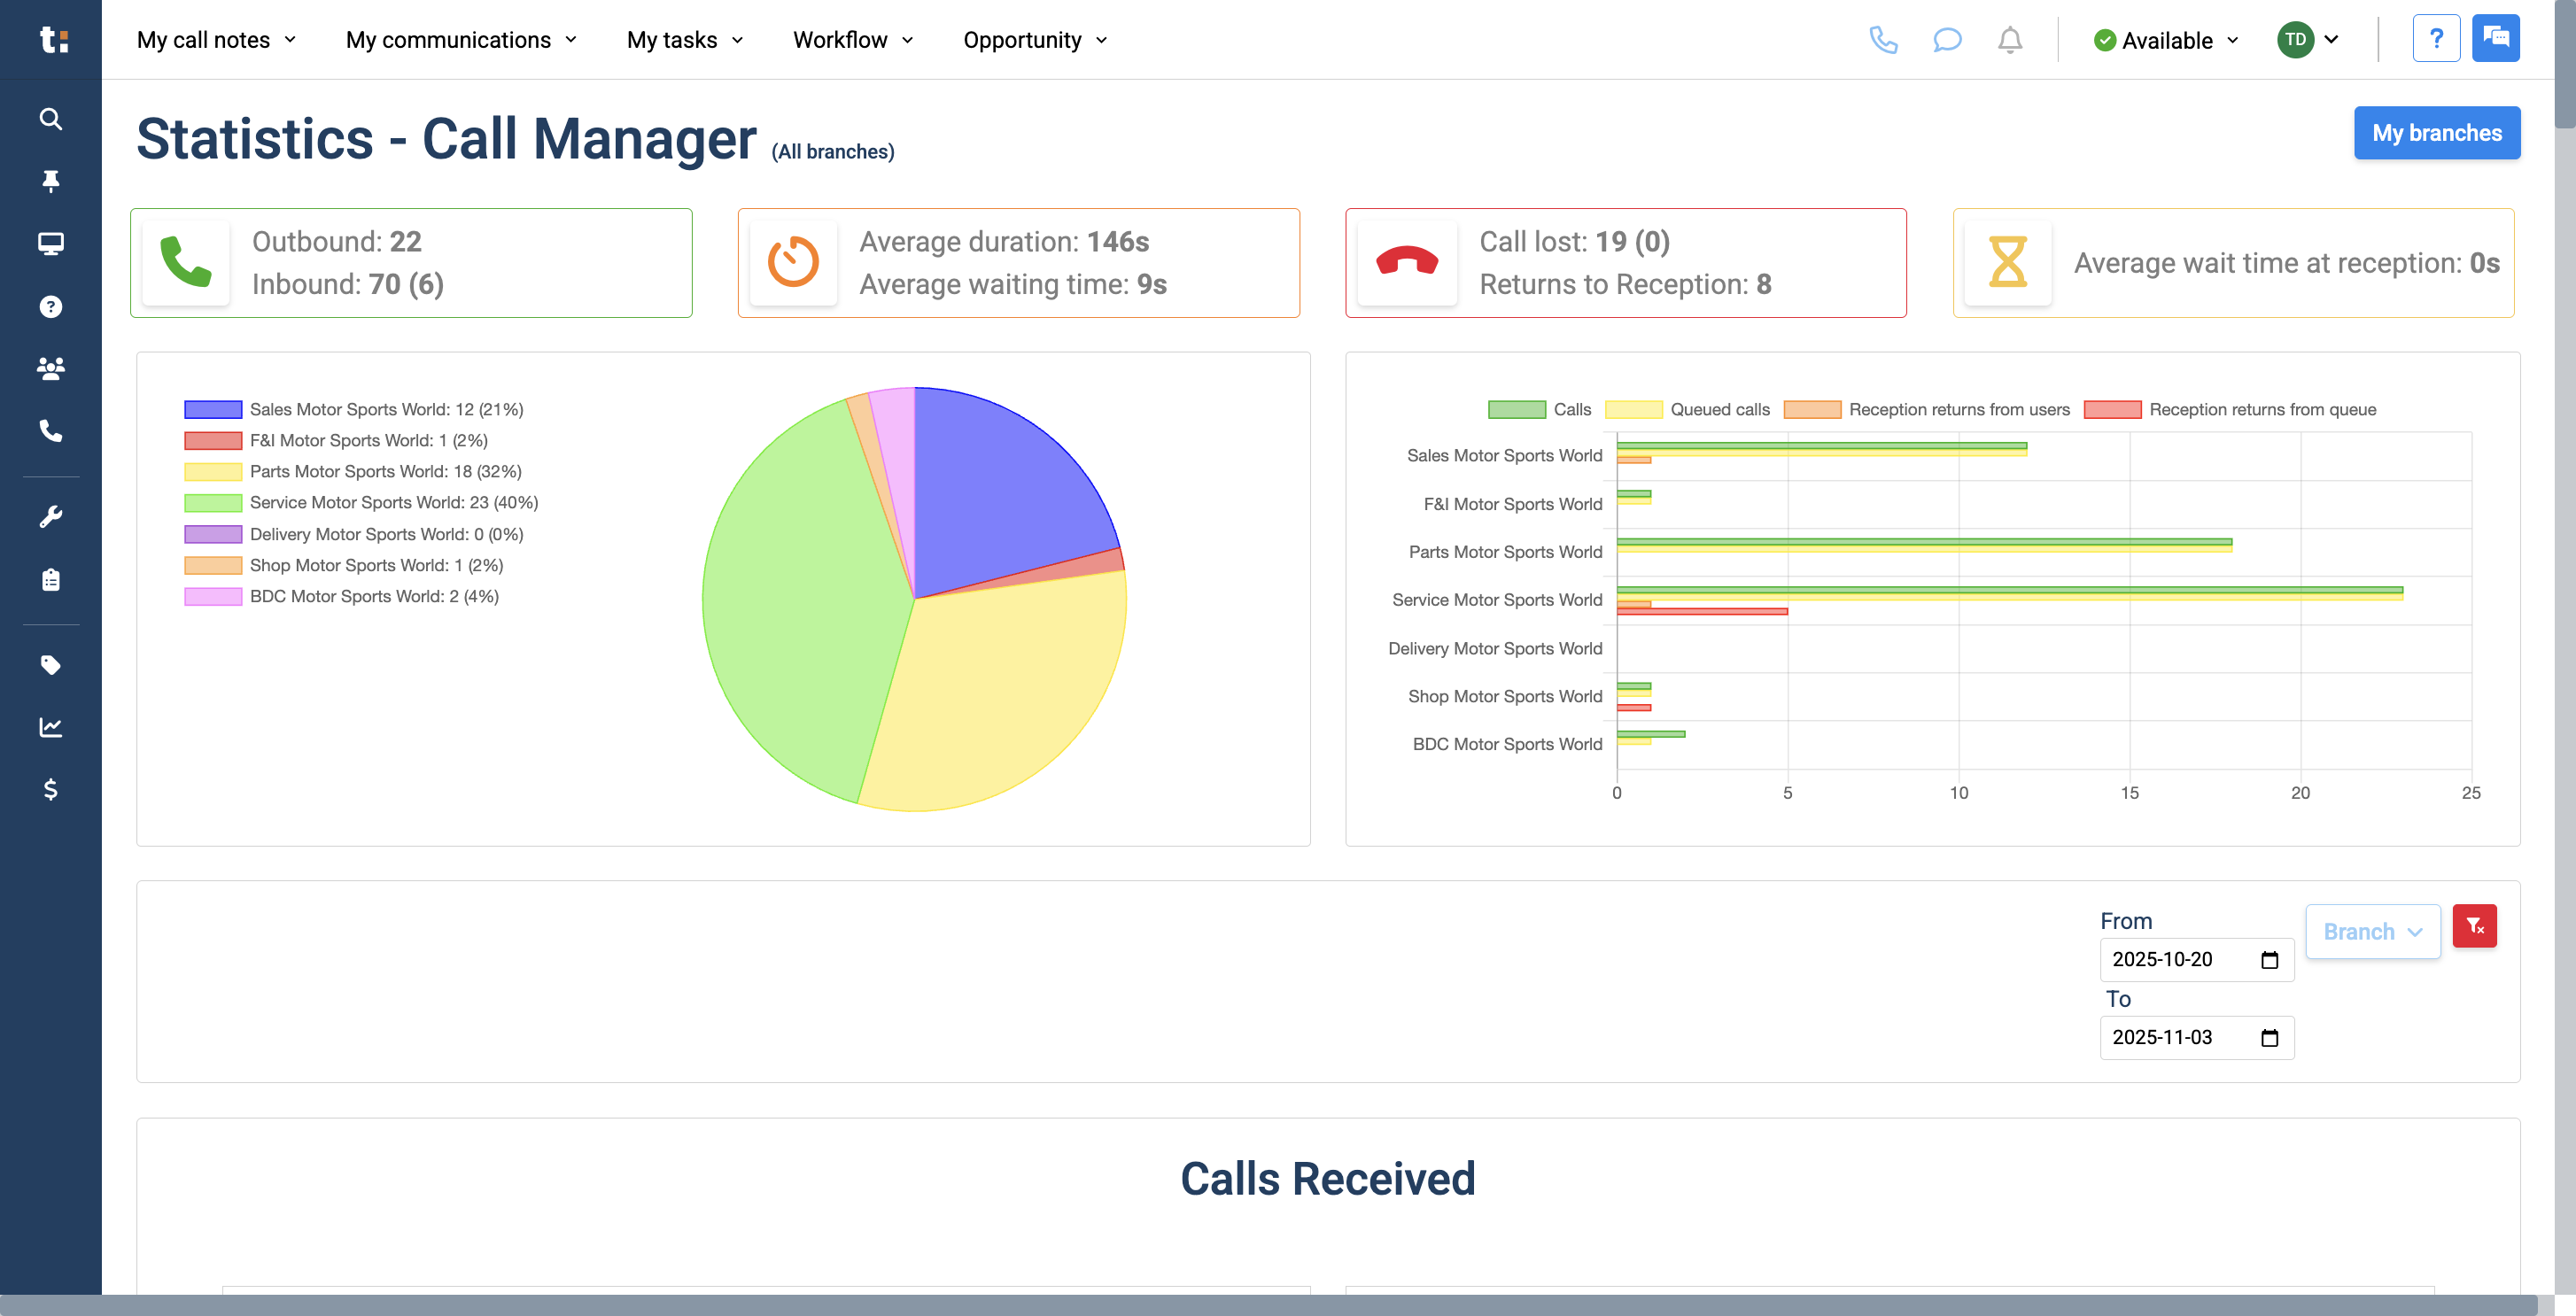
If you have multiple branches and want to view them all, click on All Branches.

5
At the top of the page, you'll see today's date displayed. We are reviewing today's inbound and outbound calls to your store.
6
This includes the average call duration, average waiting time....

7
number of lost calls, number of returns to reception....

8
and the average wait time at reception.

9
You can see the number of calls per department in this pie chart. It also shows the percentage of total calls for each department that day.
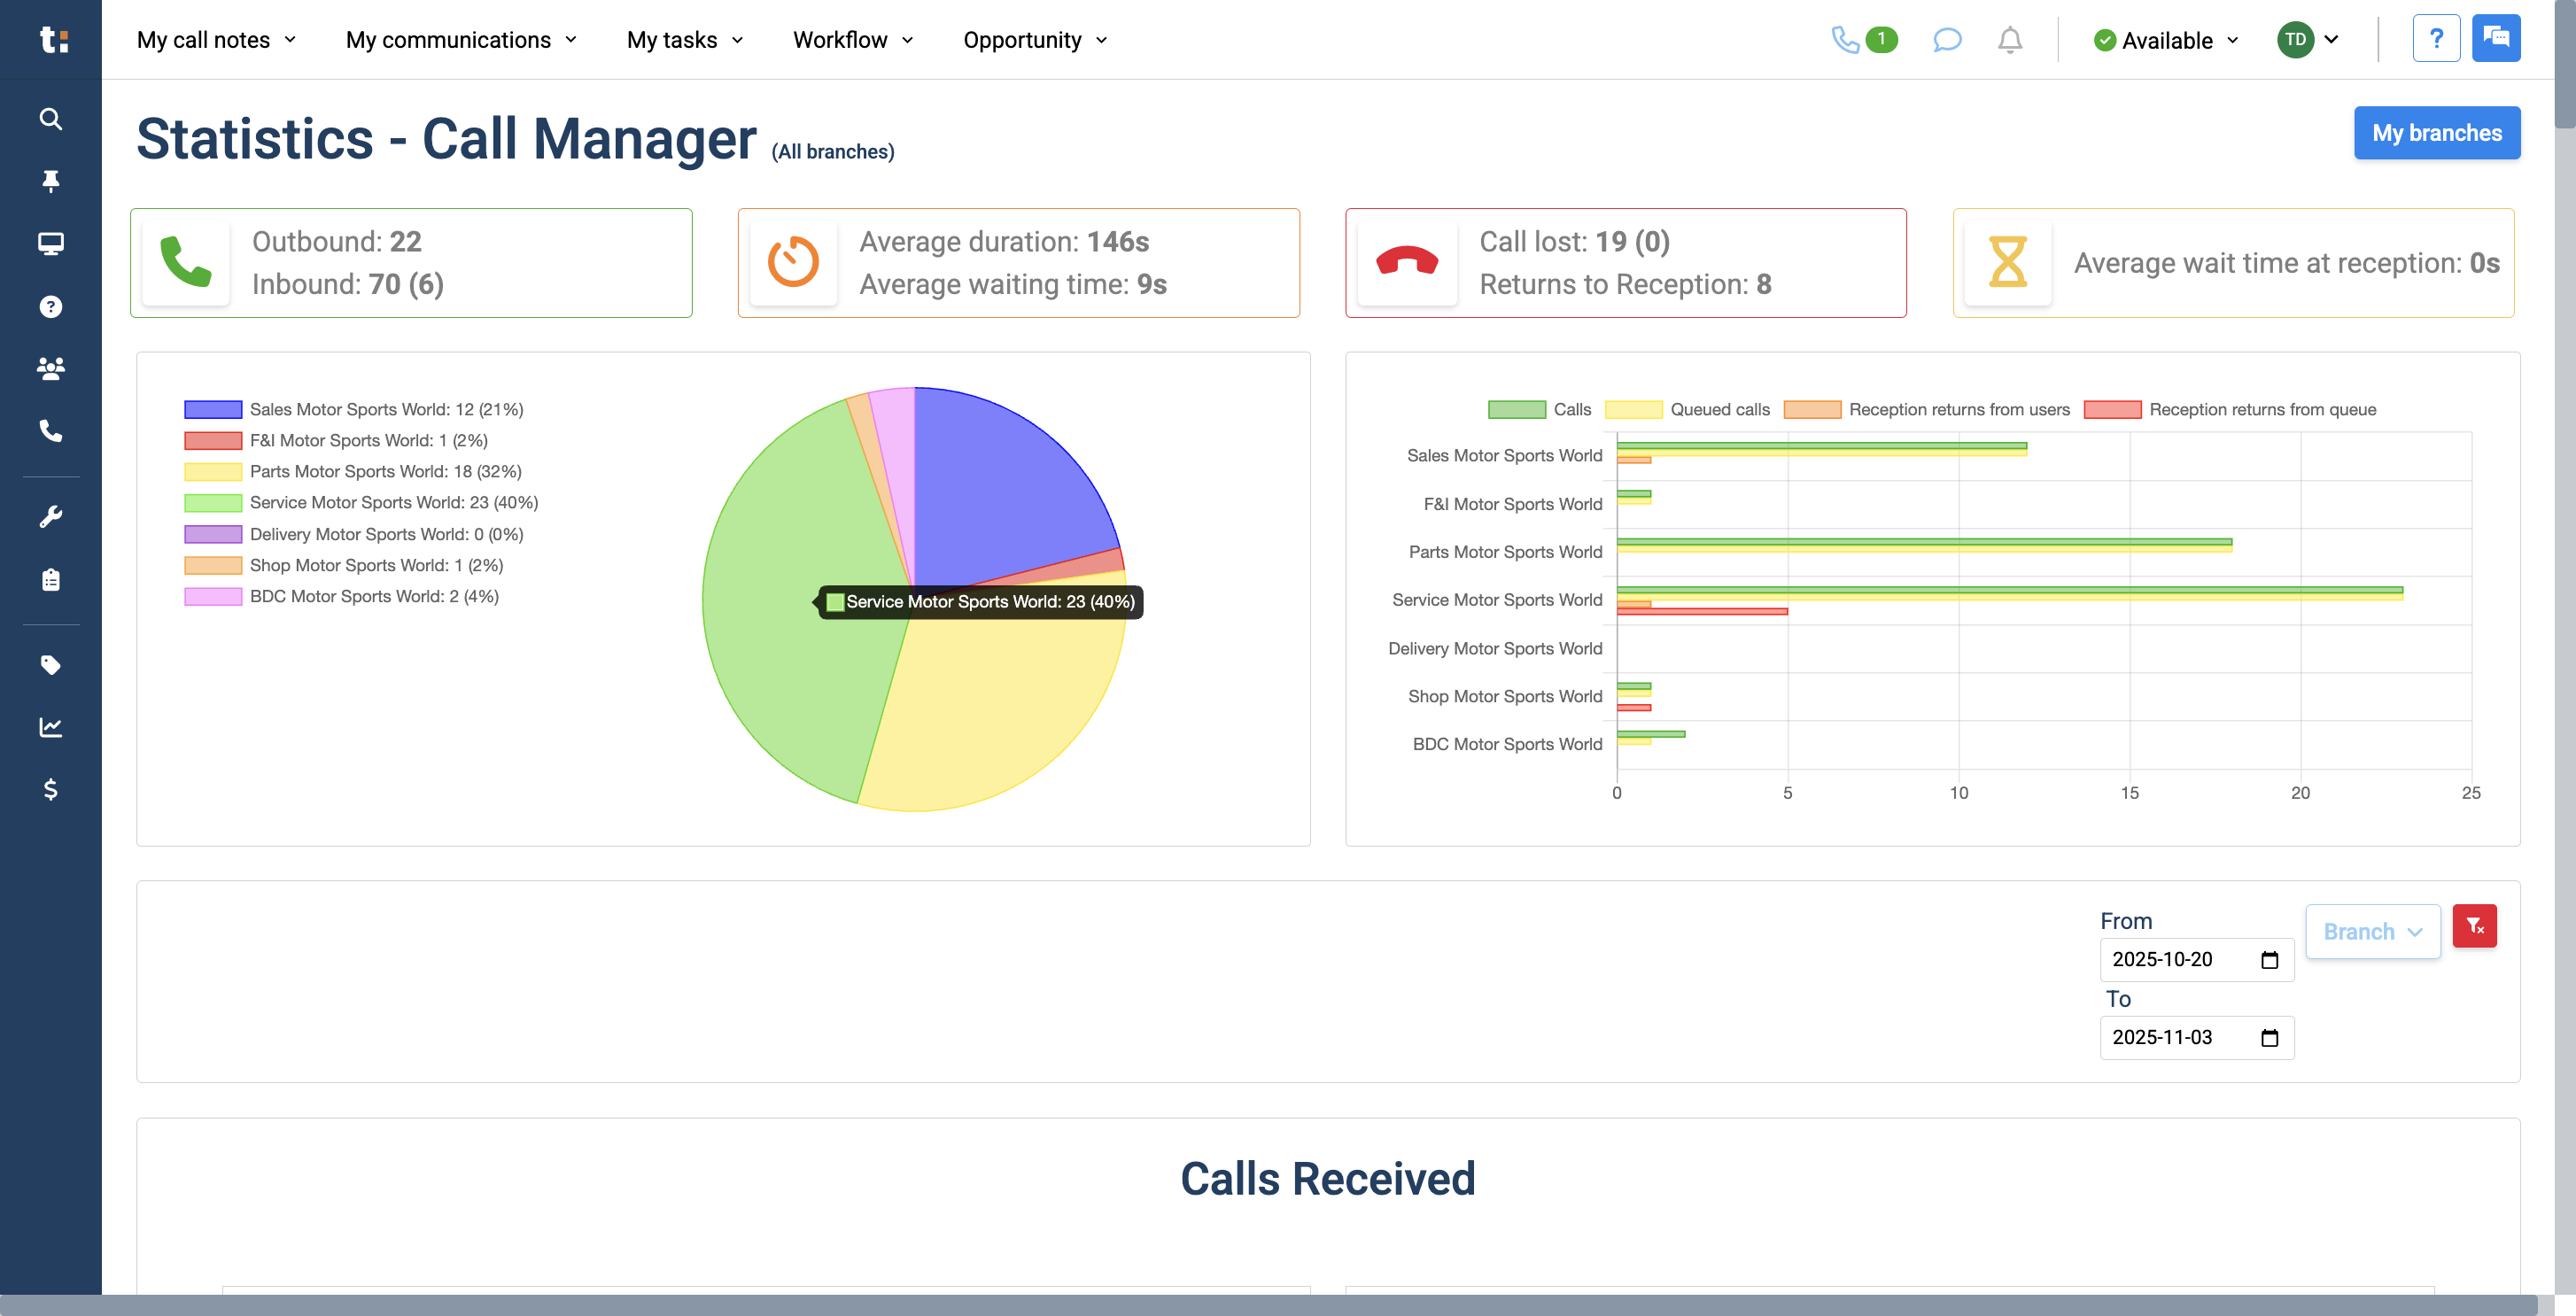
10
Next to that, there is a graph for each department showing the number of phone calls, queued calls, reception returns from users, and reception returns from queues.

11
As we scroll down the page, we can now filter by date.
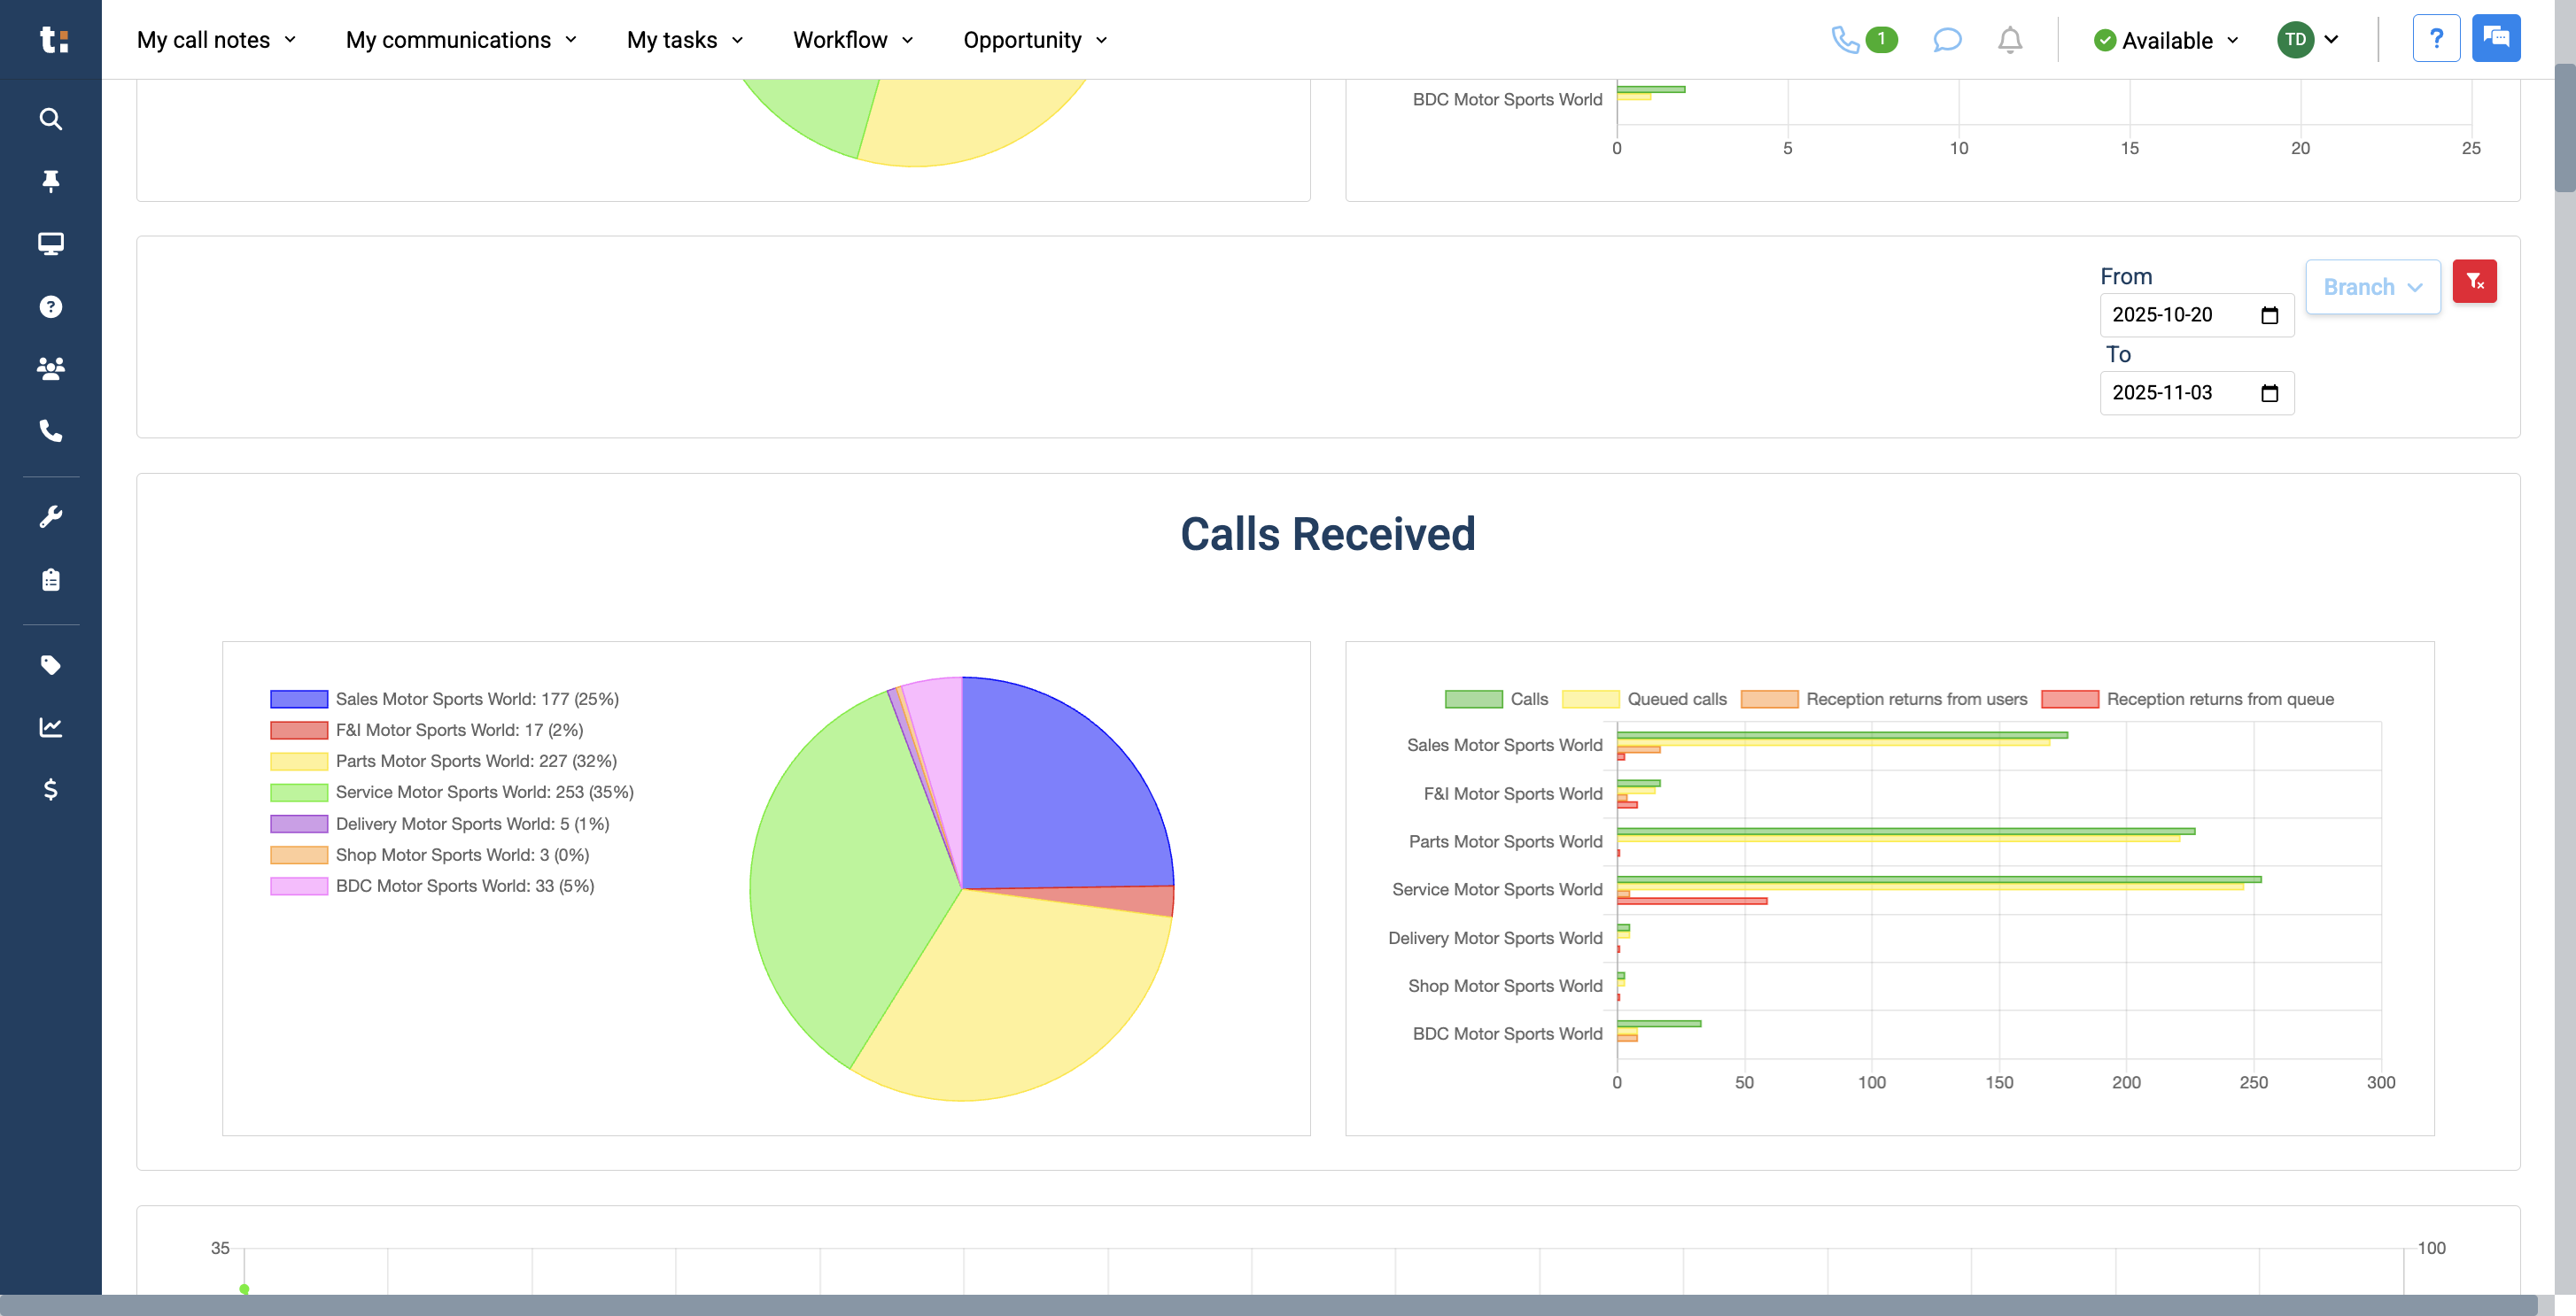
12
By default, it shows the last two weeks. If you prefer, you can switch to a one-week view.

13
Additionally, you can select a specific branch if you want, or keep it set to All.

14
To remove the filters, click the red X.

15
As we continue, we will see all the calls received during that time period.
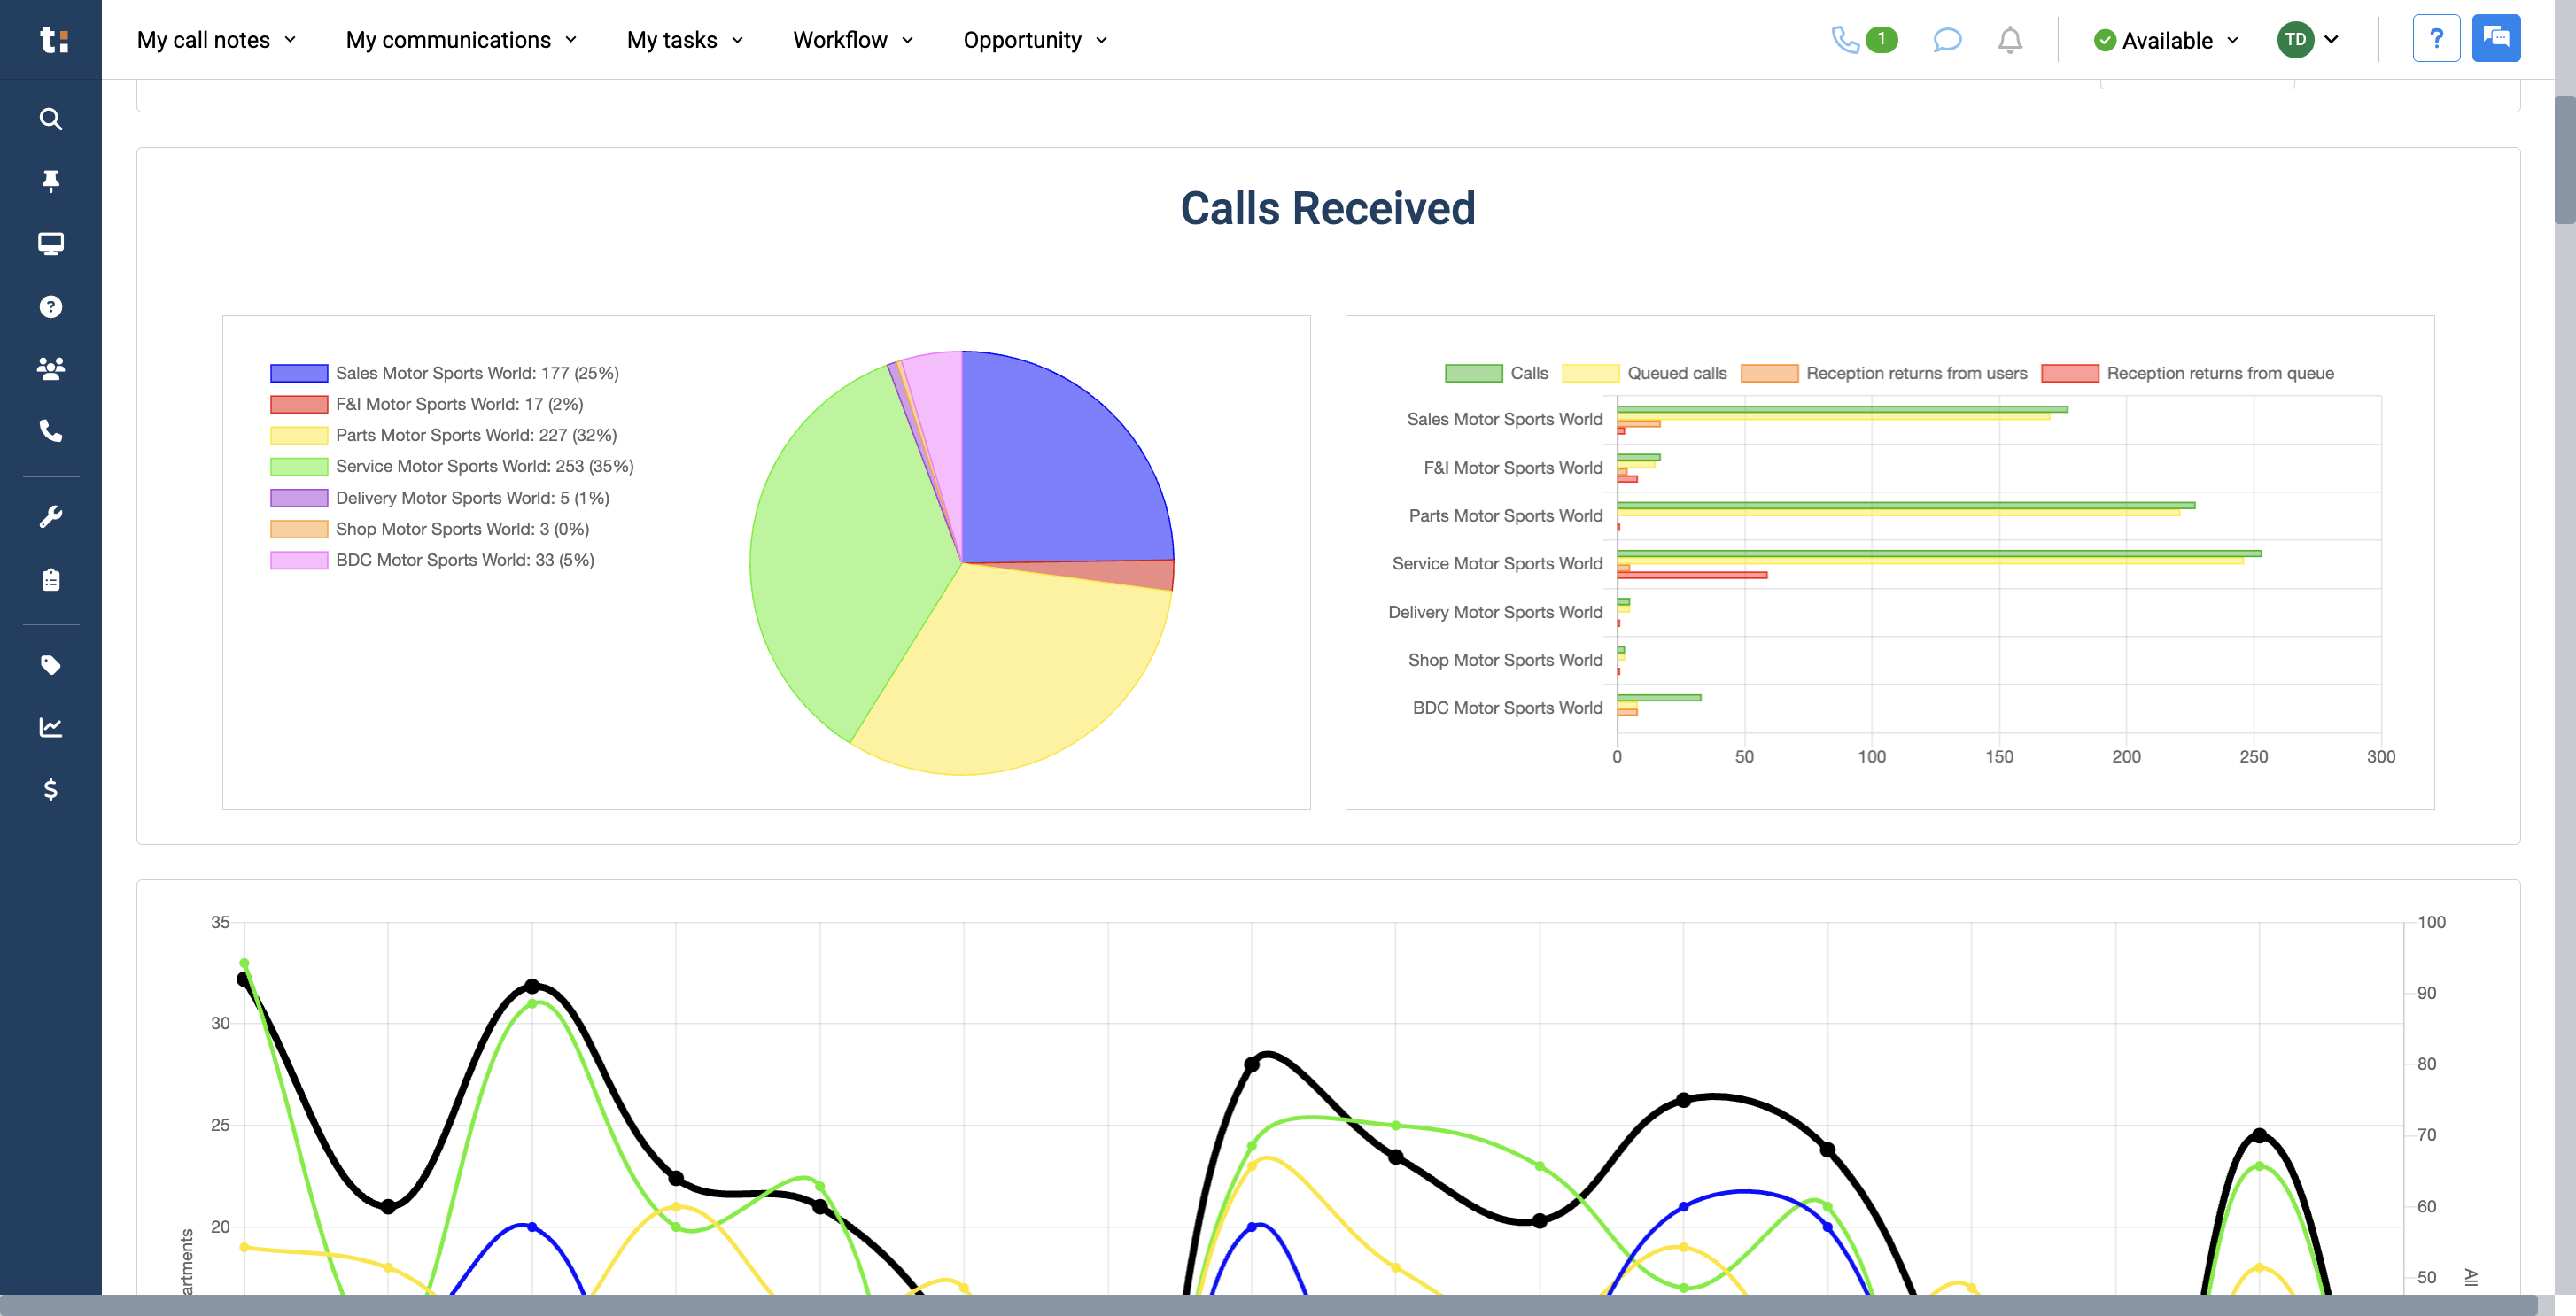
16
You have your pie chart and your graph.
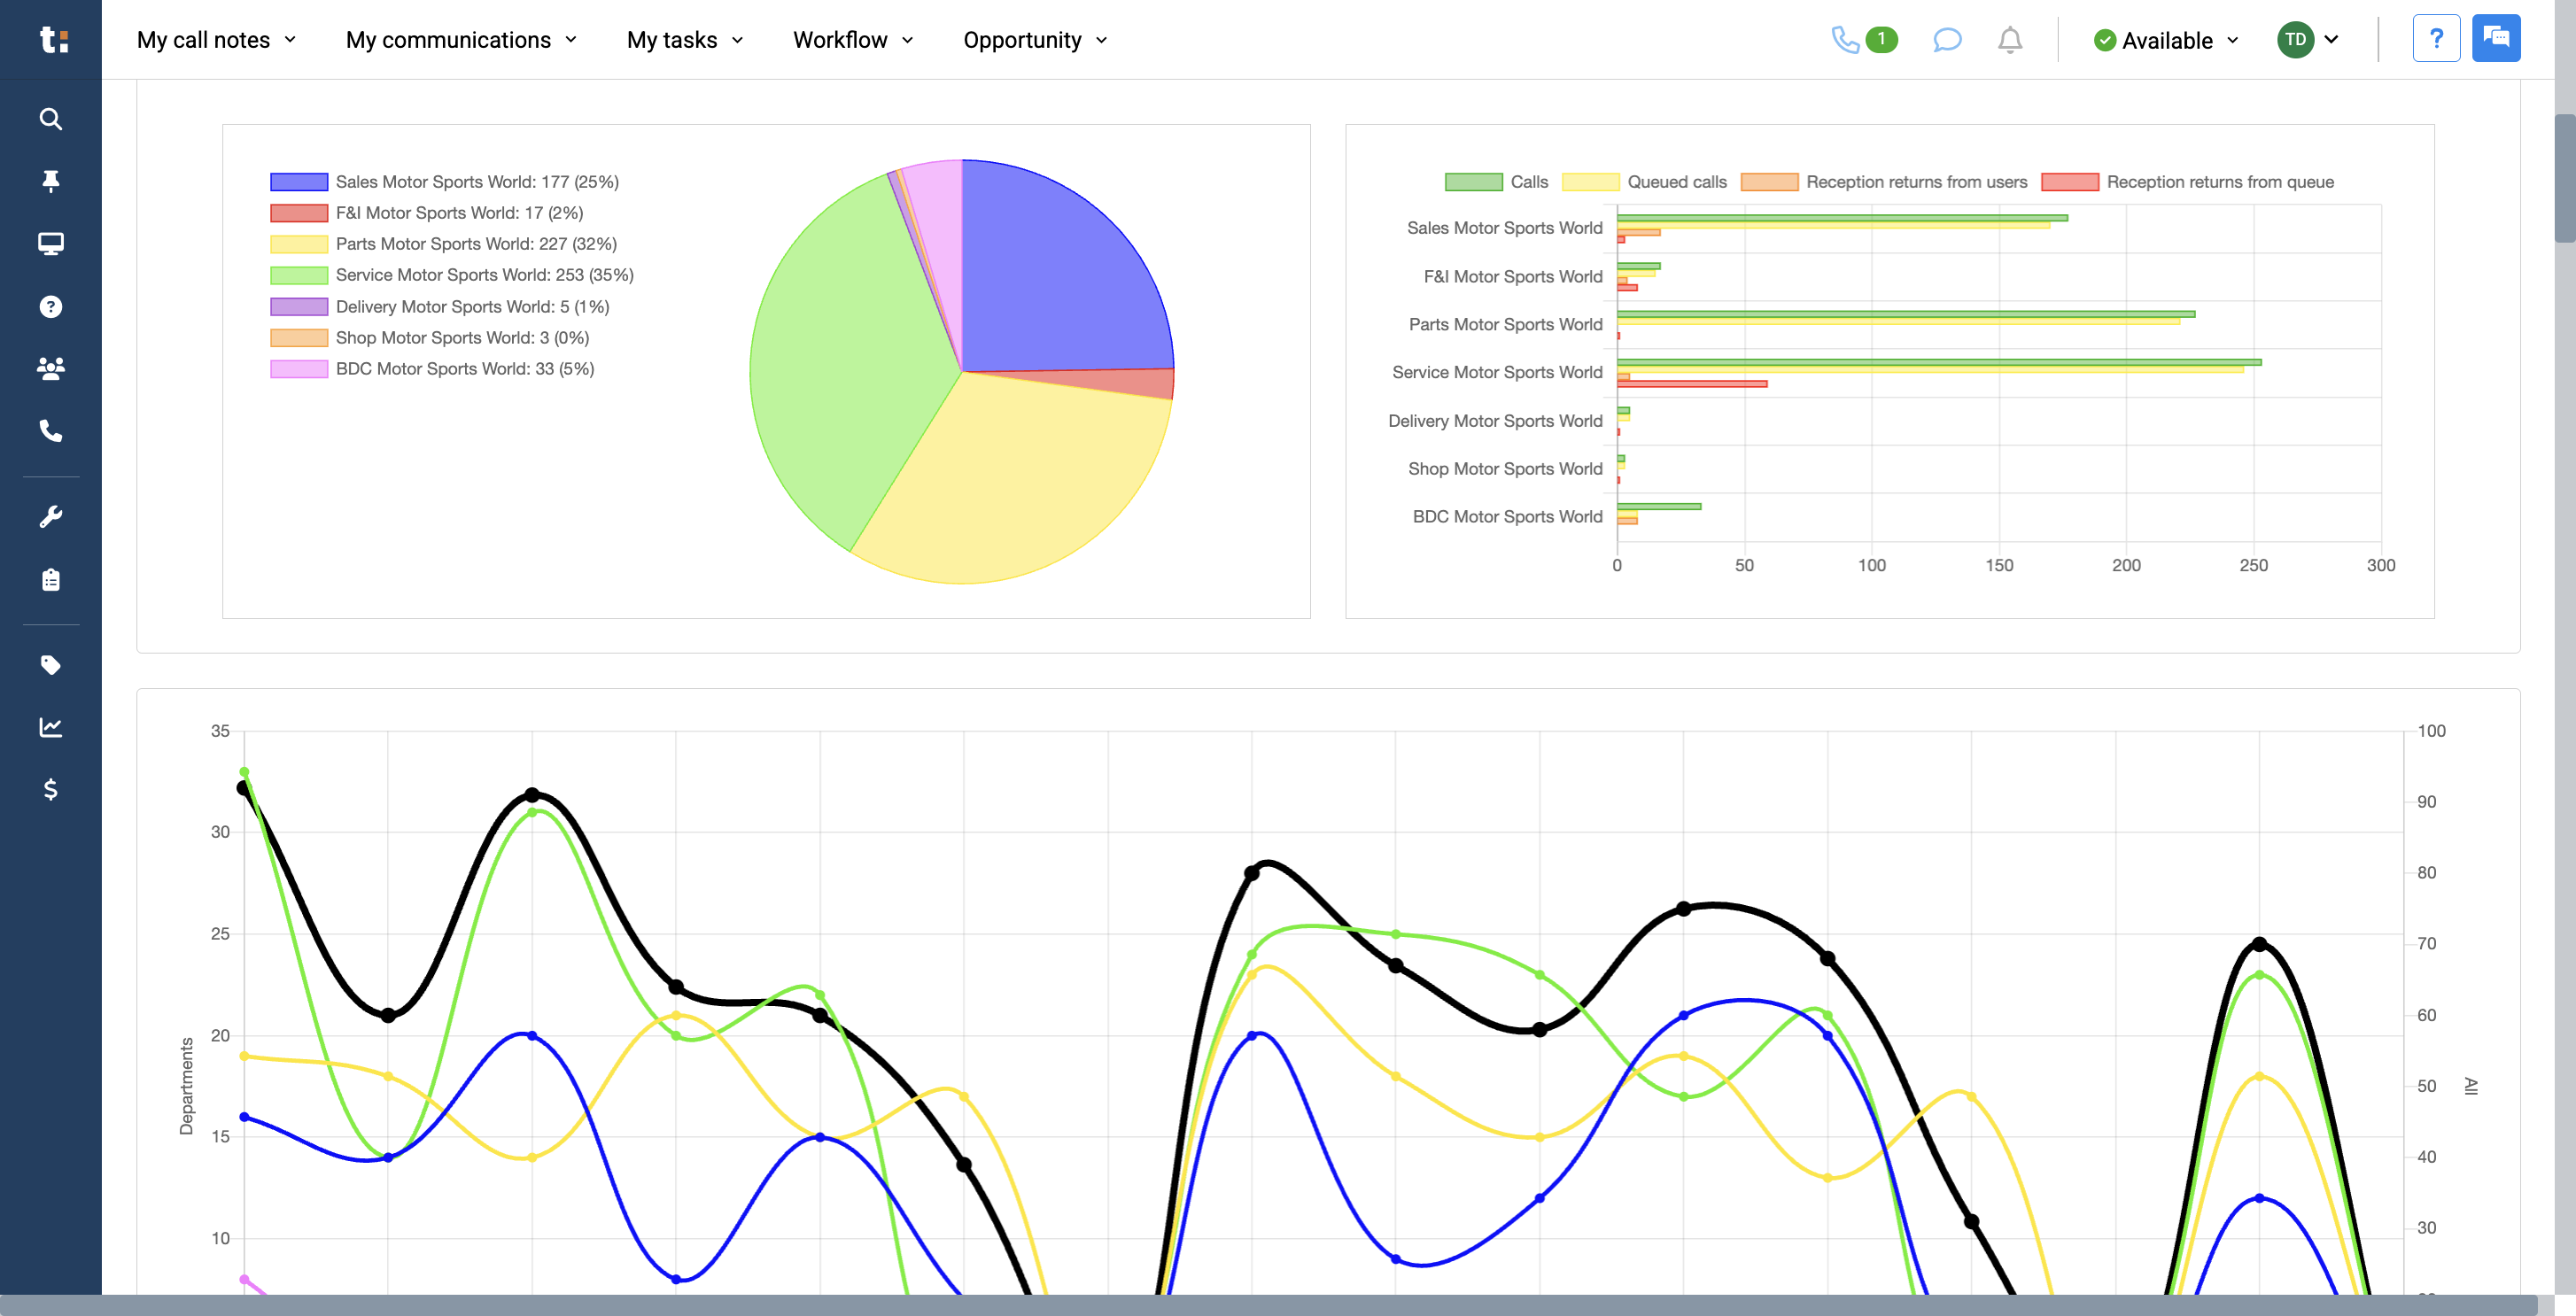
17
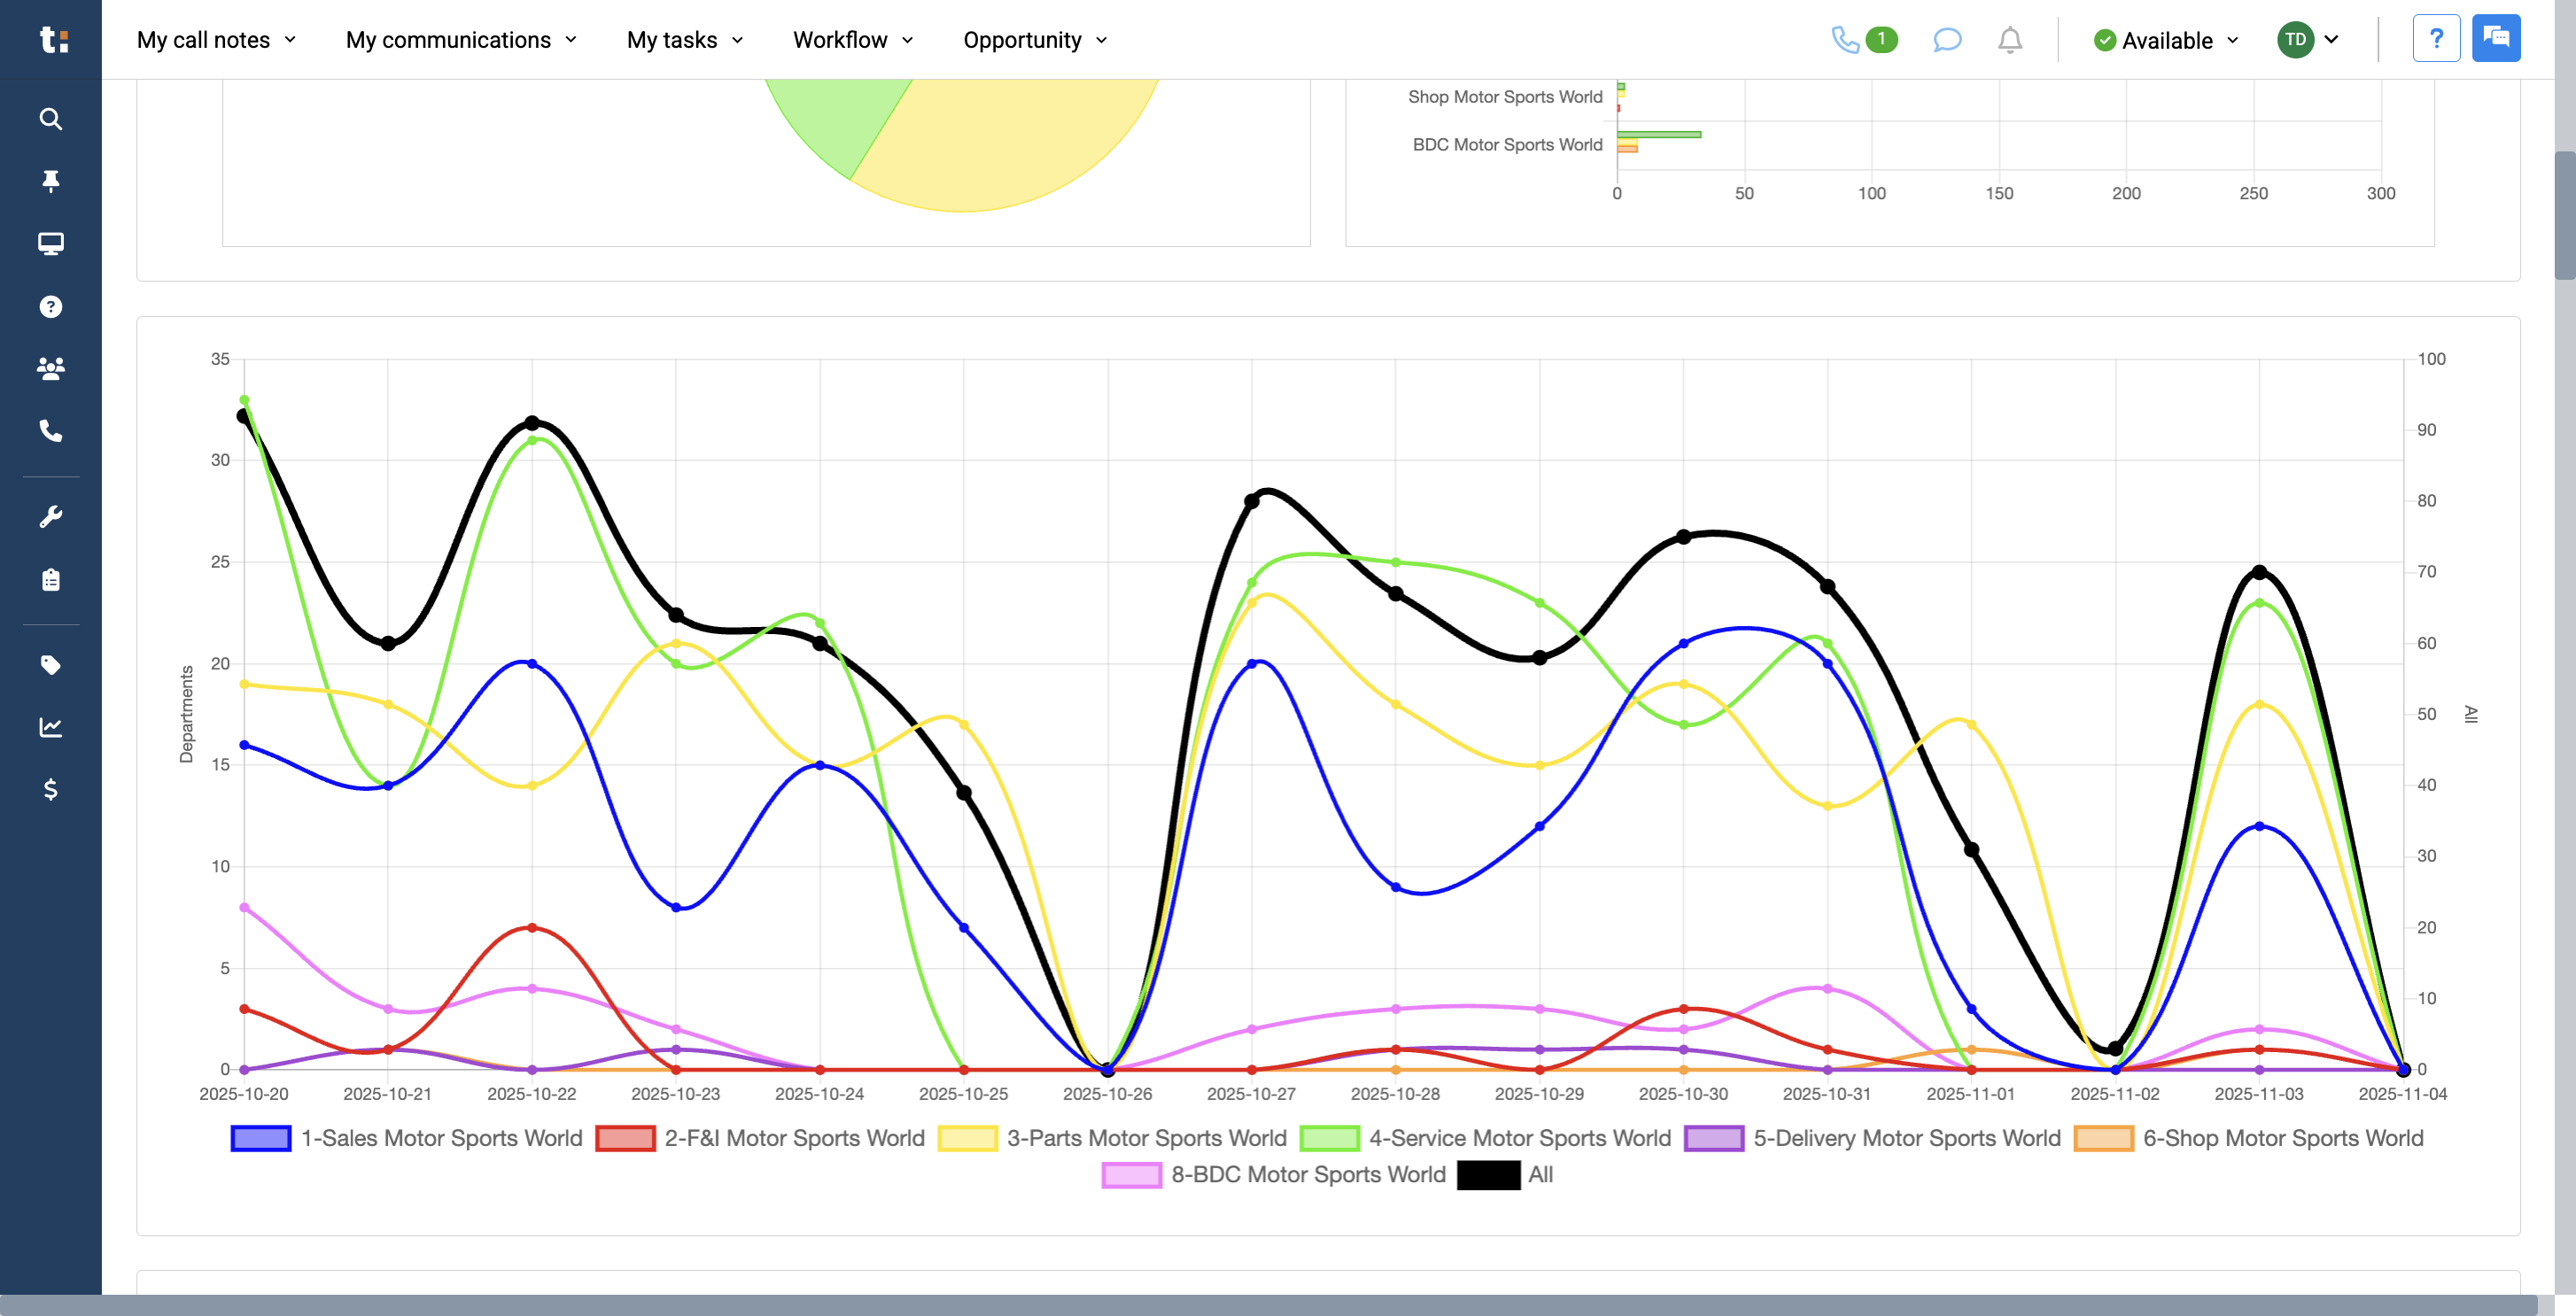
In the last two weeks, we provide a graph showing which days of the week each department received the most calls.
18
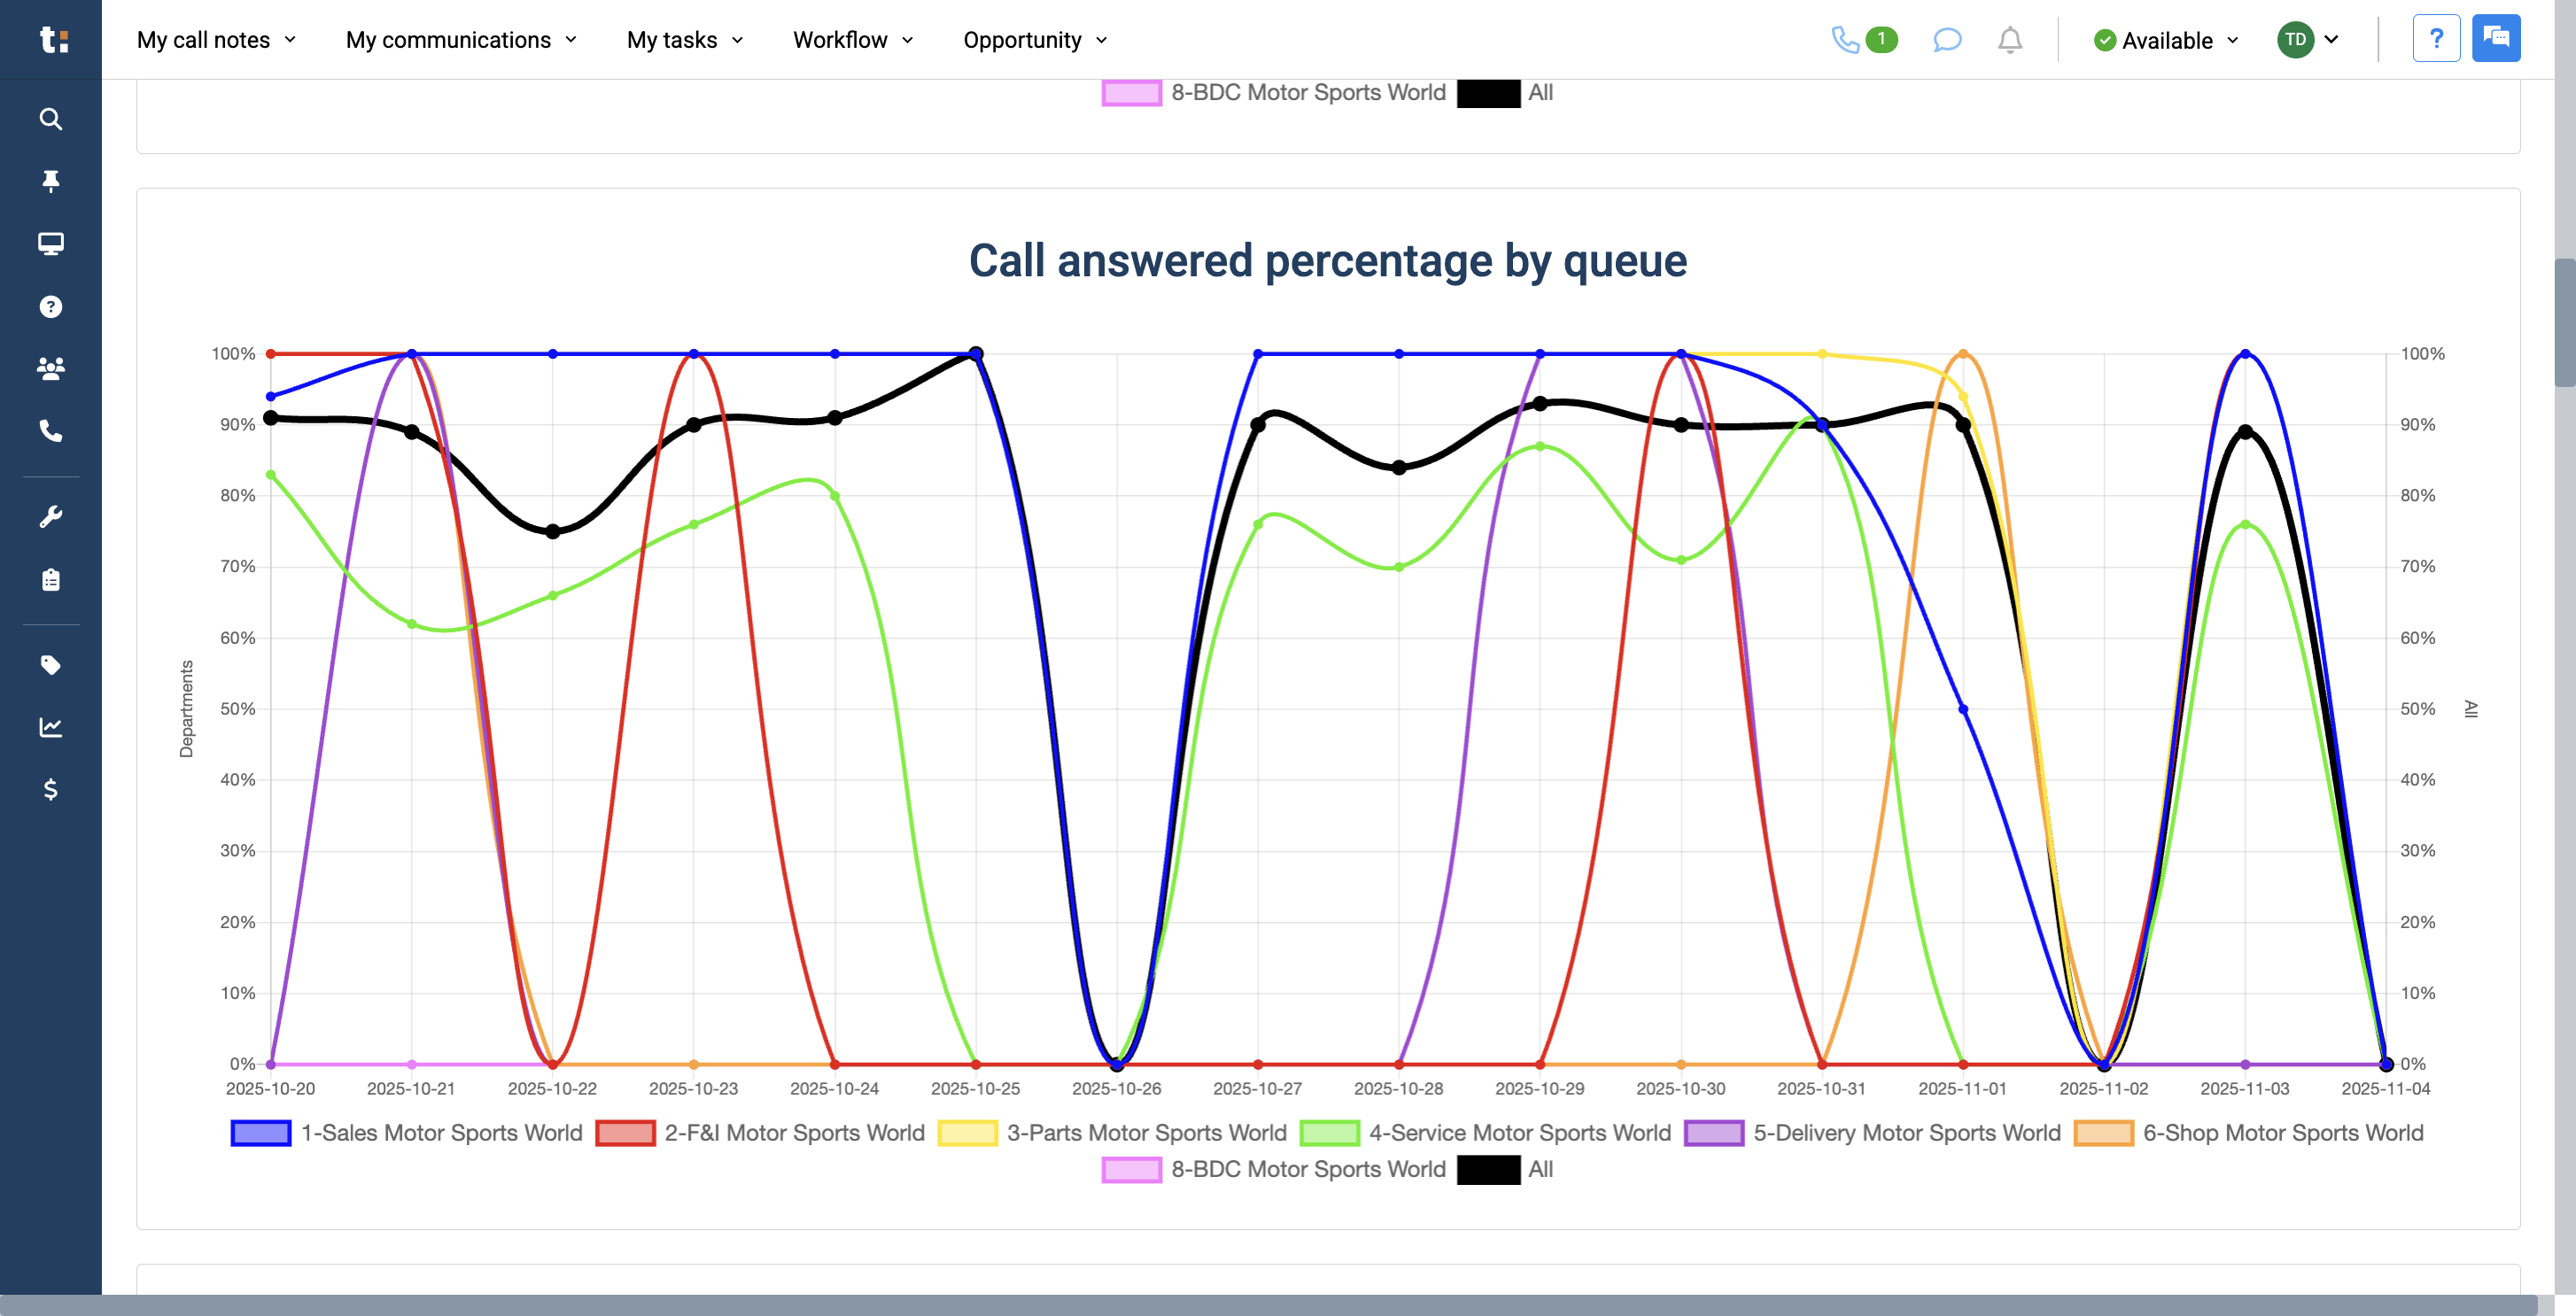
Below that graph is another one called "Call Answered Percentage by Queue."
19
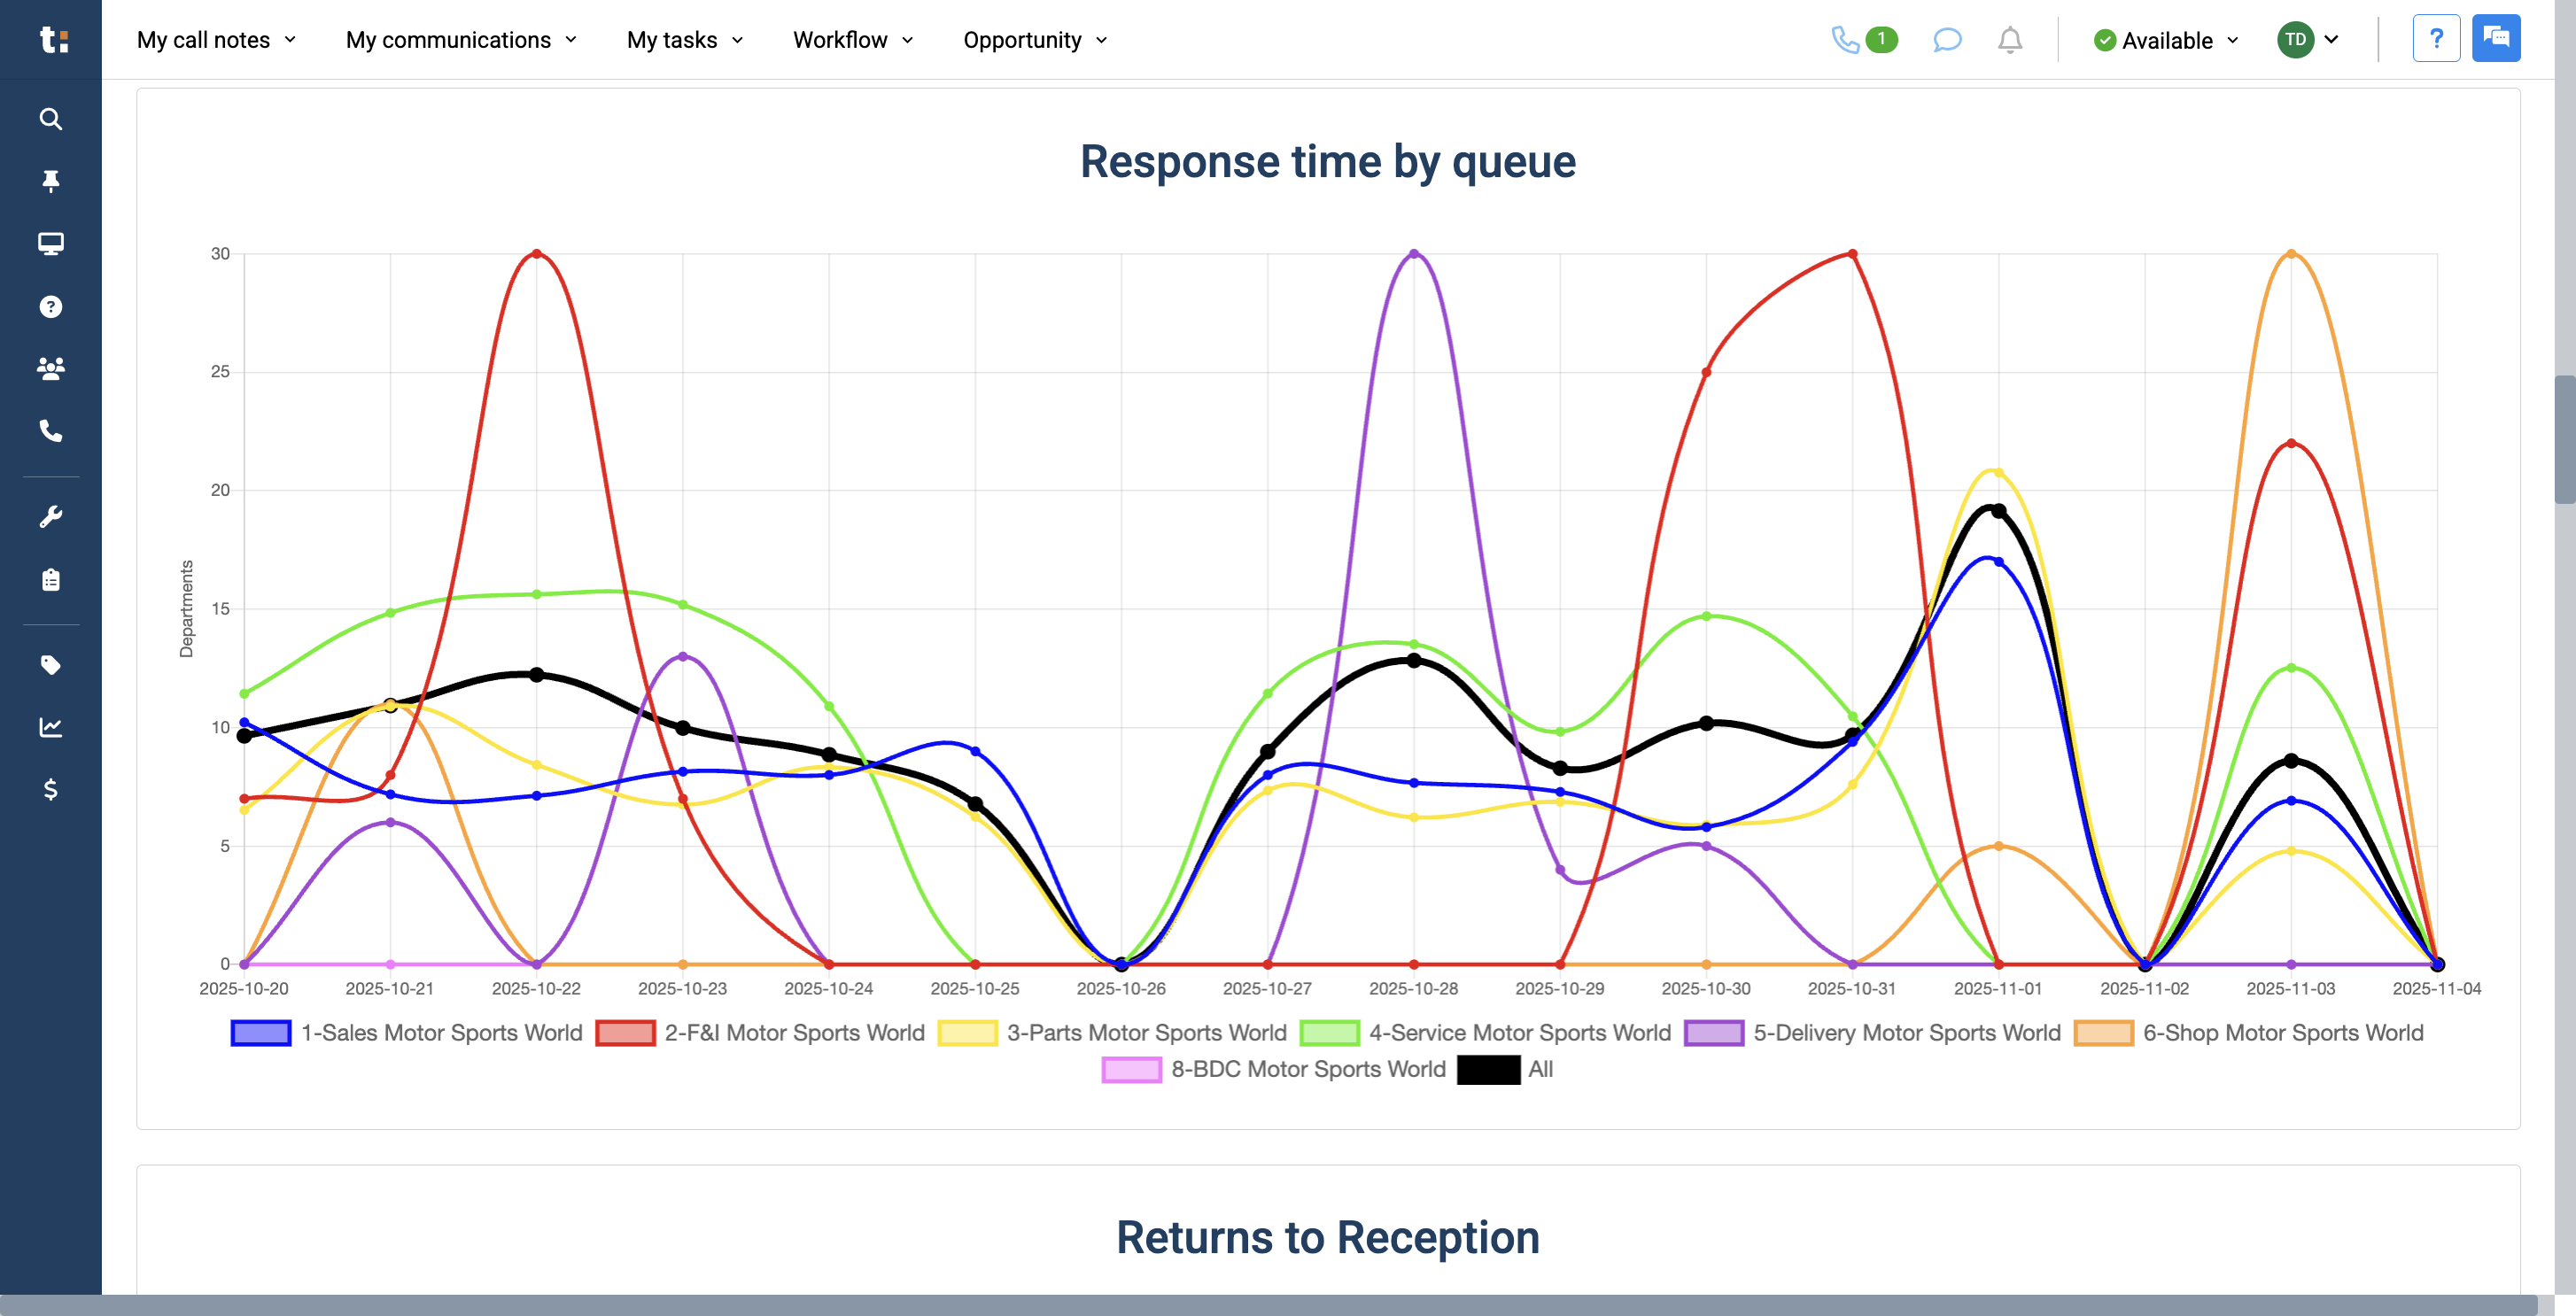
We can view the percentage of answered calls for each department. We have a graph called "Response Time by Queue." We will review the response times for each department.
20
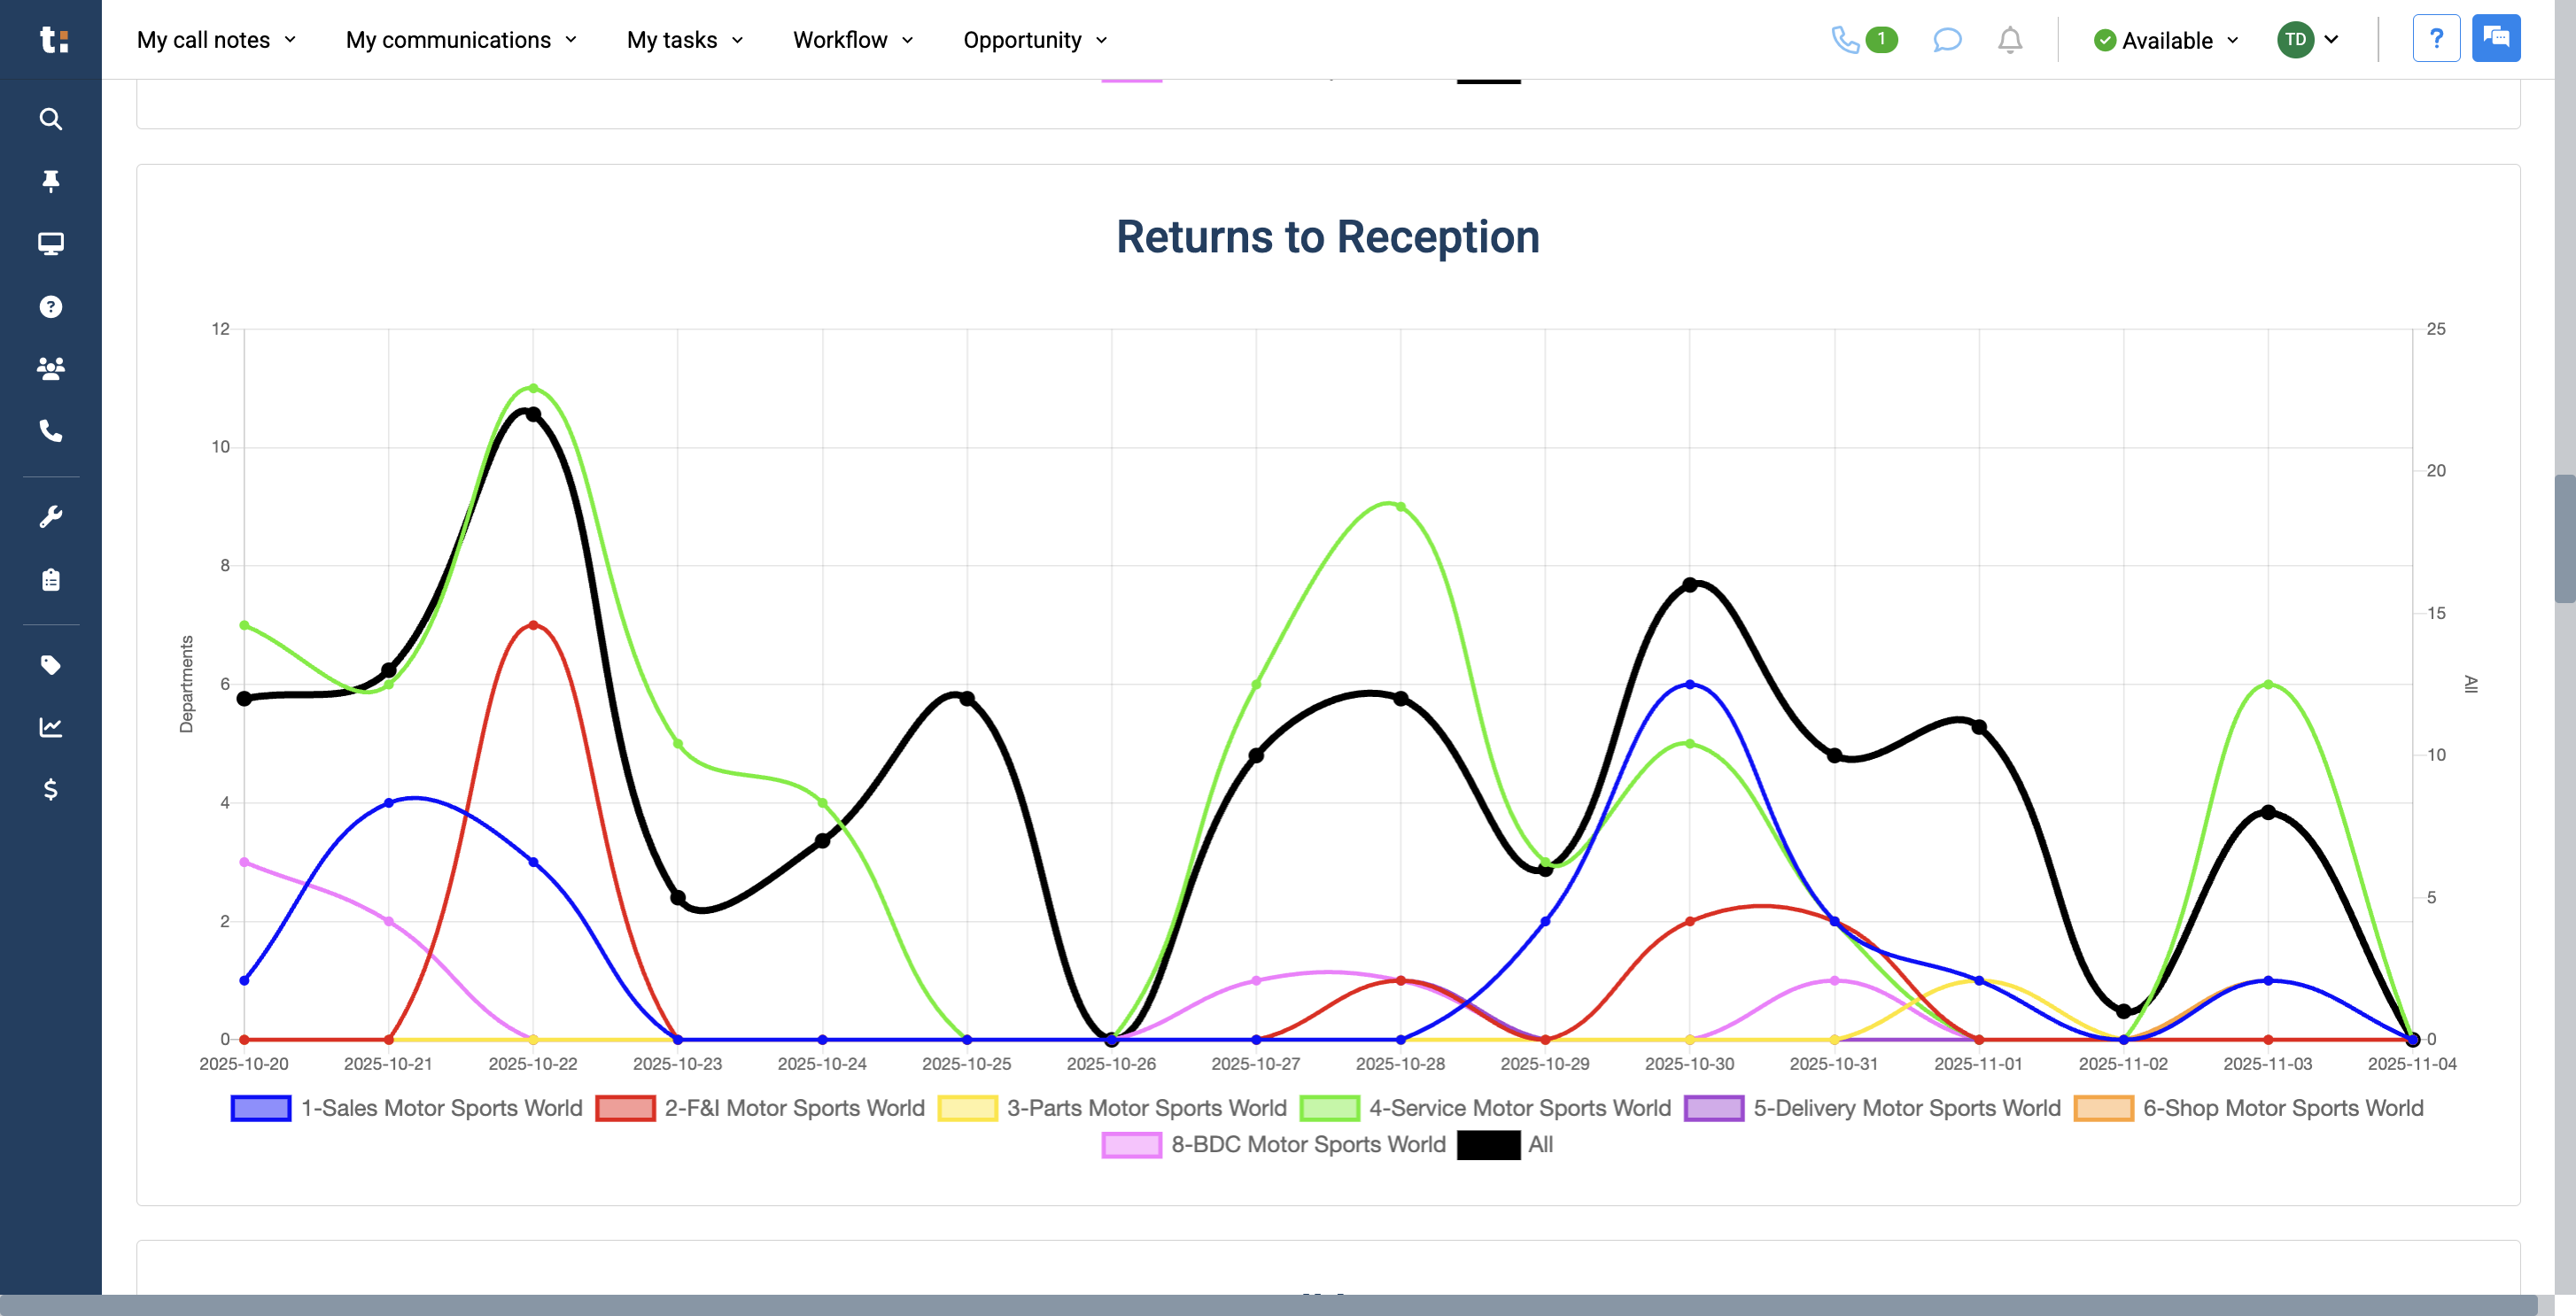
Below, we have Returns to Reception. This shows all calls that have been redirected back. We will see the total amount.
21
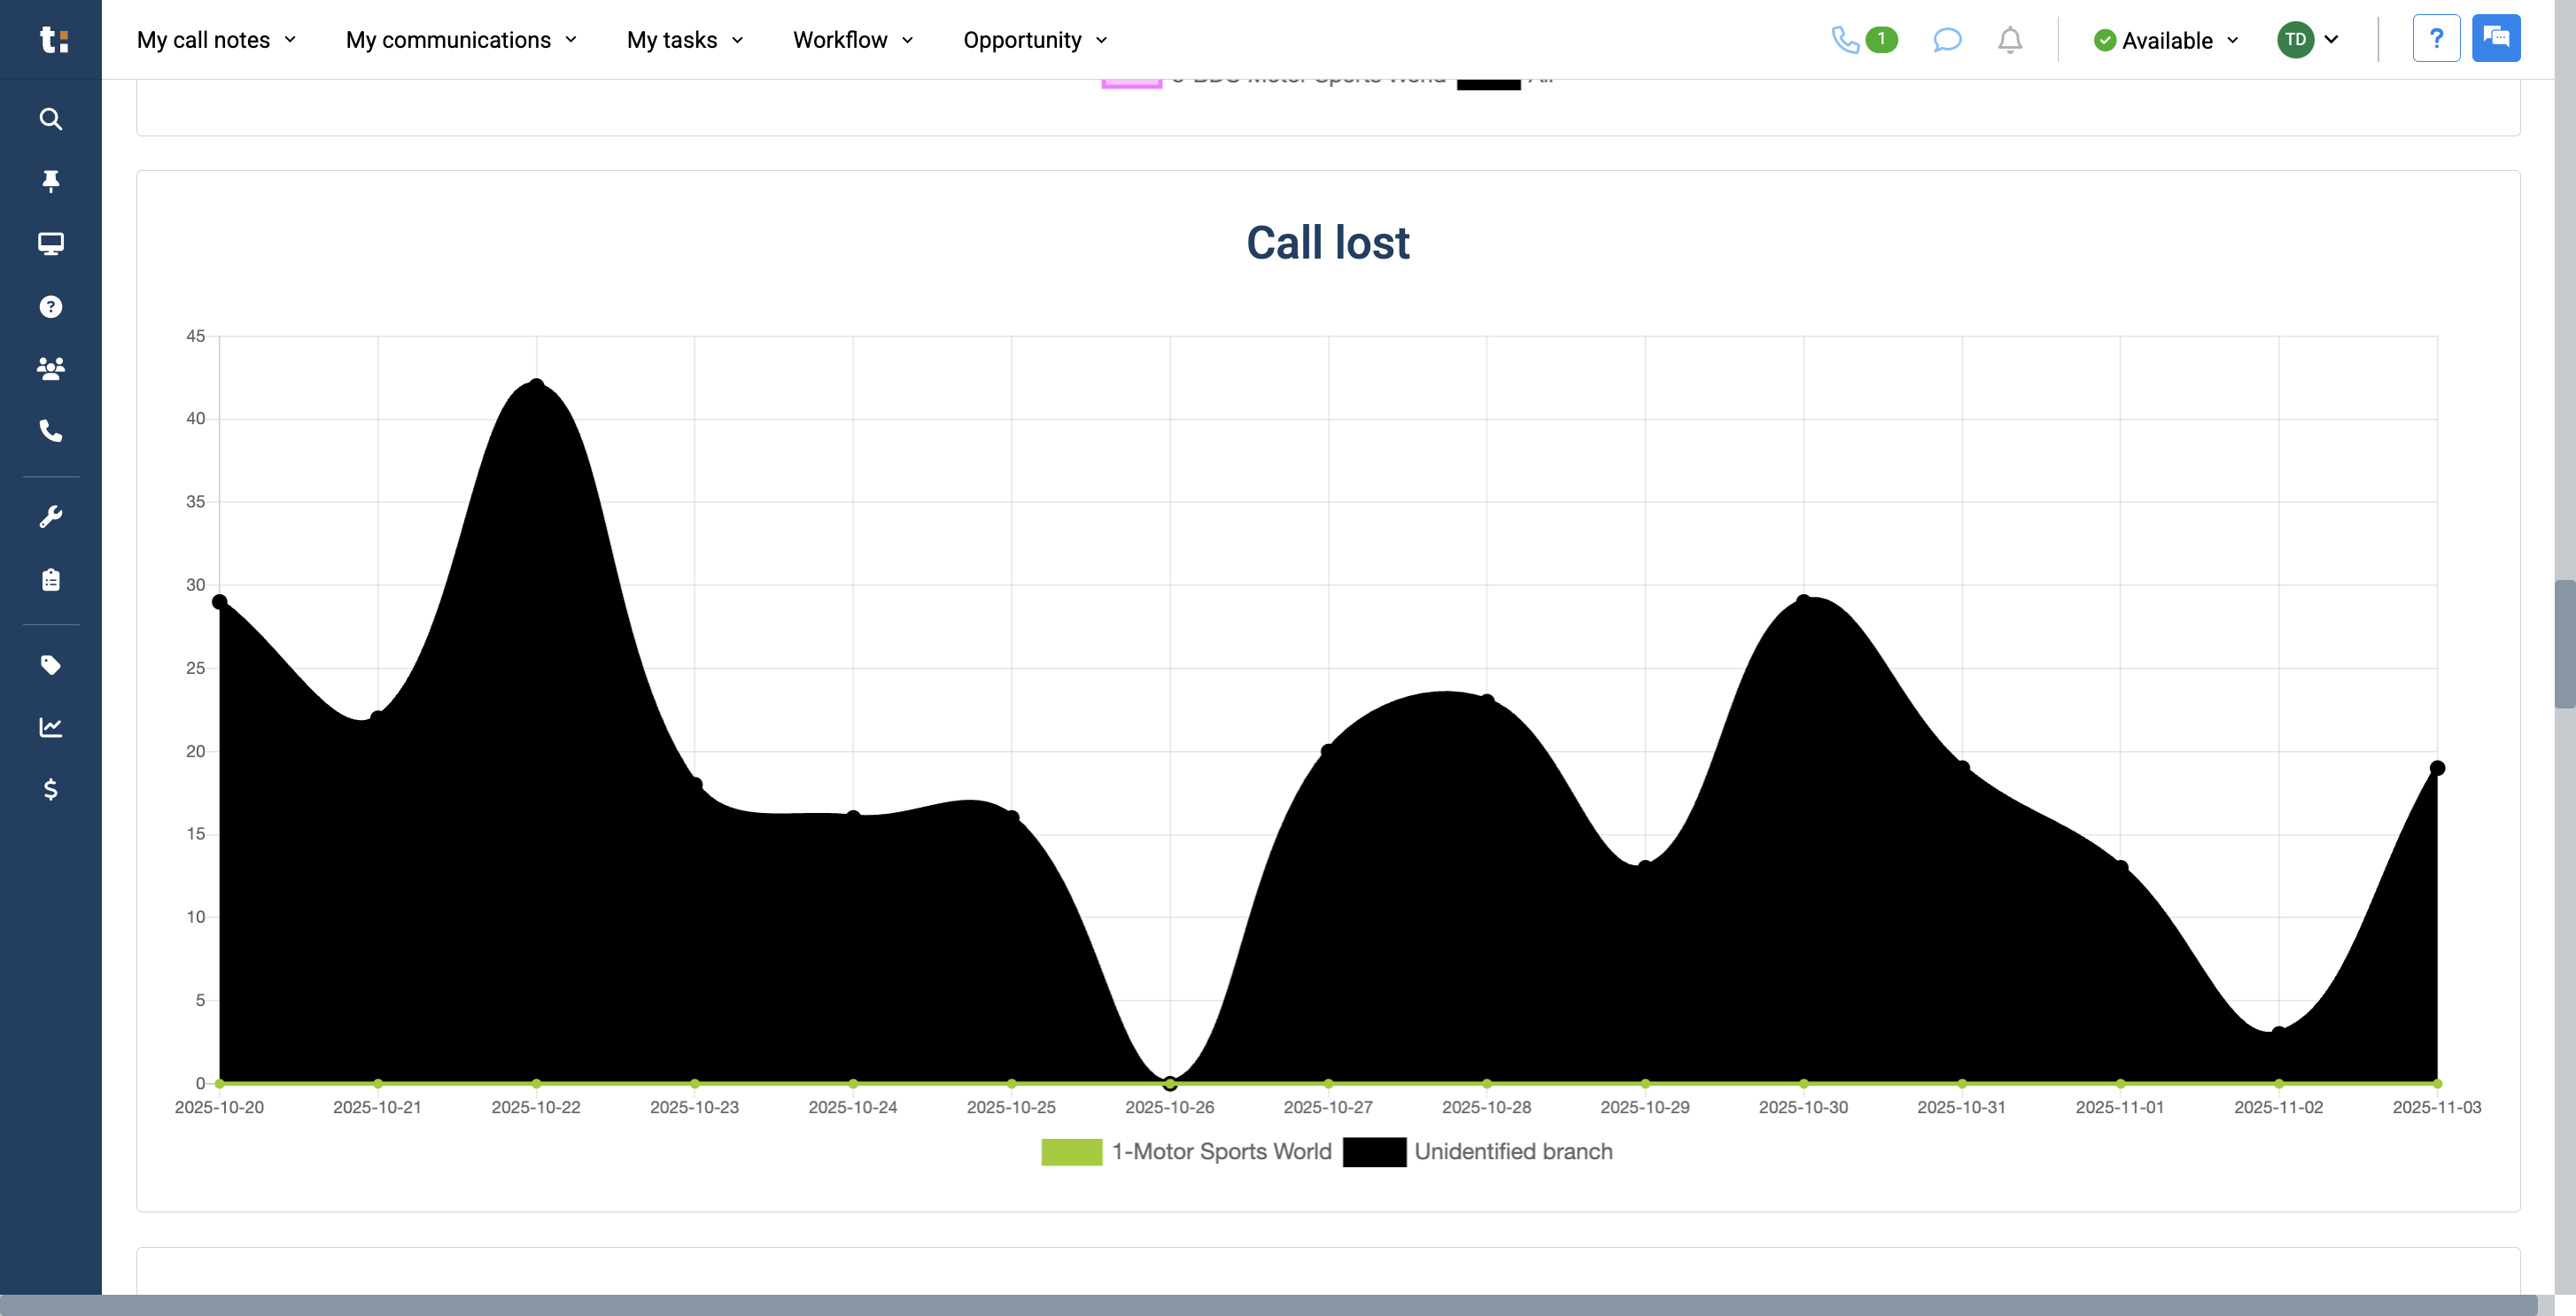
We also have a graph that shows Calls Lost. This means the client never reached anyone by phone.
22
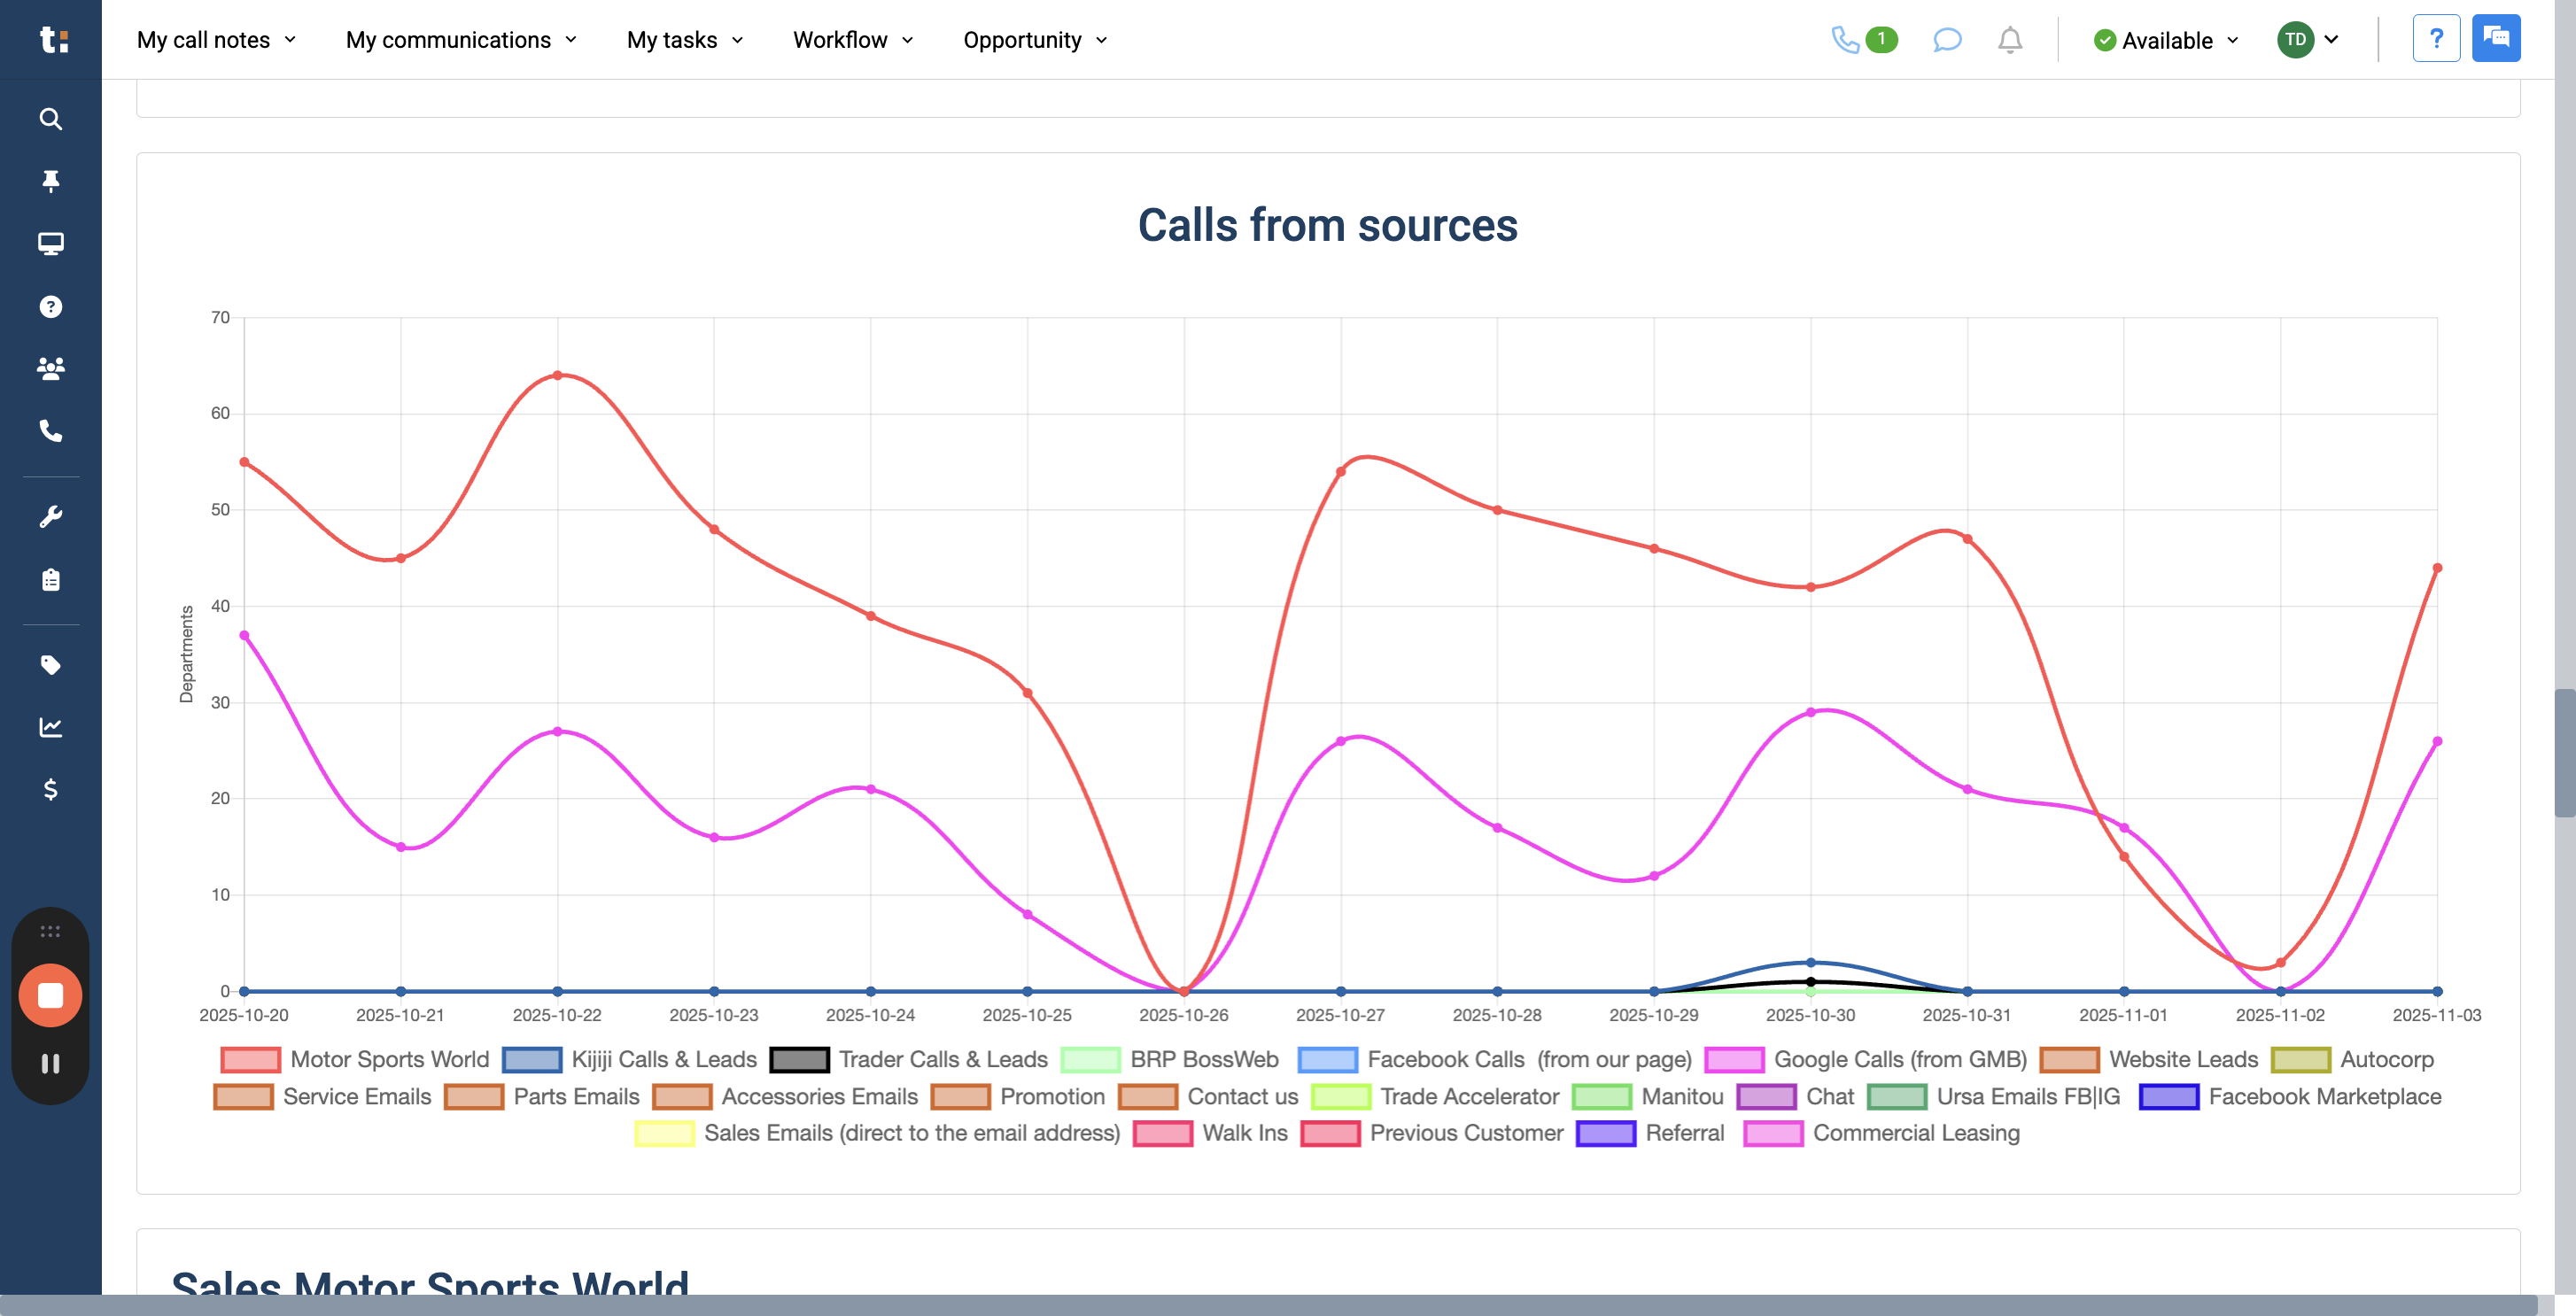
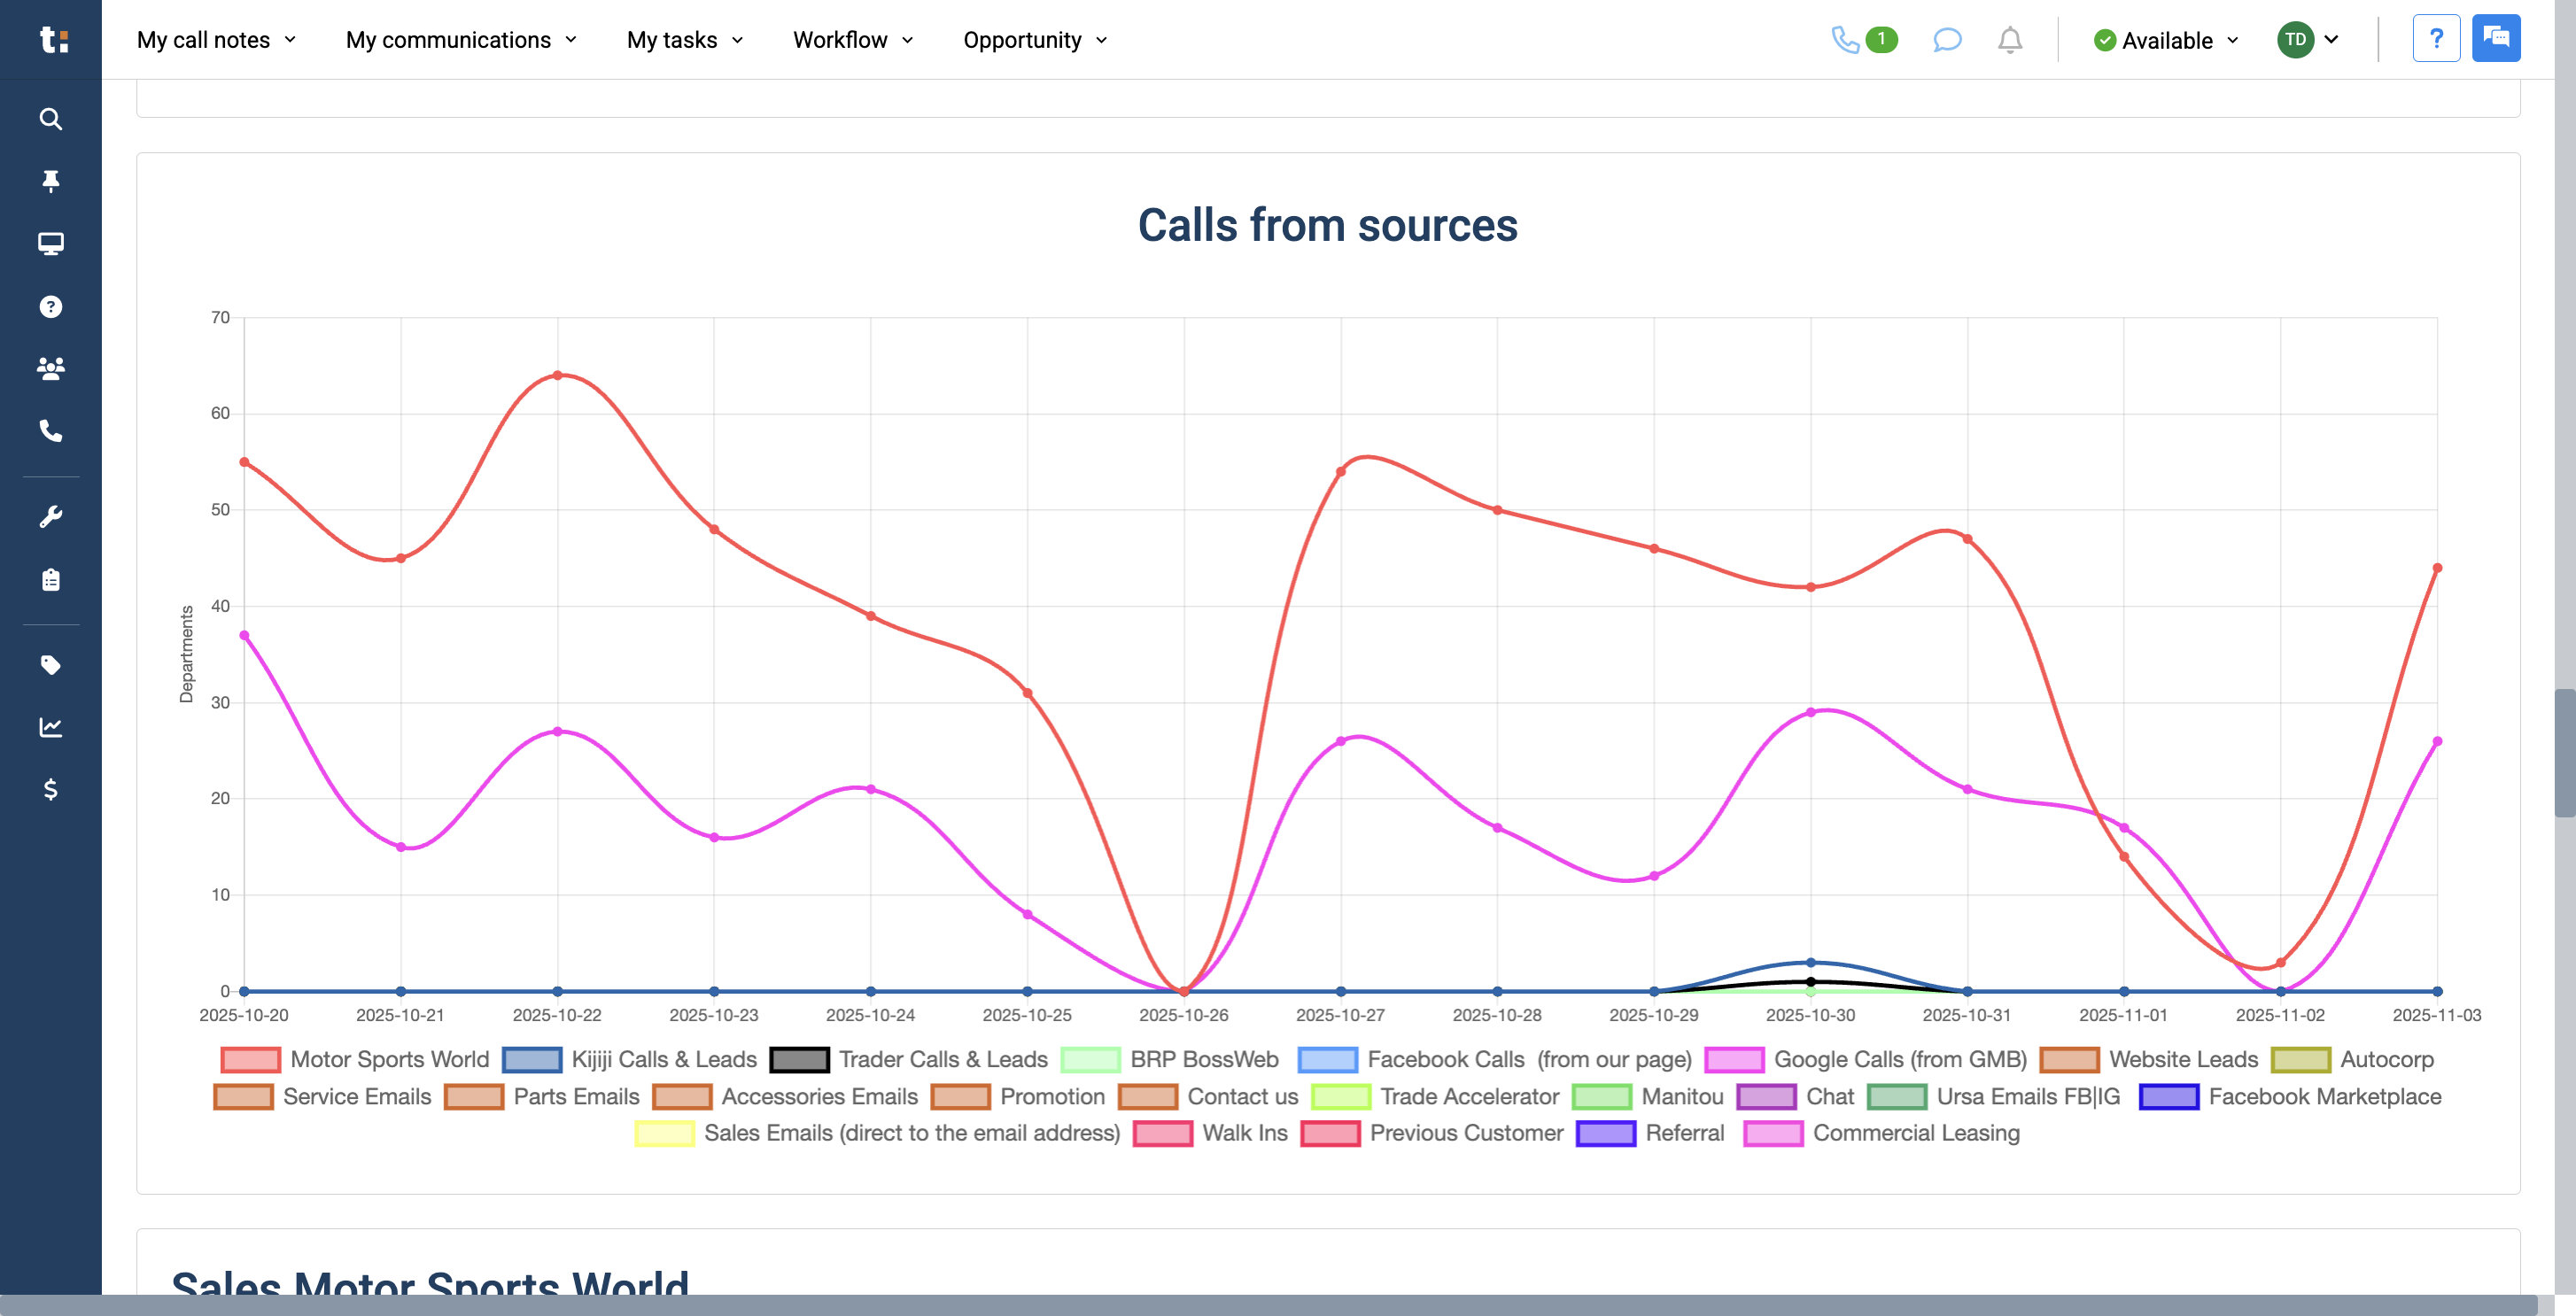
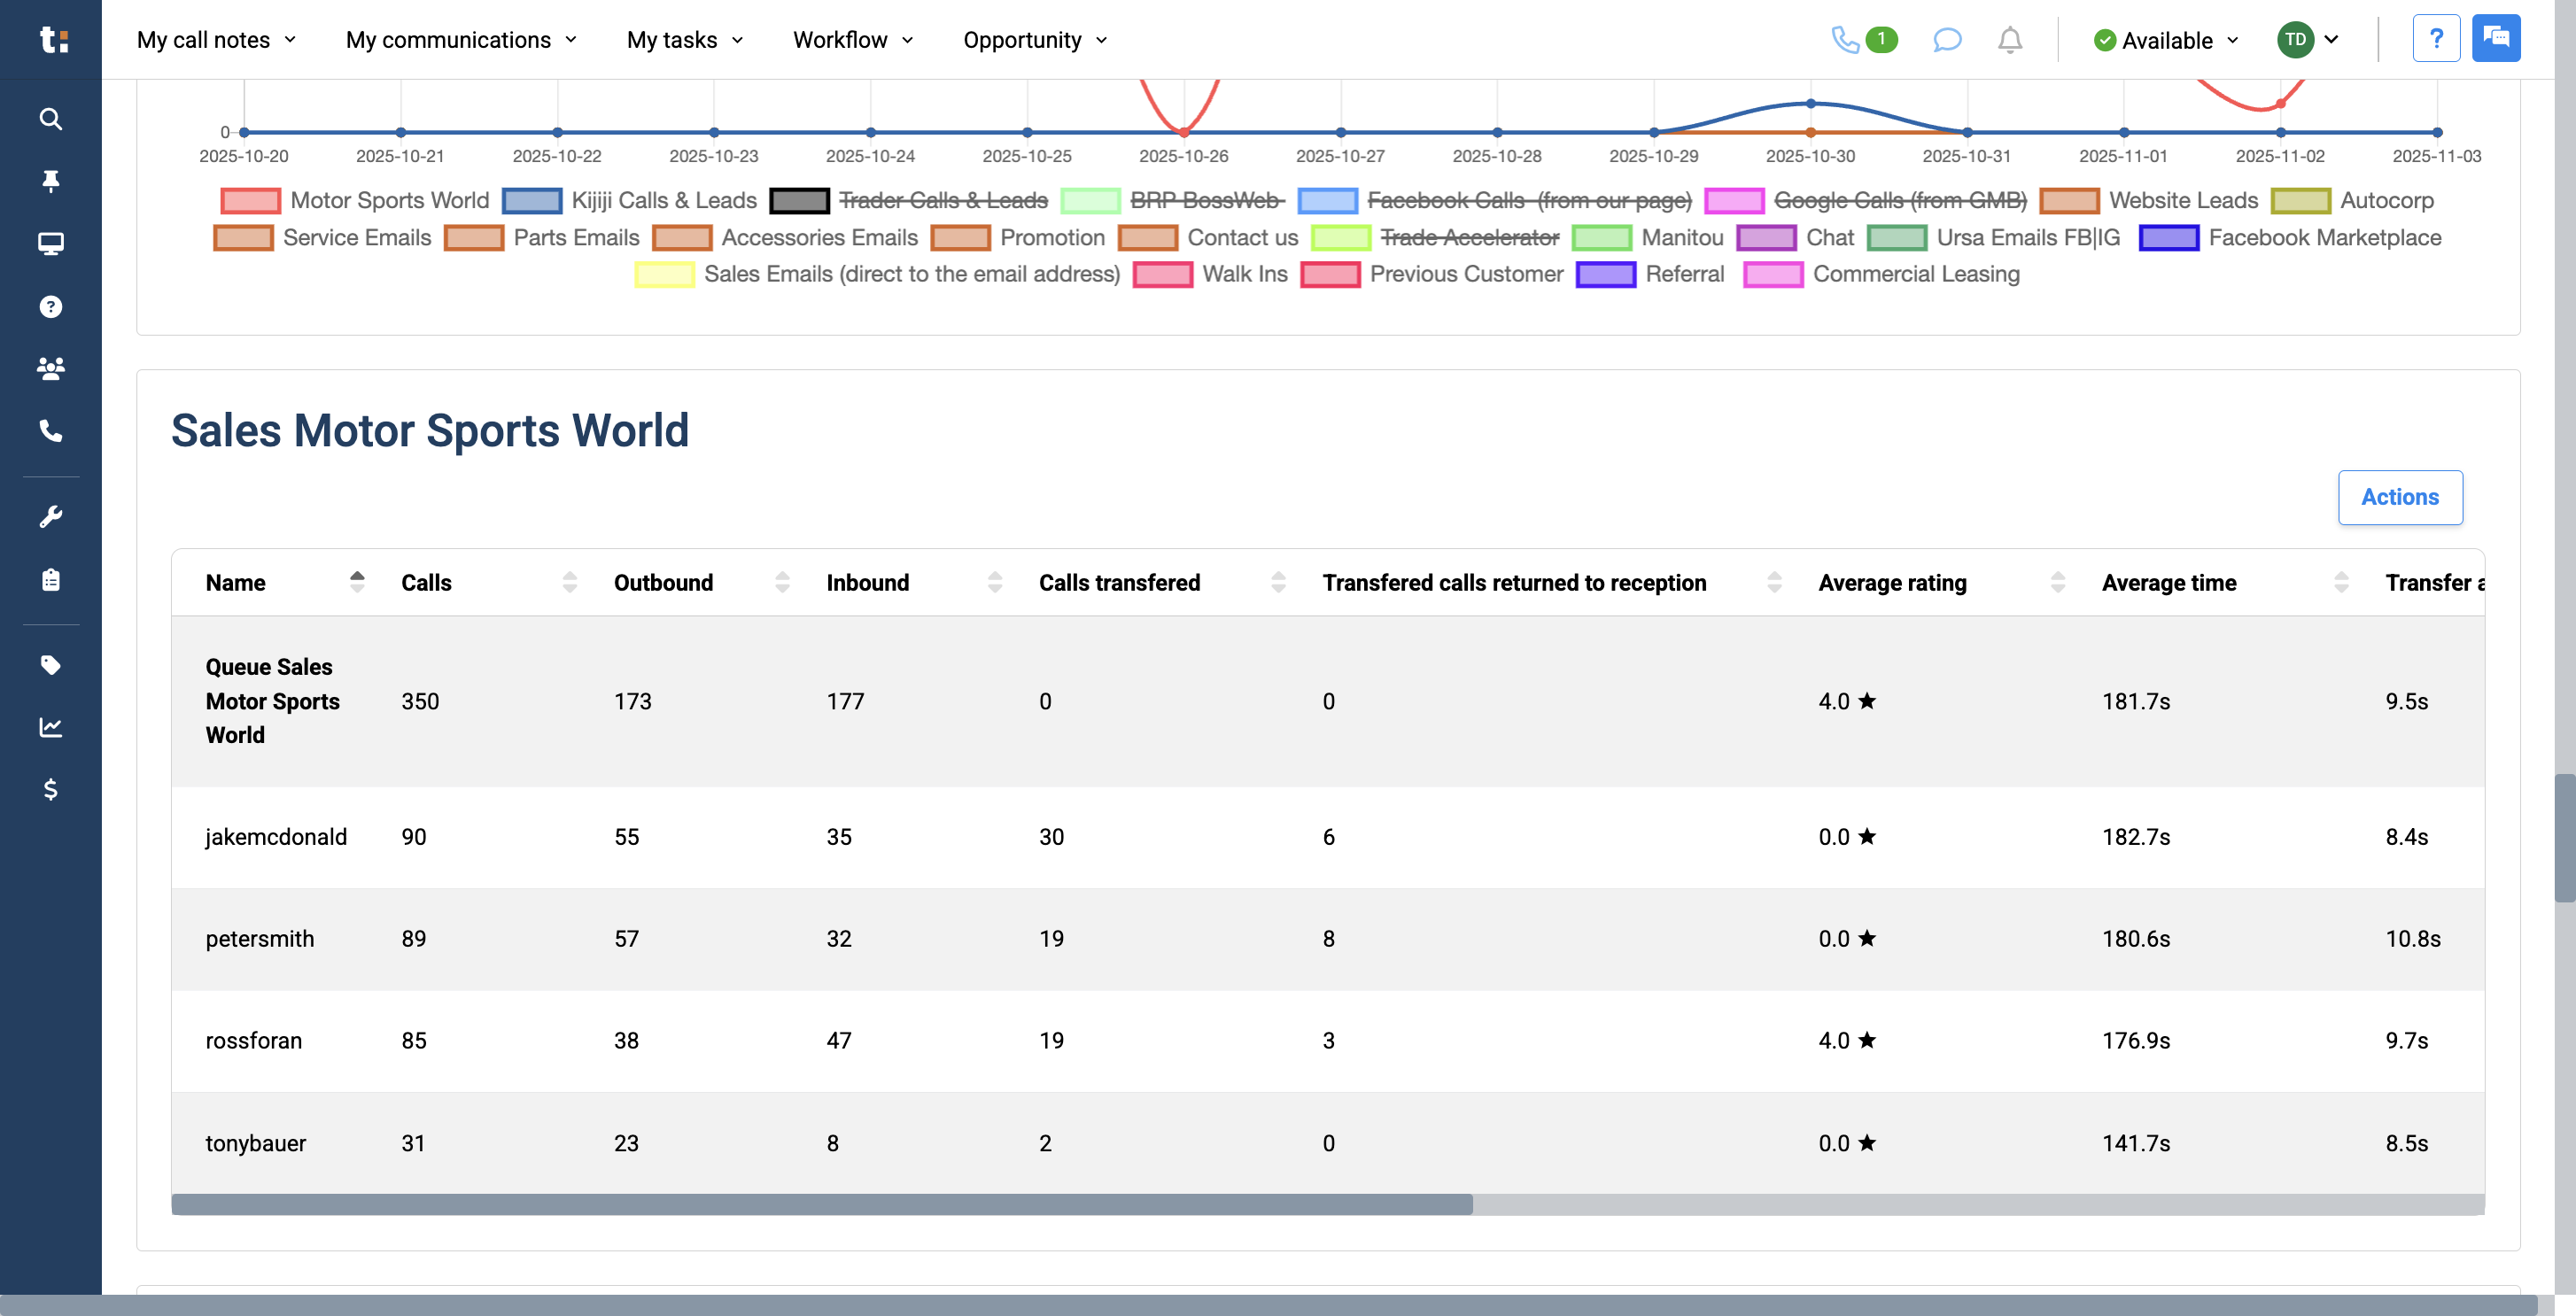
Finally, on the last graph, we have Calls from Sources. This will help you identify which sources are most productive and which are not.
23
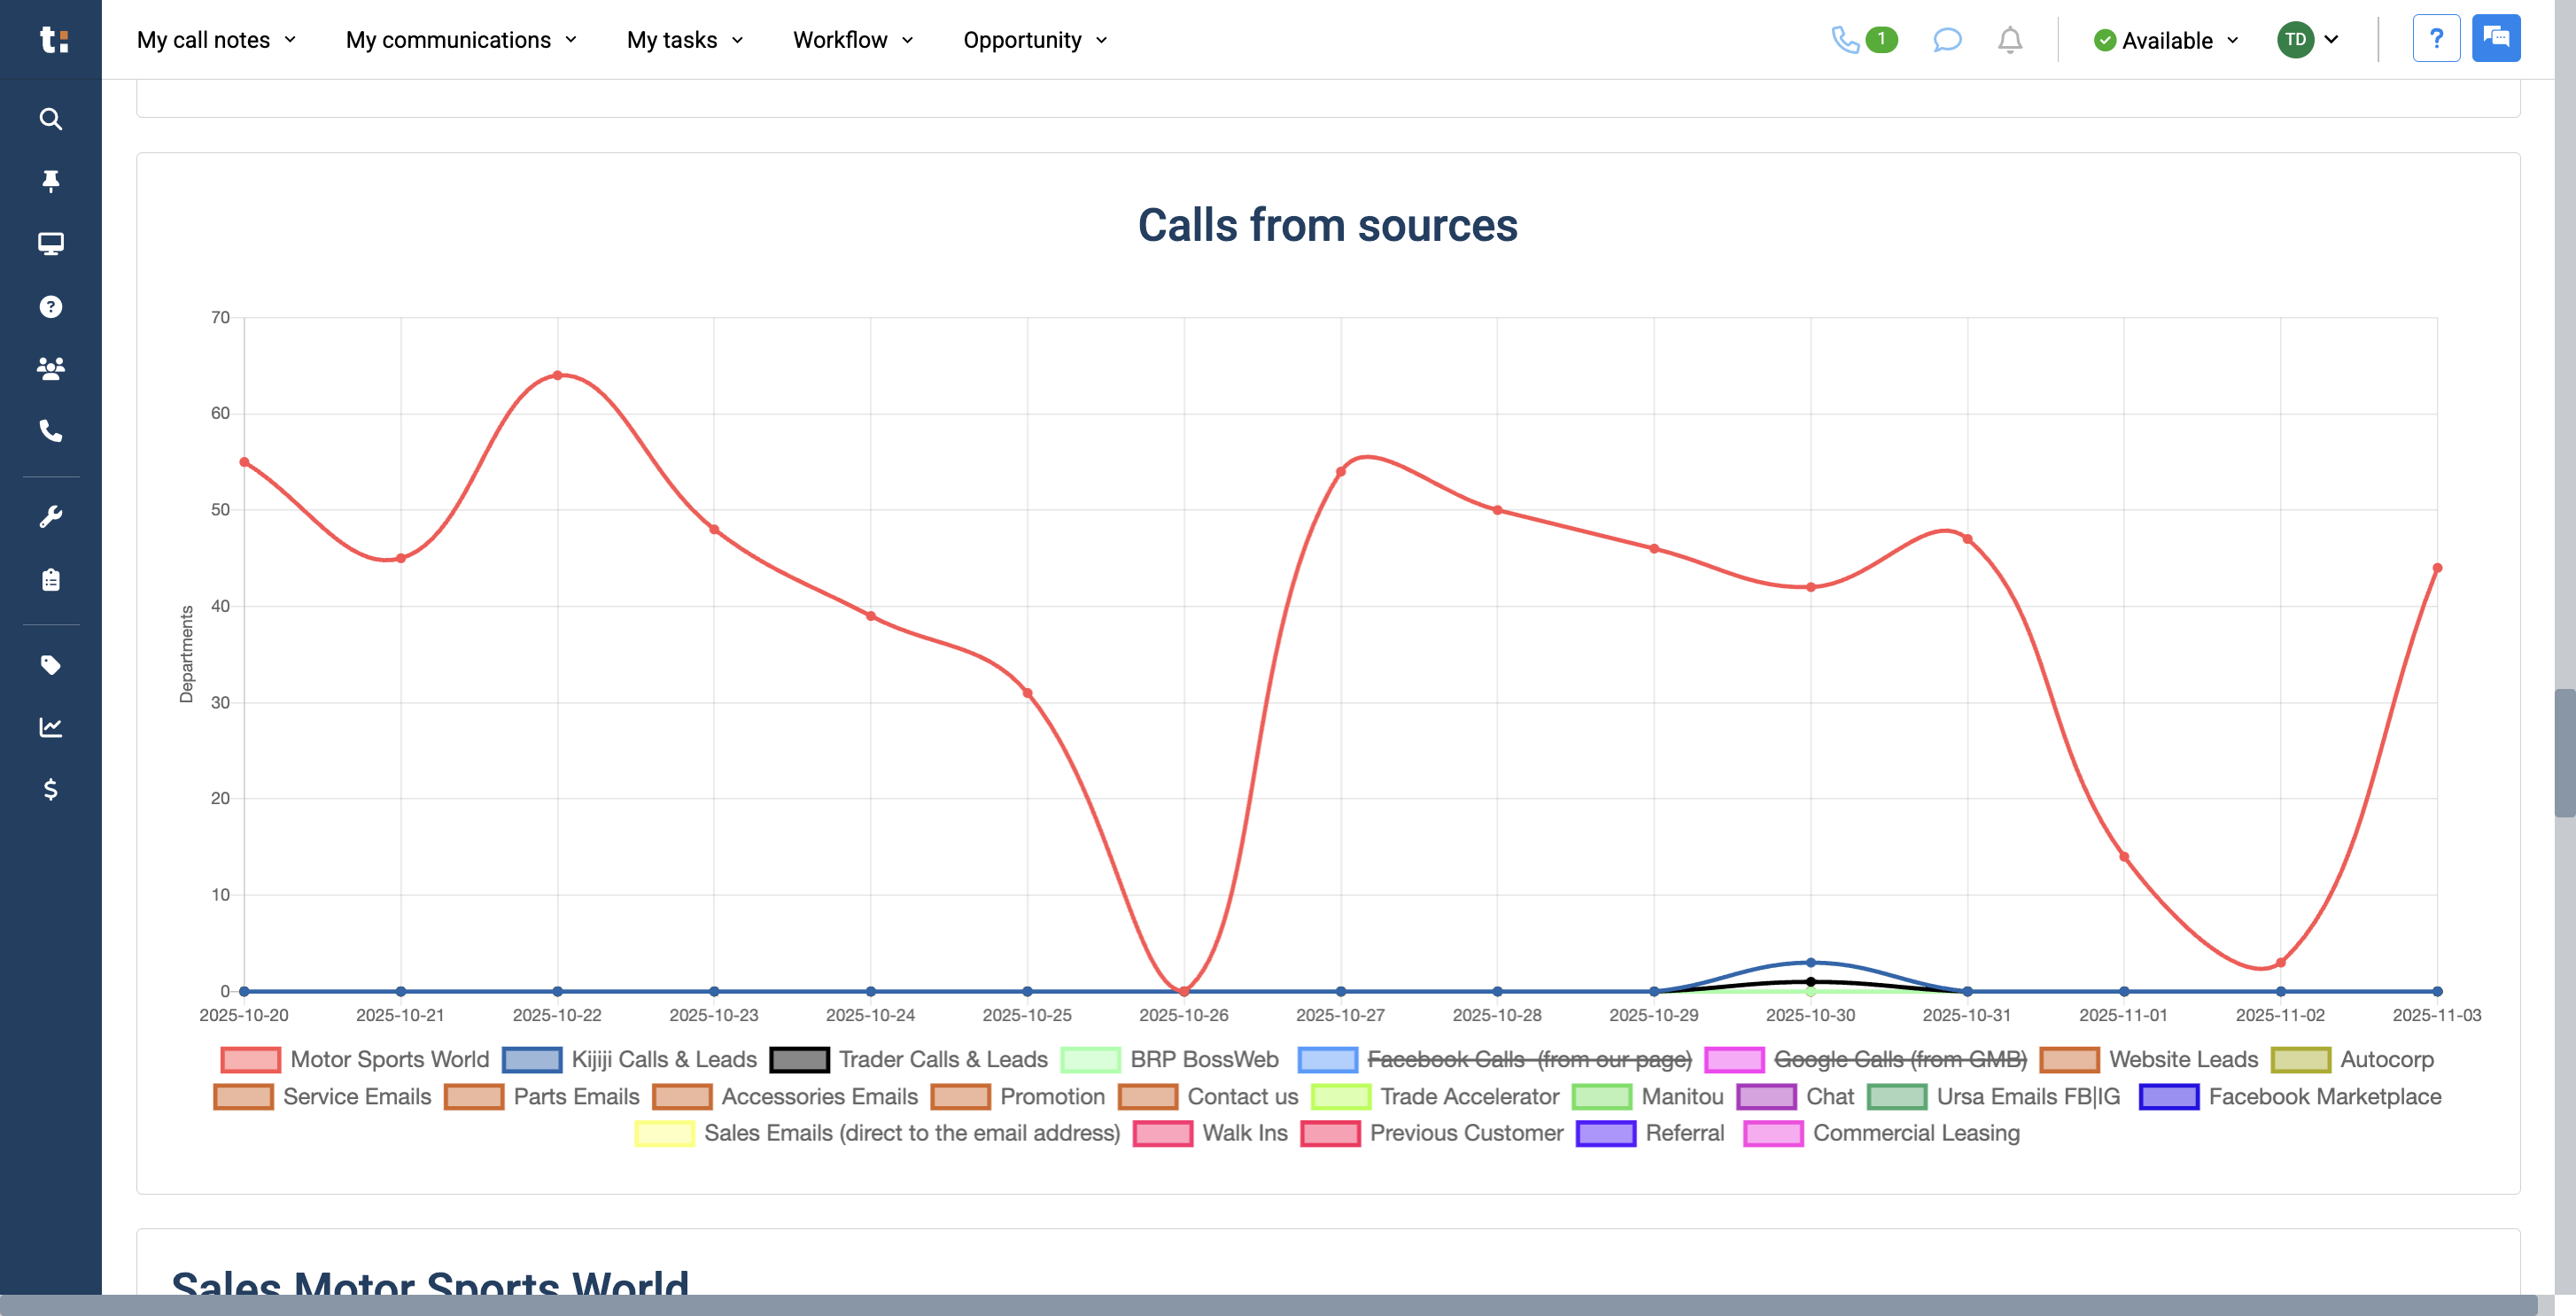
If you want to manage your graph differently, you can choose any of the options below to remove them from your graph.
24
Simply click on the option you want to remove from your graph.
25
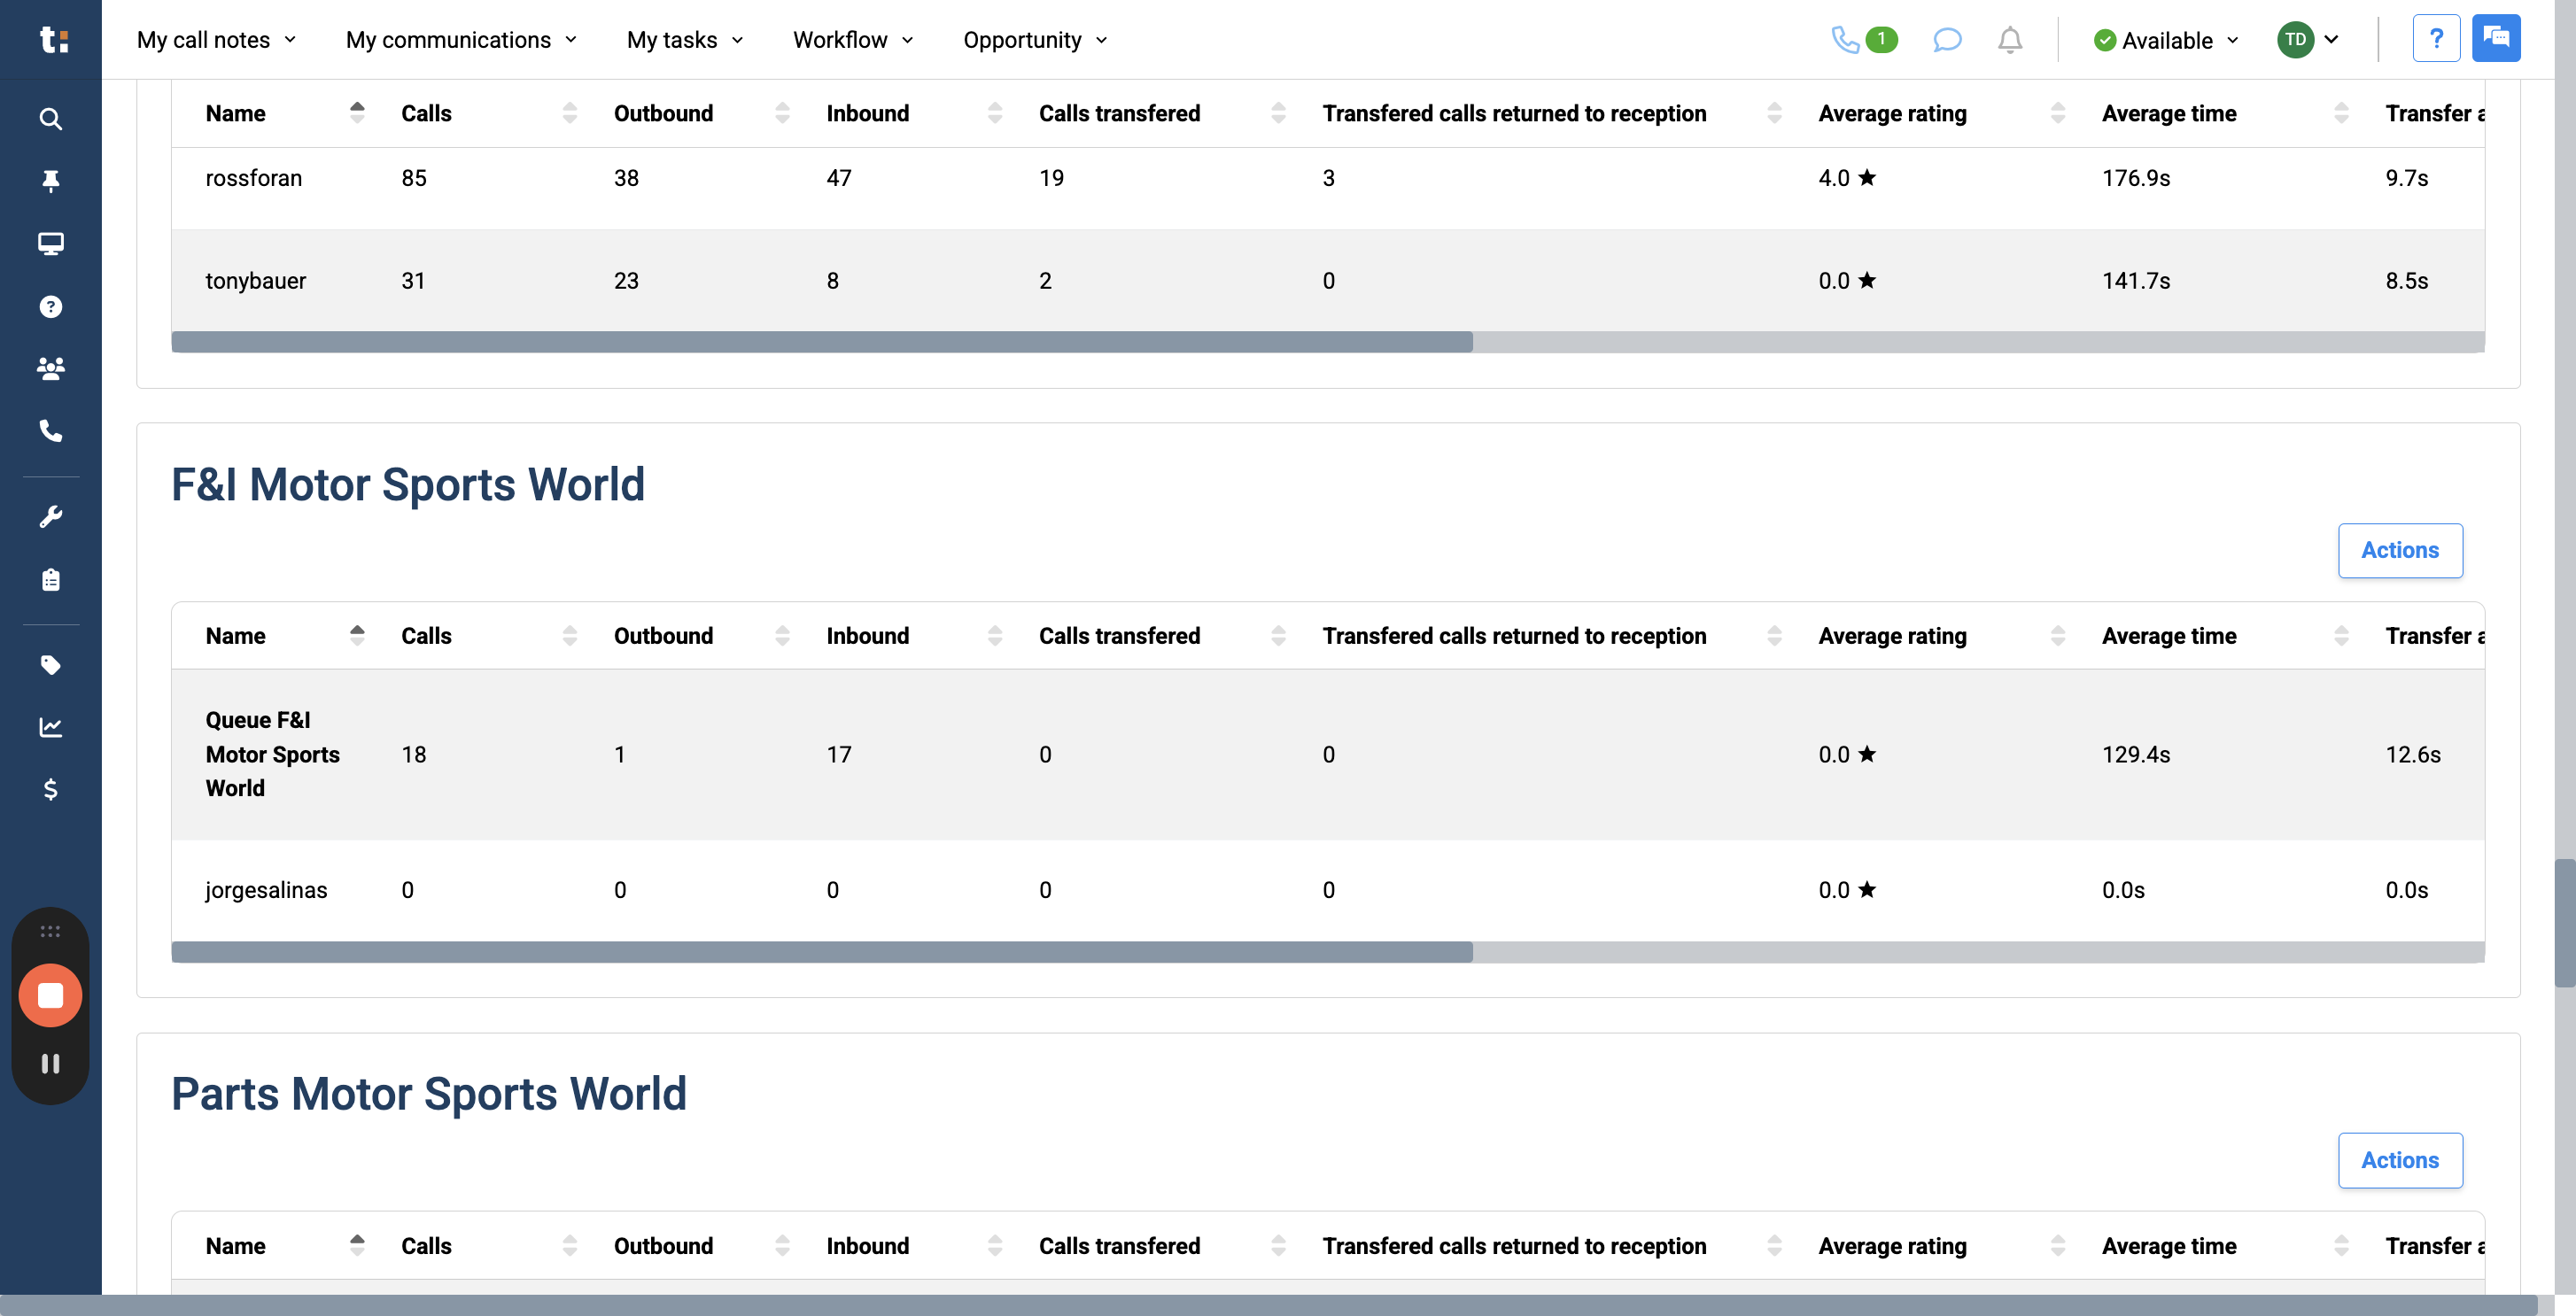
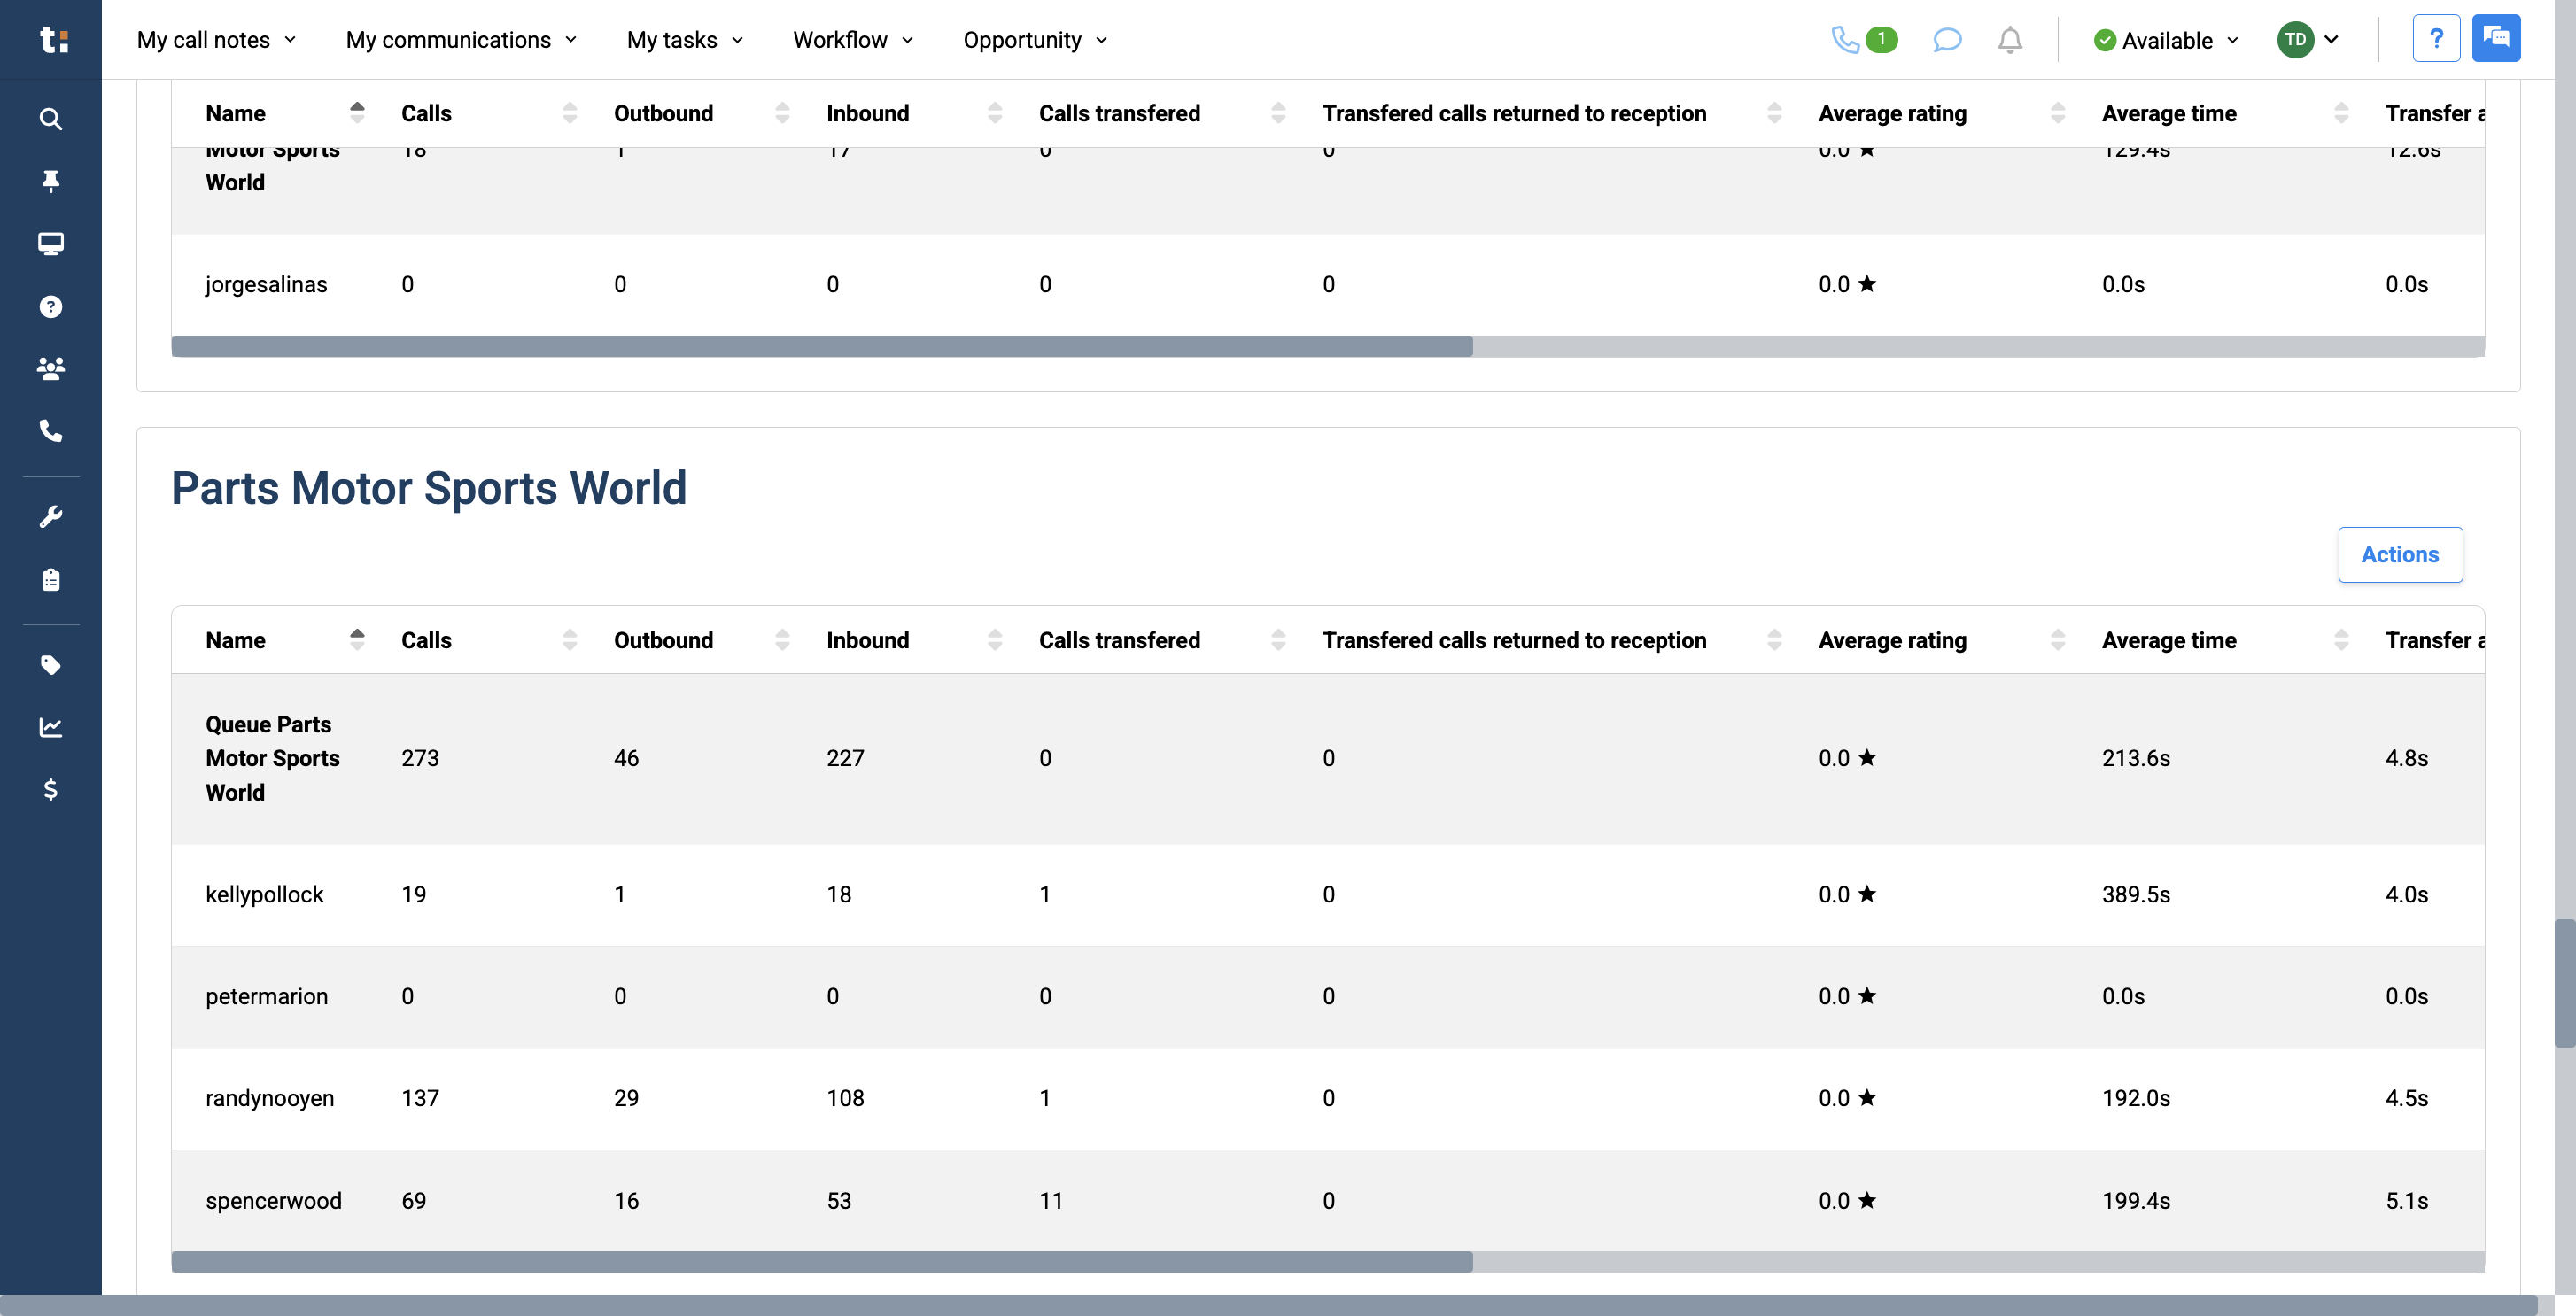
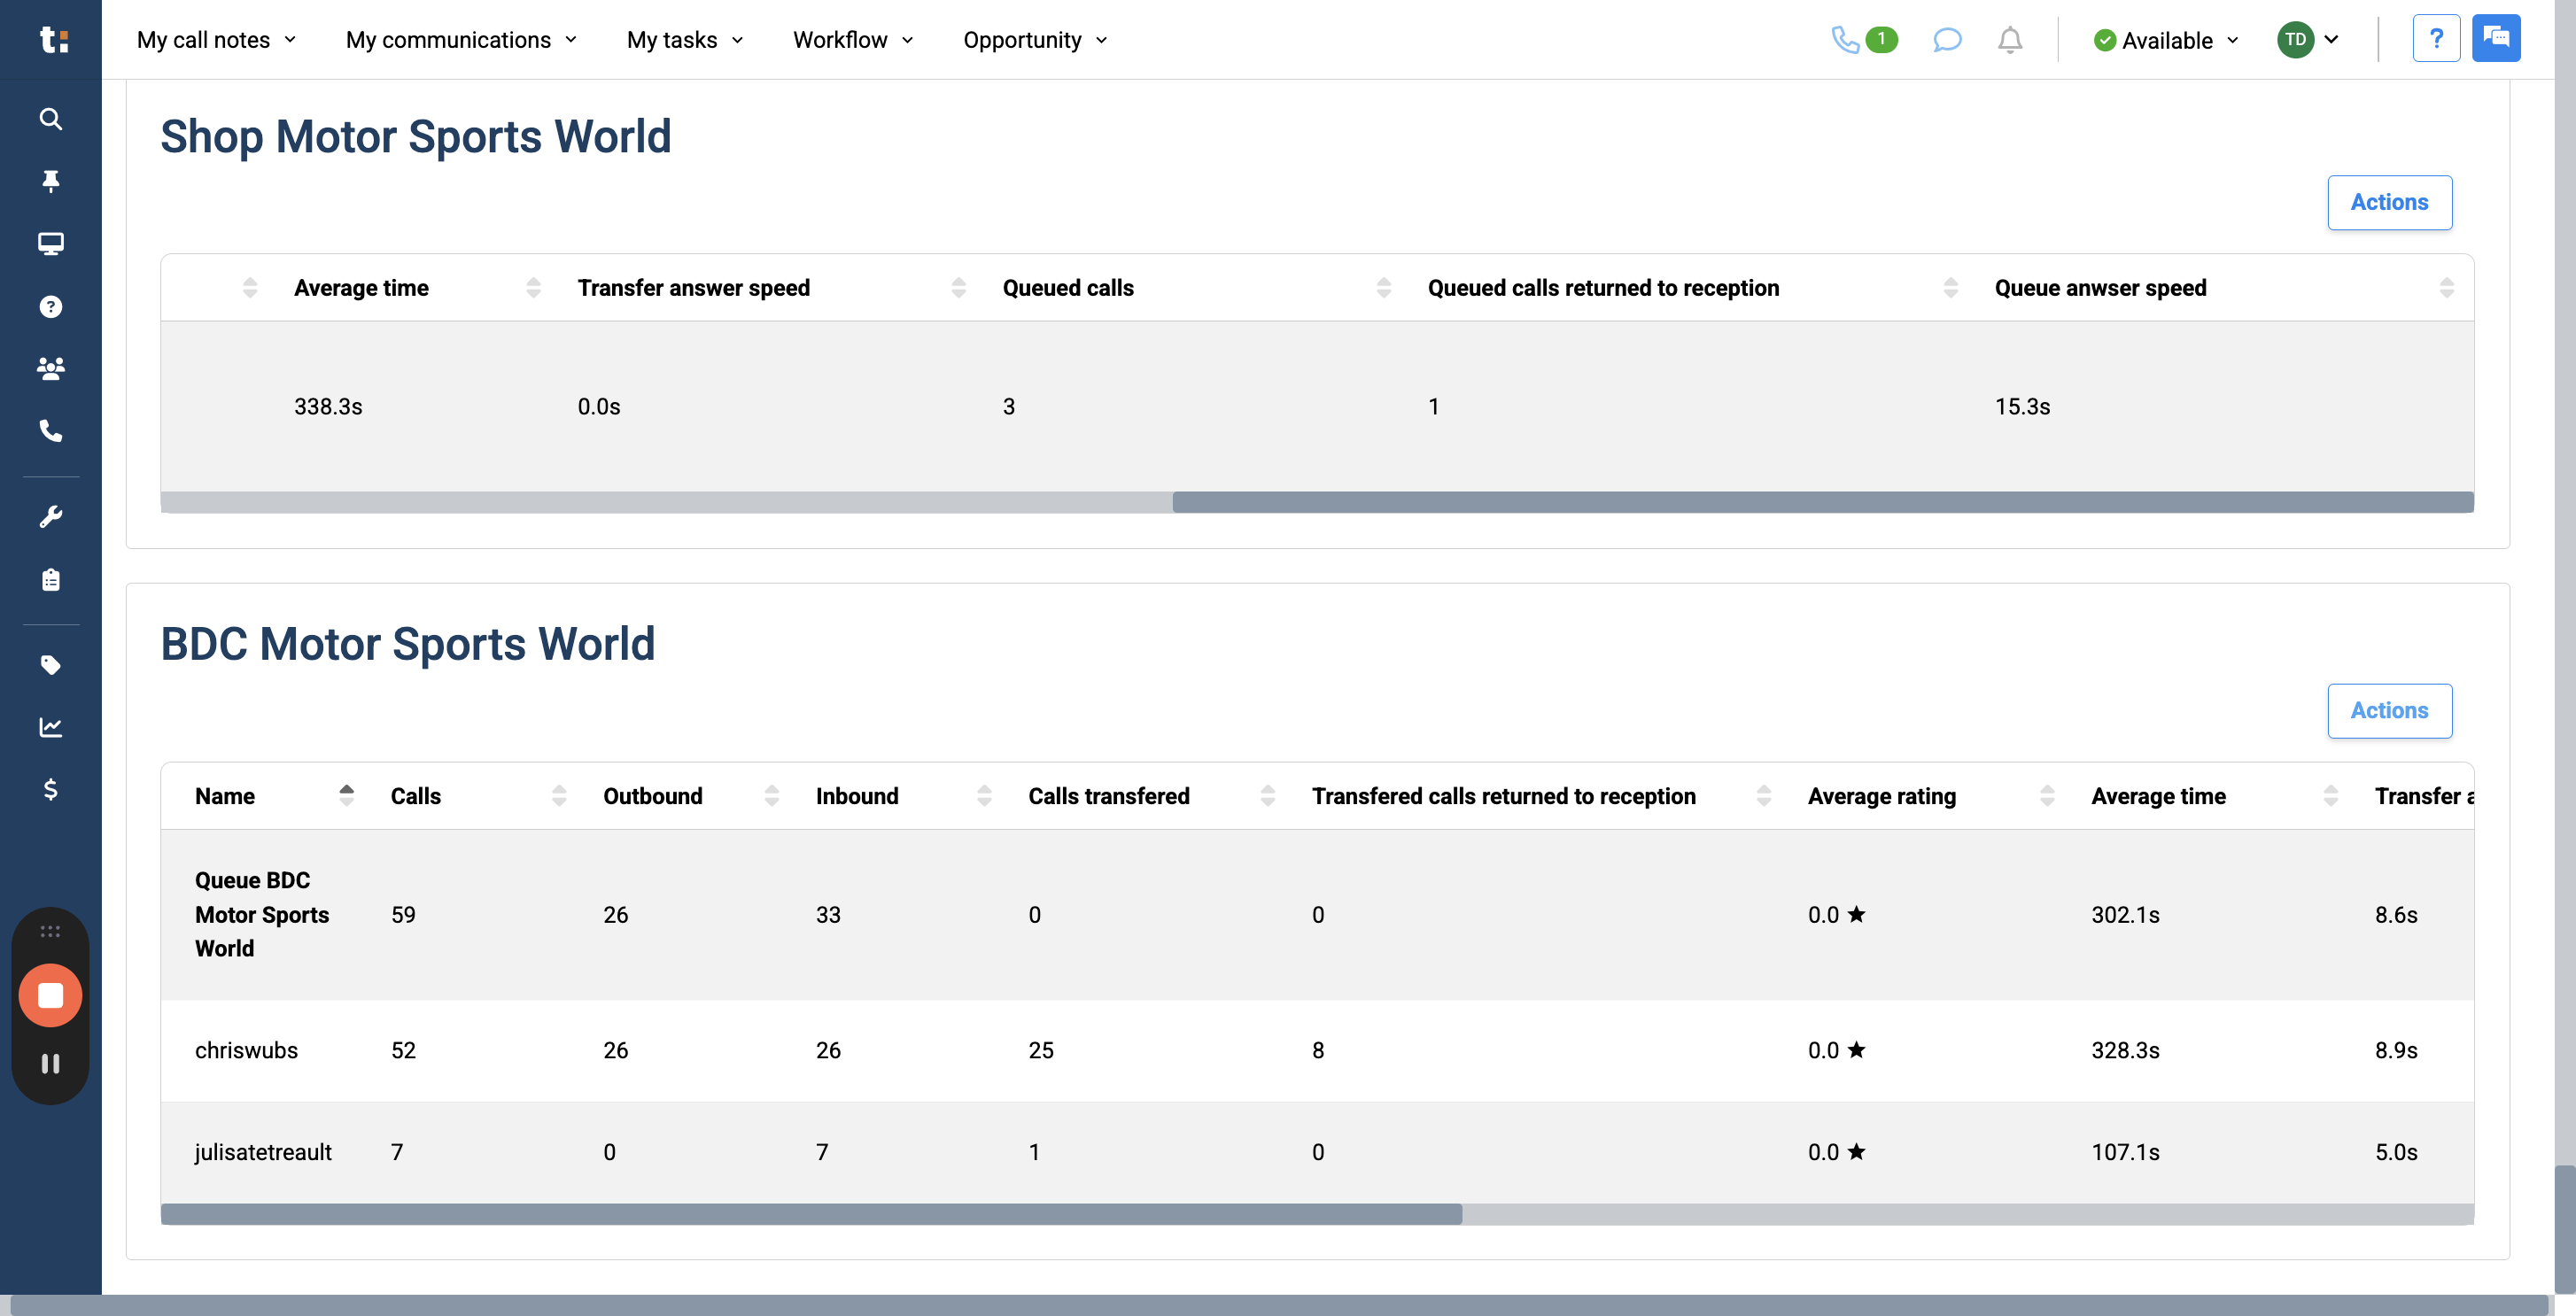
At the bottom of the page, you will see detailed information for each department.
26
This information includes the total number of calls, the number of outbound and inbound calls,
27
the number of transferred calls, and how many were transferred to reception.
28
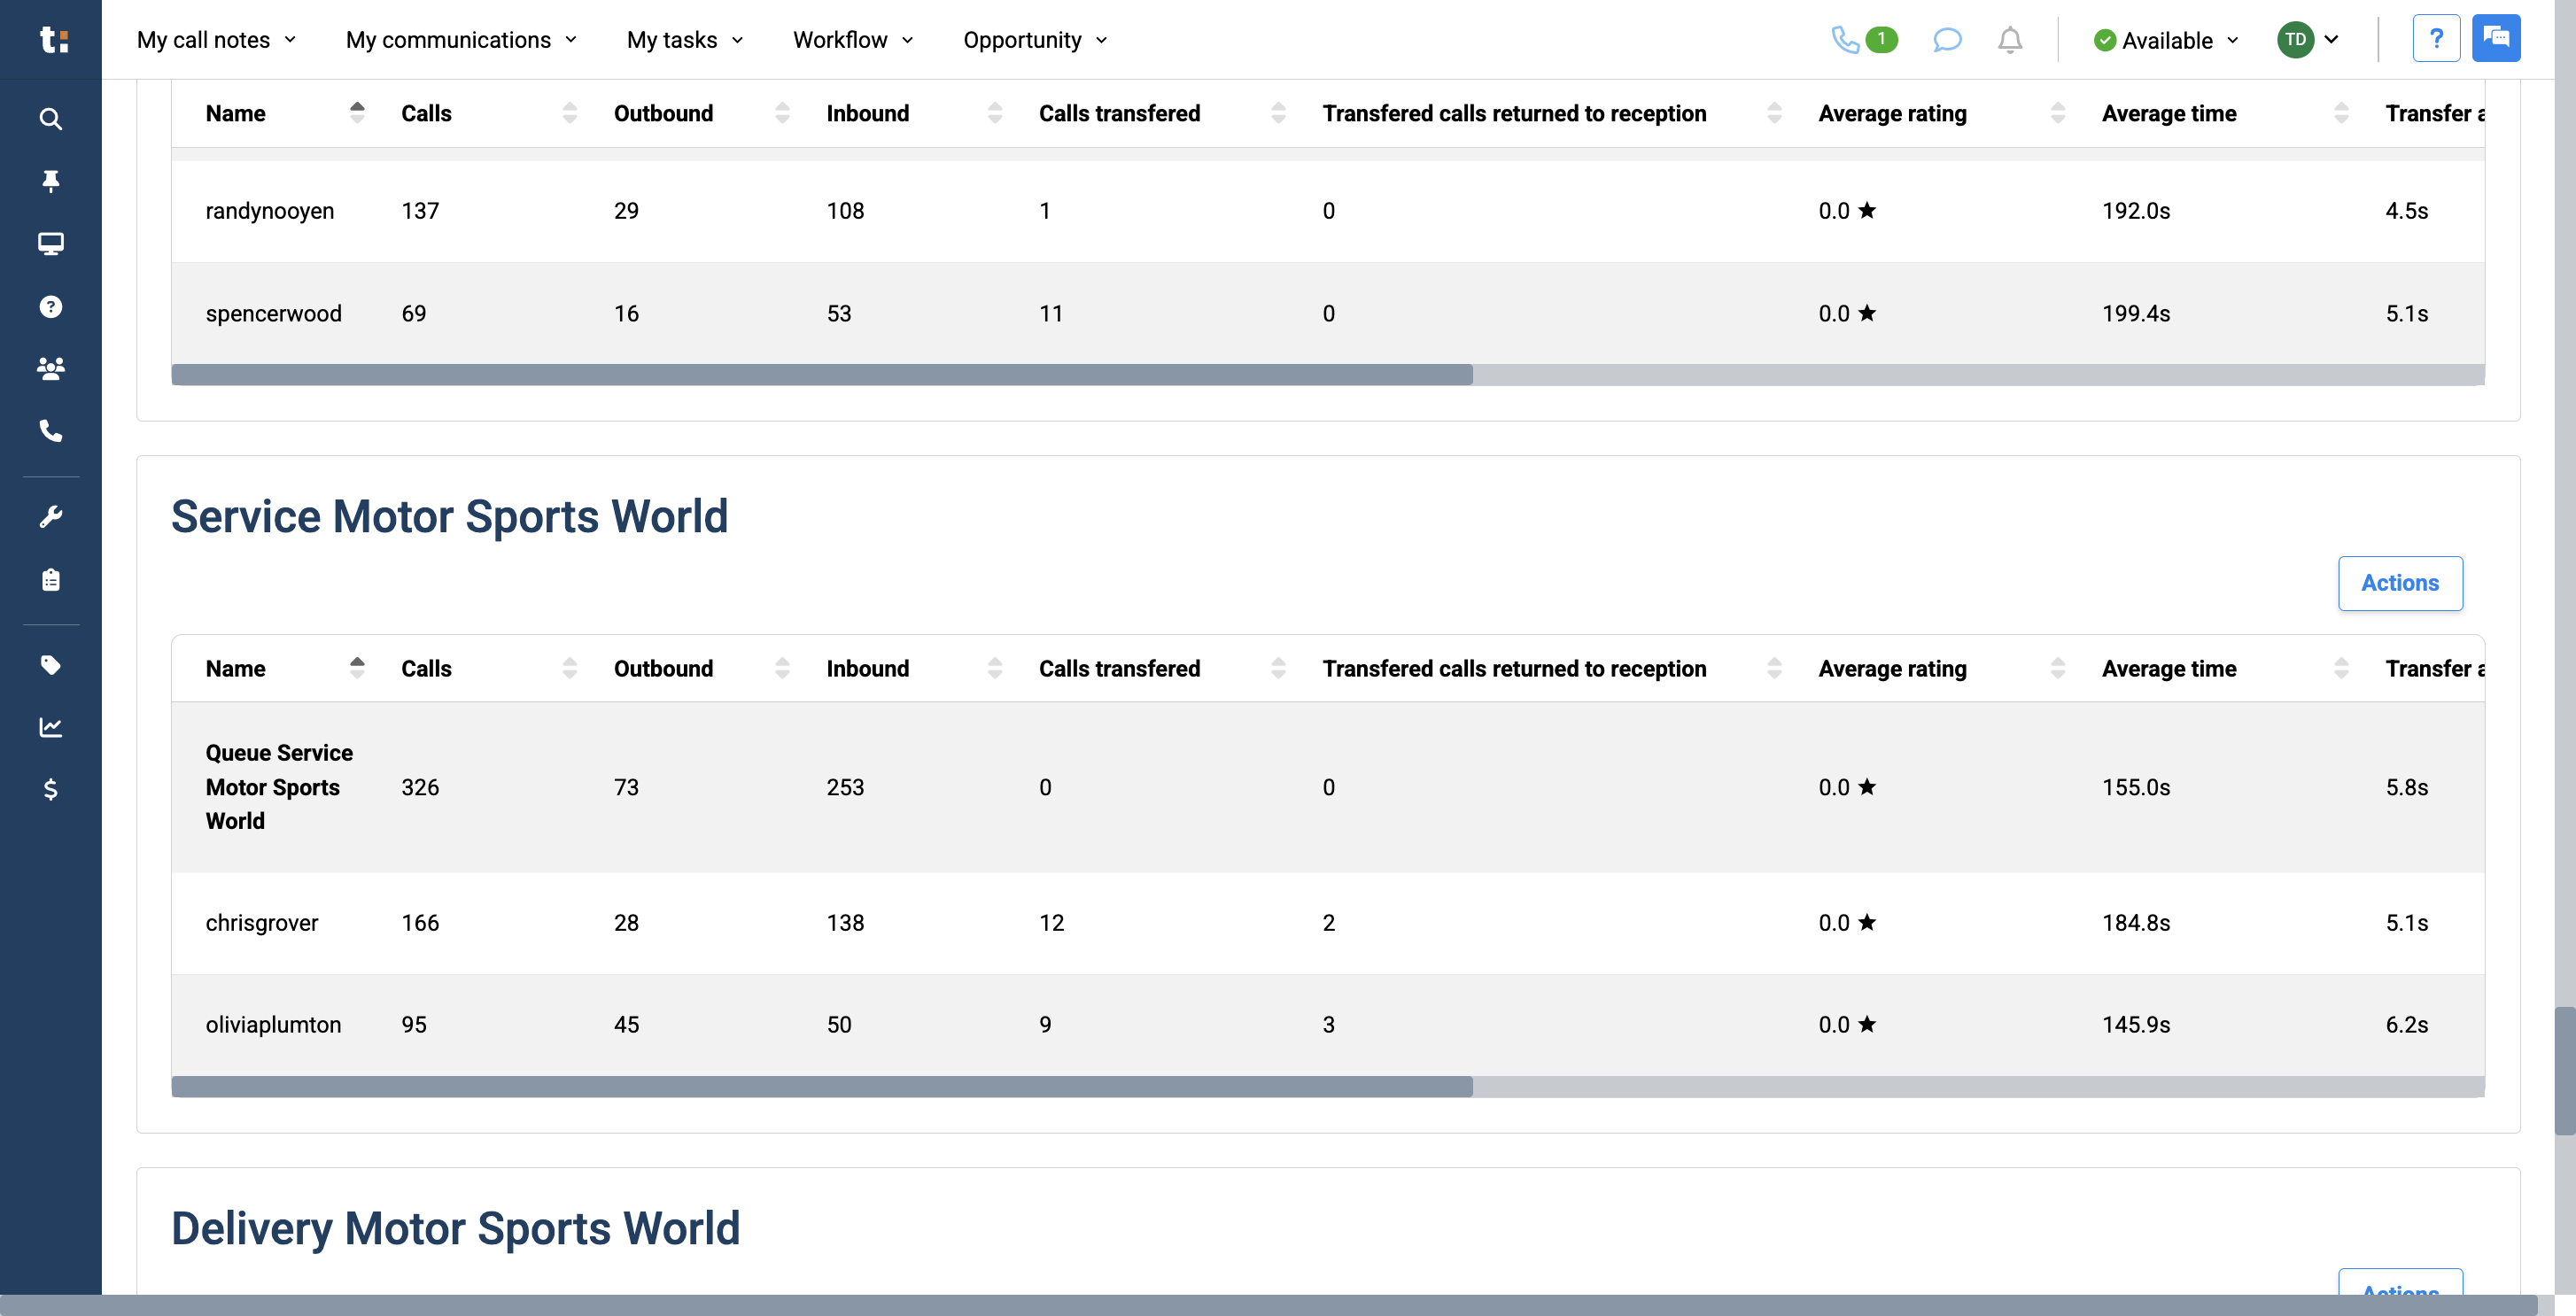
It also covers the average number of calls, the average call rating, and the average call duration.
29
Additionally, it shows how many calls were queued, how many returned to reception,
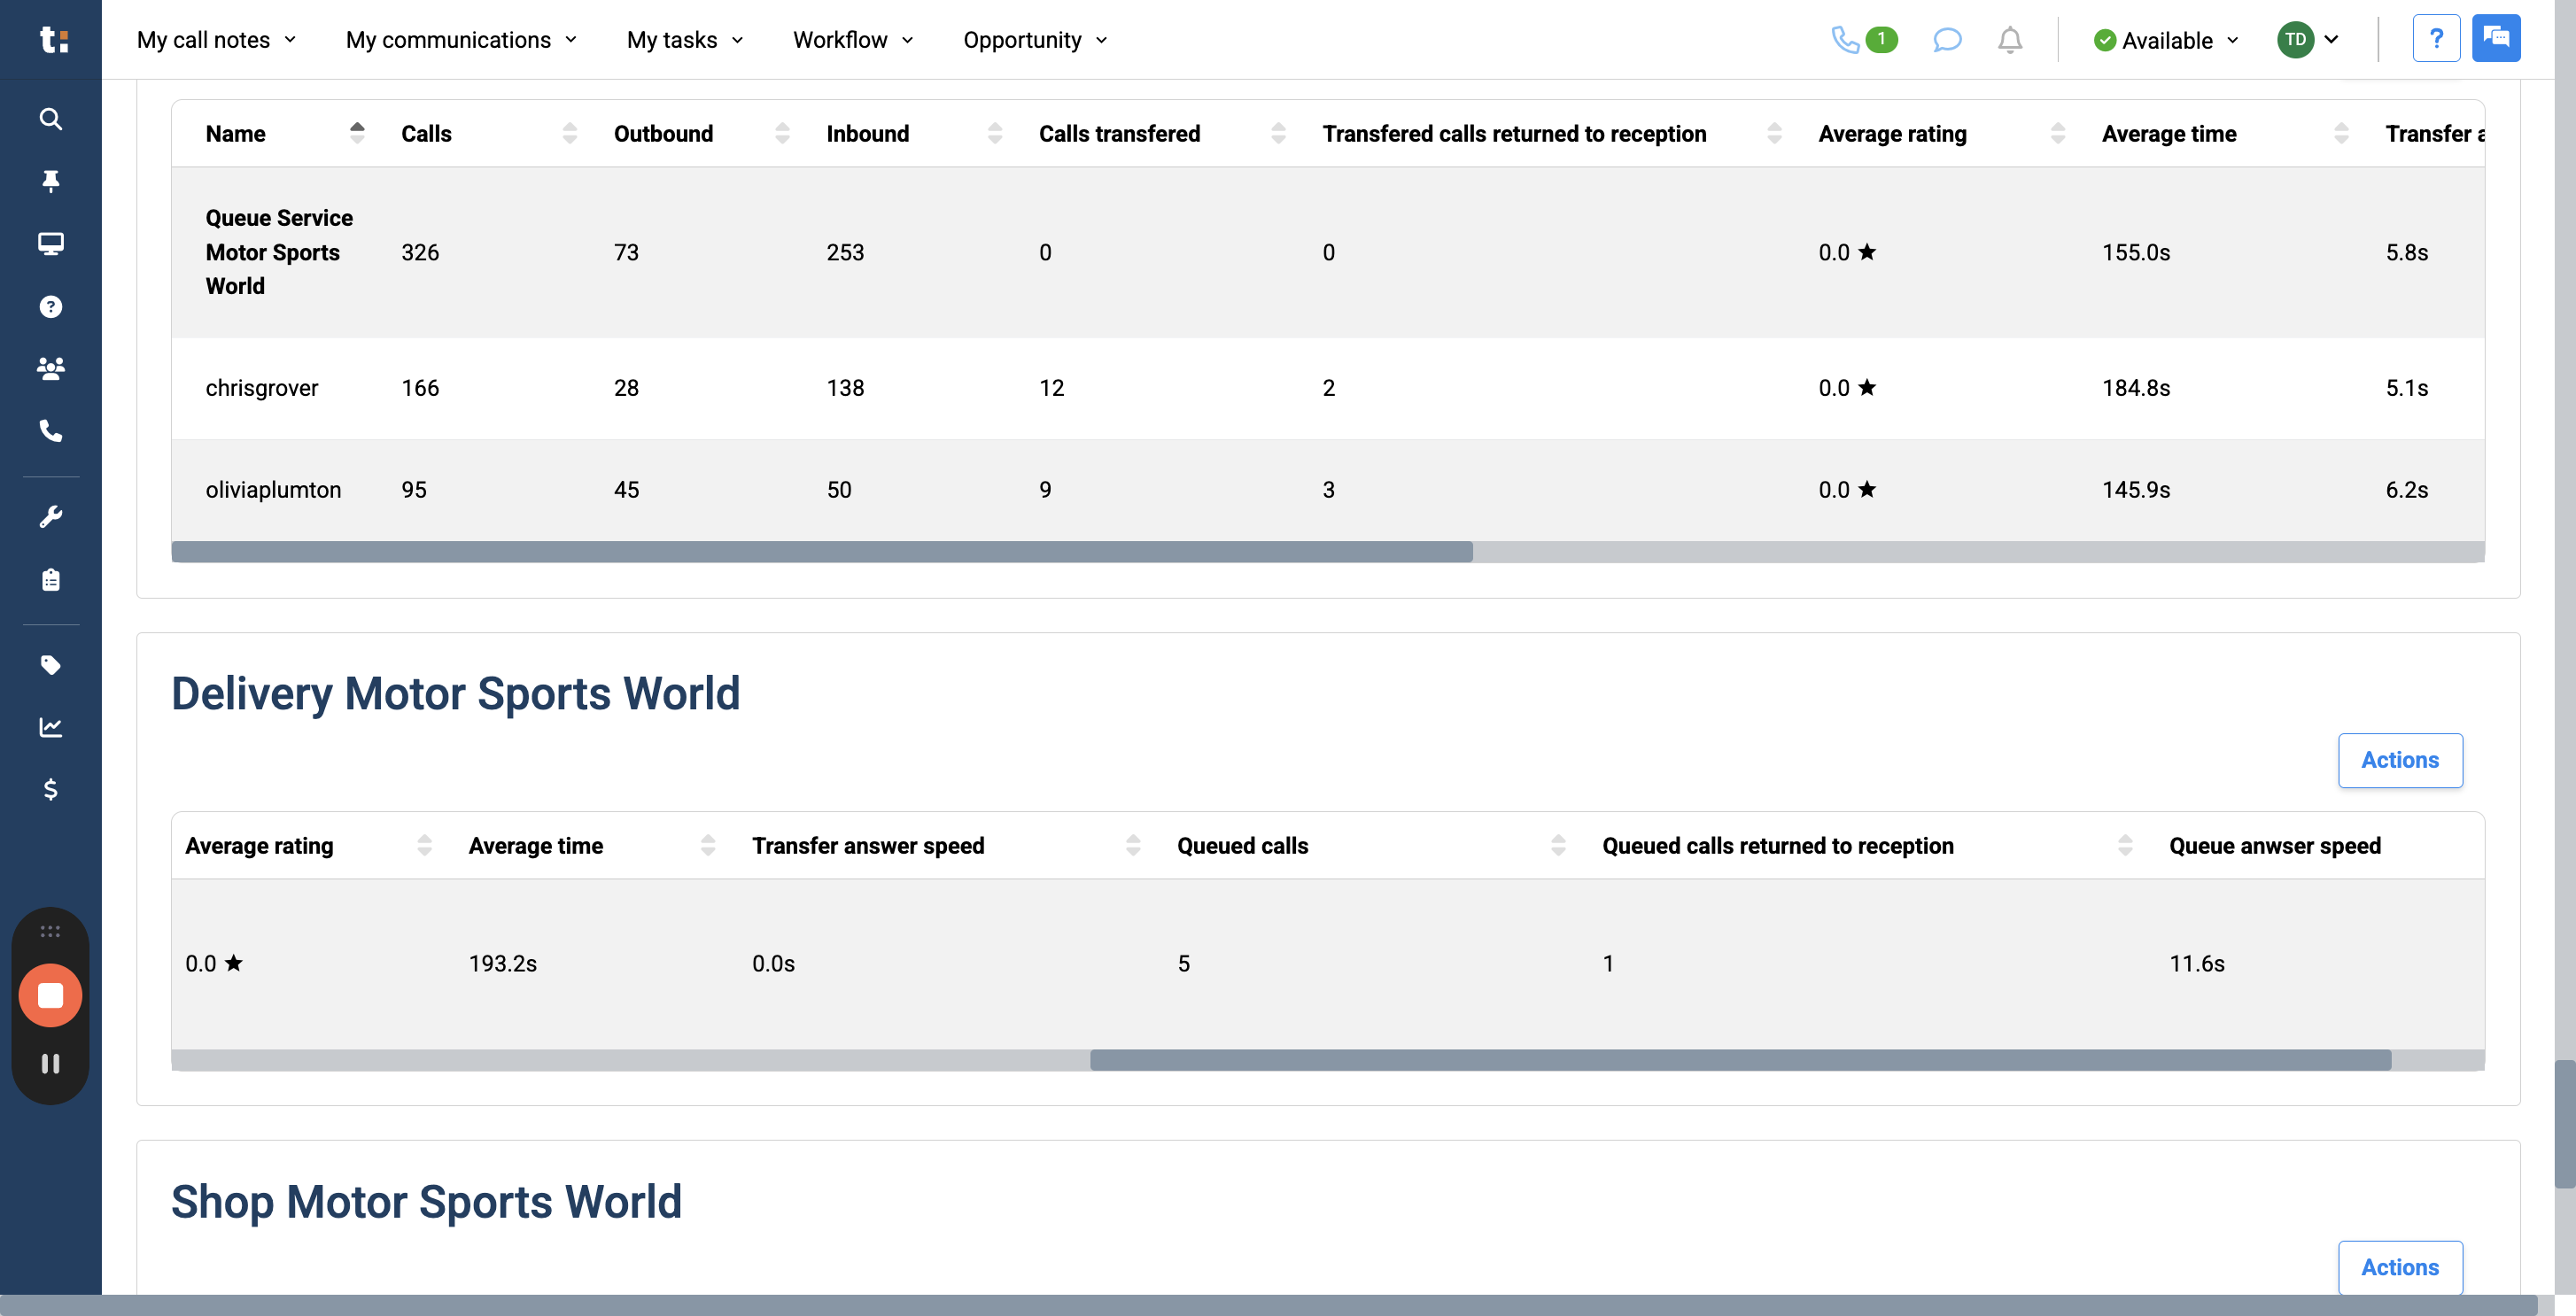
30
and the Queue Answer Speed, which measures how quickly calls are answered
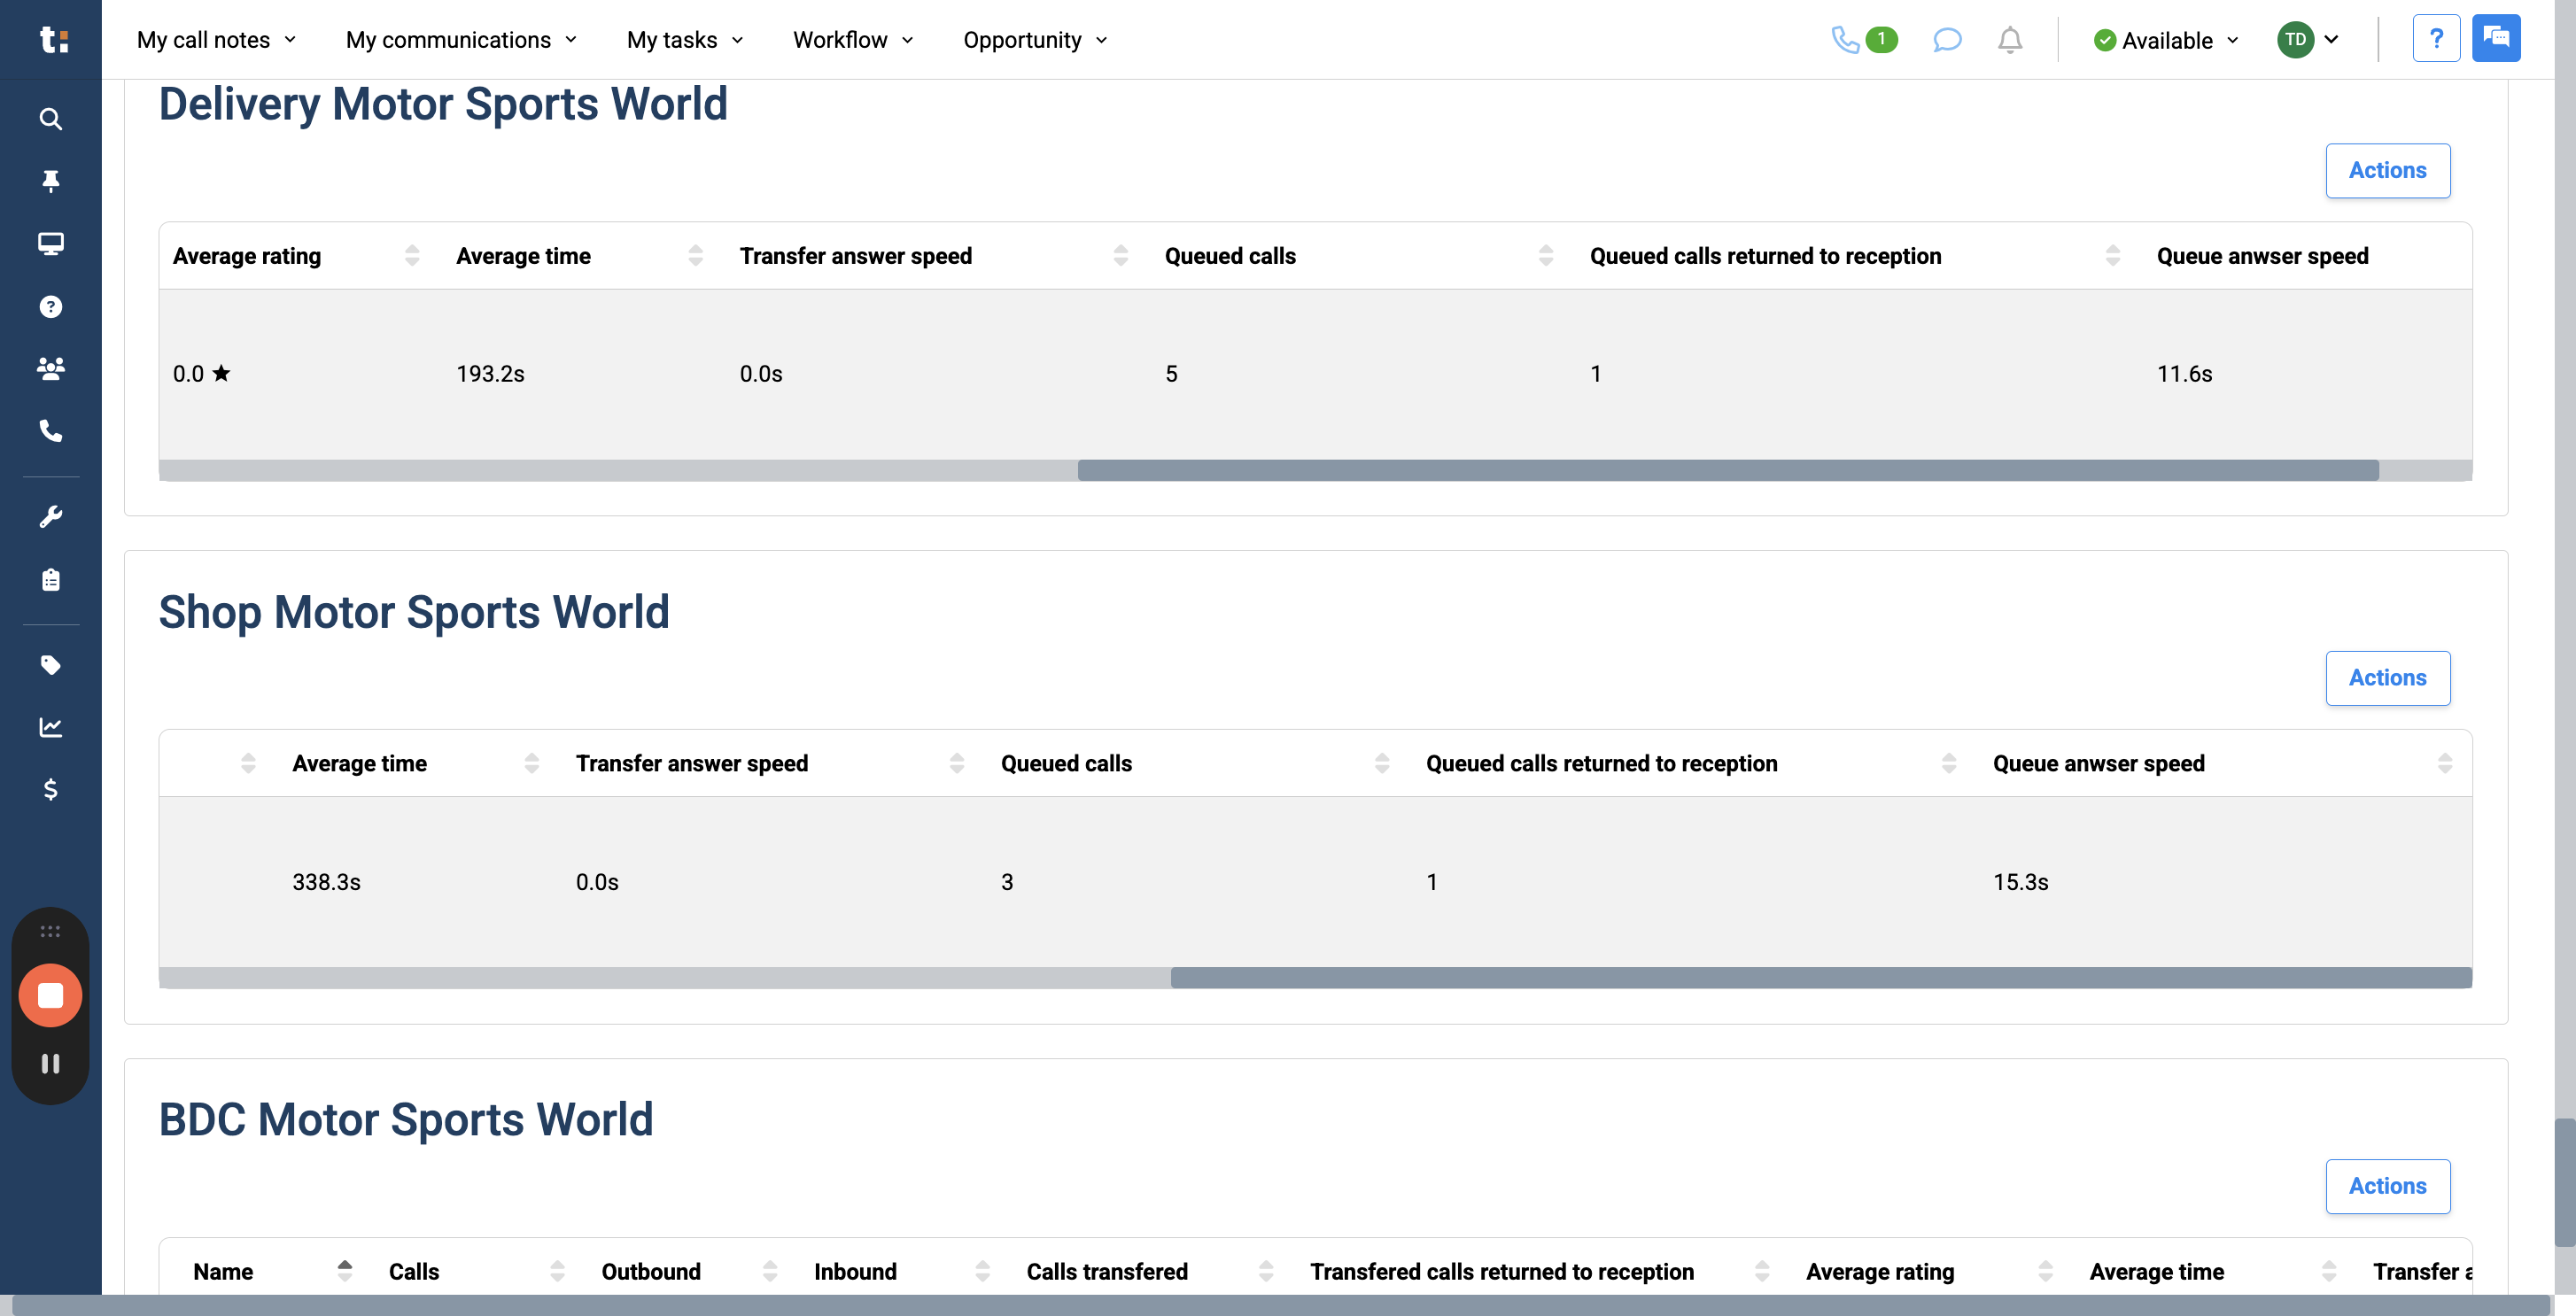
31
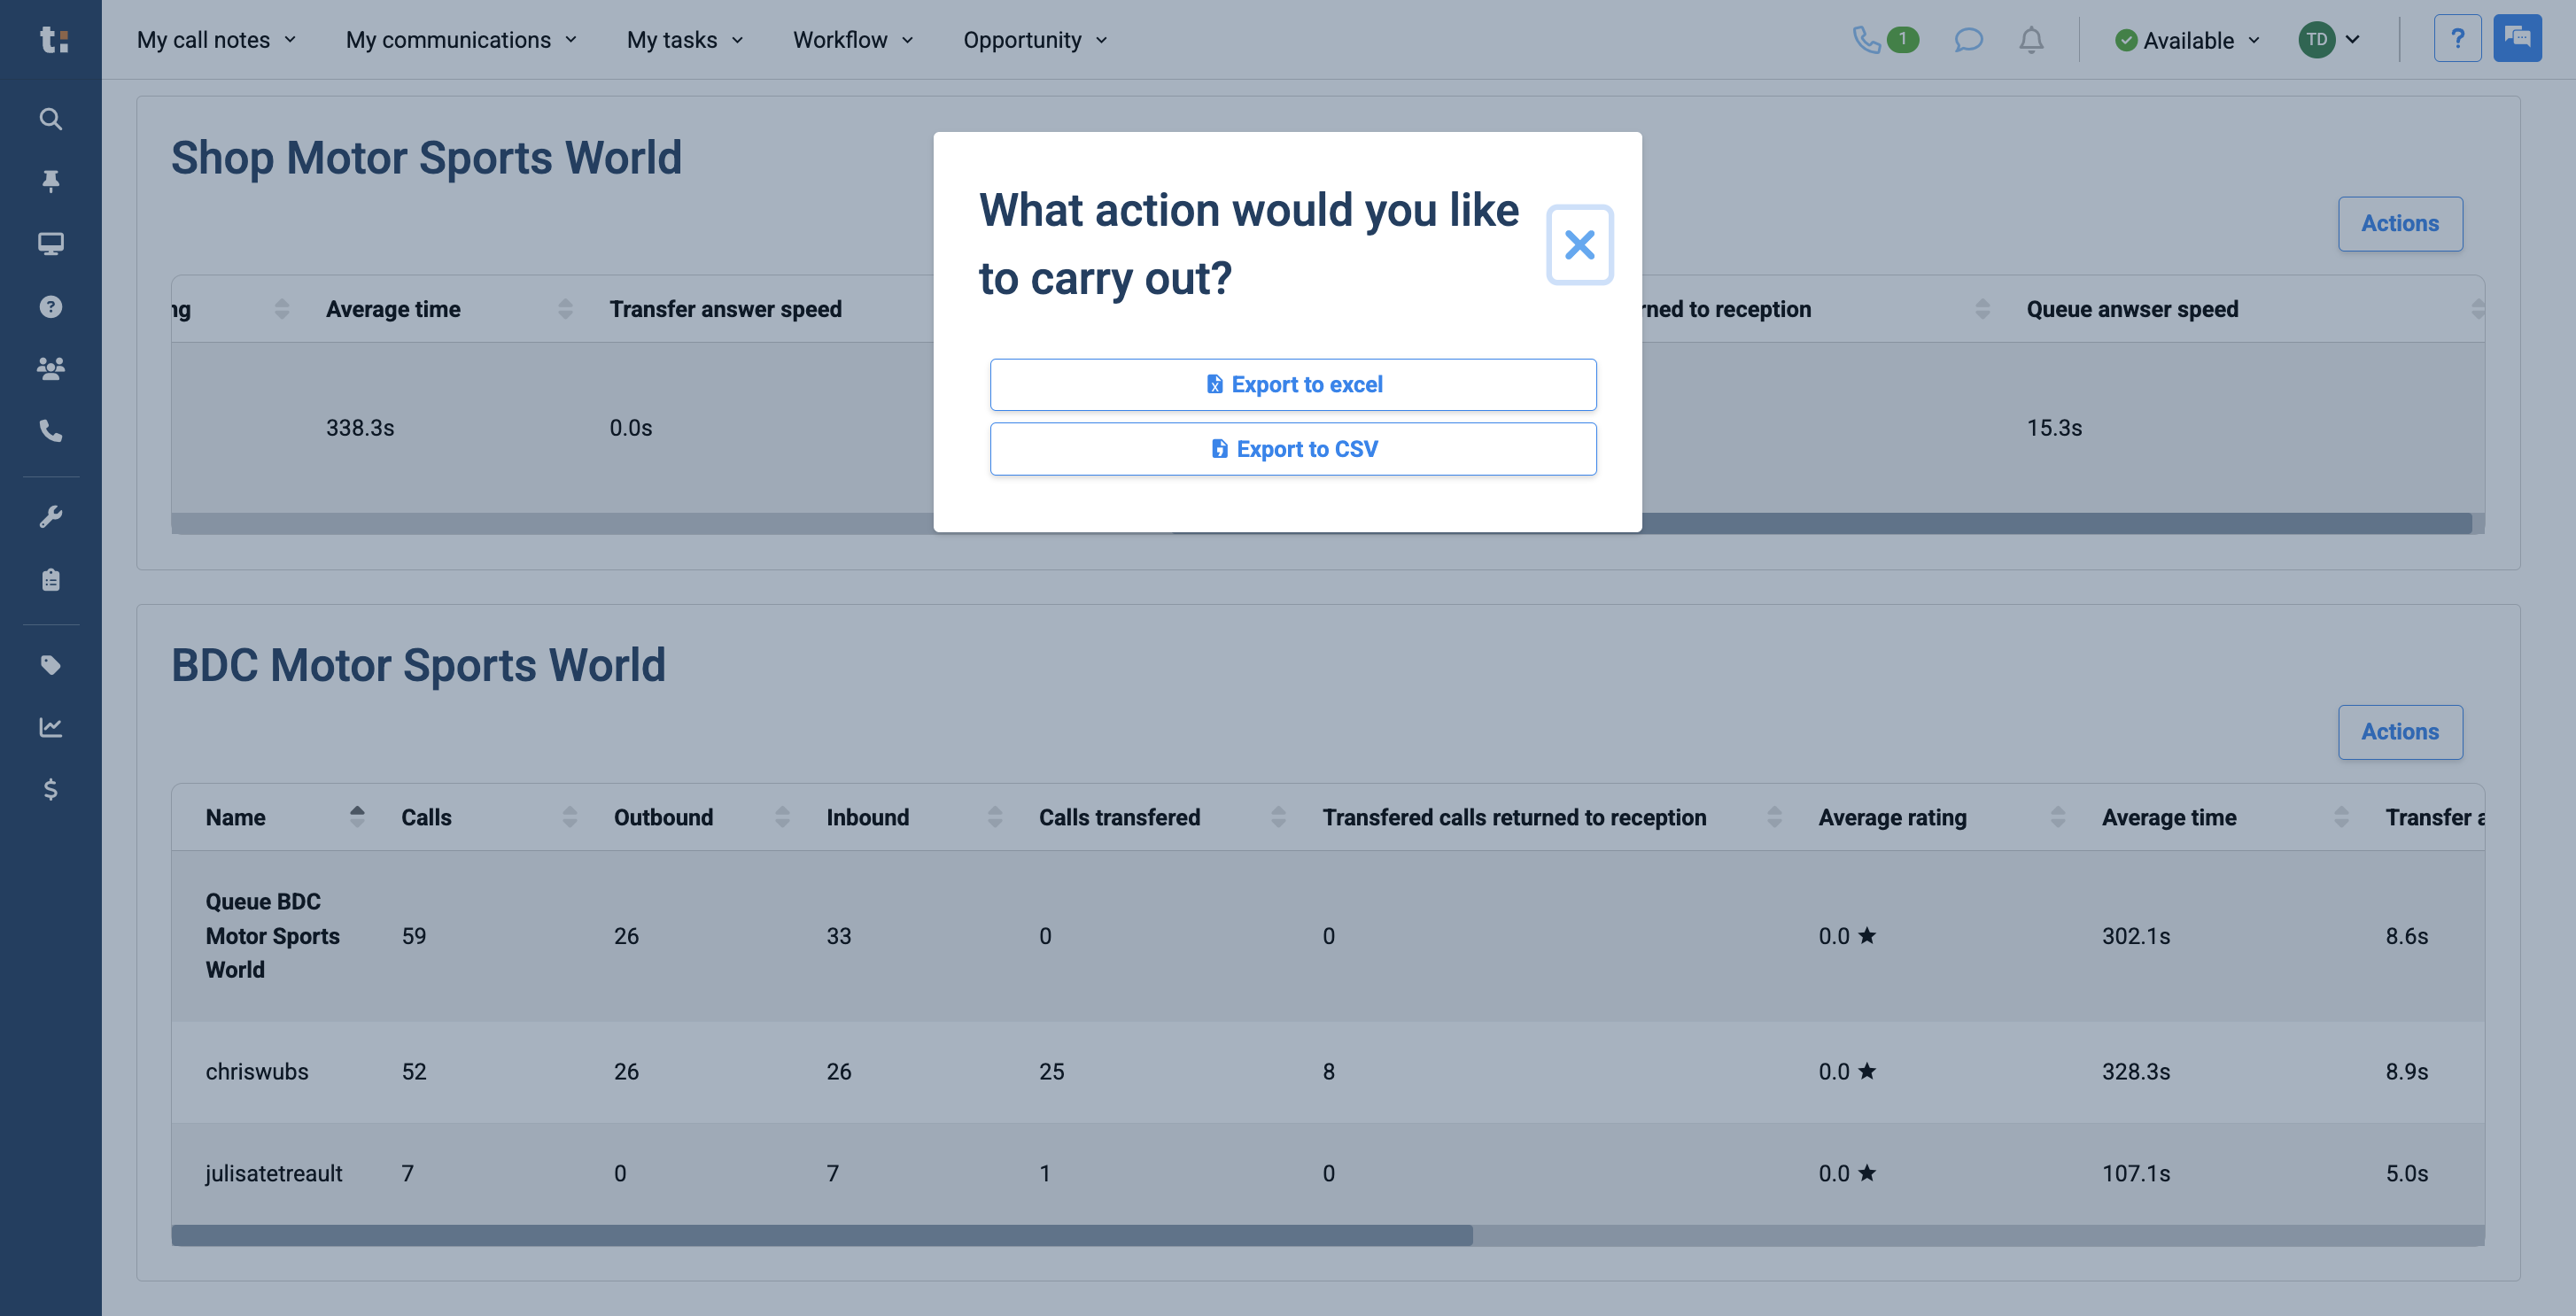
If you wish, you can use the Actions button to export this information to an Excel spreadsheet or a CSV file.
32
choose export
If you still have questions after consulting this article, please feel free to contact our support team at: support@tractiondk.zohodesk.com