How to Review Data Processing and Dependencies for a Table
Learn how to review data processing, trace table creation, and identify data dependencies using the NY BDP Buildings table as an example. This guide covers inspecting table details, viewing code, and using lineage graphs for data flow visualization.
By Robin Neri
In this guide, we'll learn how to explore the data processing steps for a specific table using the documentation site. We will use the NY BDP Buildings table as an example to see its description, columns, and dependencies.
We will also look at how to trace the origins of the table, view the code used to create it, and use visual tools to understand the flow of data between related tables.
Let's get started
1
Go to dbt Docs
2
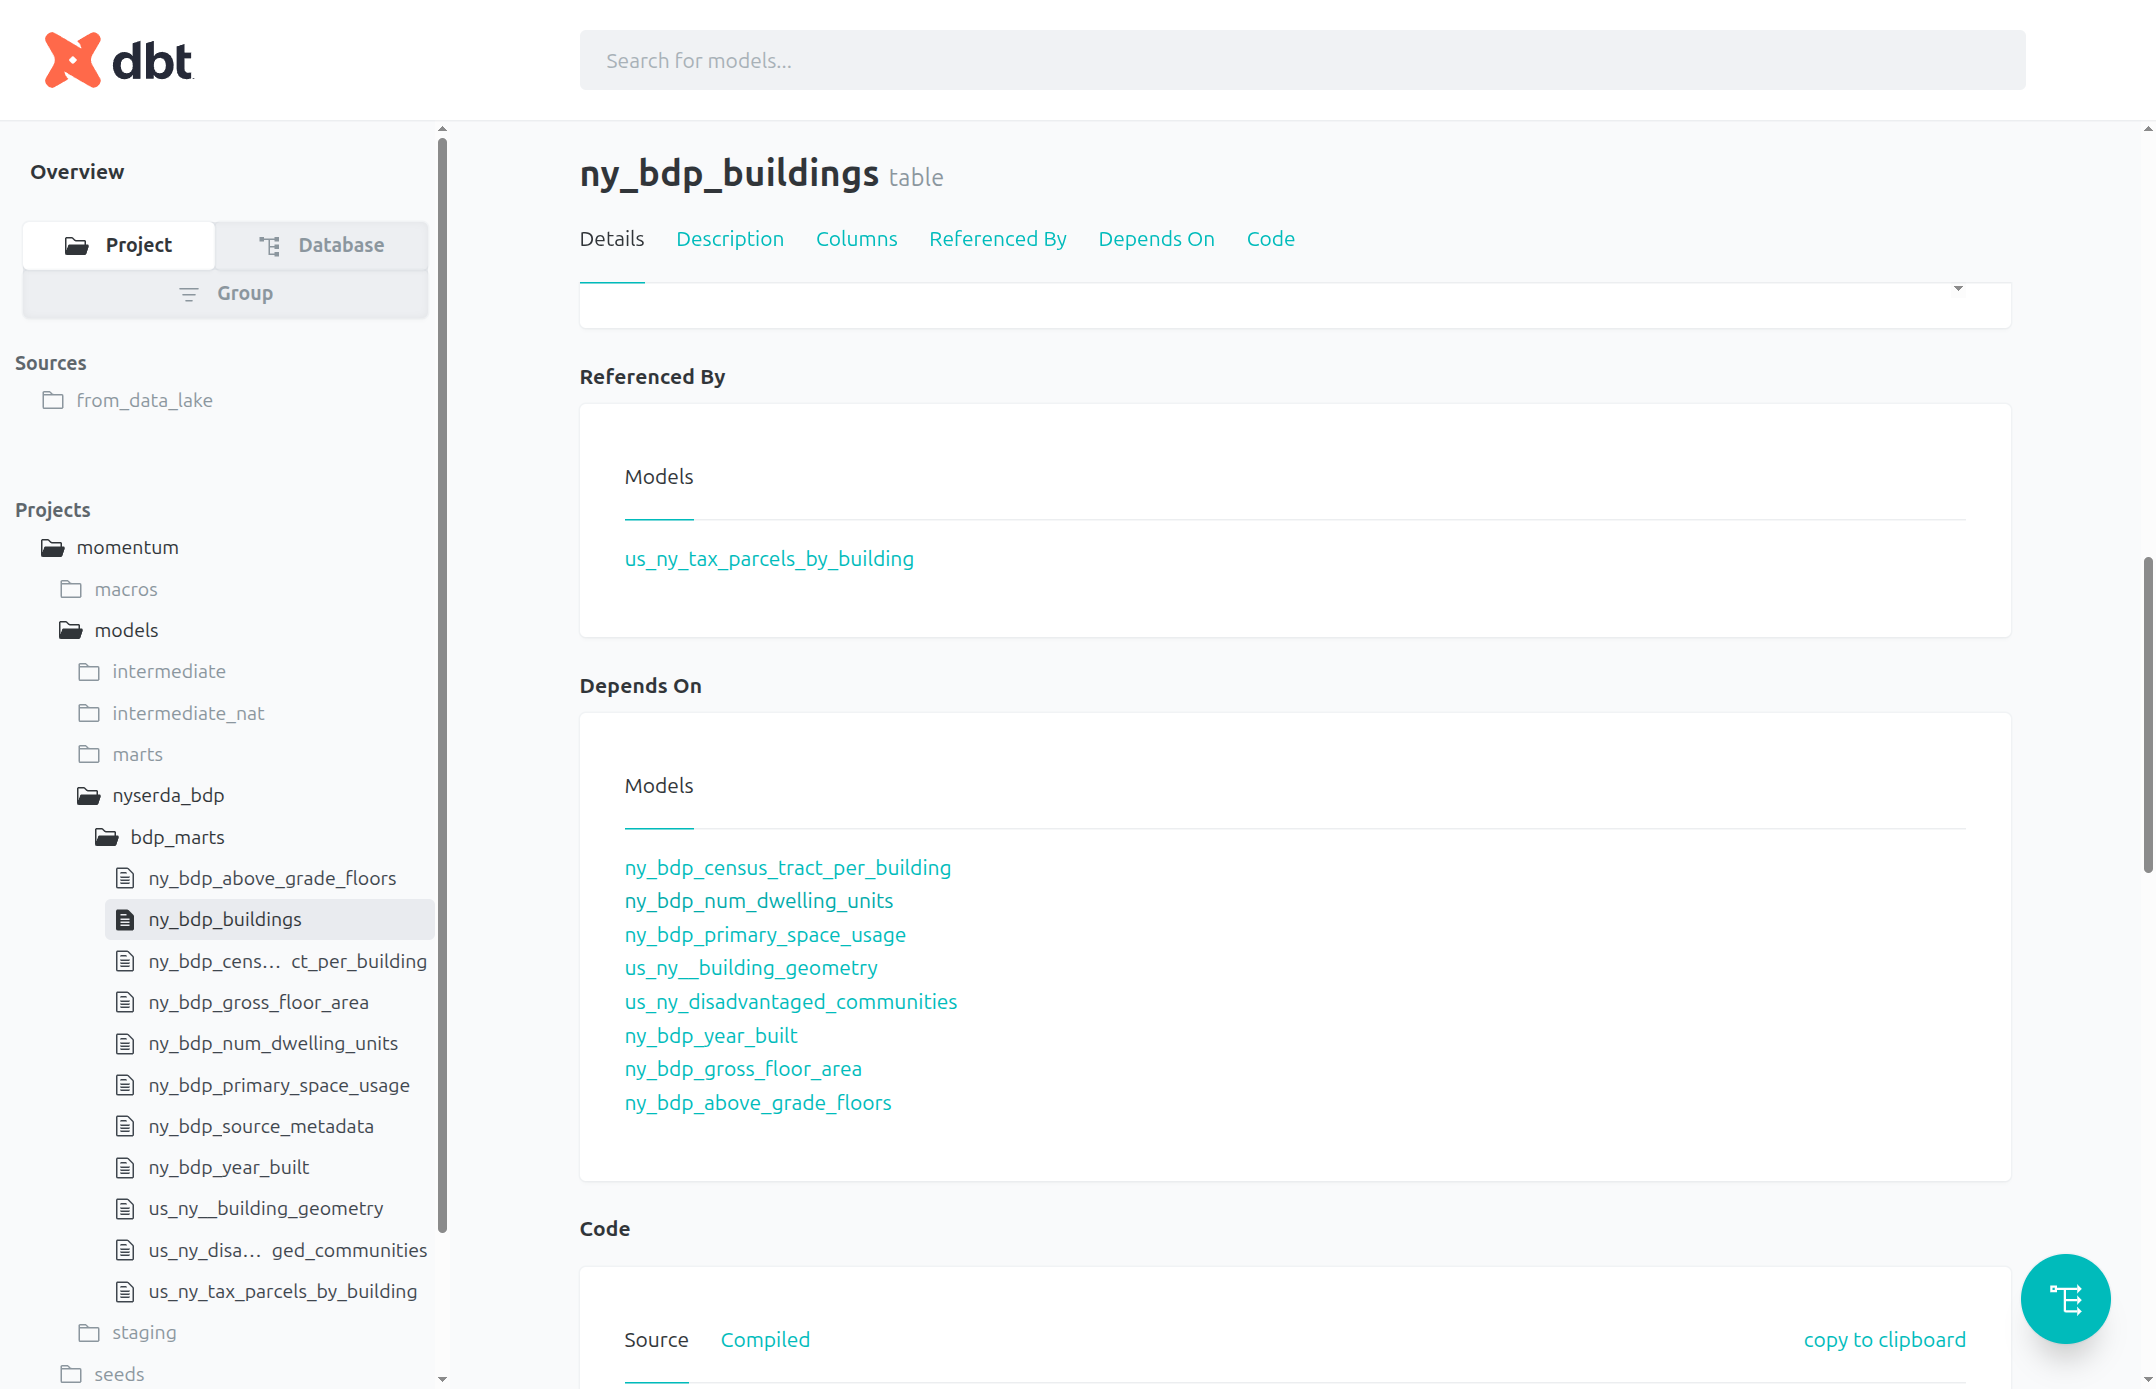
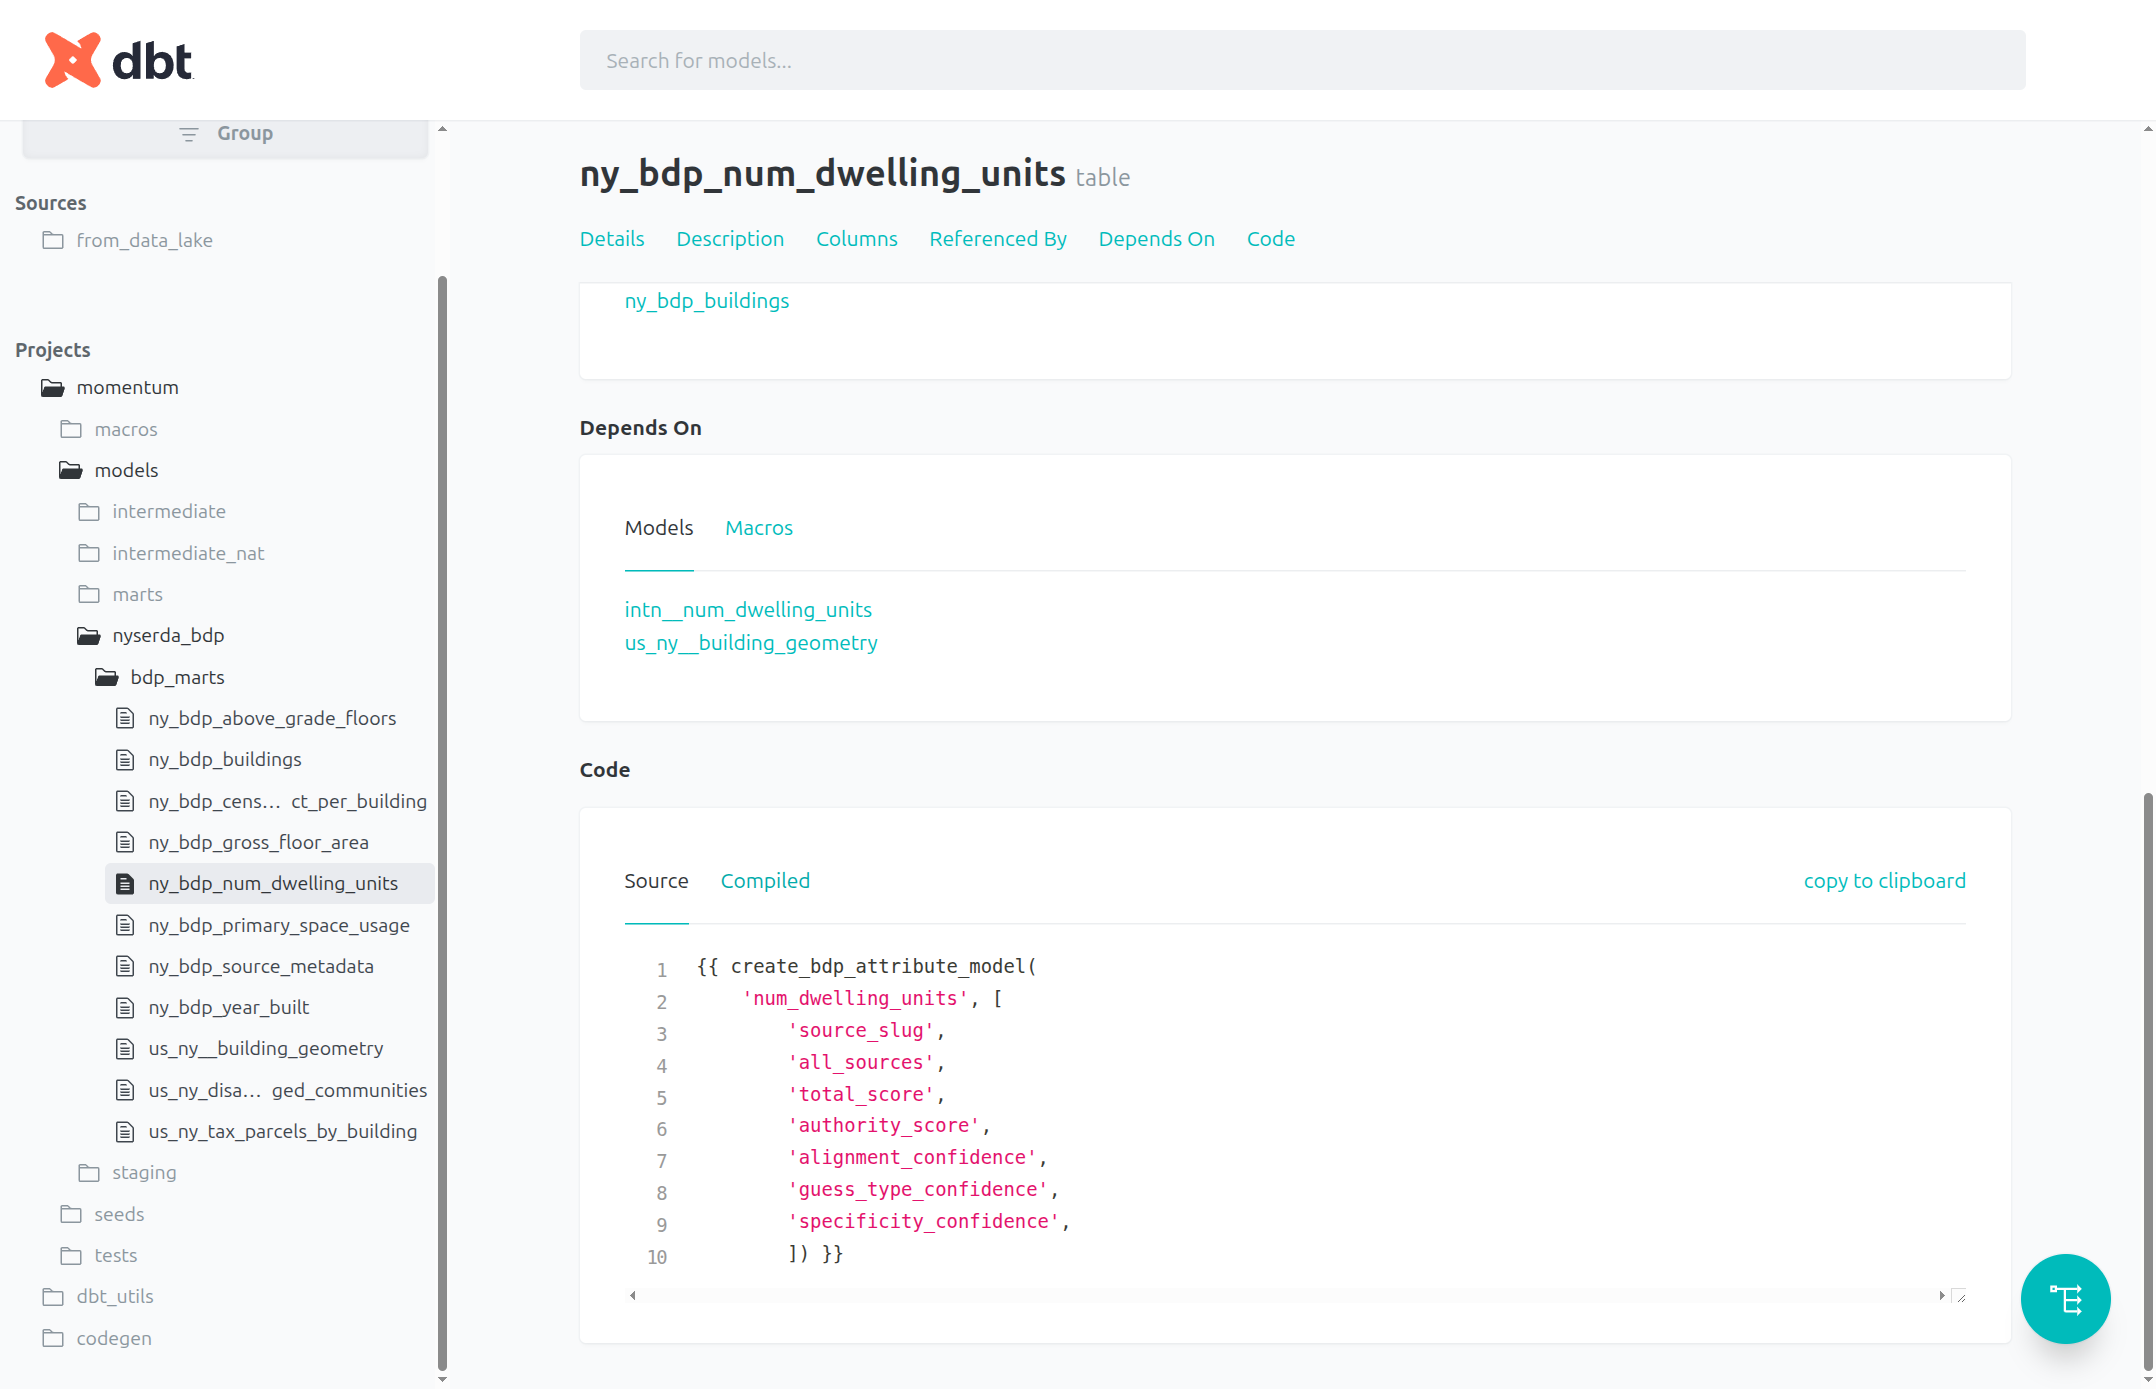
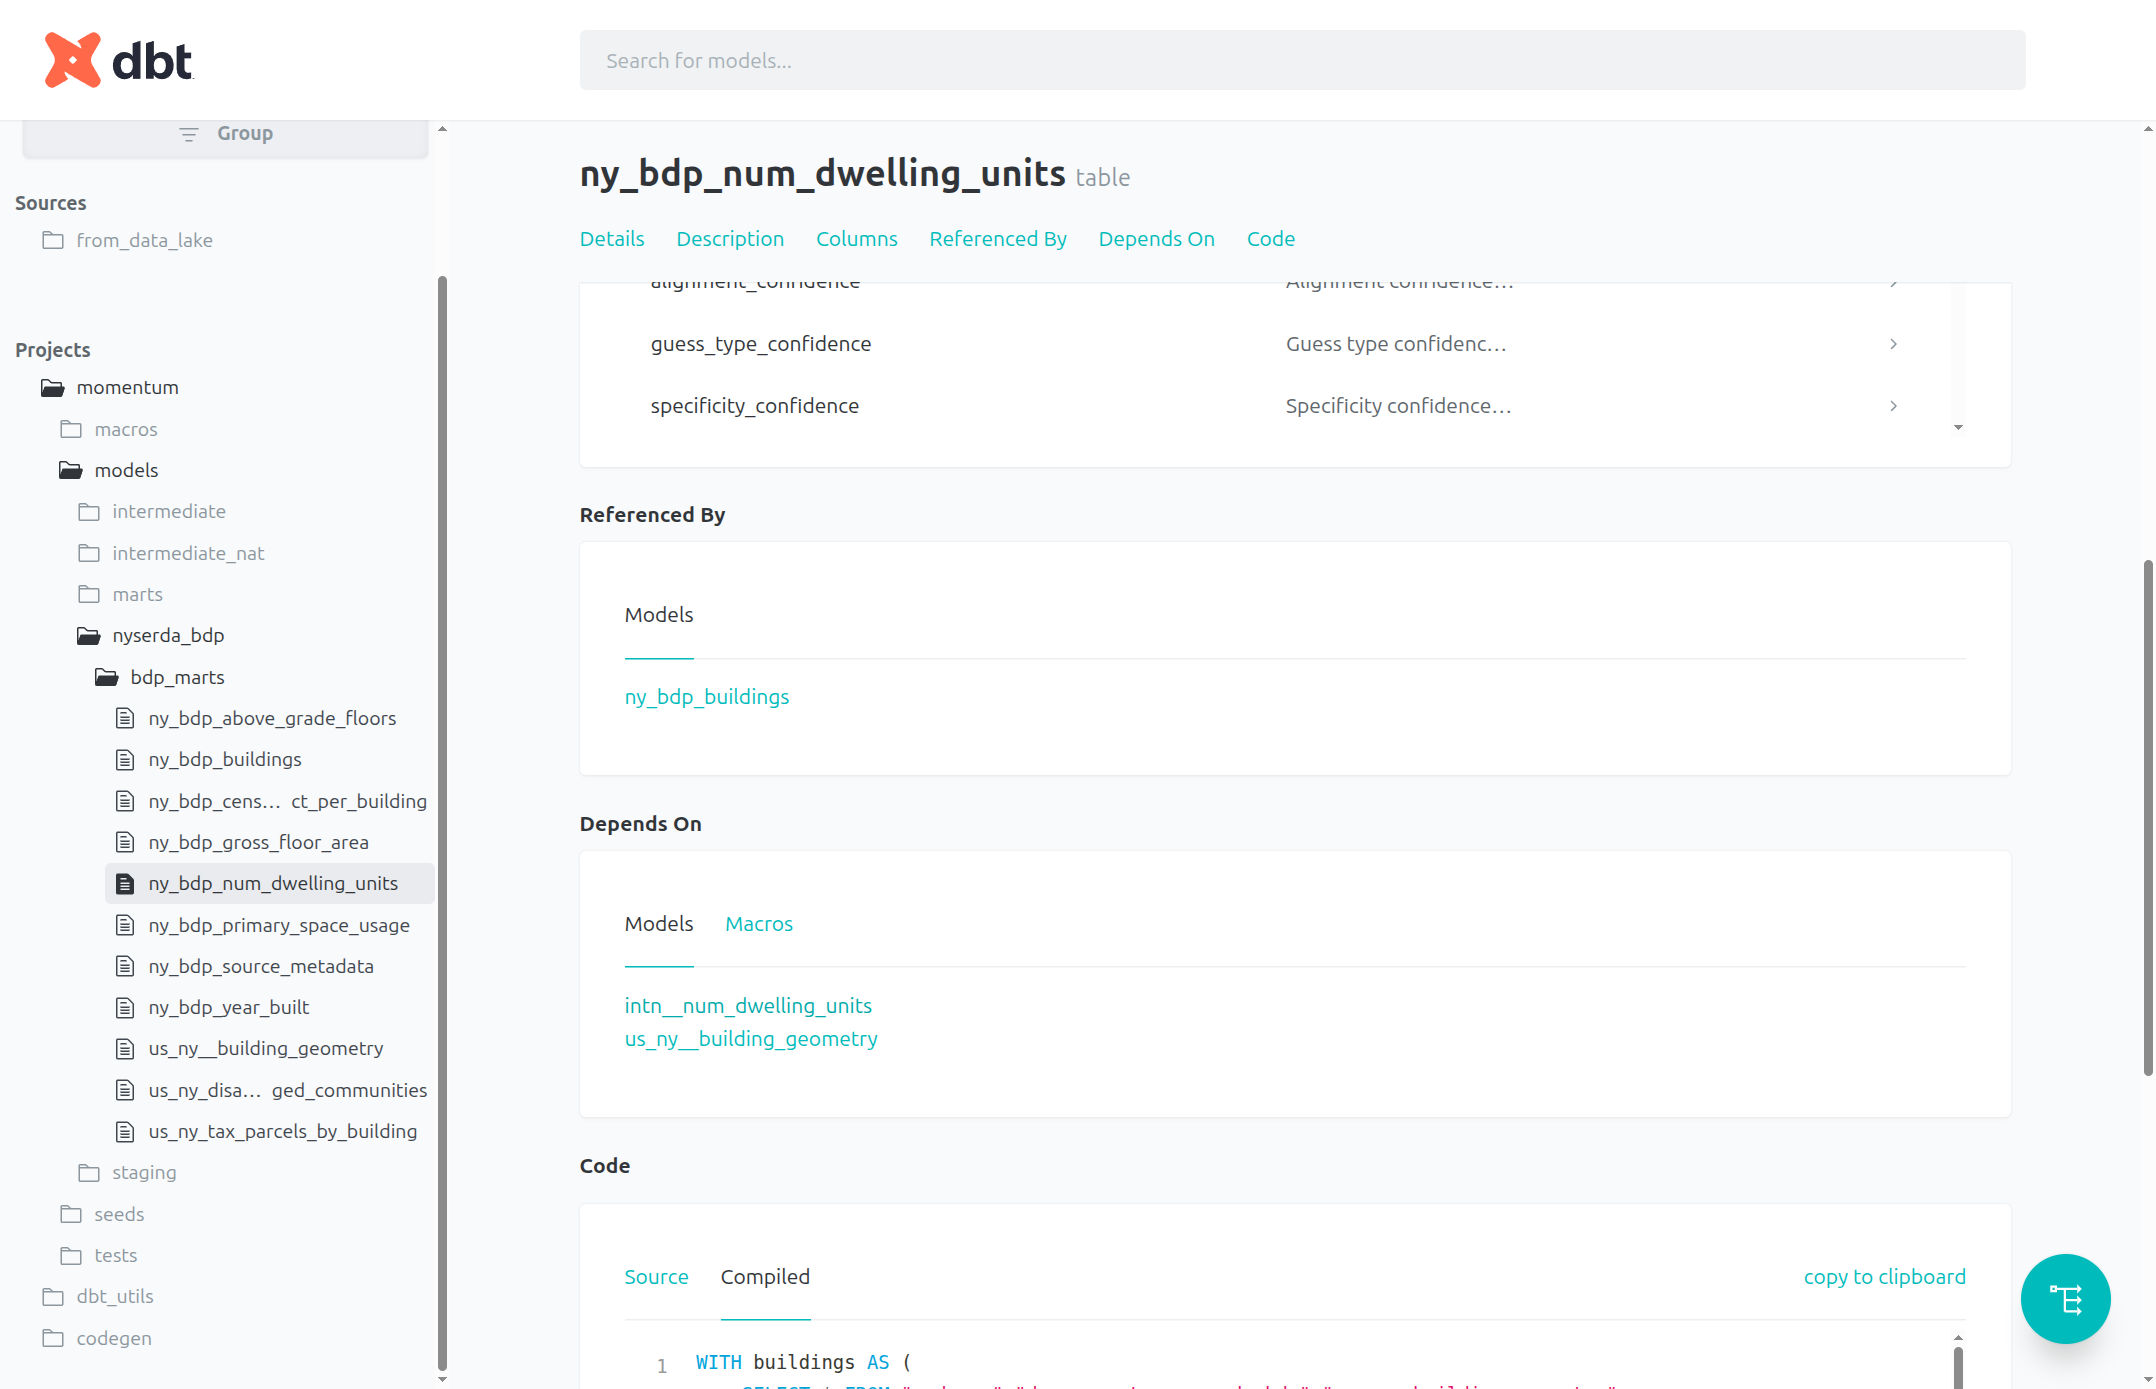
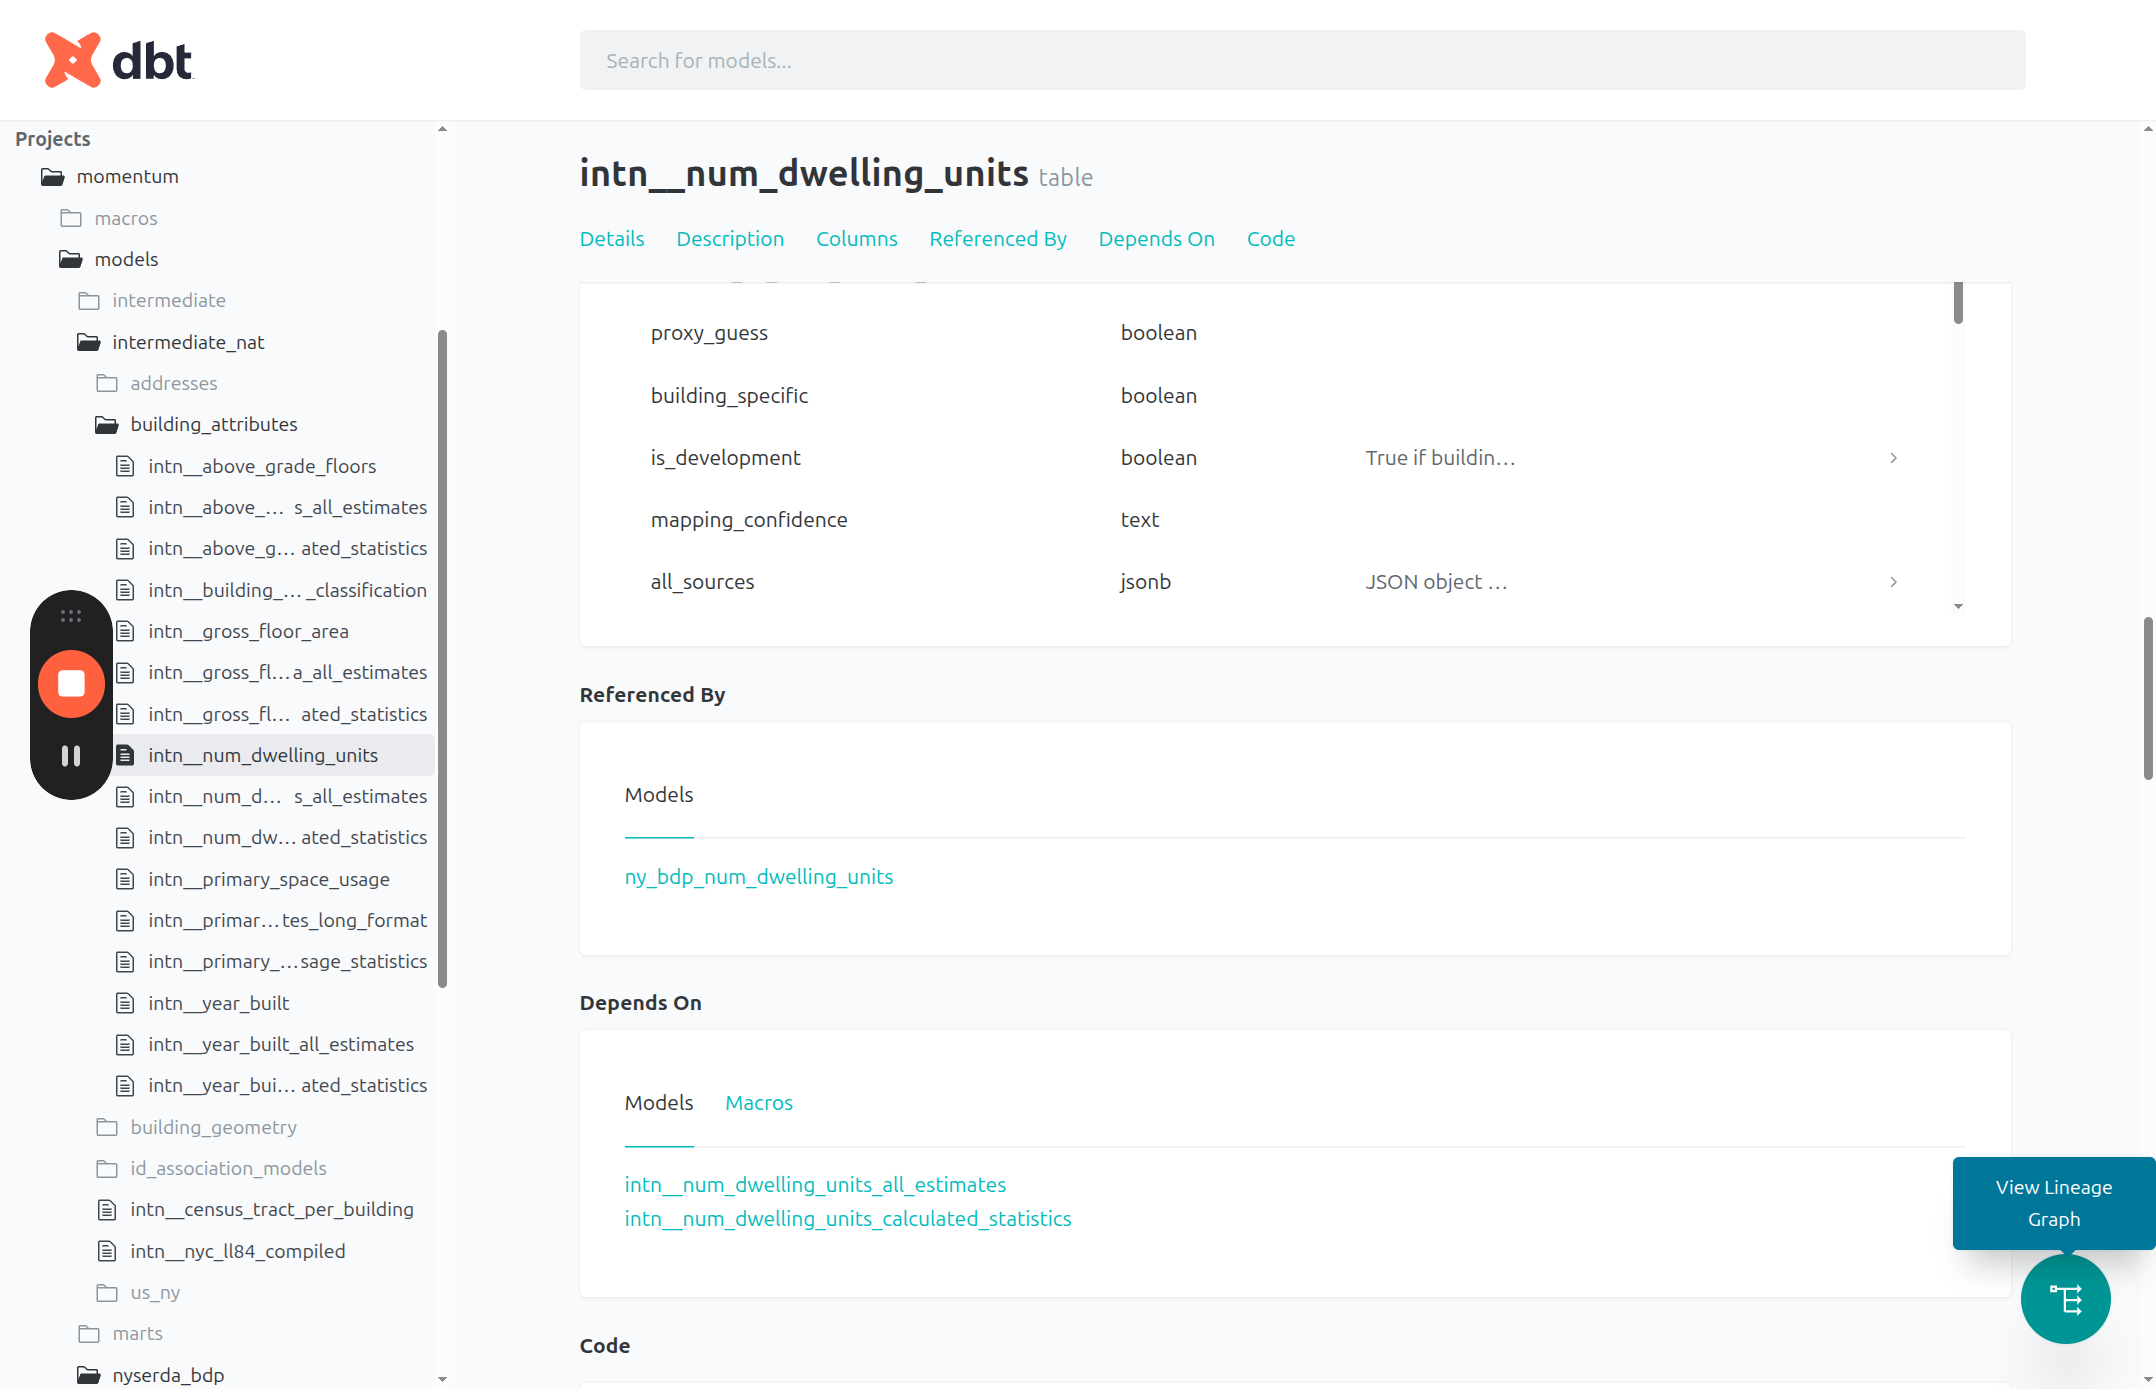
In the ny_bdp_buildings table page, we can view the models (tables) that this table depends on. Each one is a link we can follow to view details about that table. Select ny_bdp_num_dwelling_units as an example:
3
We can also scroll down on the table's page to see the source code used to create the table, either in a compact form ("Source") or as an actual SQL statement ("Compiled")
4
We can follow the models down as far back as they go. To move forward, view the Referenced By section of the table's page.
5
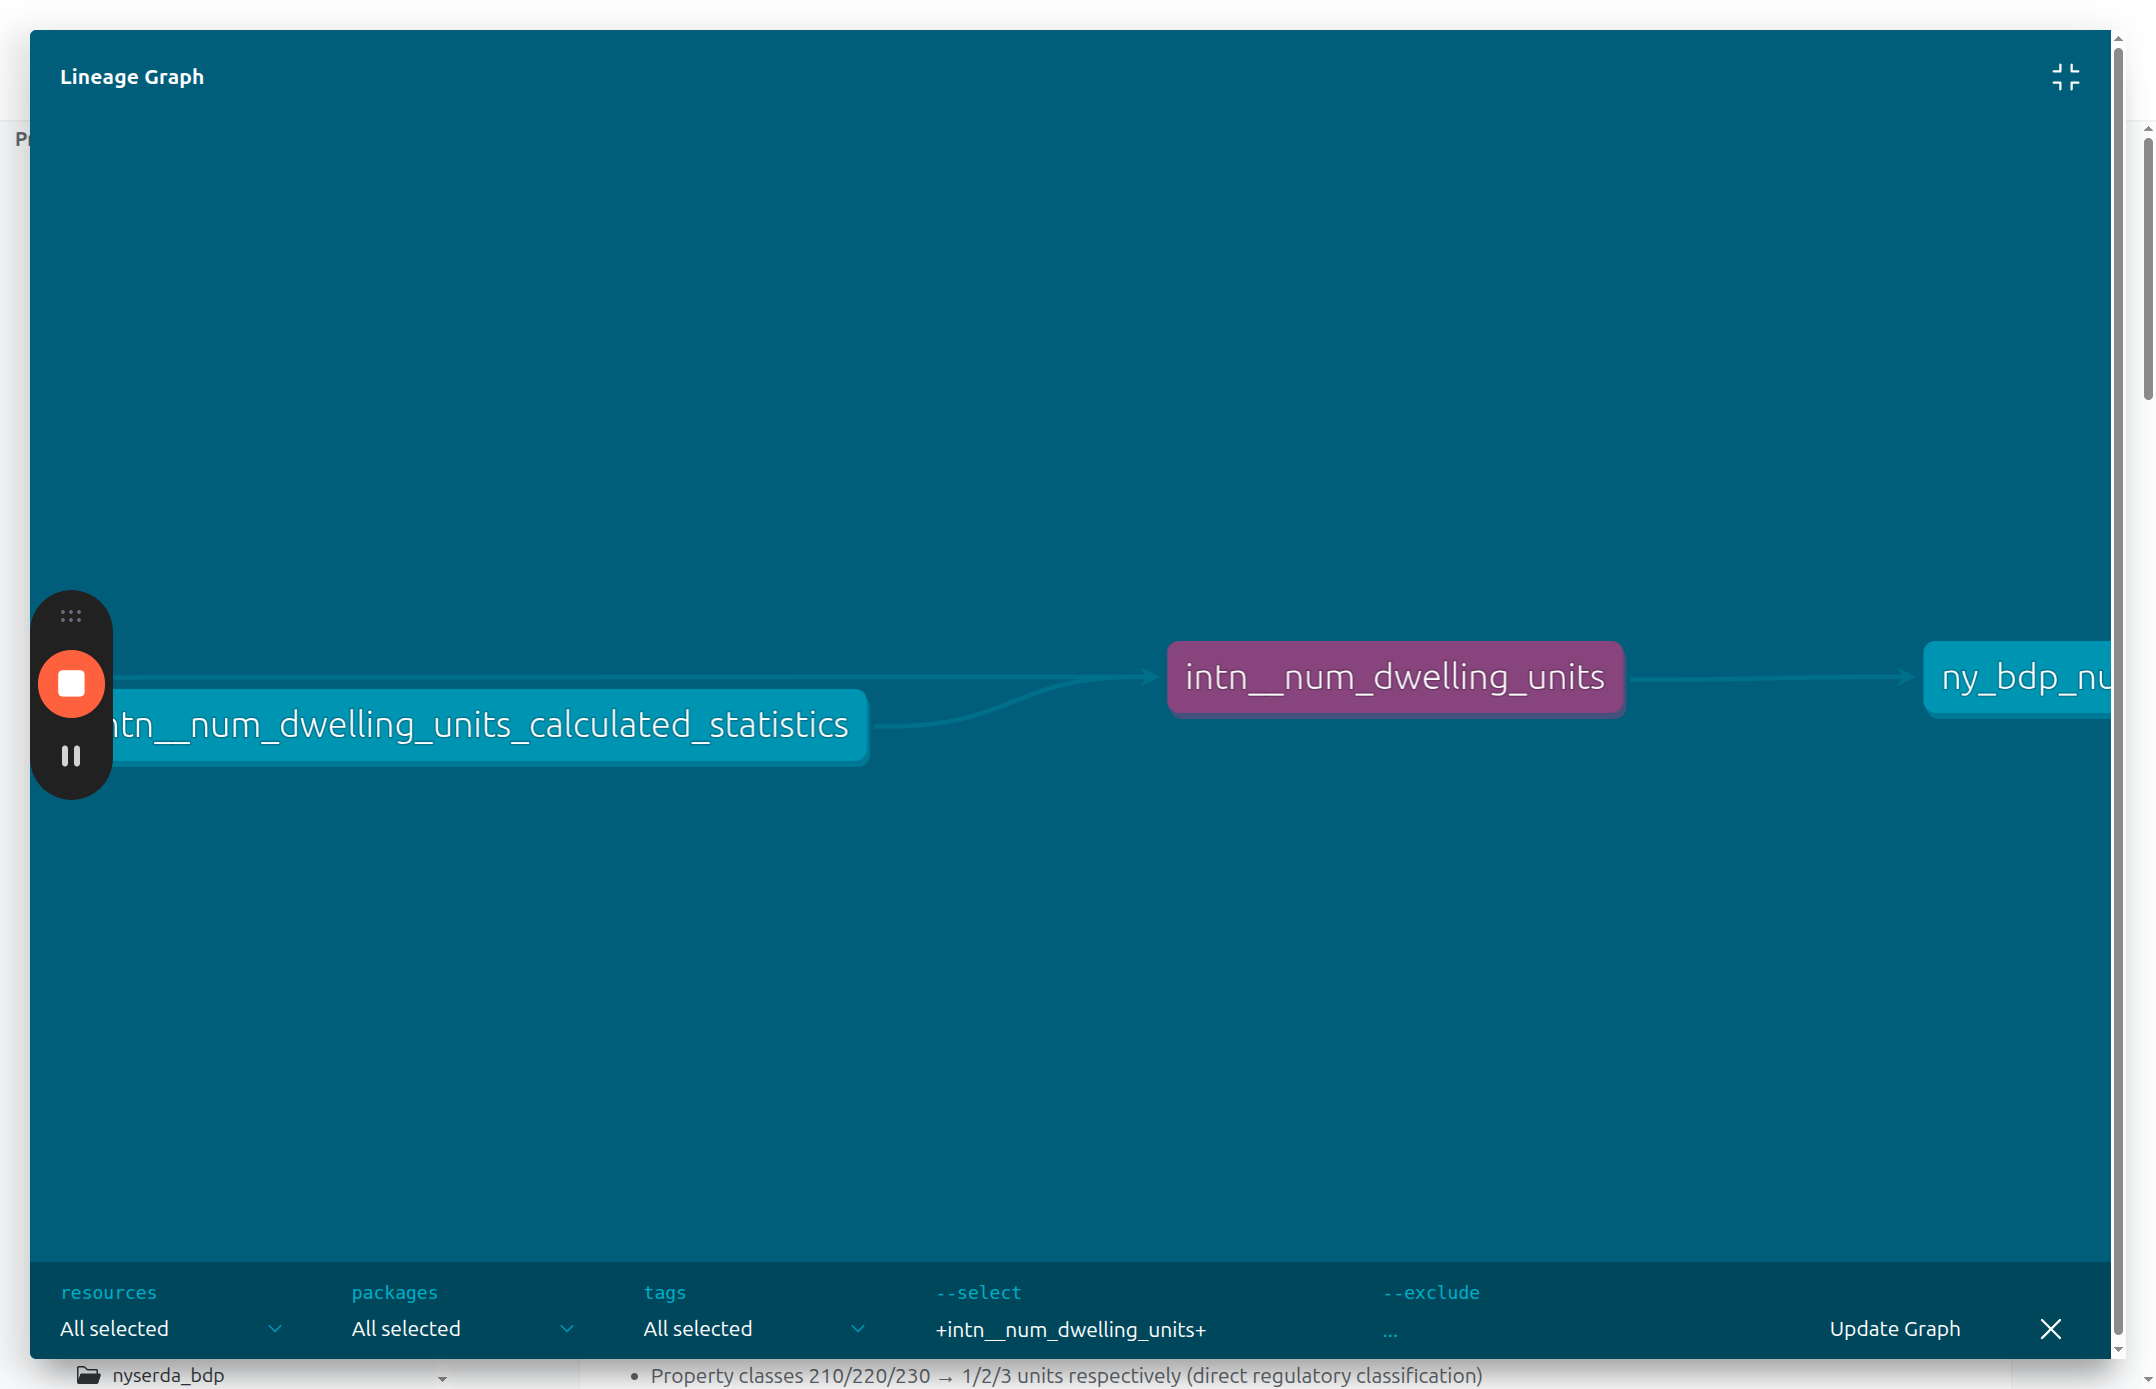
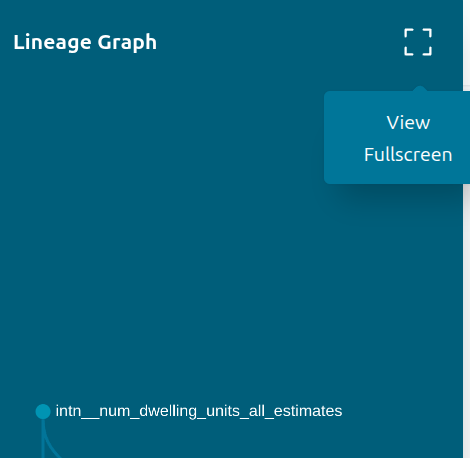
The bottom right has a button to "View Lineage Graph", which allows you to view the data flow for that model visually as a kind of flow chart.
6
It brings up a window showing the immediate surroundings of the table in the data processing pipeline. In the upper right of that window is an option to view fullscreen
7
The fullscreen view shows you the entire pipeline associated with that model, back to the raw data sources. The selected model is in a different color.
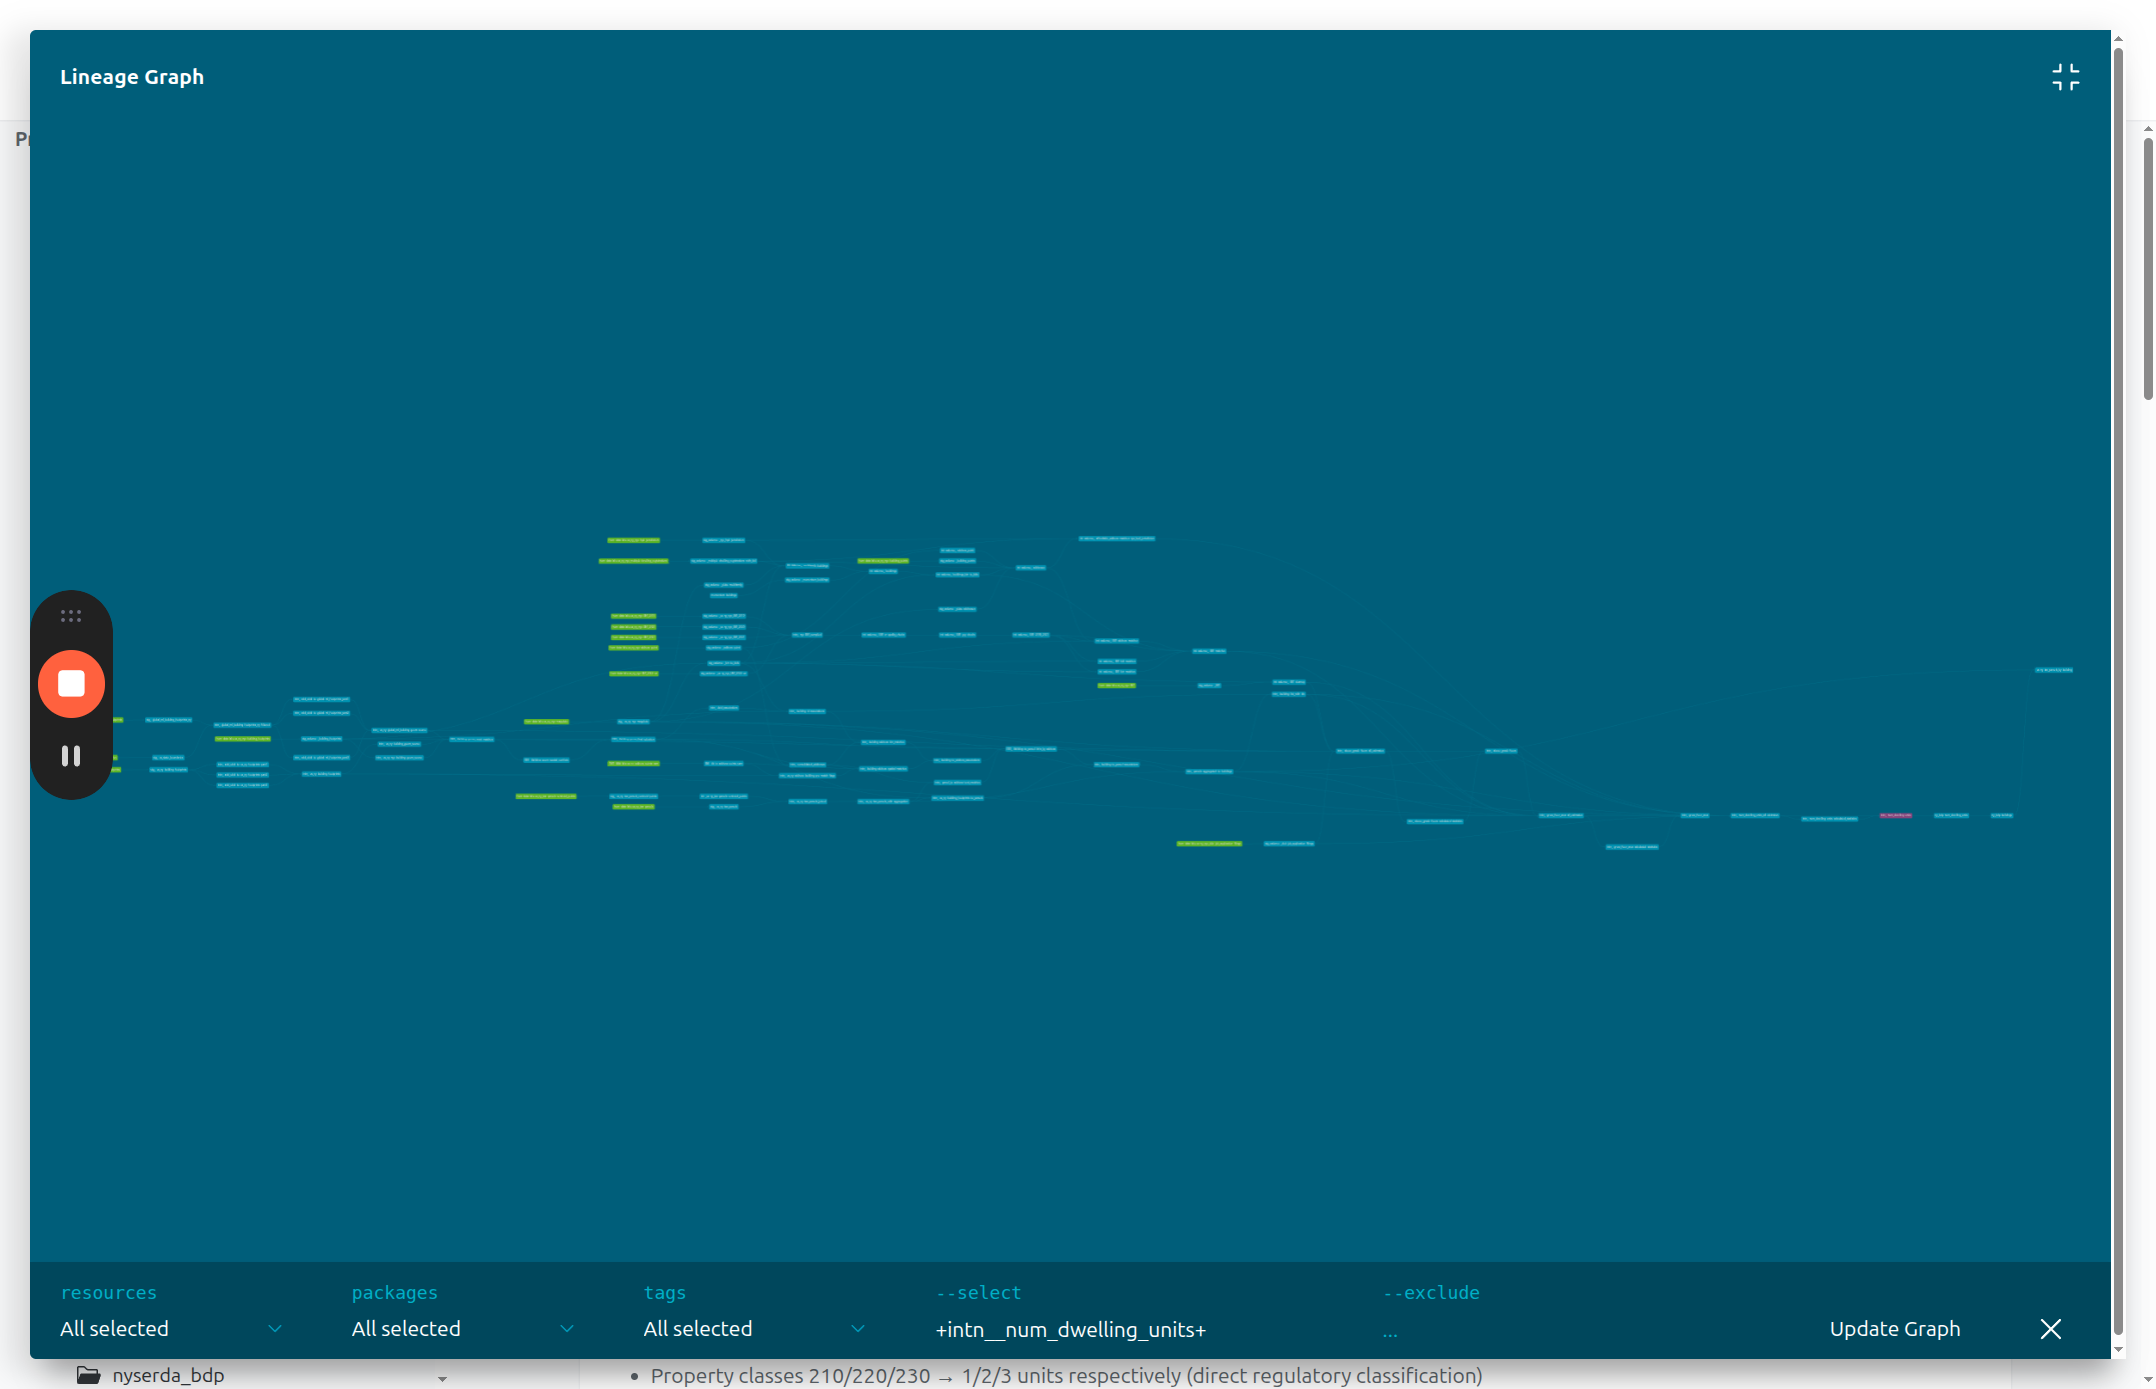
8
You can pan and zoom across the page