How to Summarize a Table by Columns: Step-by-Step Guide
Learn how to summarize a data table by various columns, including grouping by attributes like "DAC Designation" and "Year Built", and calculating metrics such as total gross floor area. Follow this step-by-step guide to create and save summary tables efficiently.
In this guide, we'll learn how to create a summary table from a dataset of building attributes. We will explore how to group data by different columns, such as designation status and year built, and calculate metrics like the sum of gross floor area. This process helps organize and analyze data to reveal patterns and totals based on selected attributes.
Let's get started
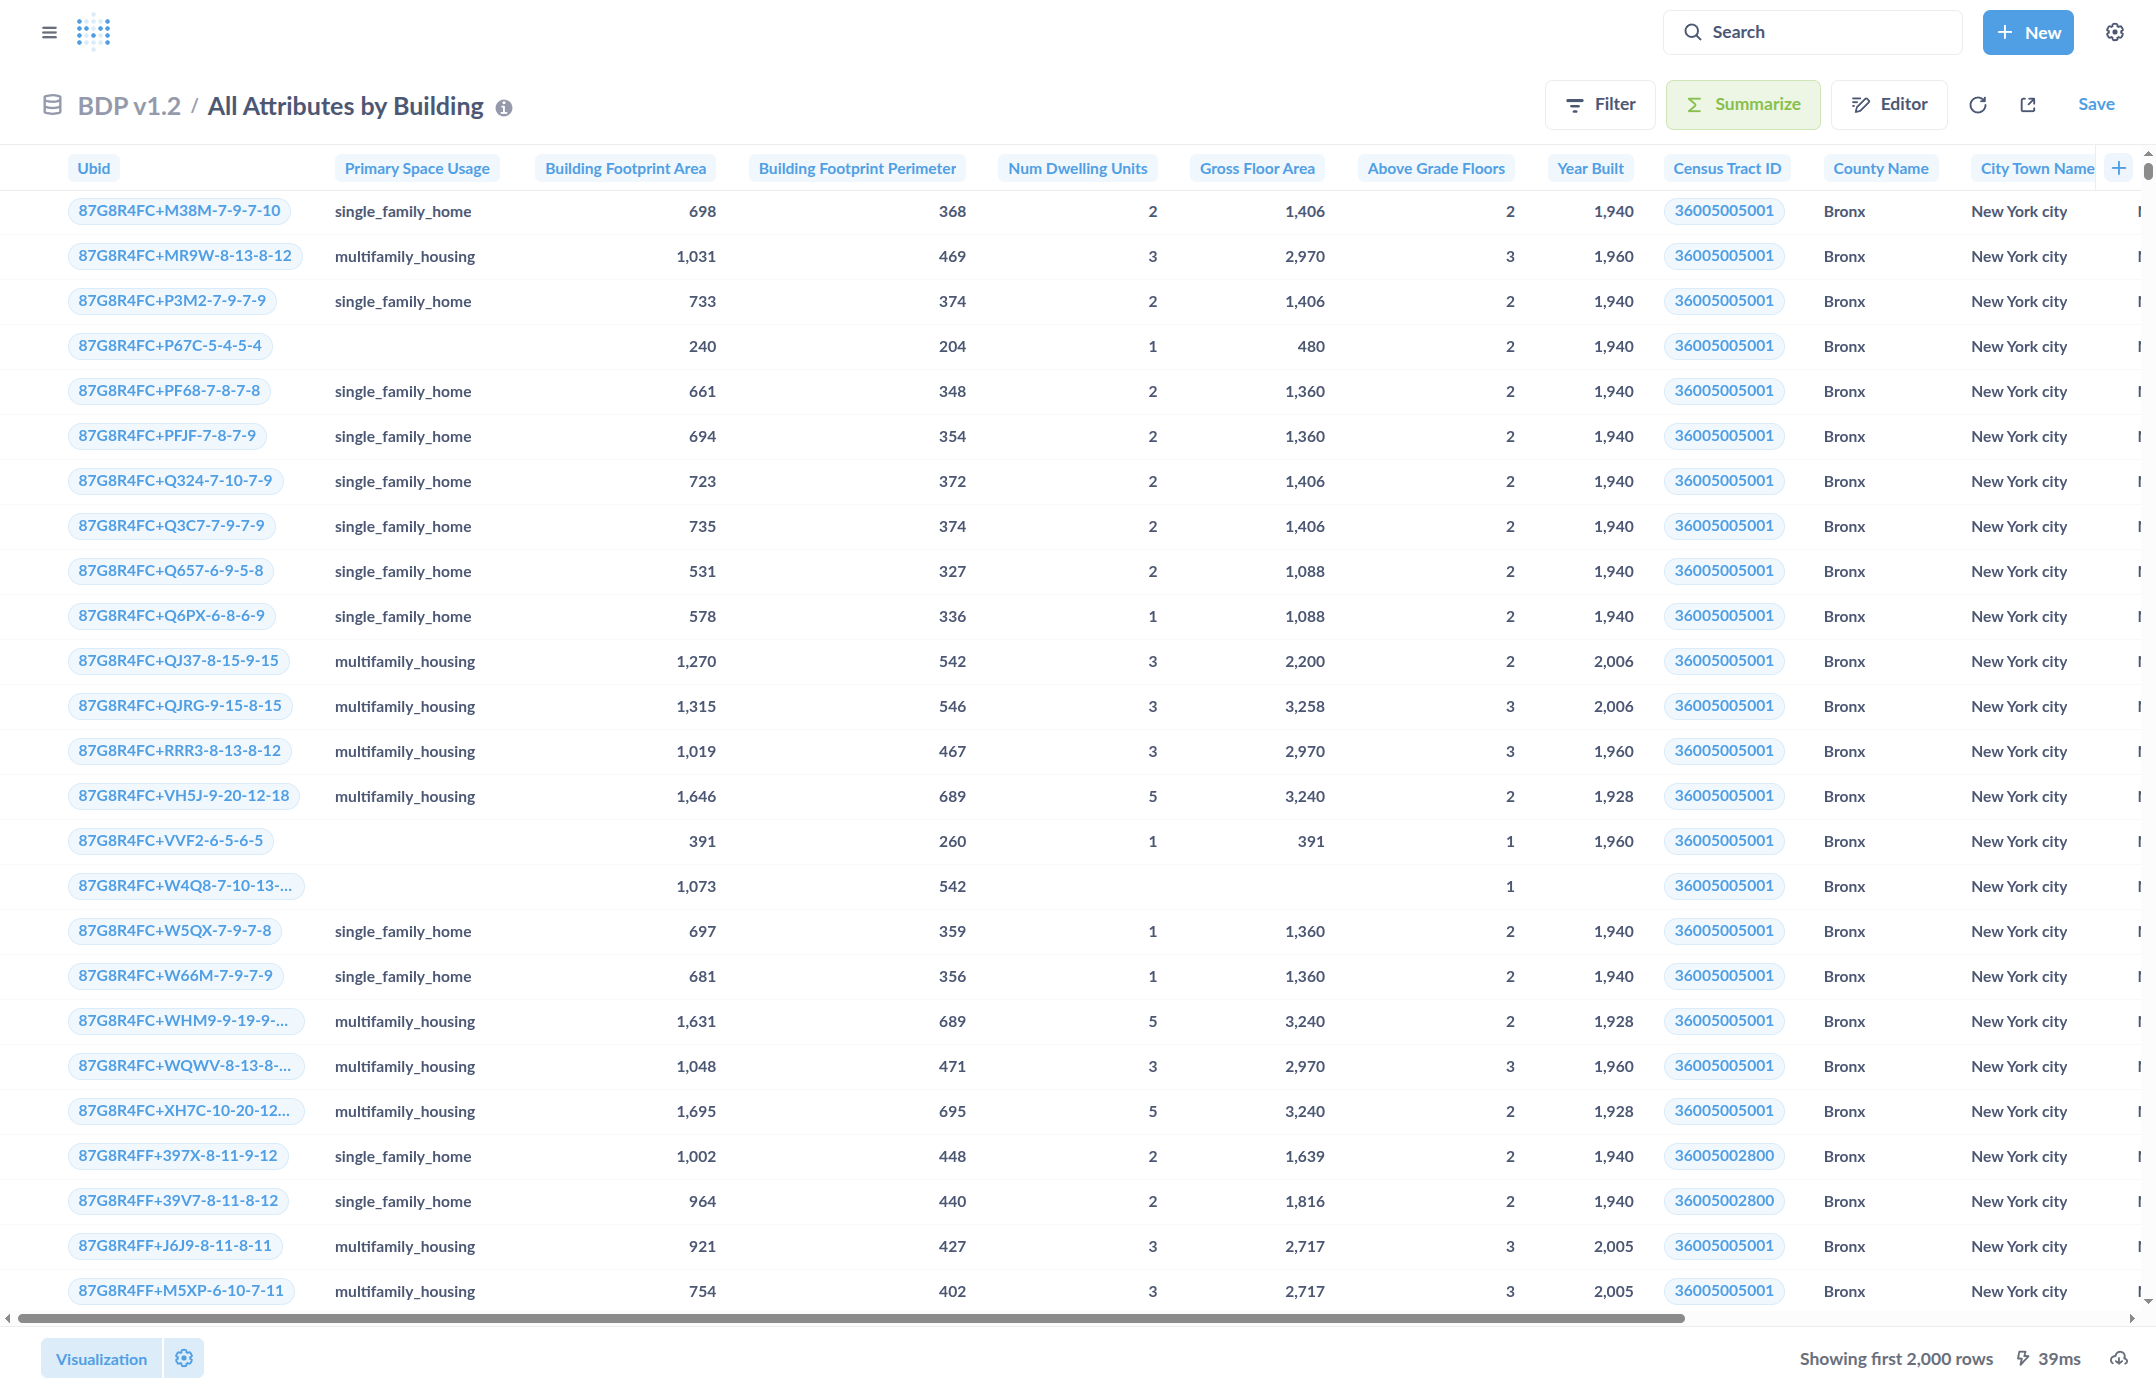
This is an overview of how to summarize a table by various columns. Here, we have a table of building attributes. We will summarize it using selected columns to create a summary table. When viewing a data table like this, you can click Summarize.
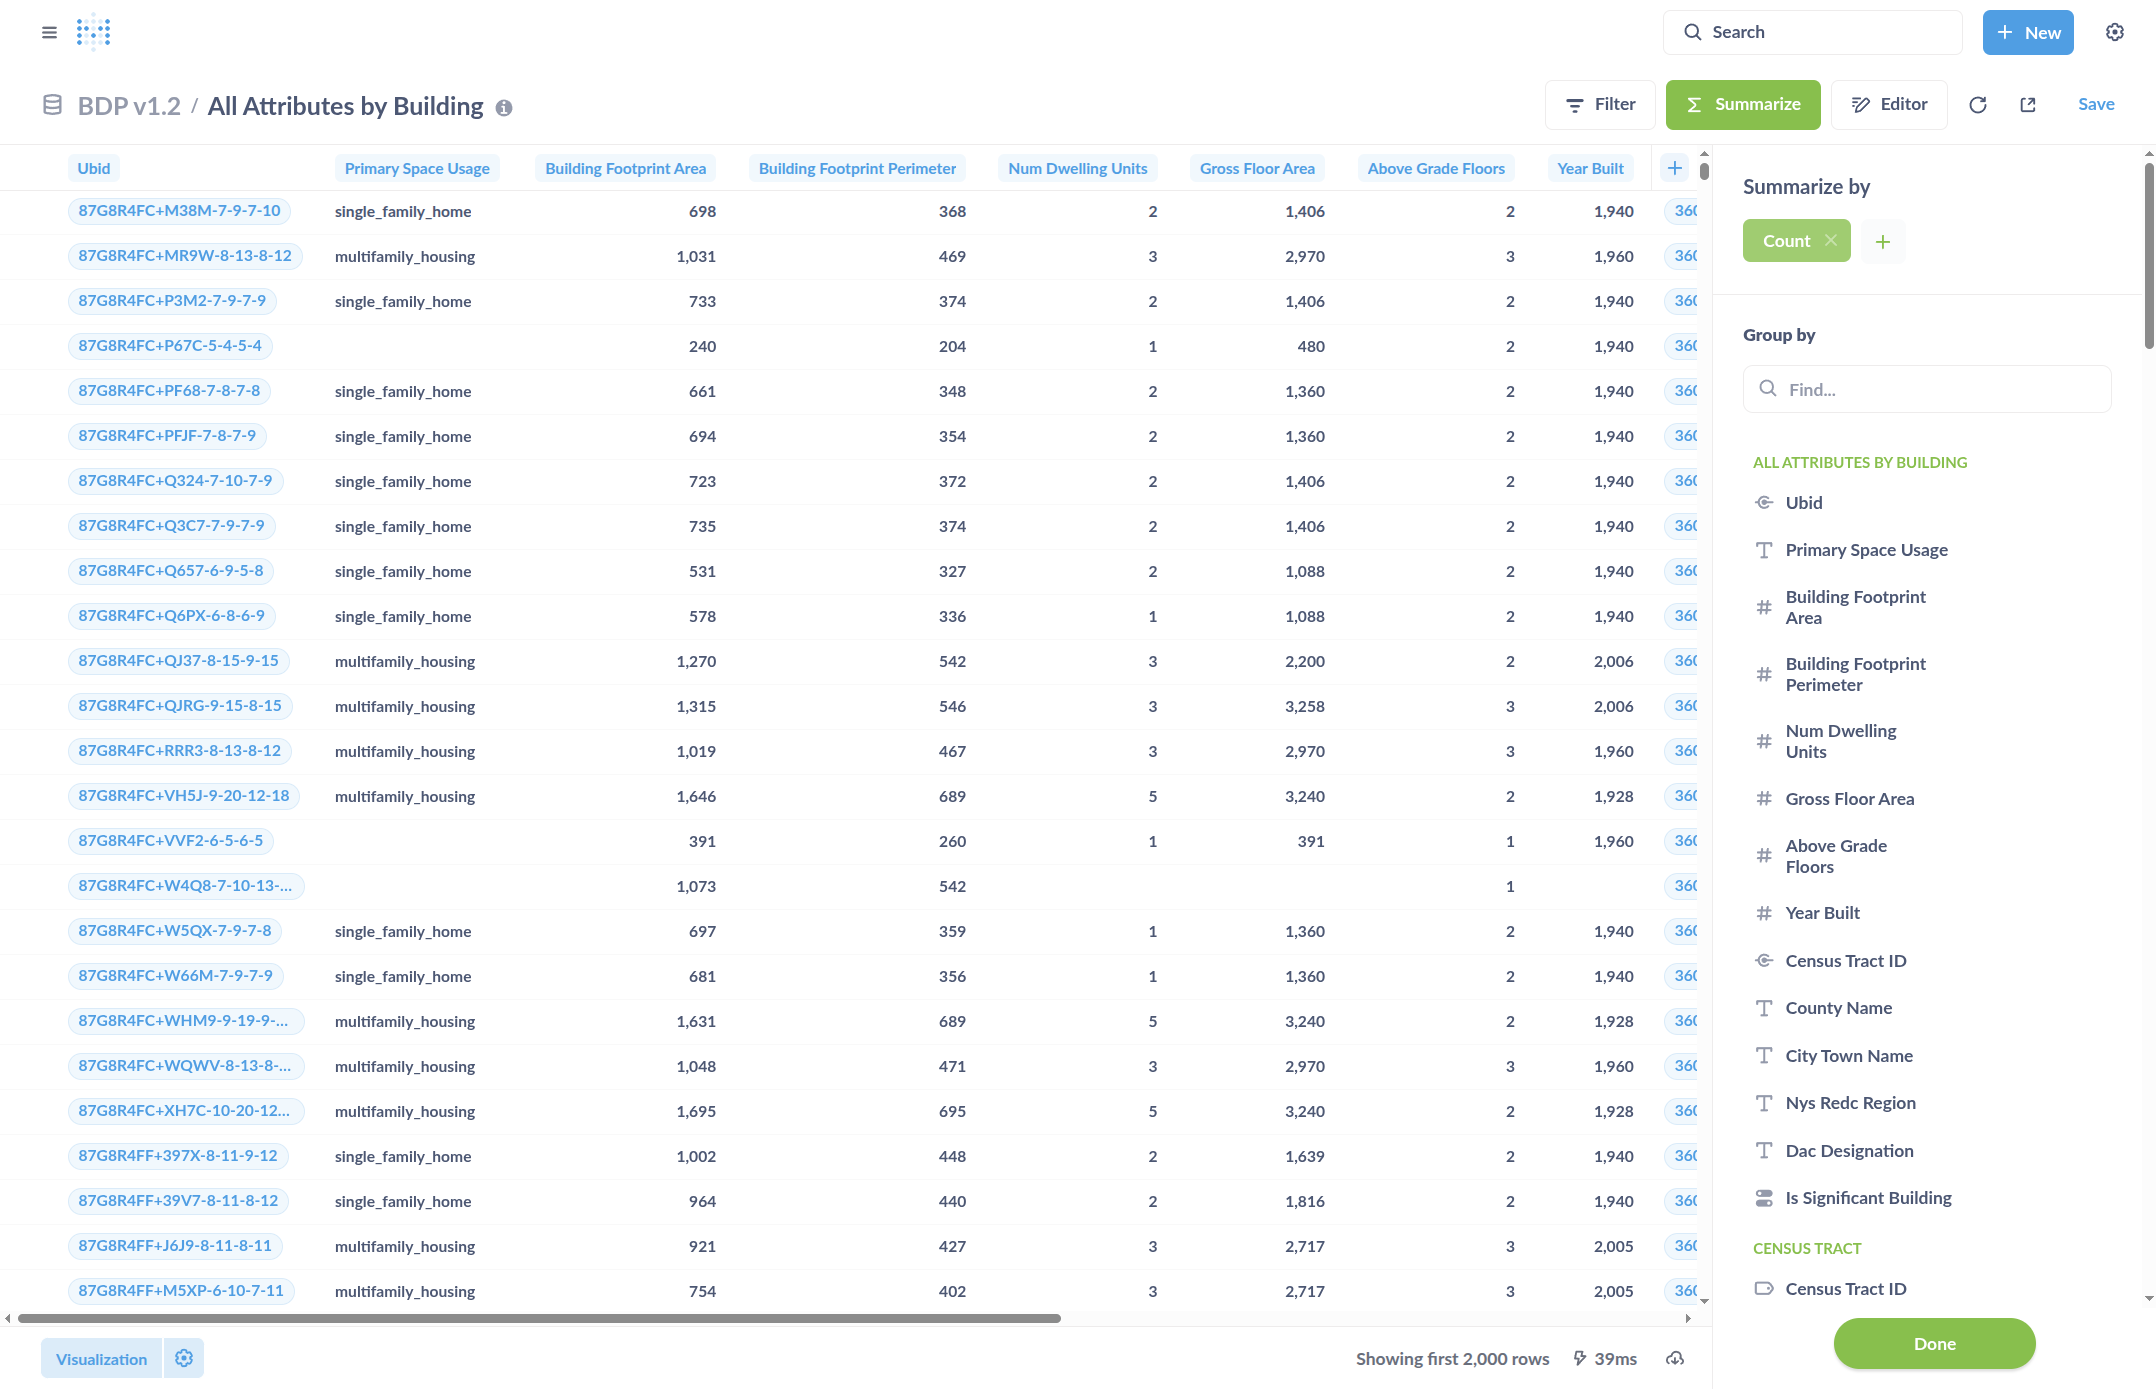
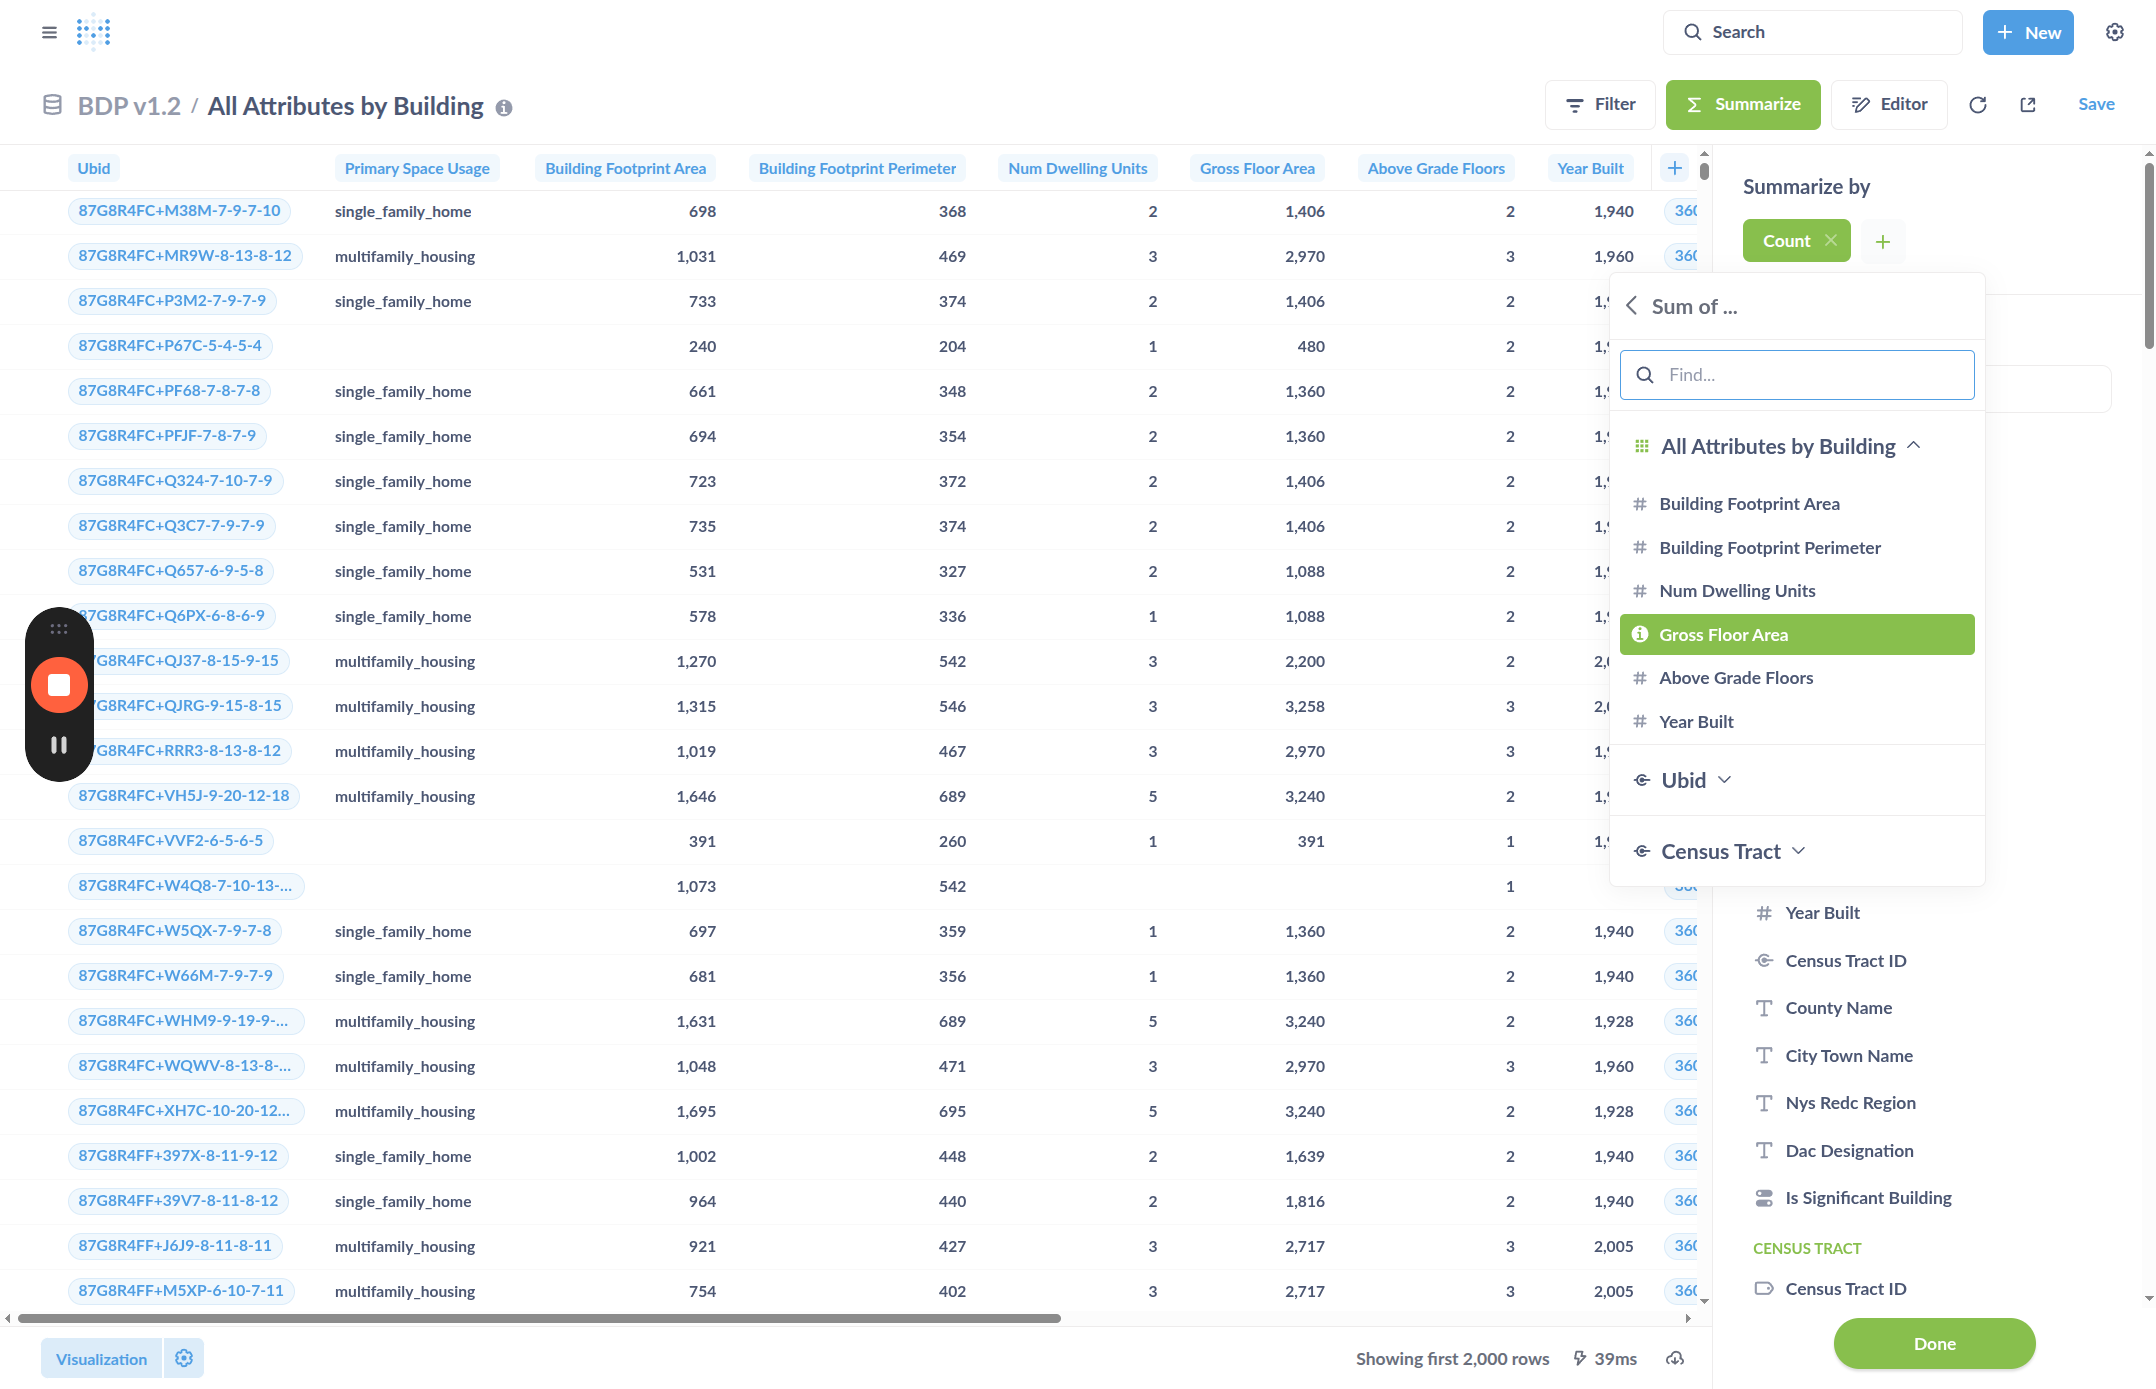
Then we can click to choose how we want to summarize. By default, it shows the row count. However, you can choose any of the other available metrics.
For example, click "Sum of..." then select "Gross Floor Area."
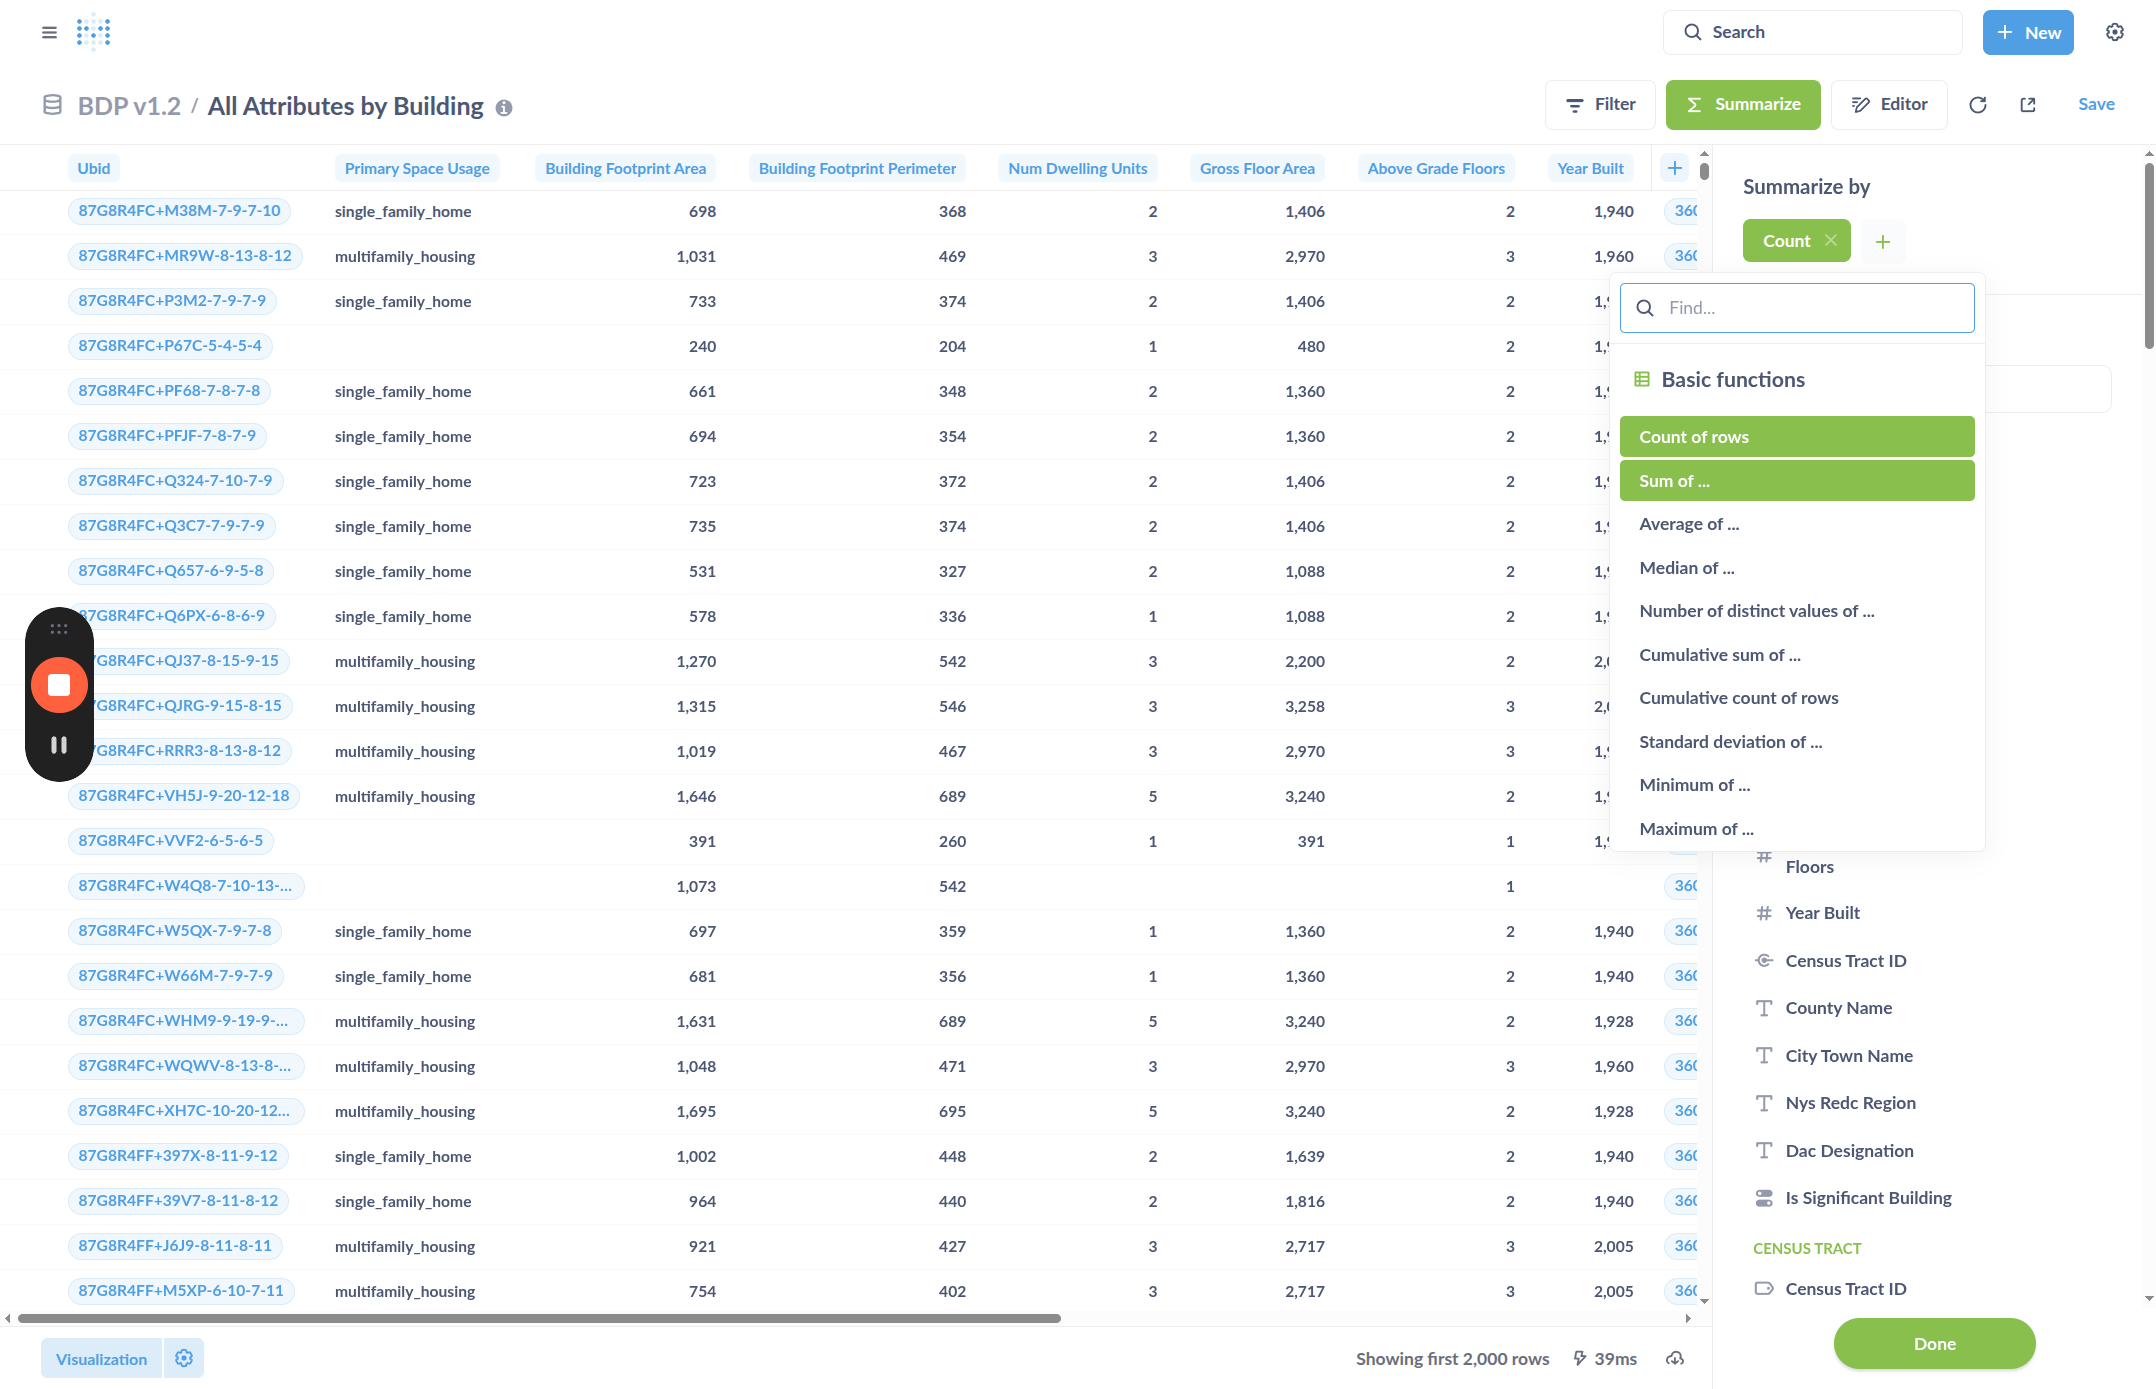
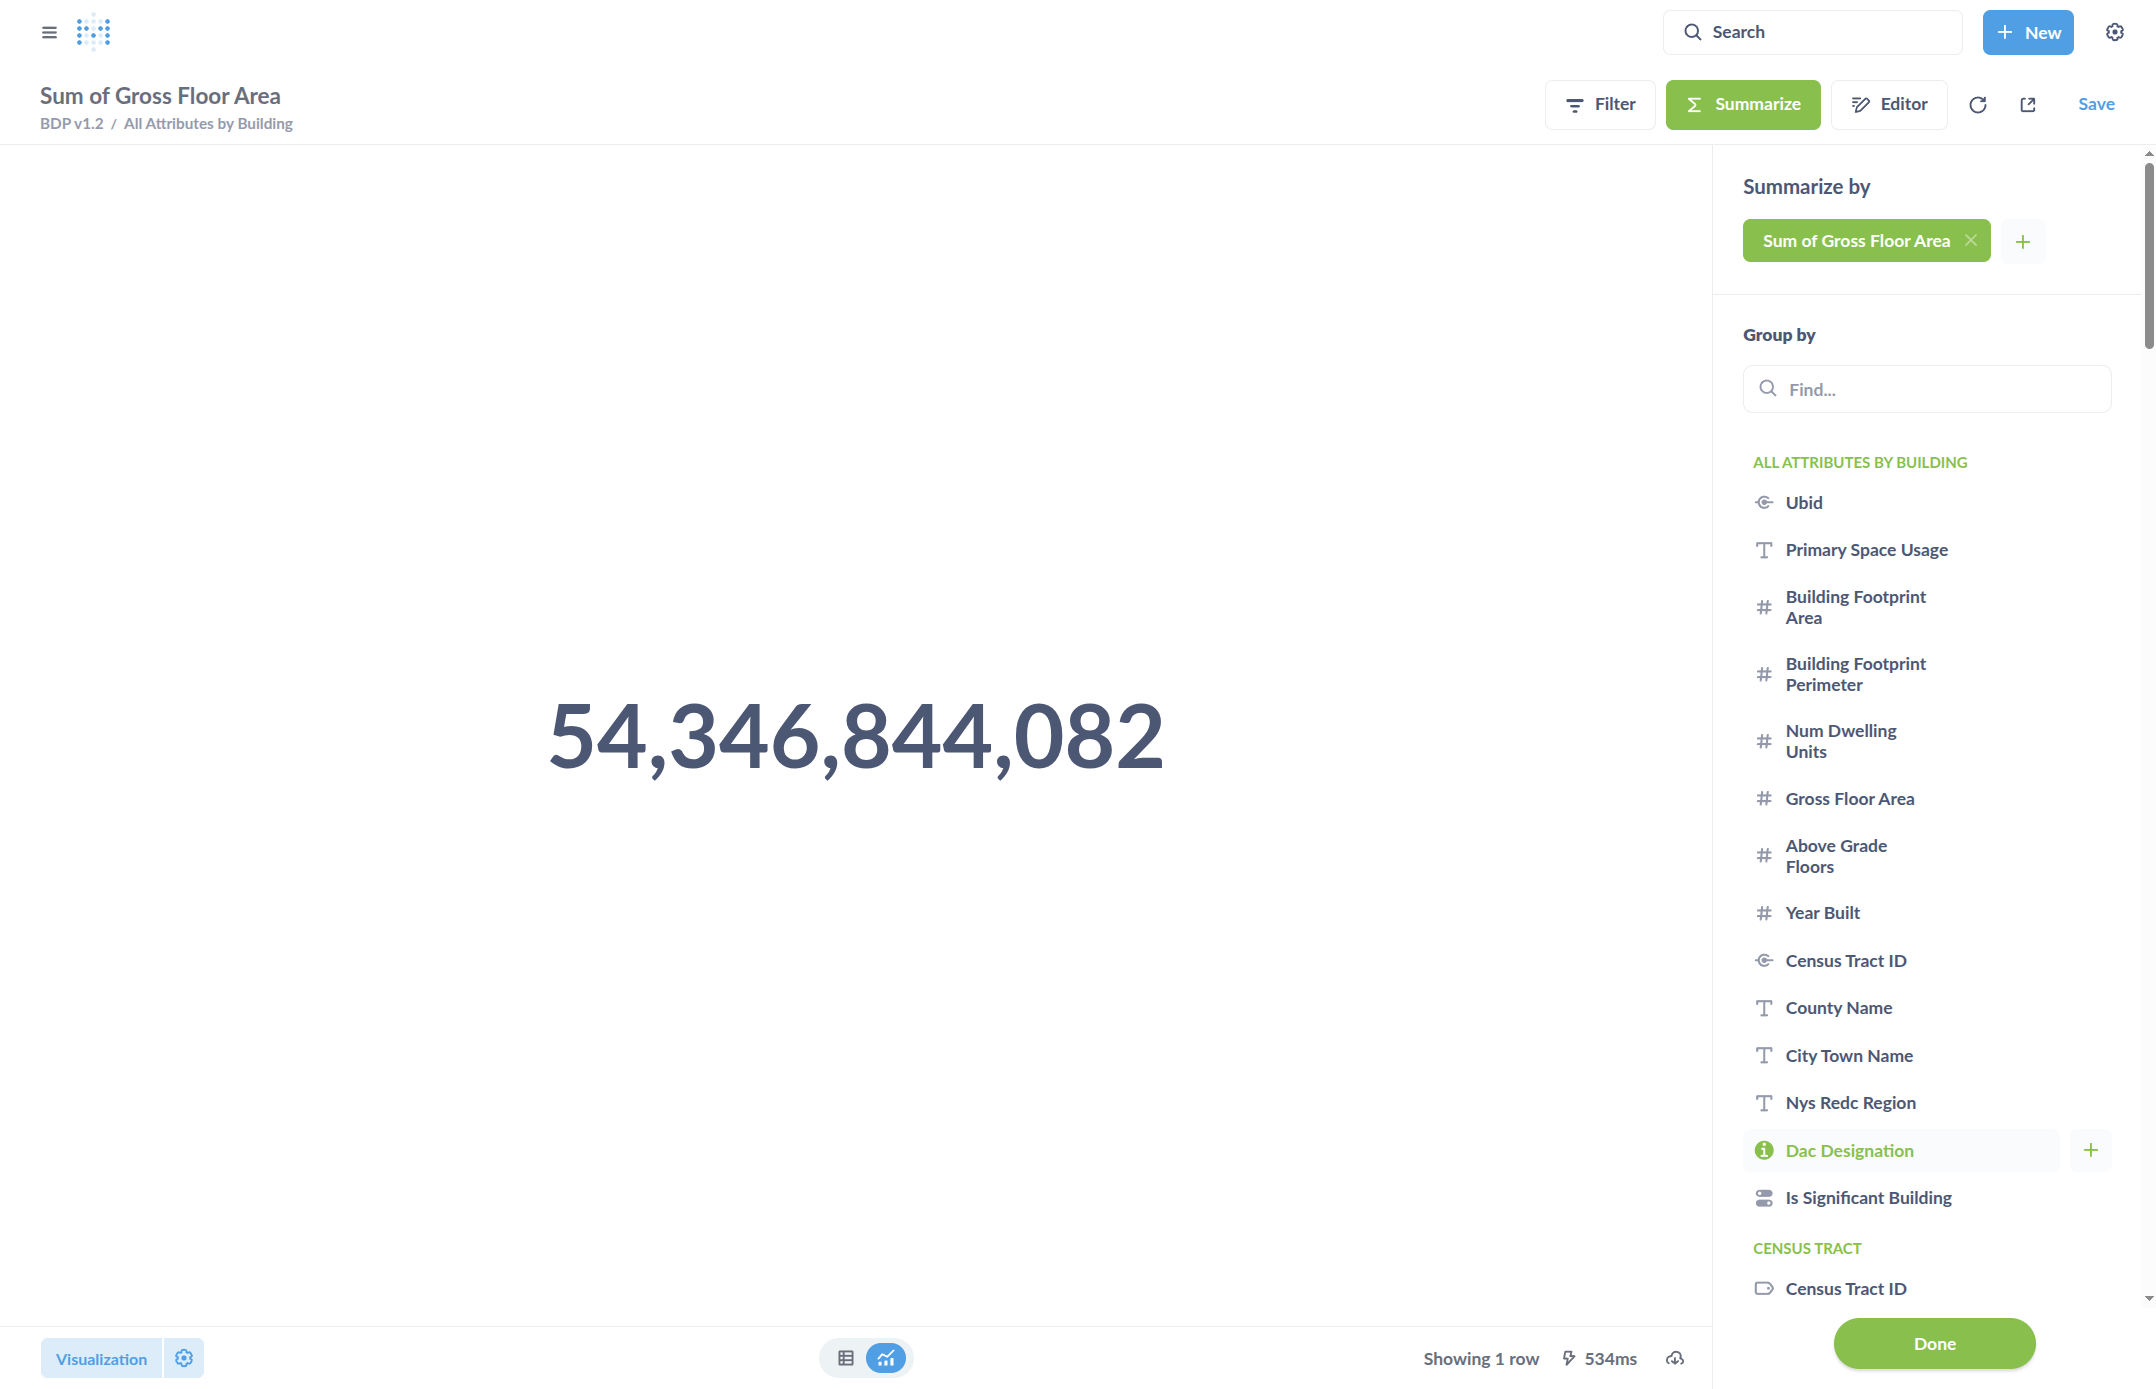
Now, it will sum the gross floor area.
Click the attribute I want to group by to create a summary table with the sum.
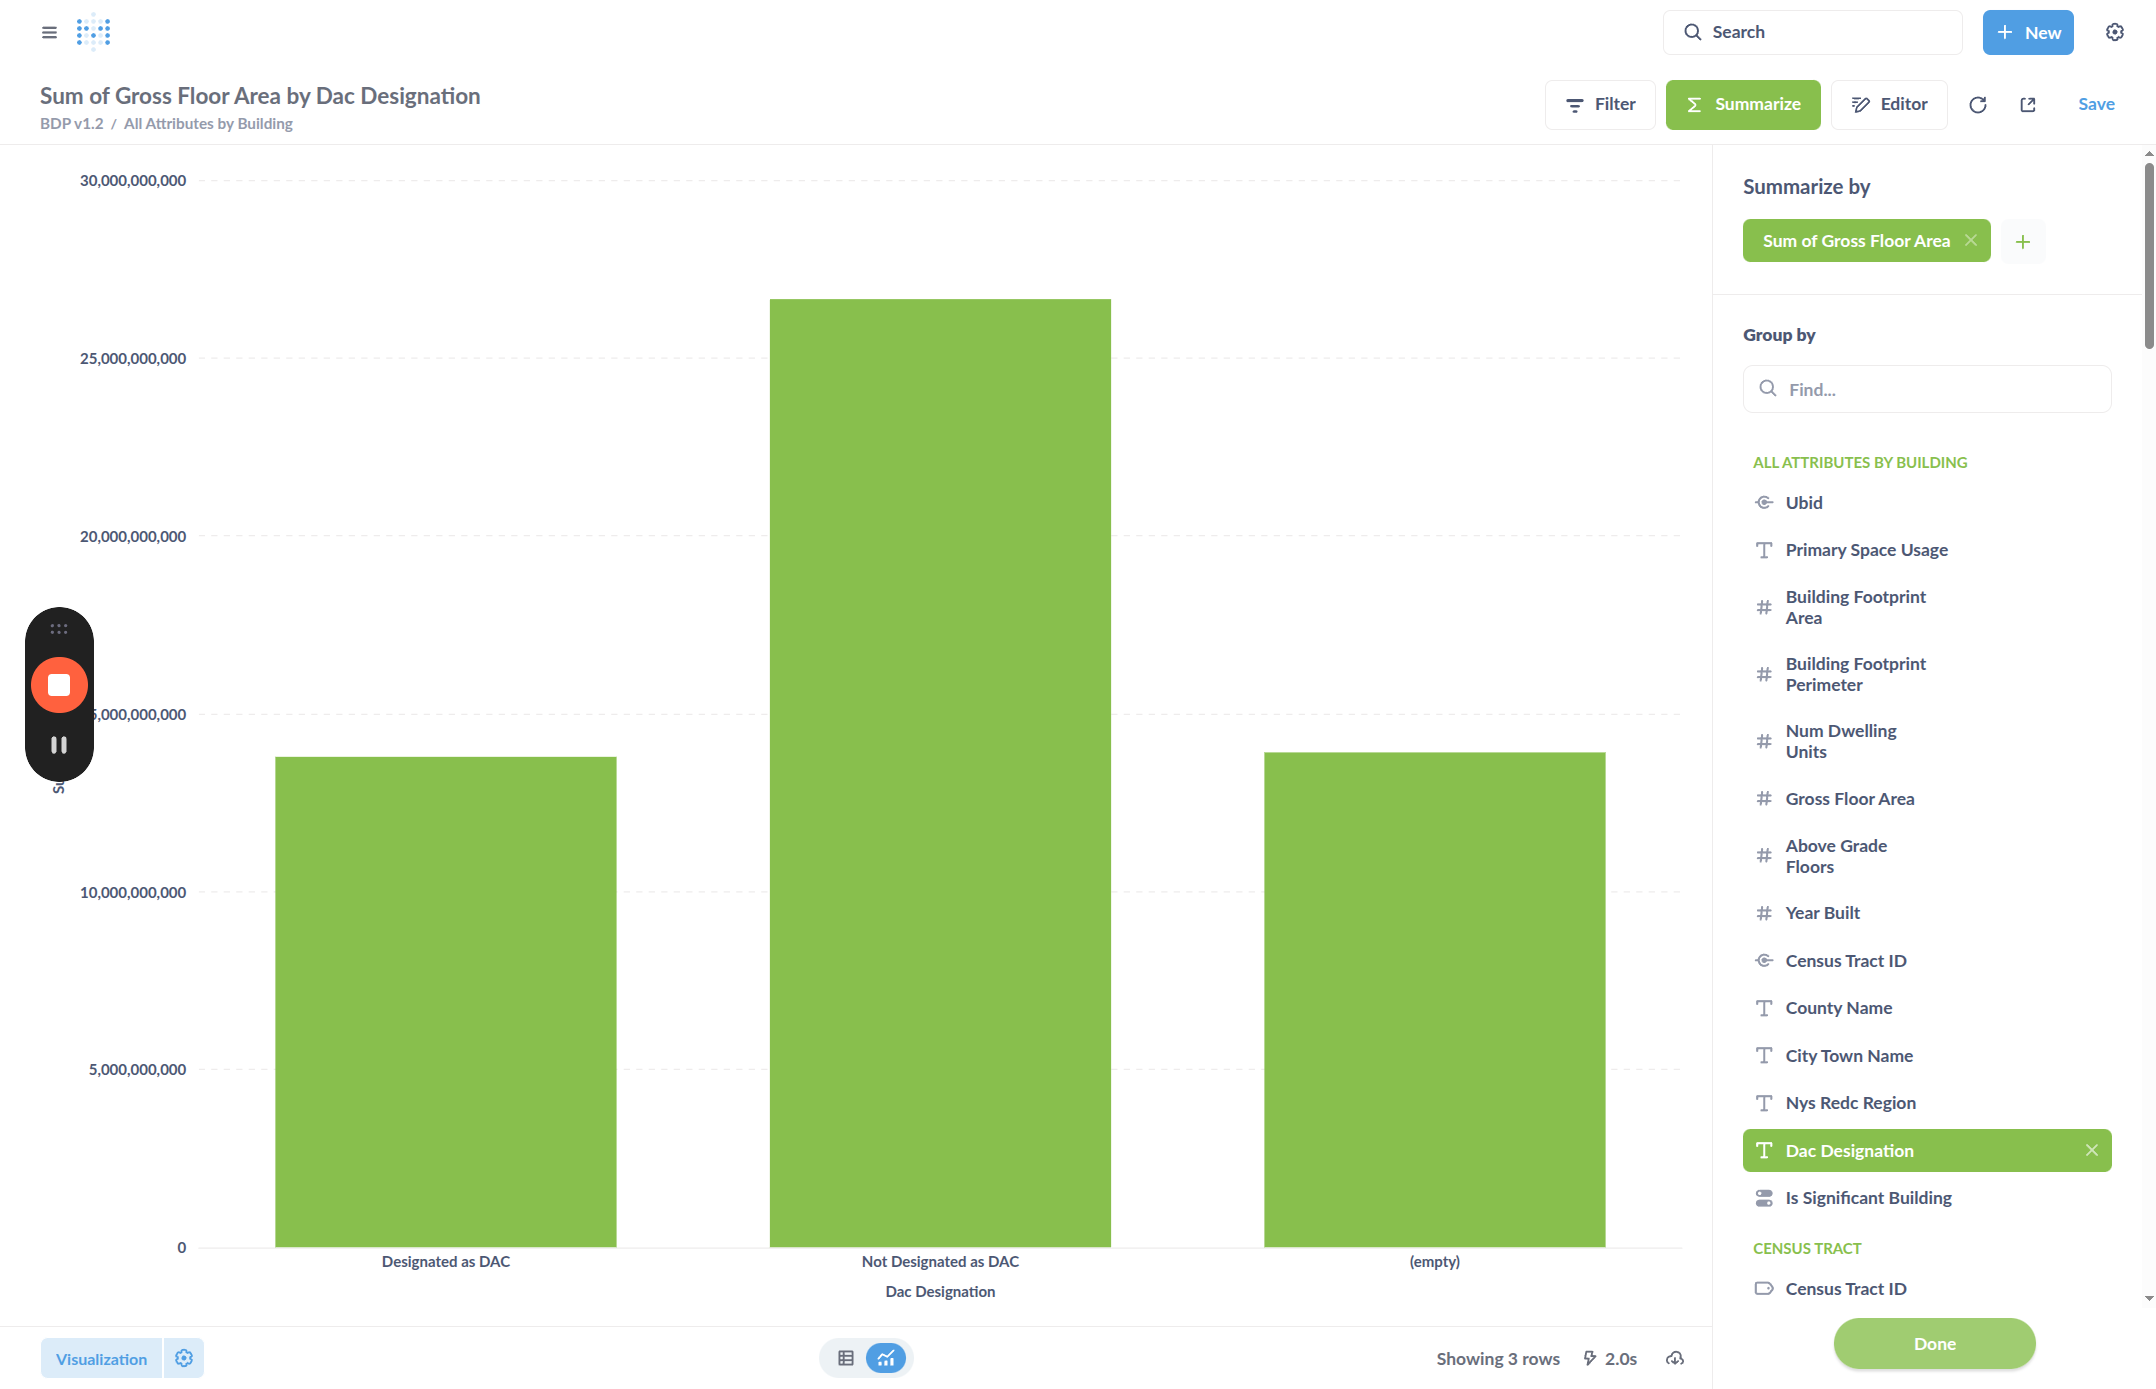
For example, click the "DAC Designation", which is a true/false grouping.
Click Done to see the summary. A default visualization will be created, you can change this in the next steps.
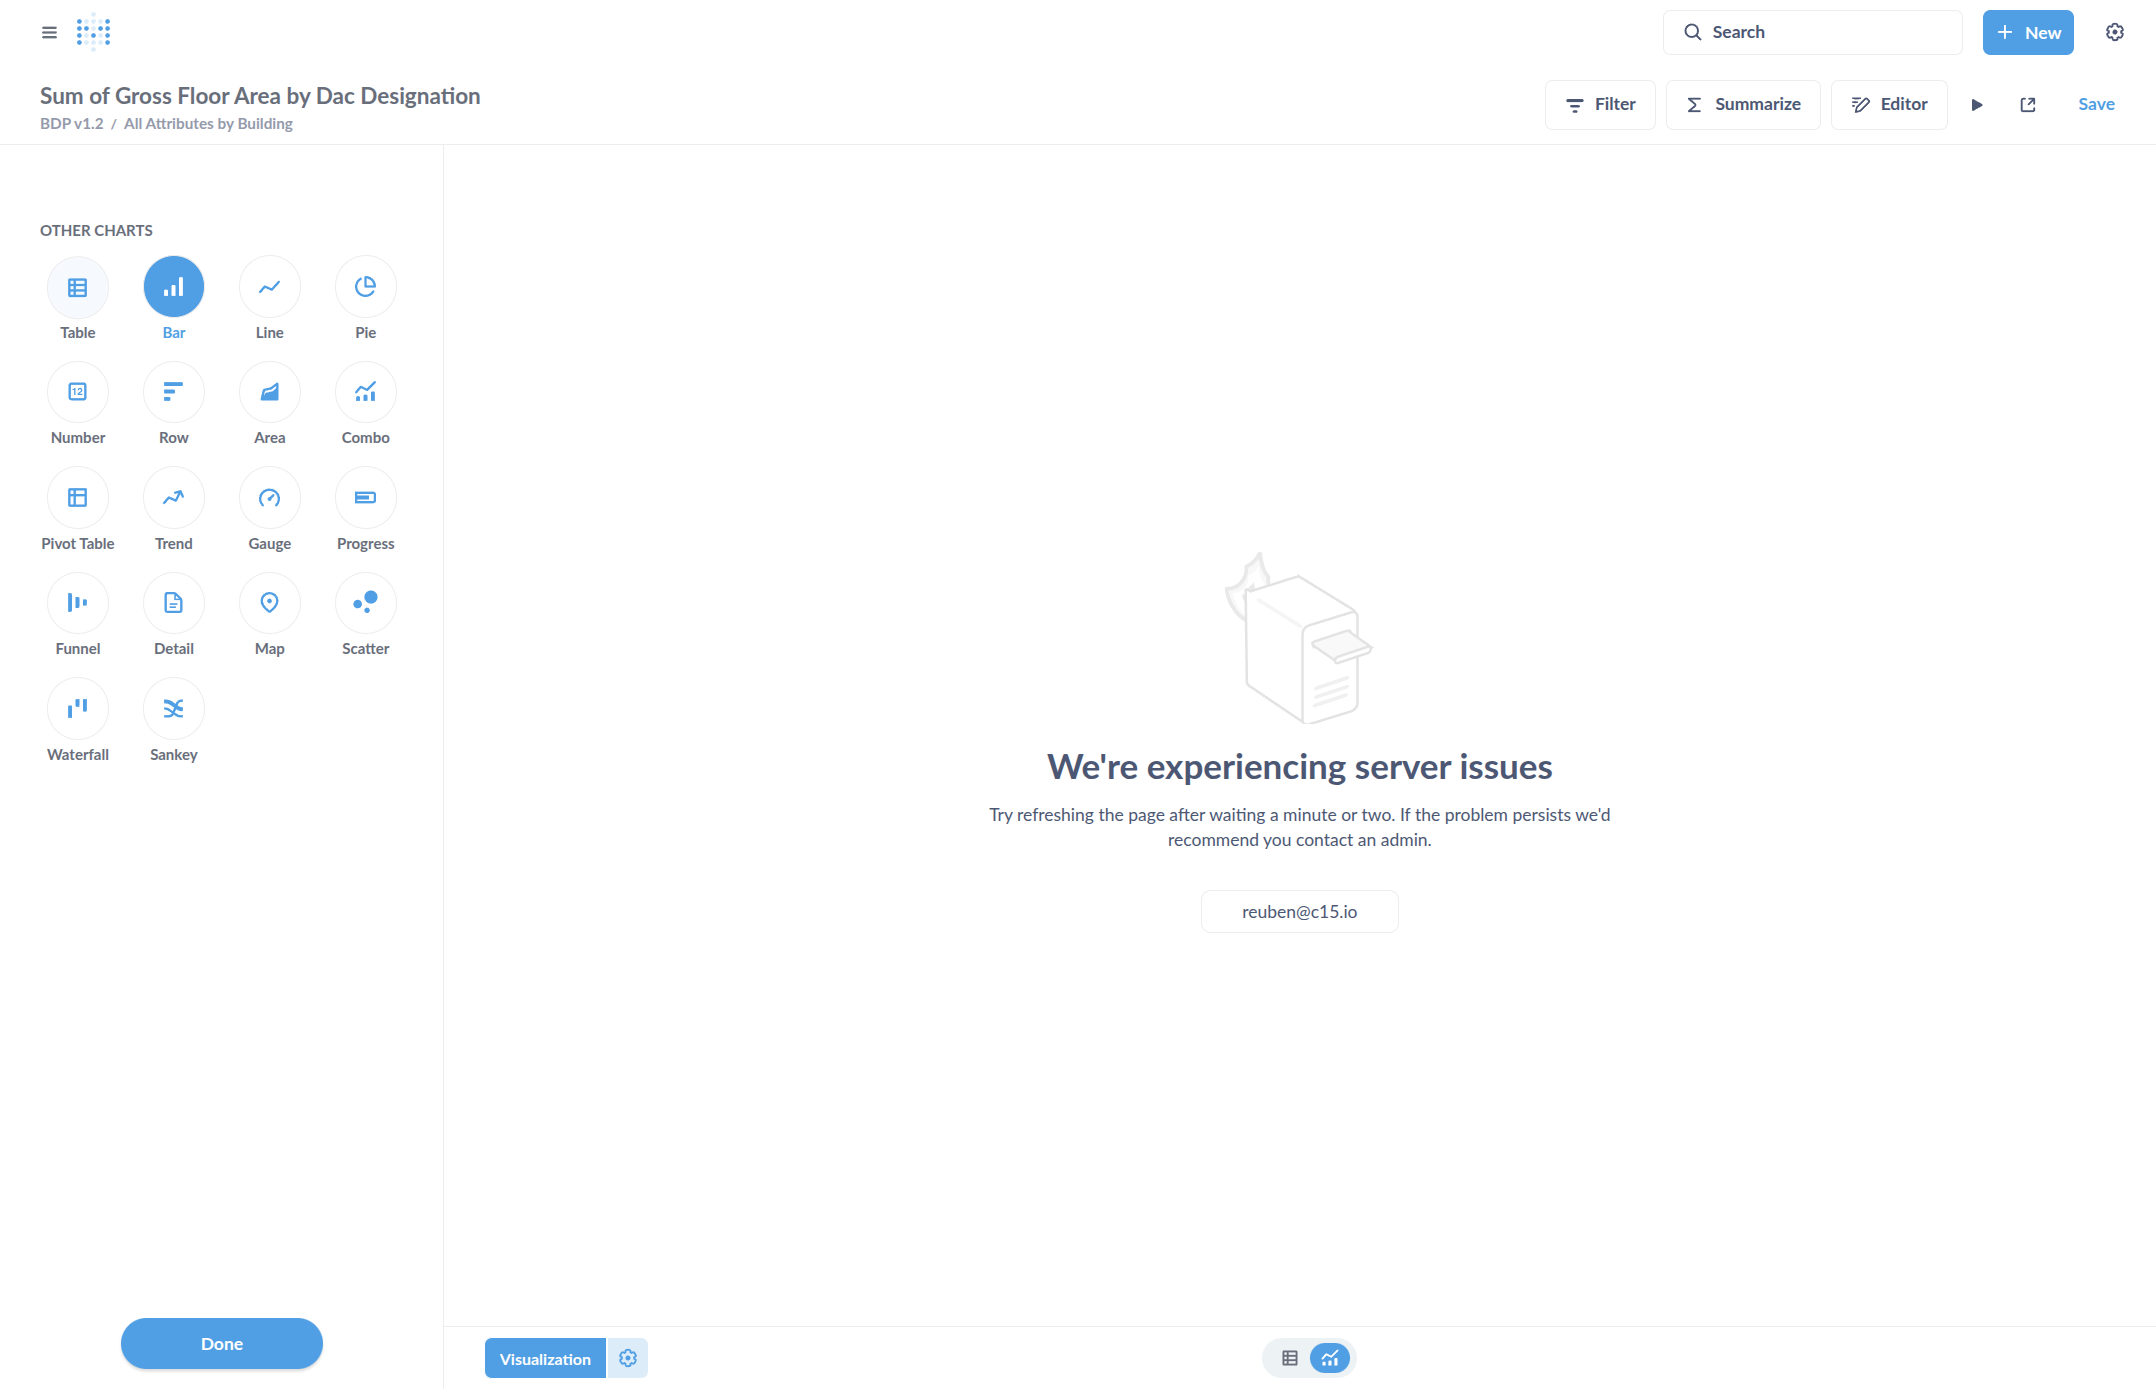
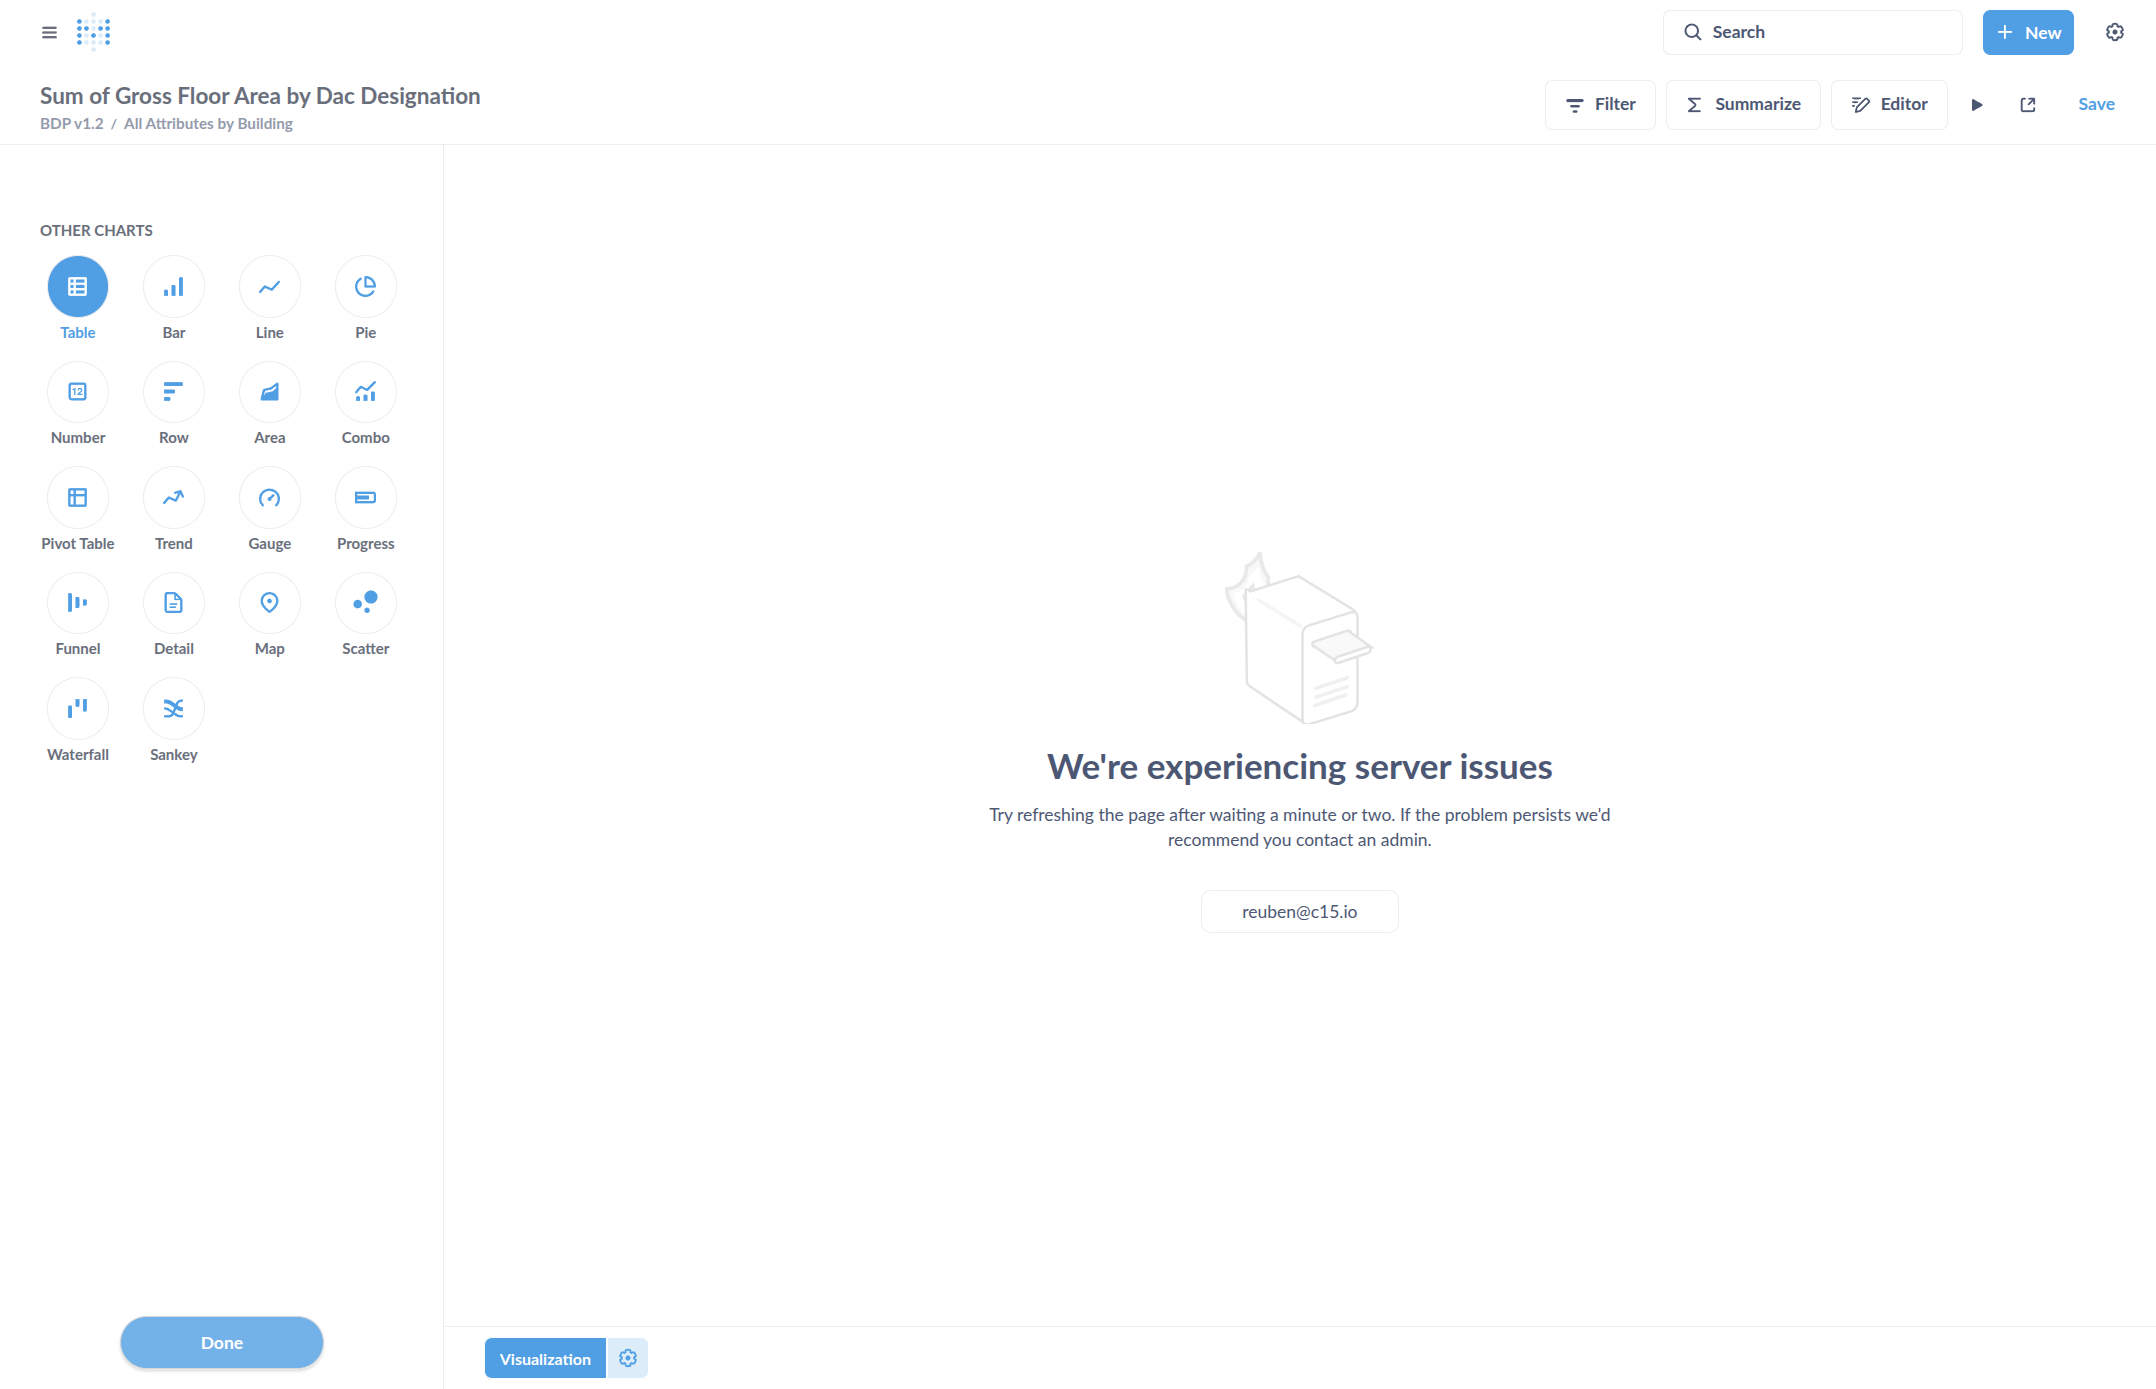
Select "Visualization" in the bottom left to change how the data is presented.

Select Table, then click Done.
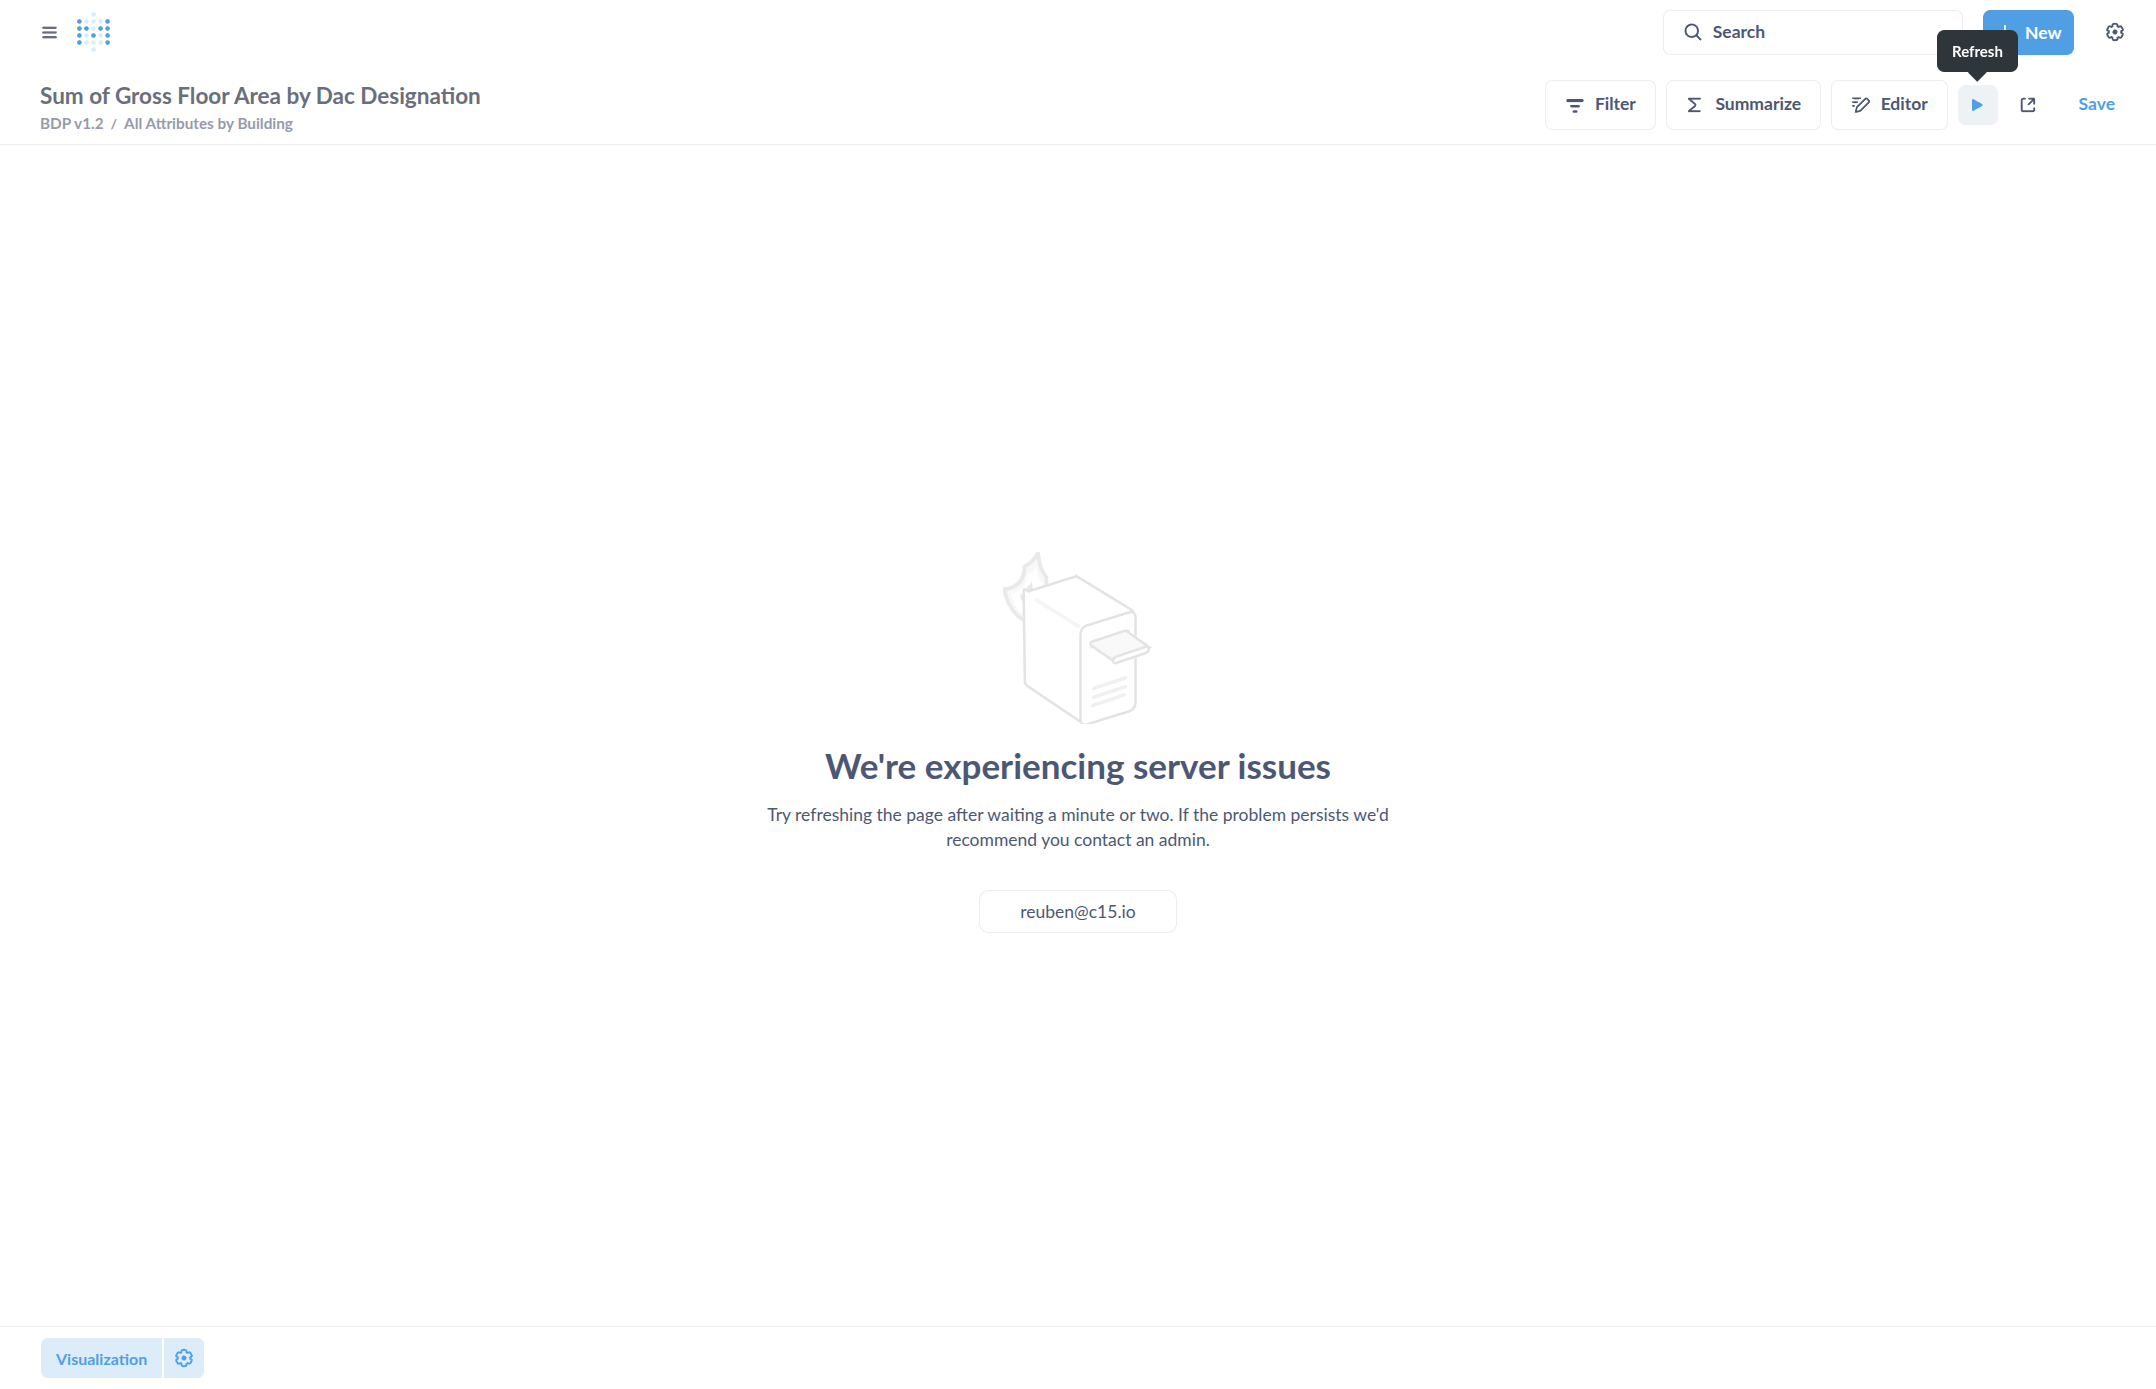
Now we should see a summary table. If not, select the "Refresh" button in the upper right.
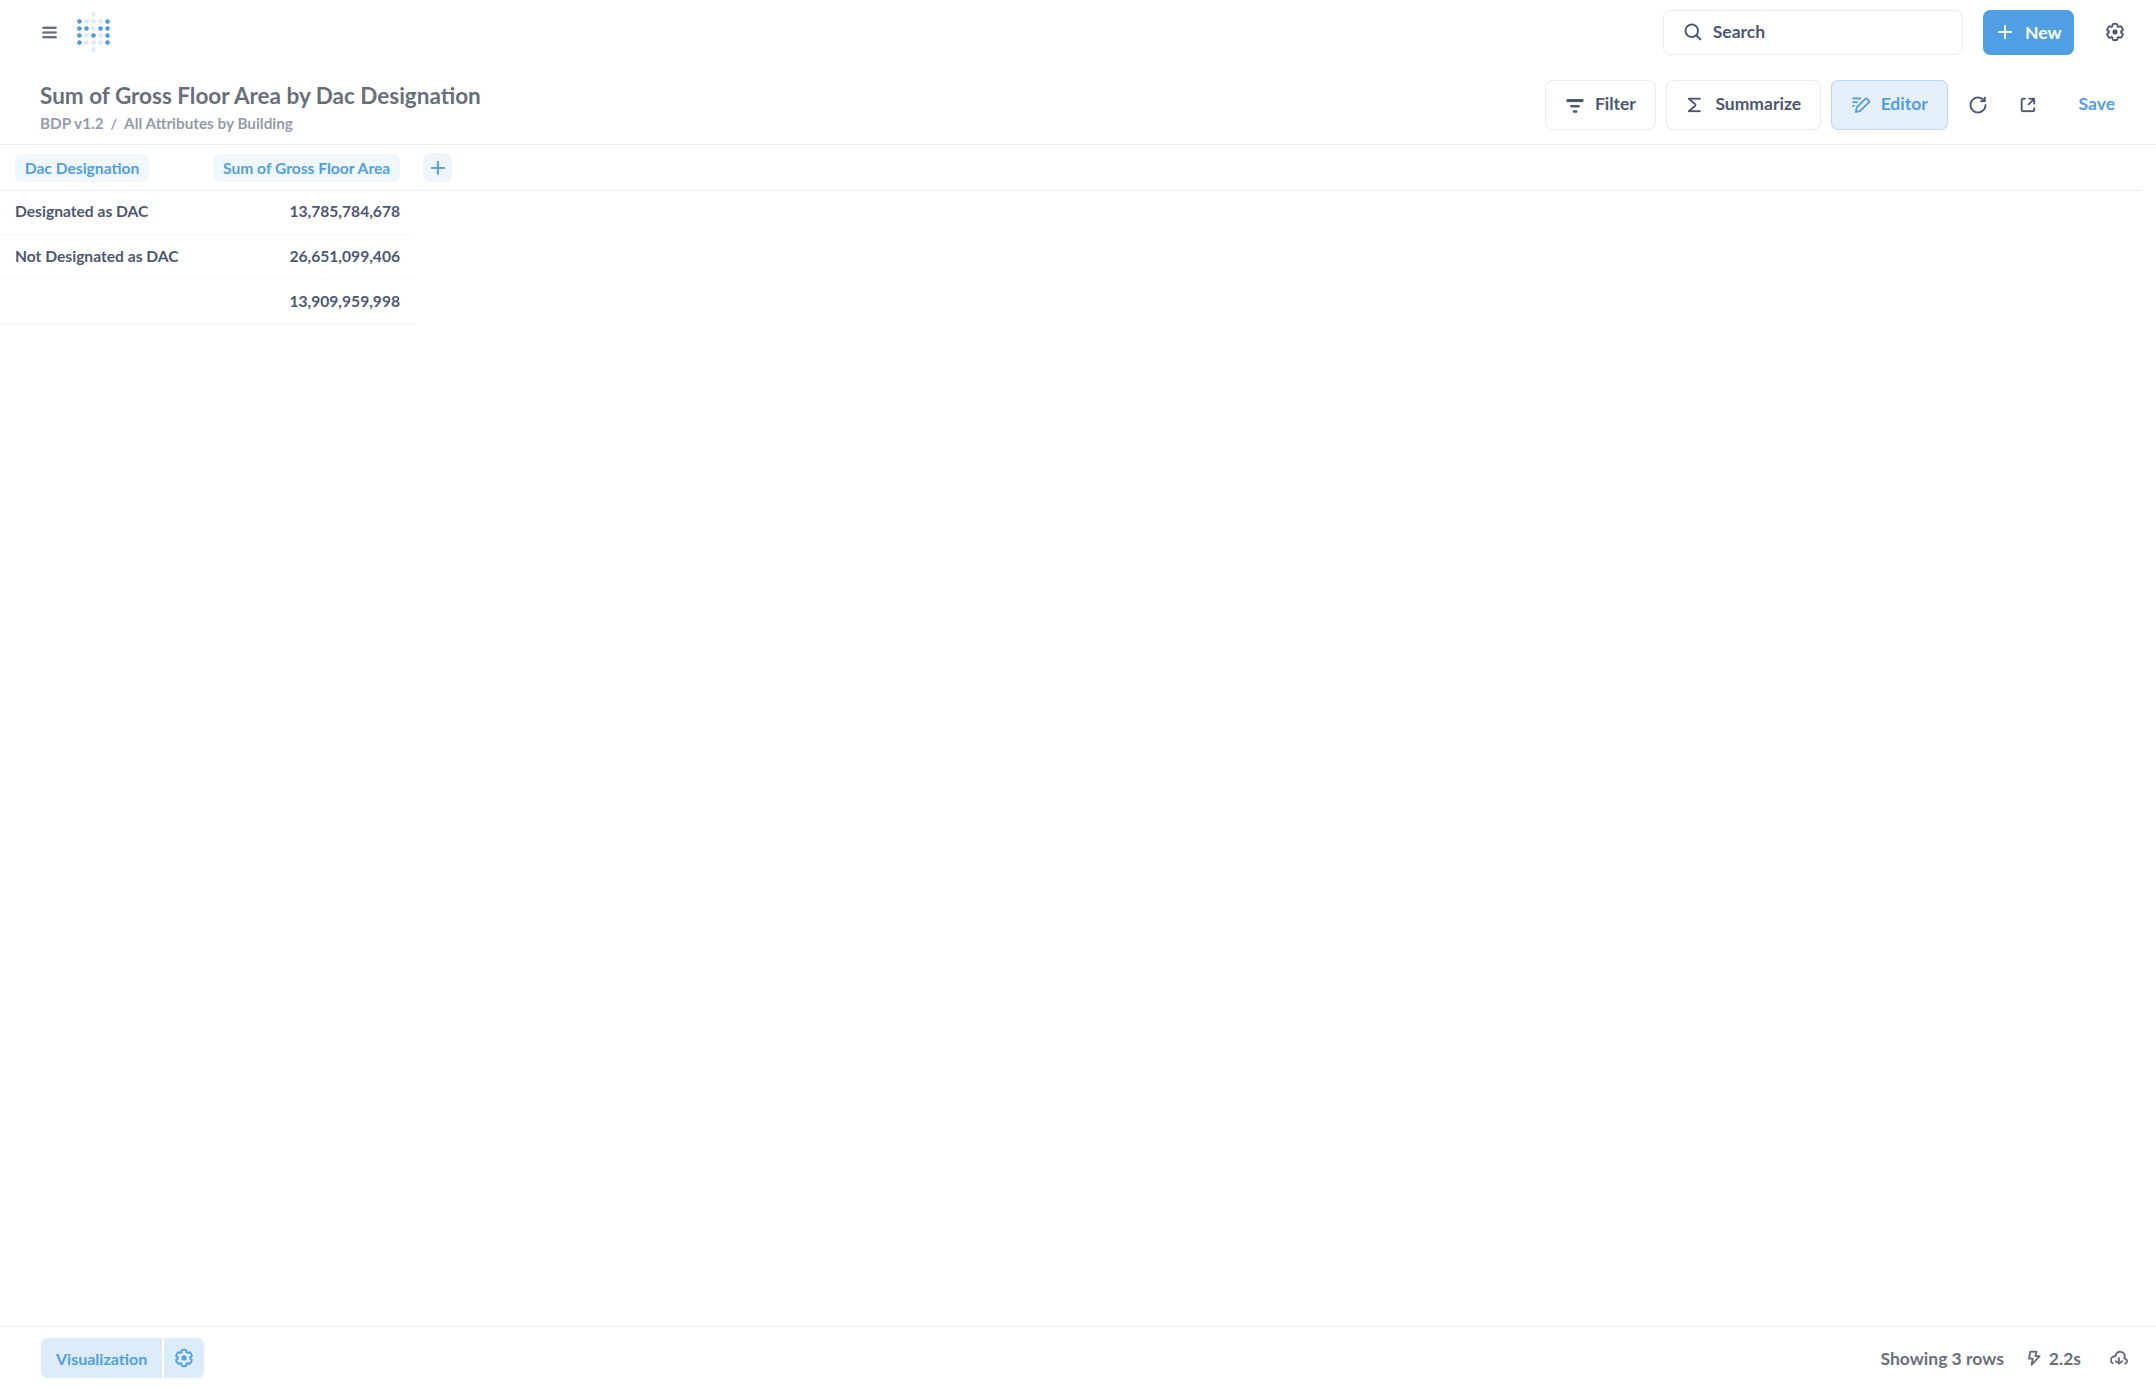
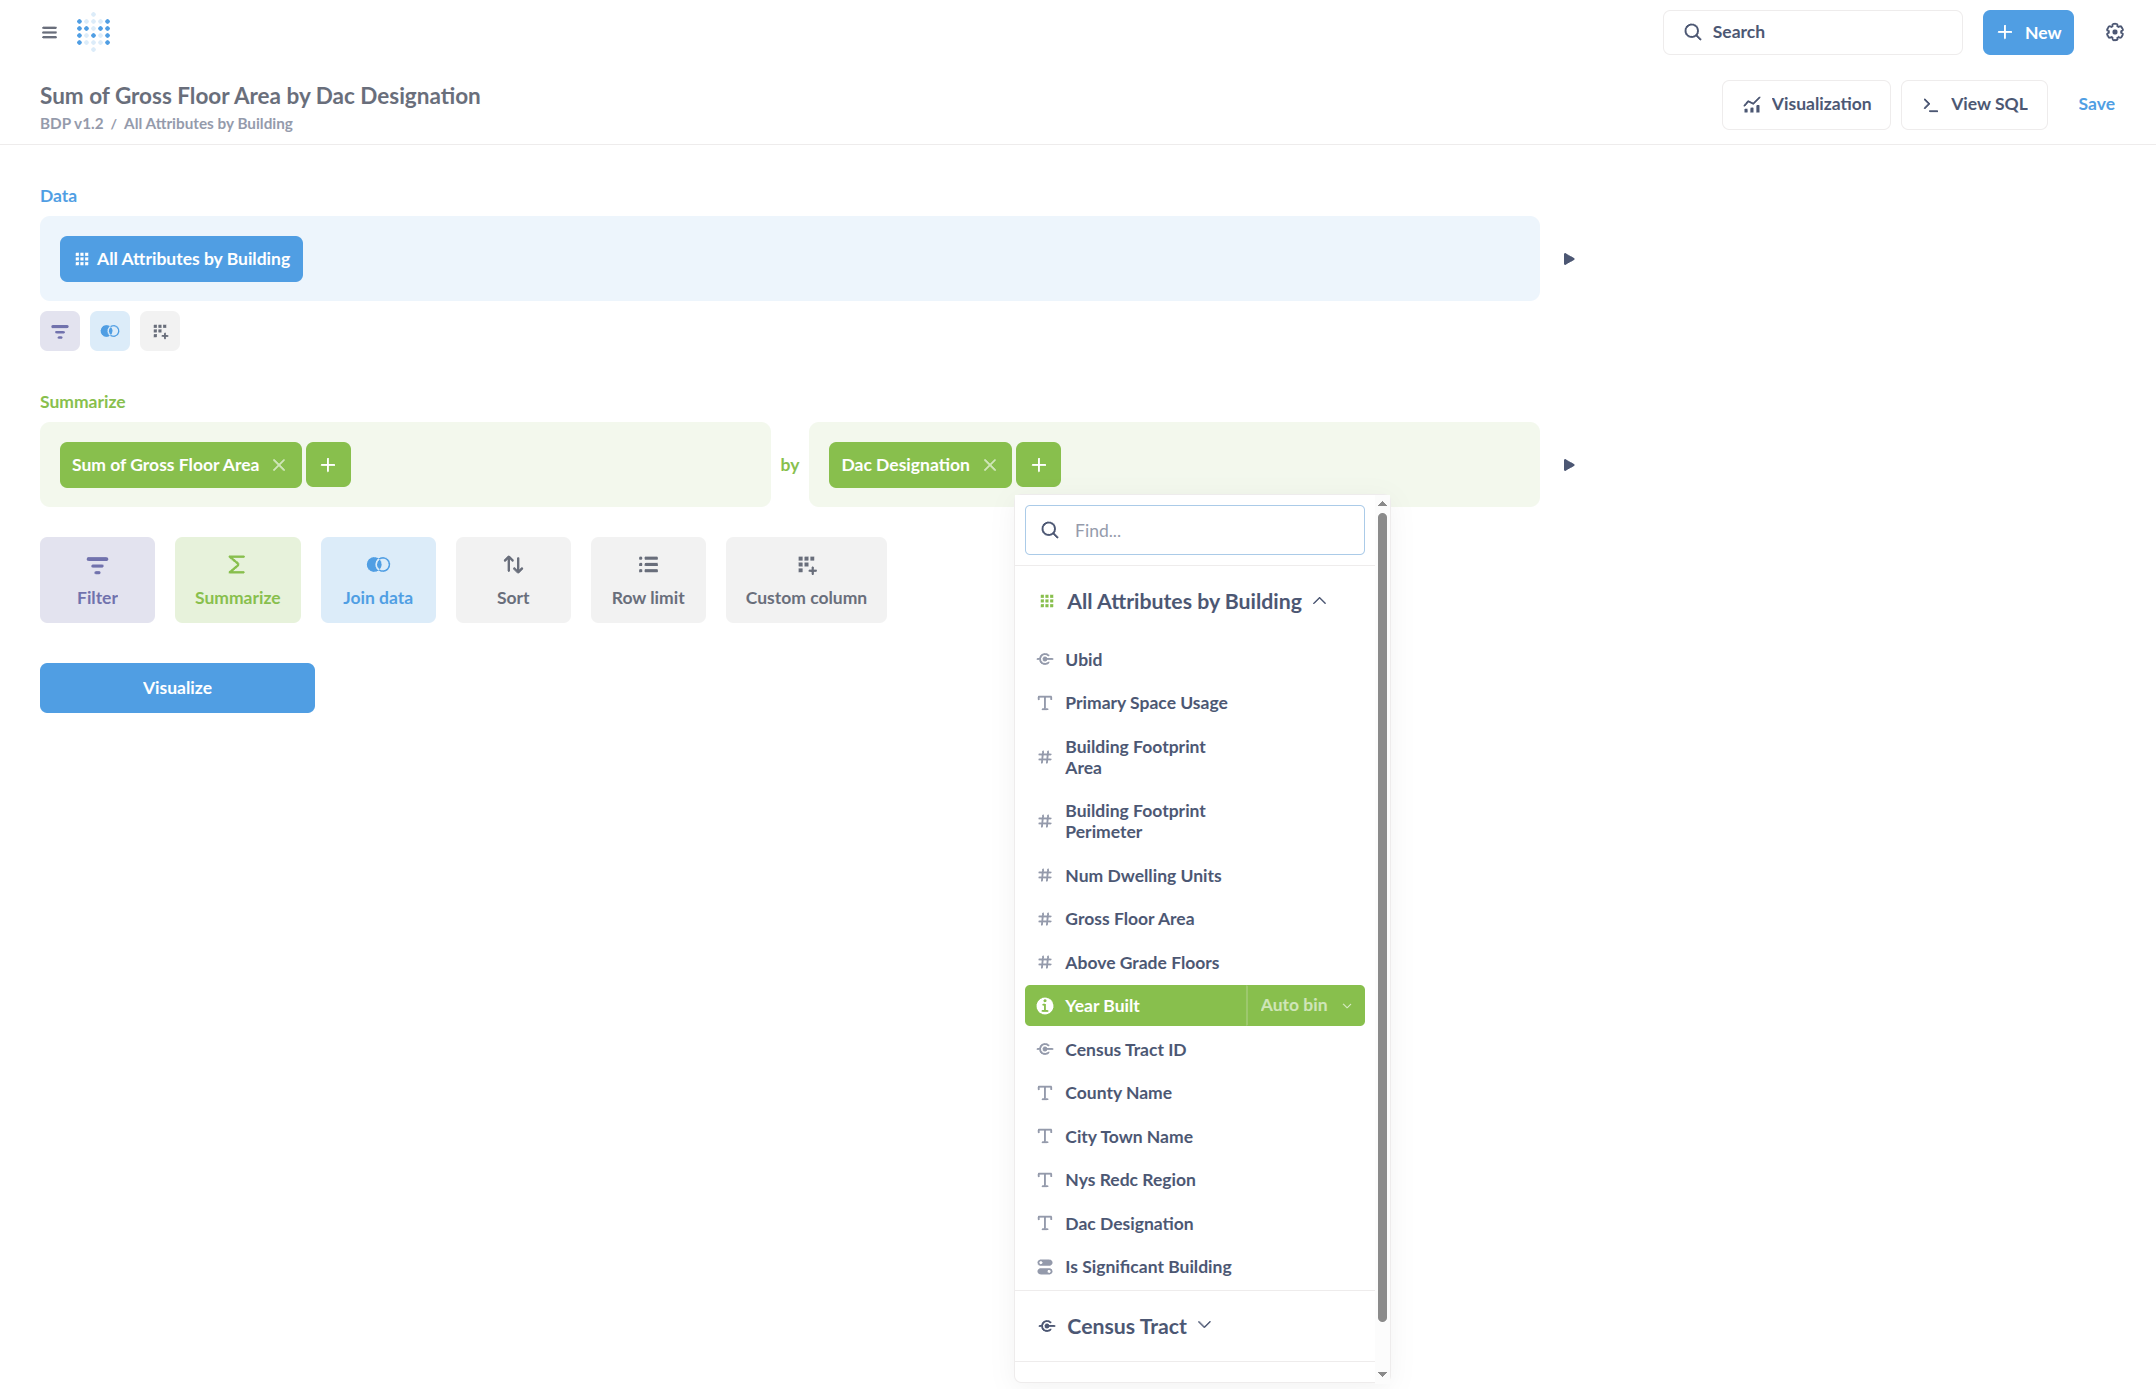
We can see whether it is designated as DAC and view the total gross floor area. Go to Editor, click on Editor, and change how you are summarizing. You can also add or change the grouping variable.
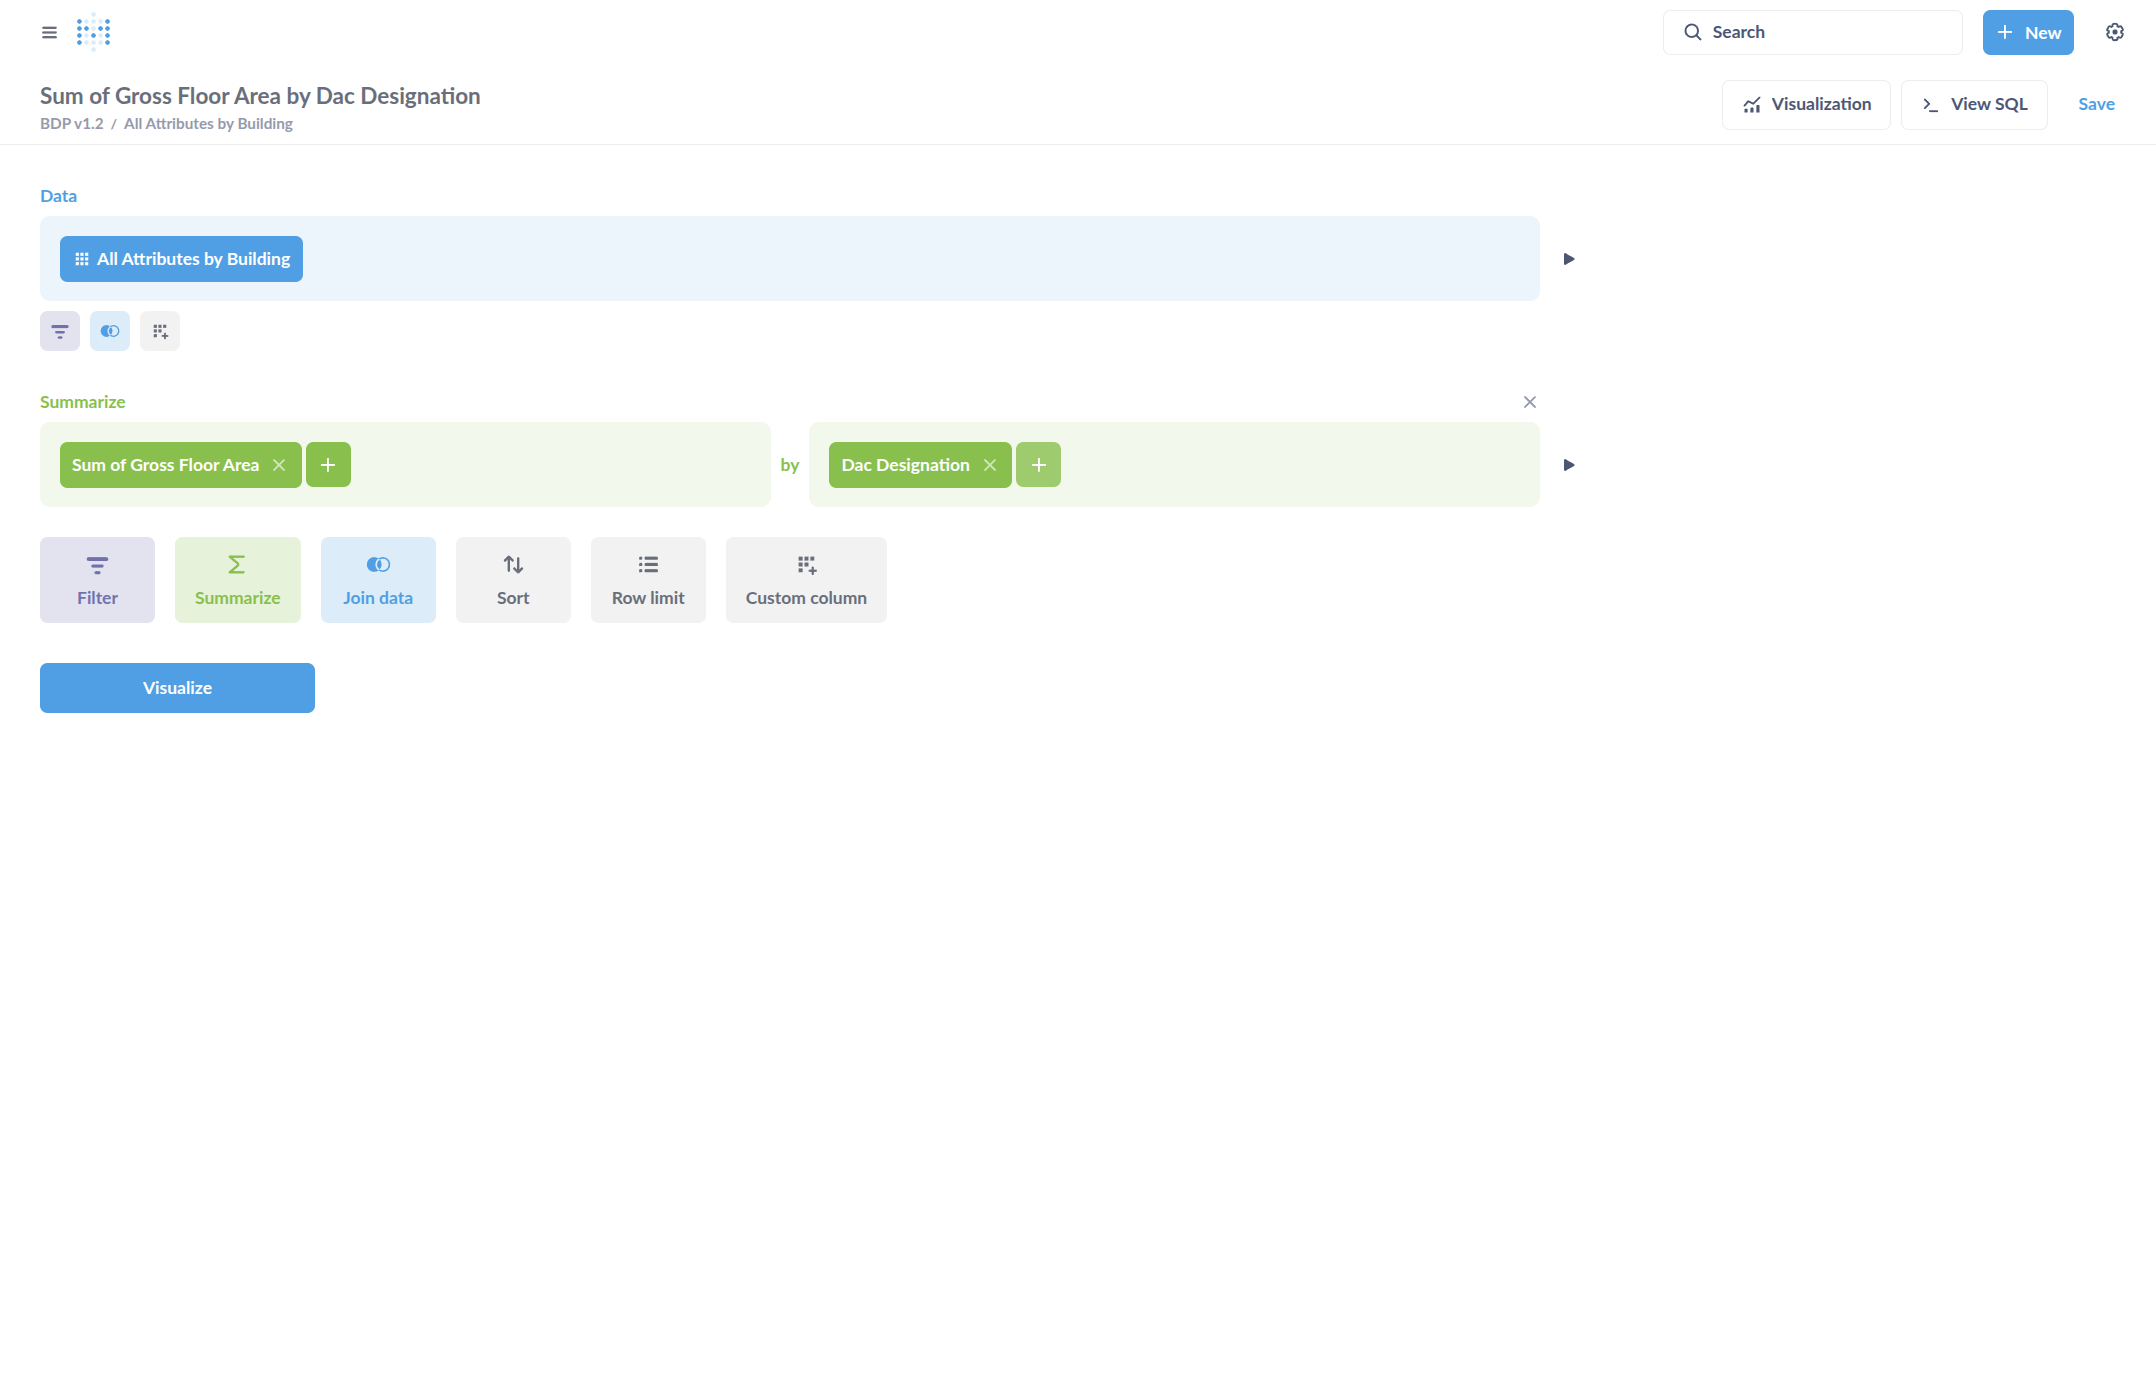
Here, I'll add a grouping variable for Year Built, then select Visualize.
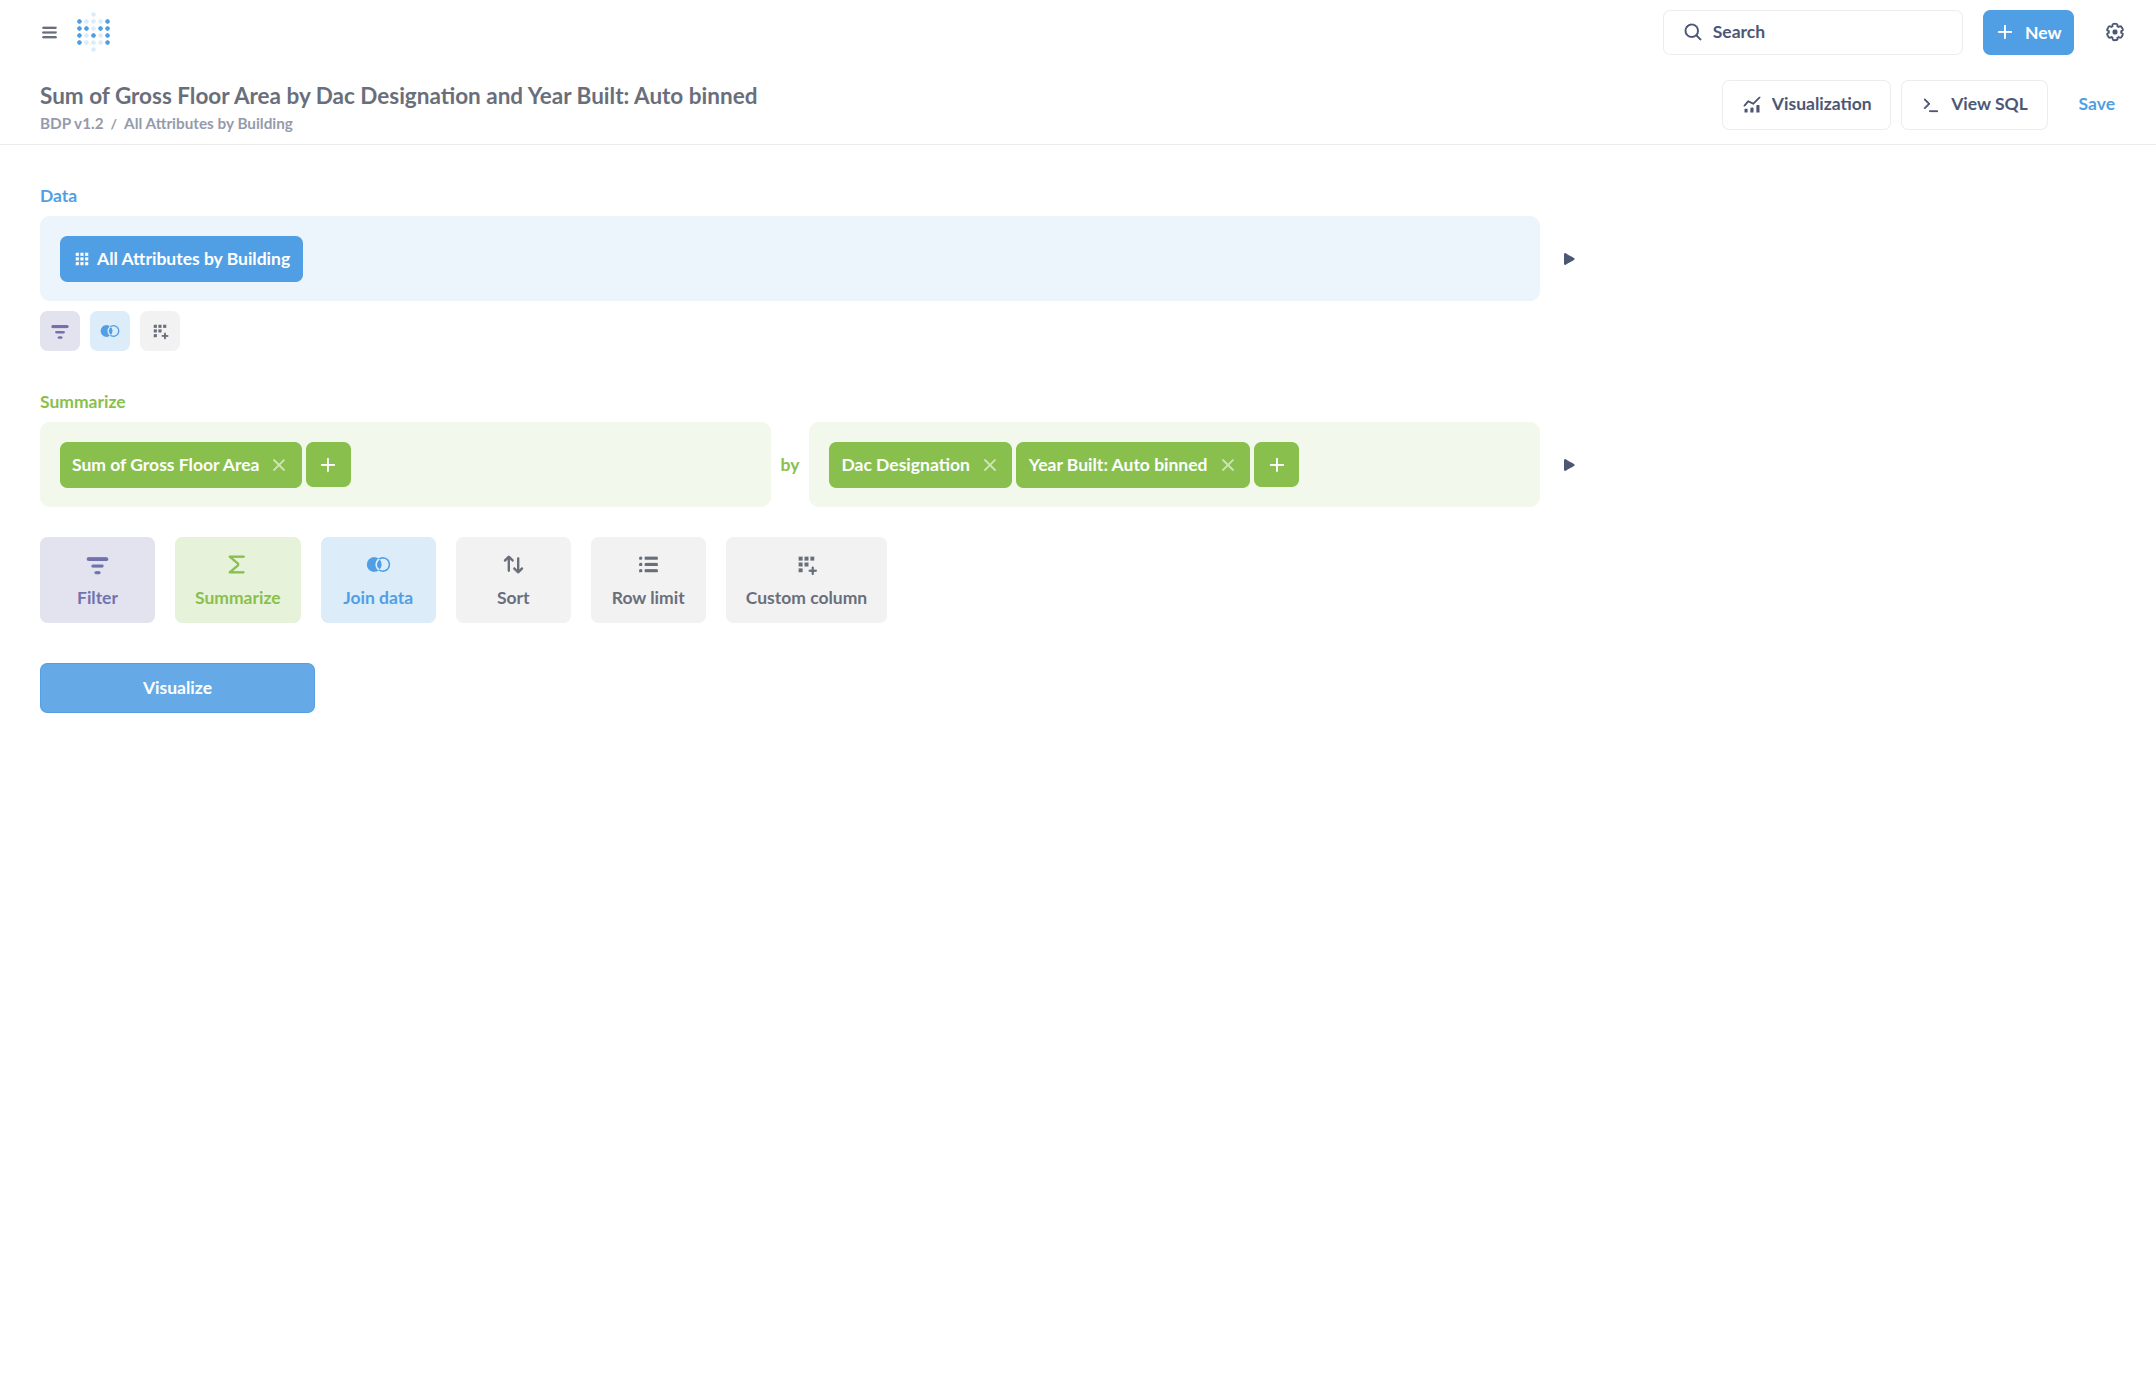
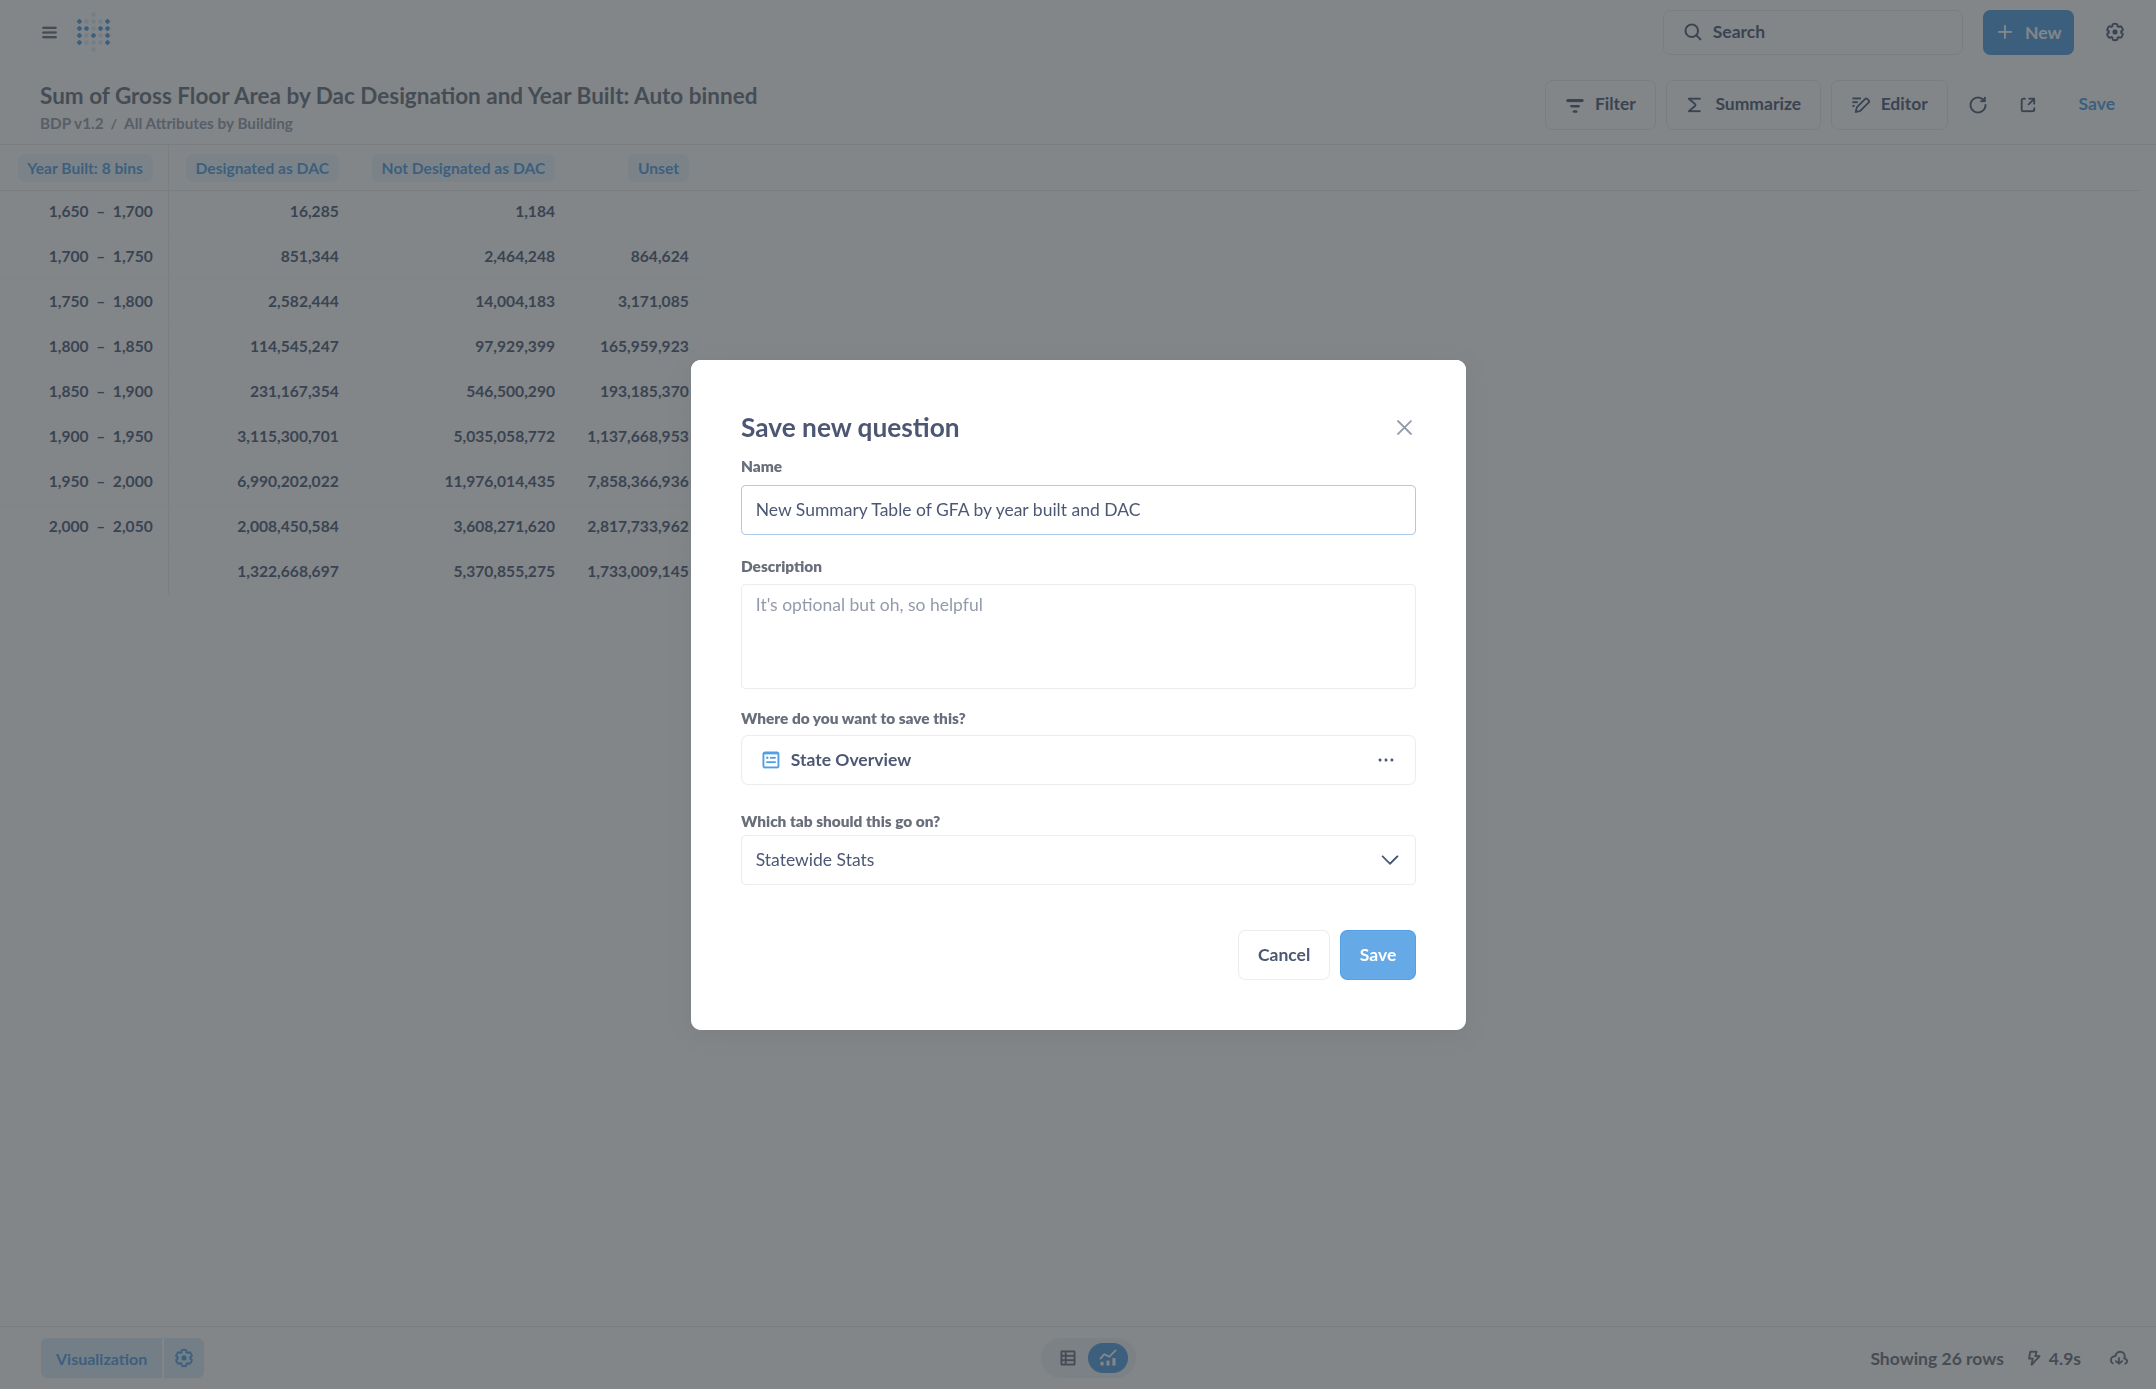
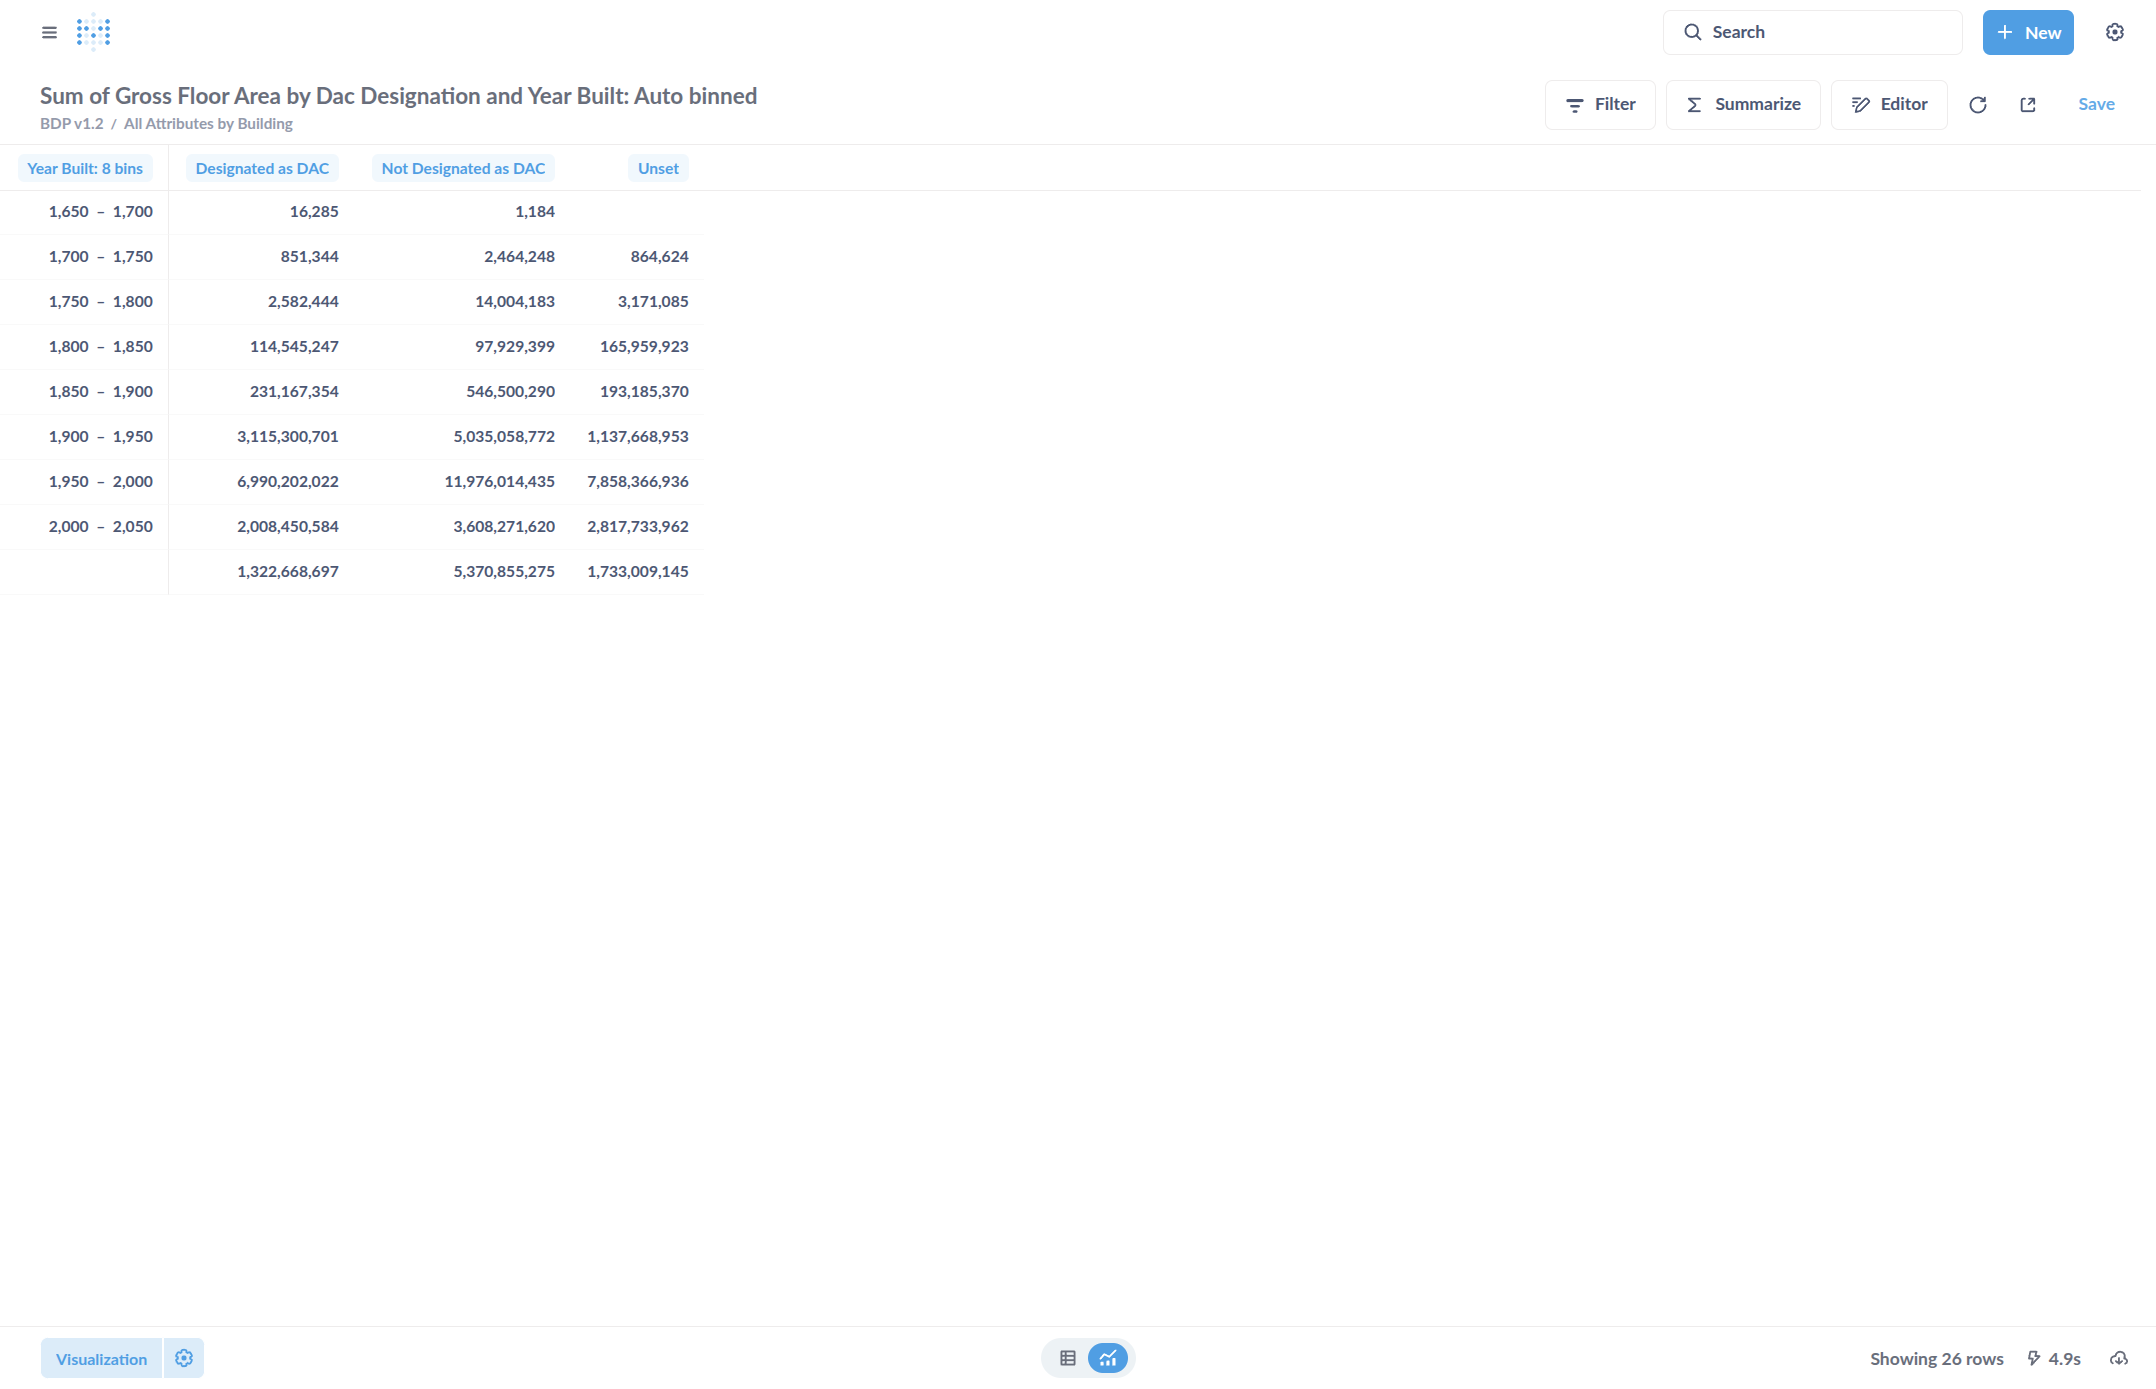
It has now automatically grouped the year built into different categories. This appears to be in 50-year increments. Then we have buildings designated as DAC and those not designated as DAC. Those are our two options, along with our total floor area. To save this, go to the top and click Save. You can then save it as a new summary table.
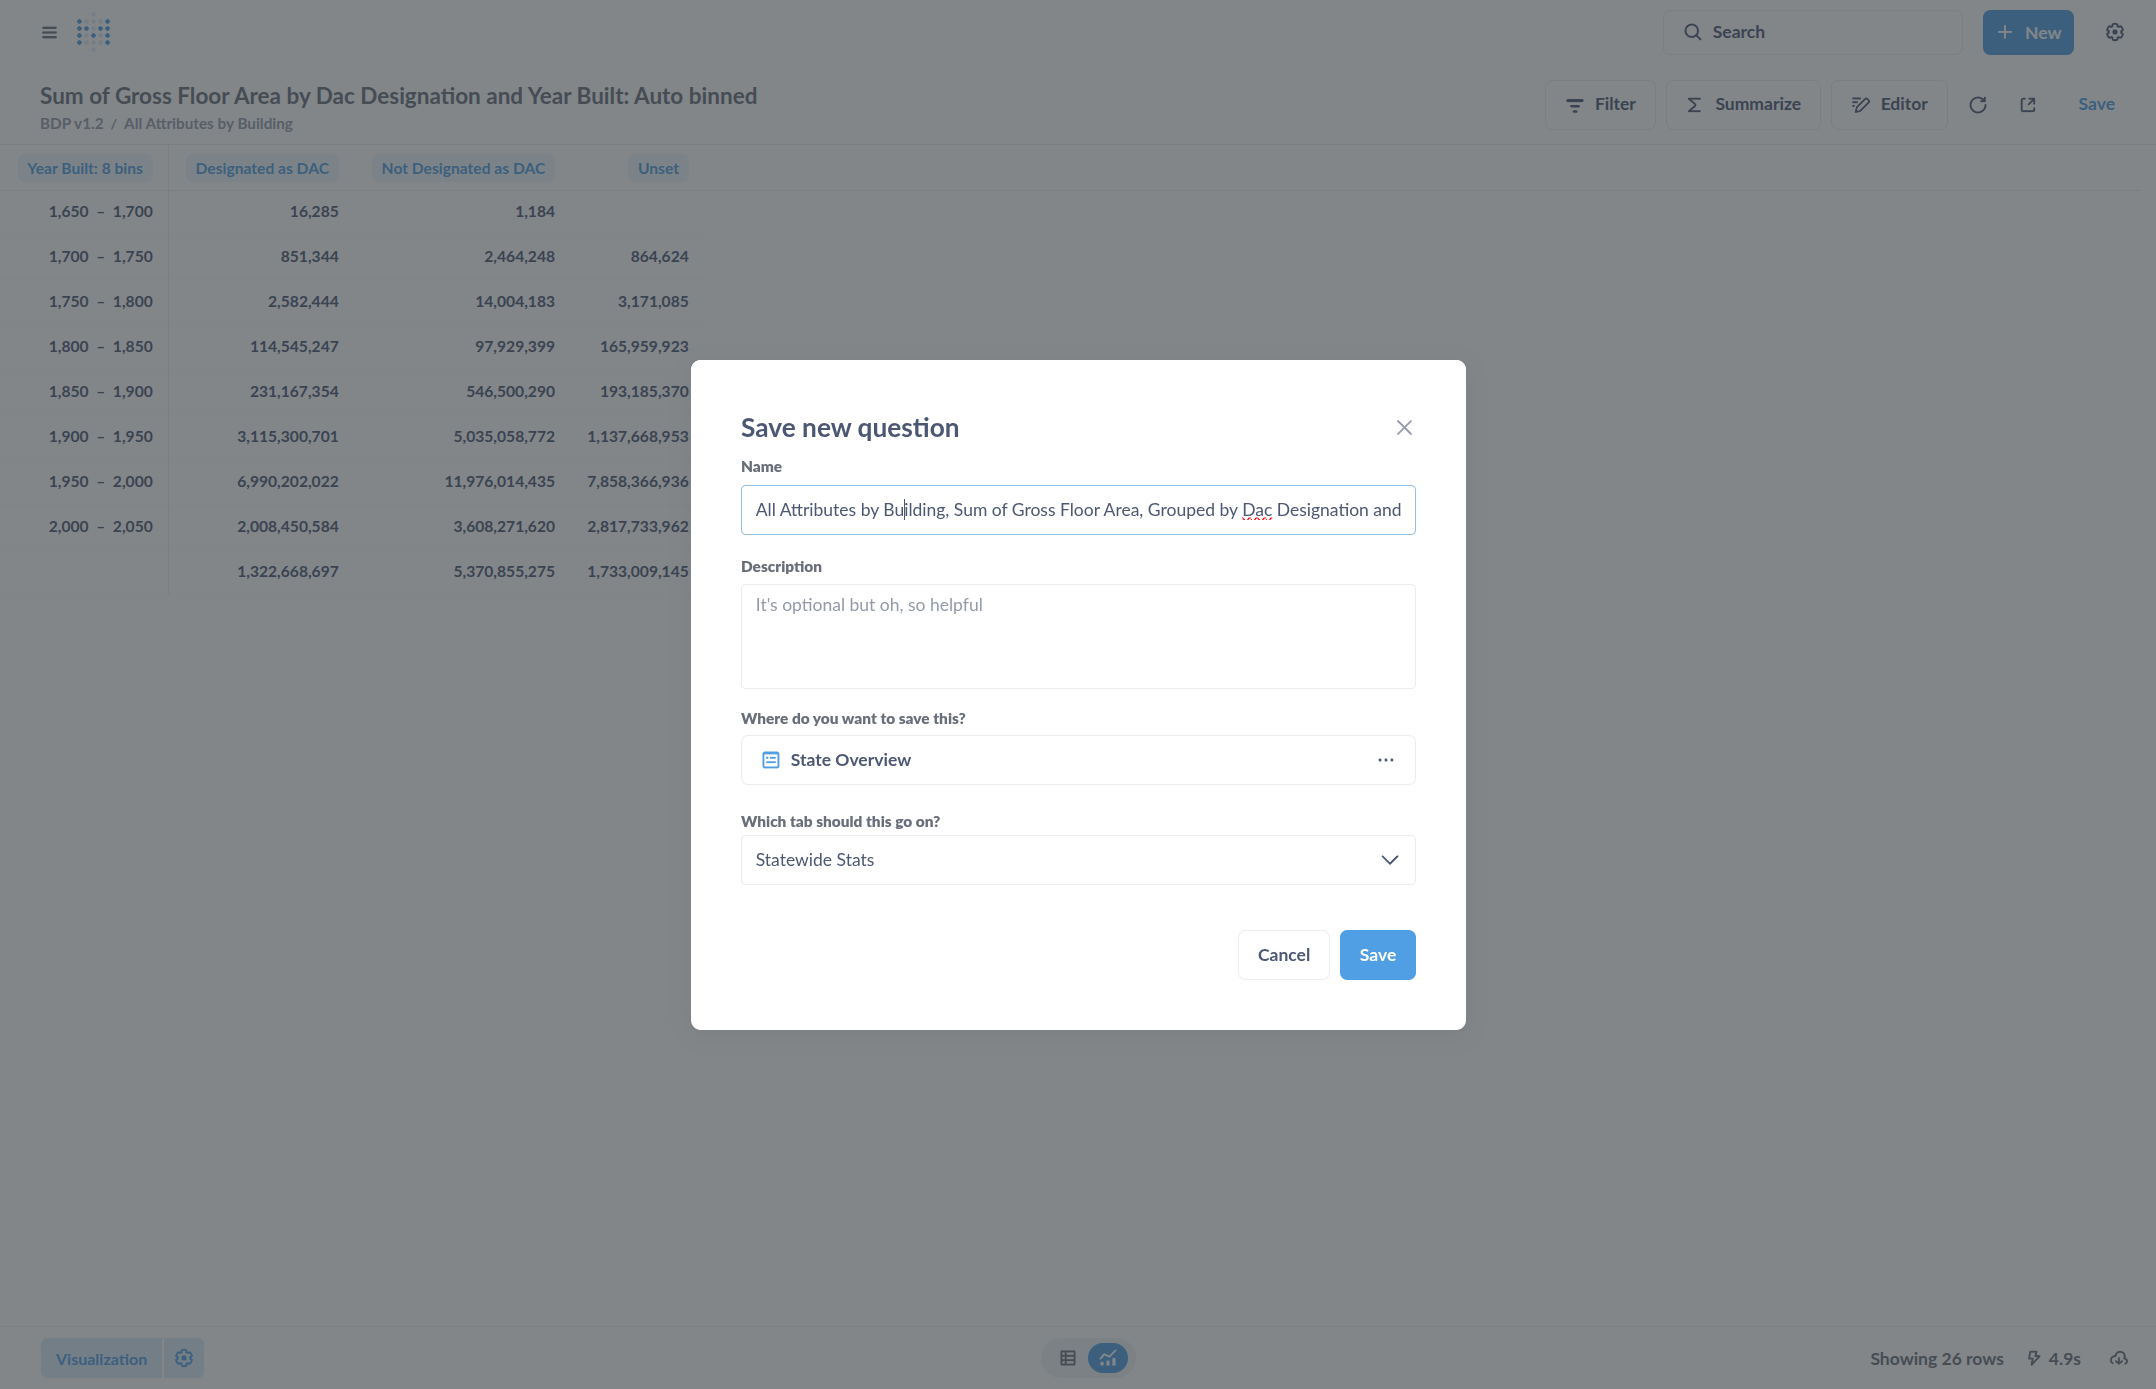
Then we click Save. Once it is saved you can come back and edit it later.