How to Use and Navigate the Sales Dashboard in Traction
Learn how to effectively use the sales dashboard in Traction. Discover how to navigate statuses, filter opportunities, view statistics, and manage your sales pipeline for better results.
By Dominik Black
In this guide, we'll learn how to navigate and use the sales dashboard on your Traction page. Understanding the dashboard helps you track sales opportunities, view their statuses, and manage your workflow. You will also see how to filter opportunities, check statistics, and access other users' dashboards for better sales management.
Let's get started
1
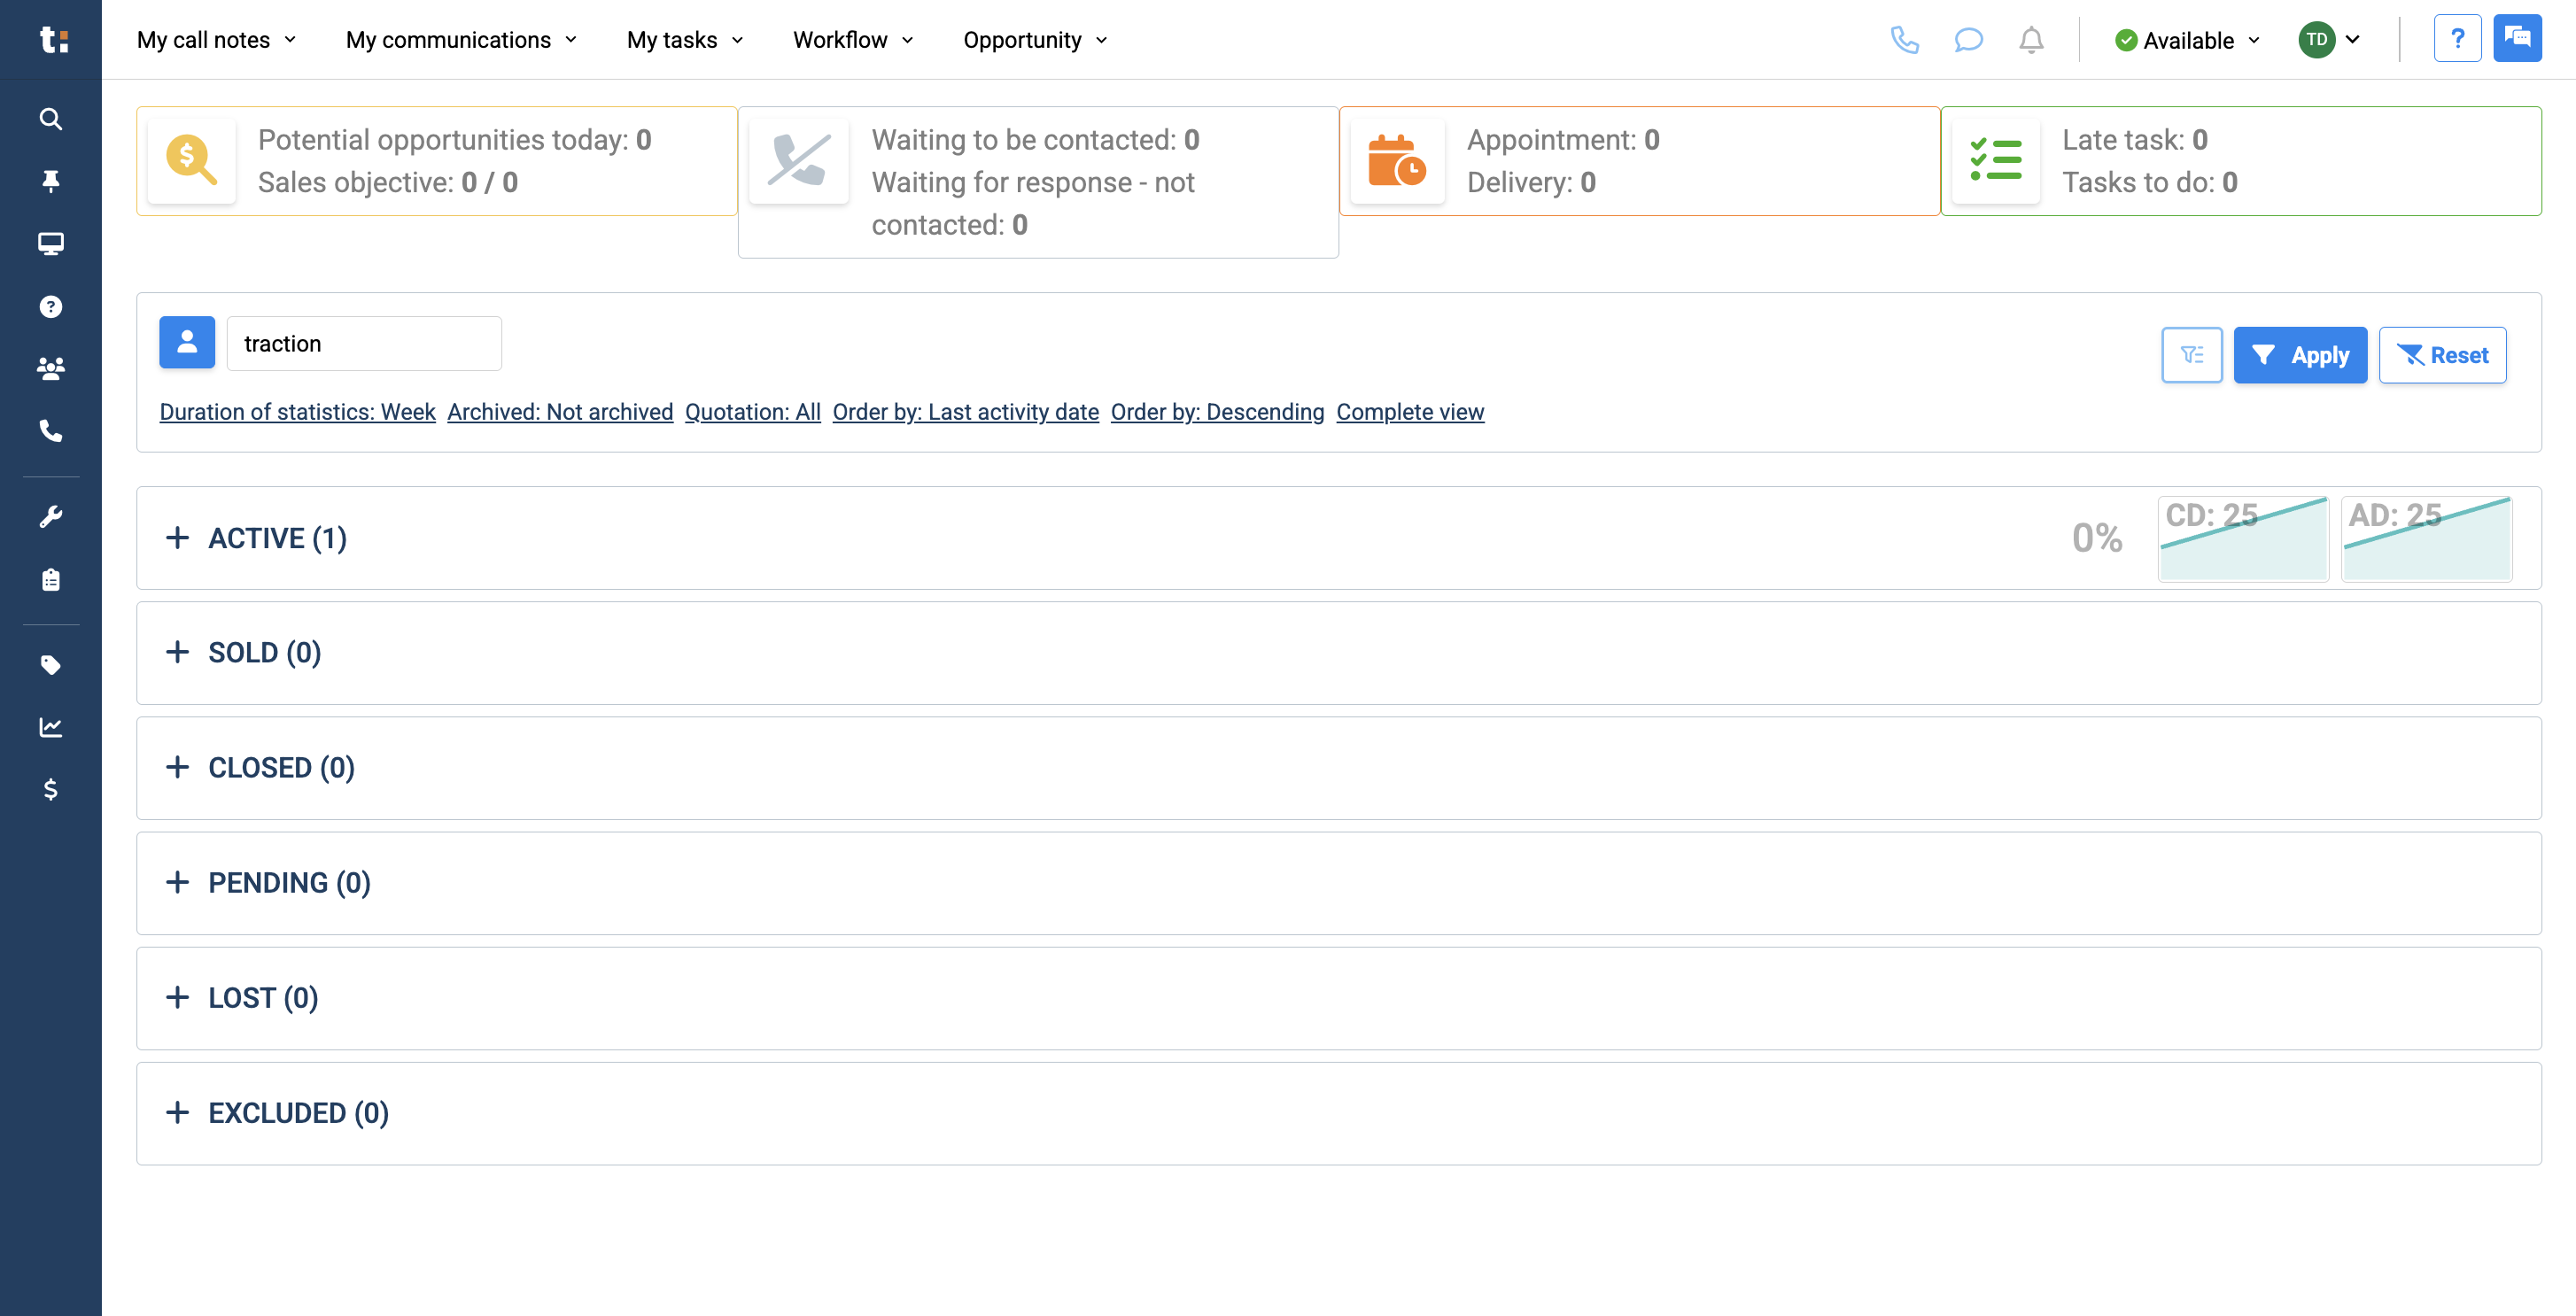
In this article, we will review the sales dashboard. By default, your Traction page opens to your sales dashboard.
2
If you are on another page and want to return to your sales dashboard, there are two ways to do so. Click the Traction logo to return to your dashboard.
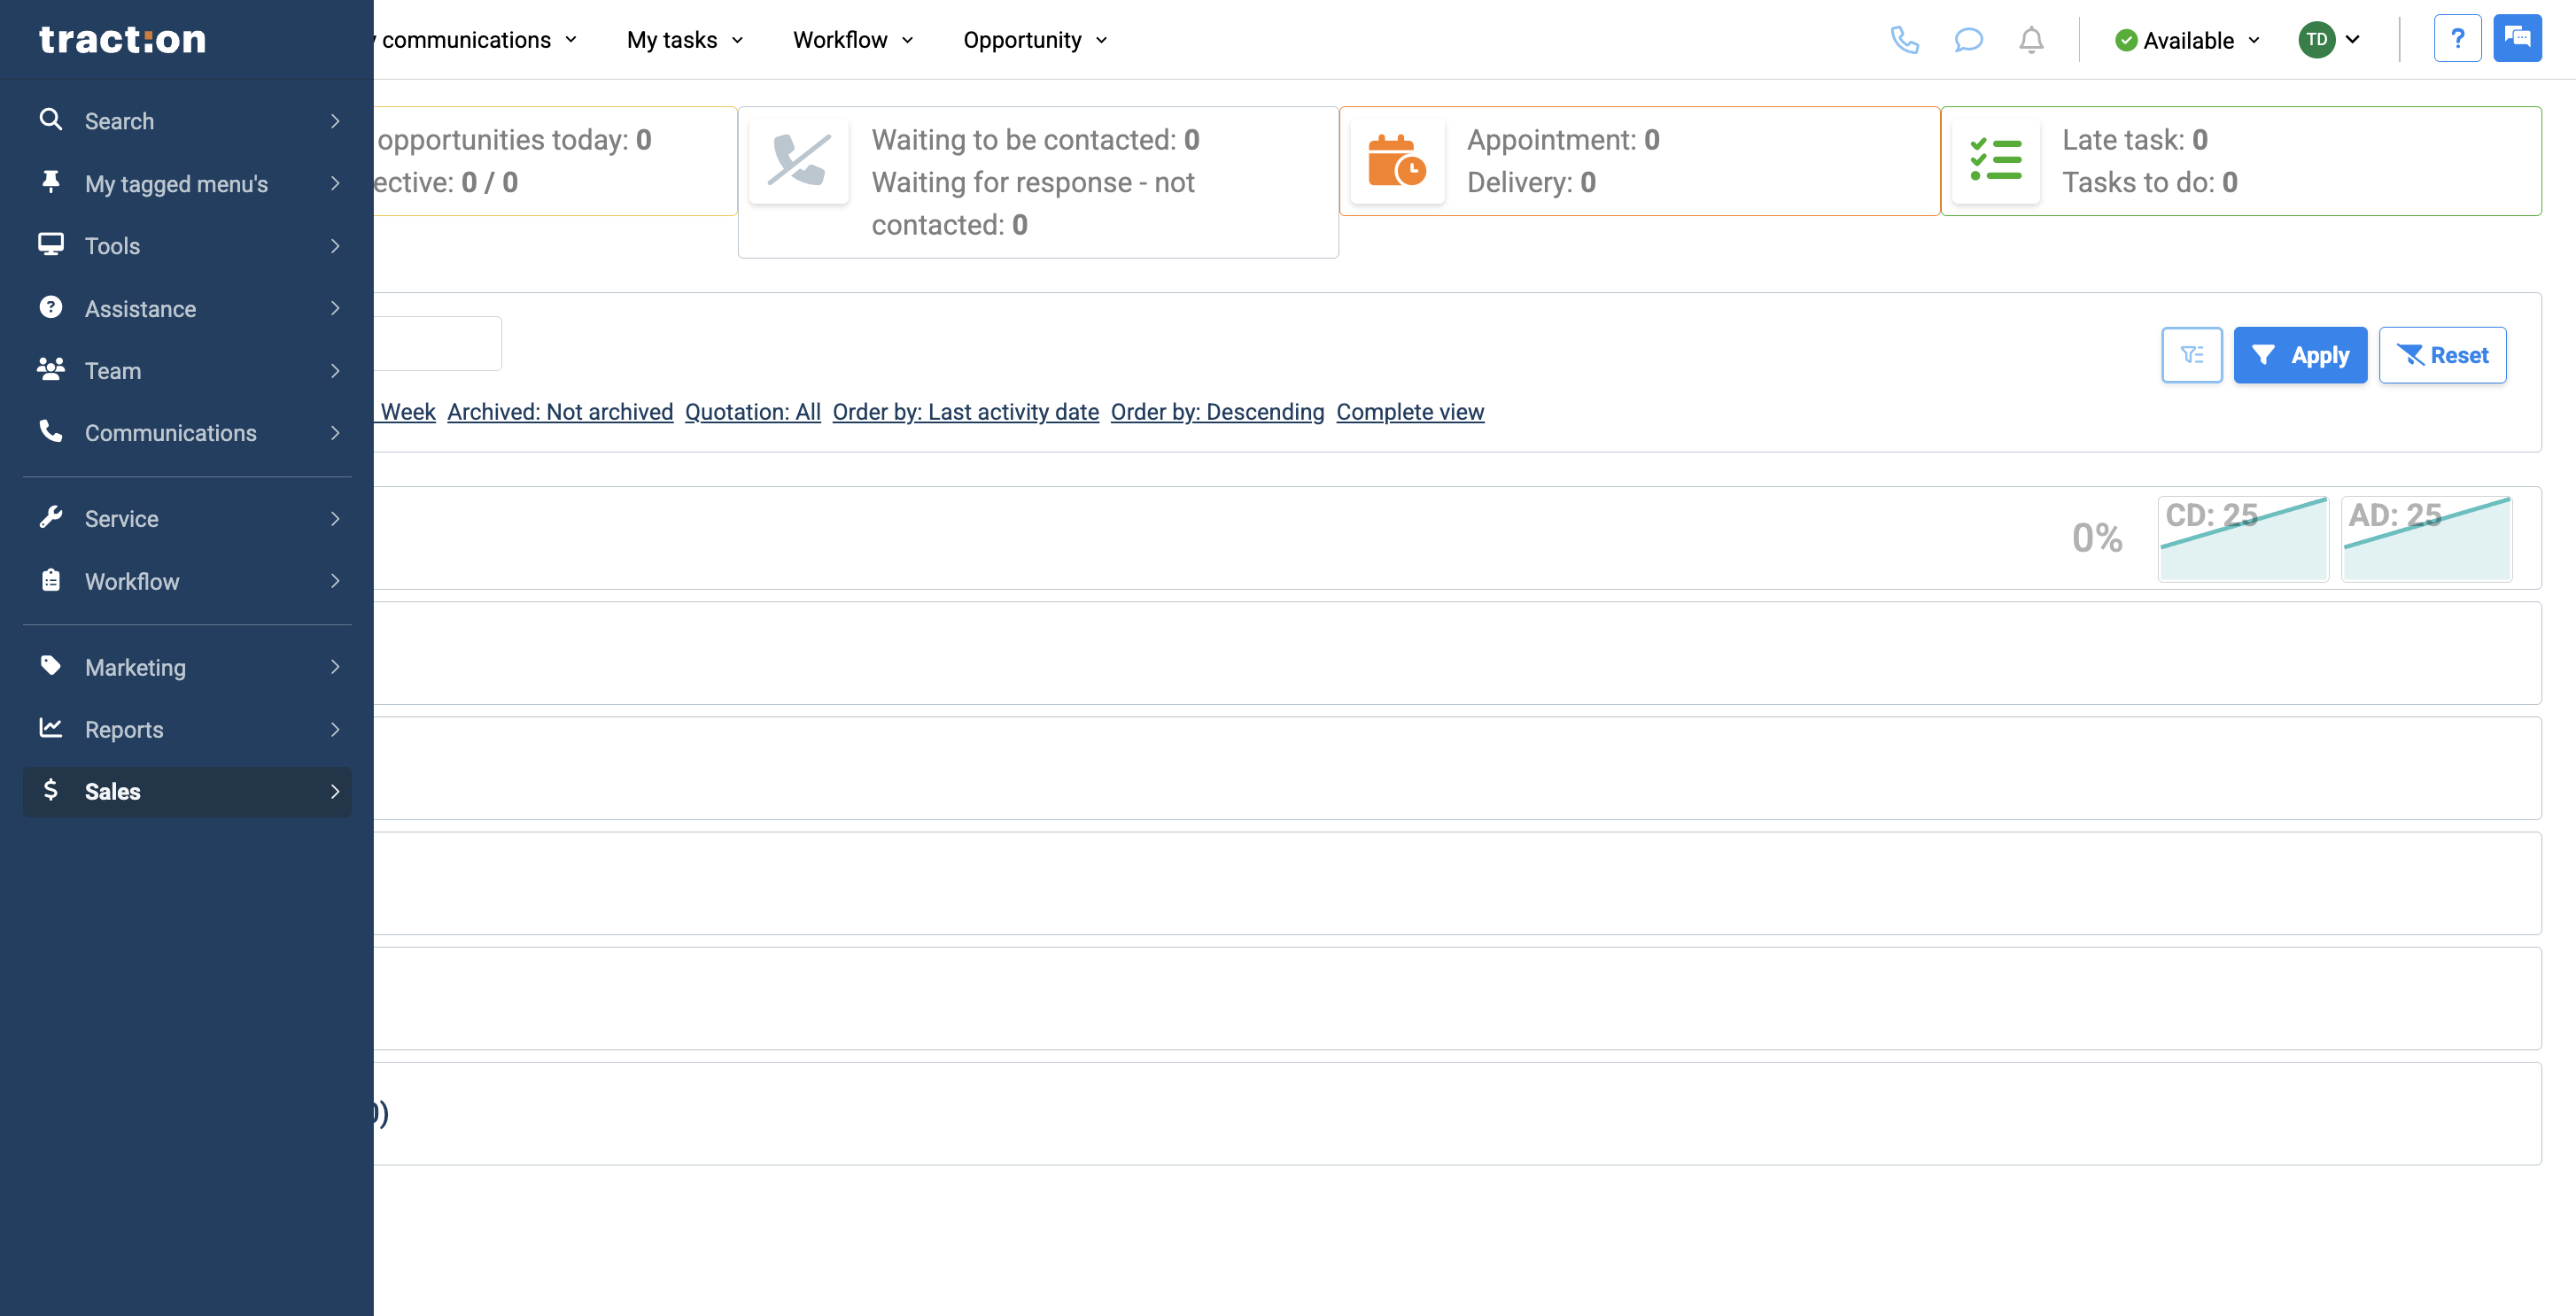
3
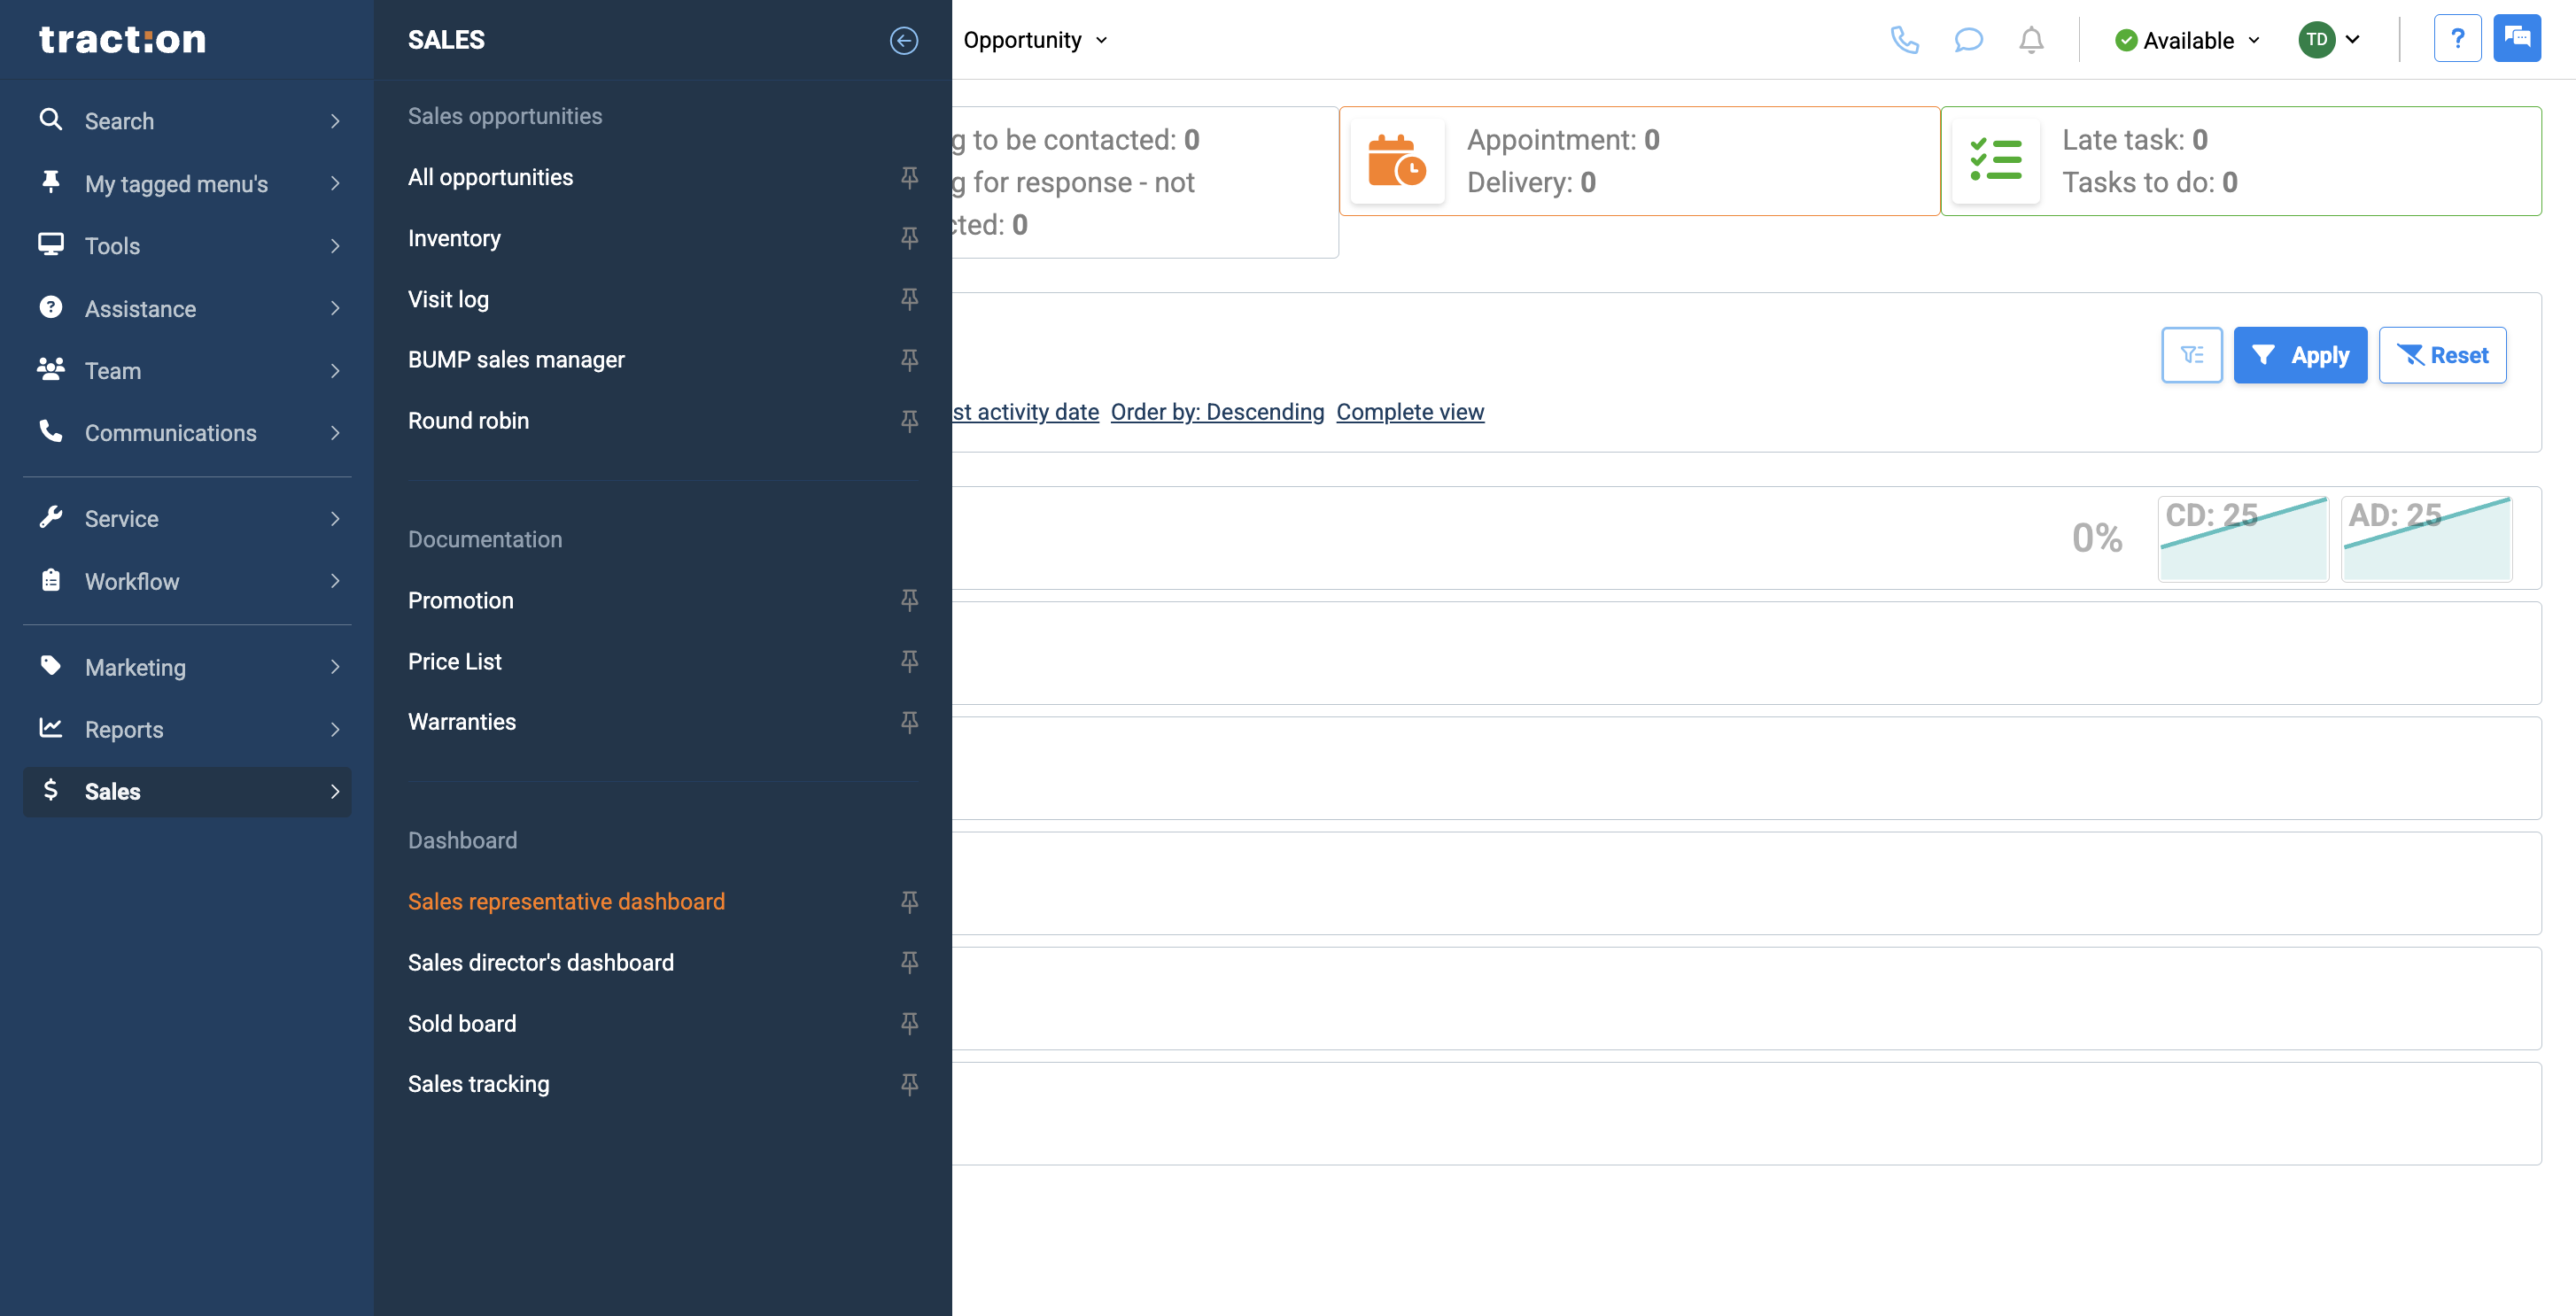
Alternatively, find your module in the Sales module or the Sales Representative dashboard.
4
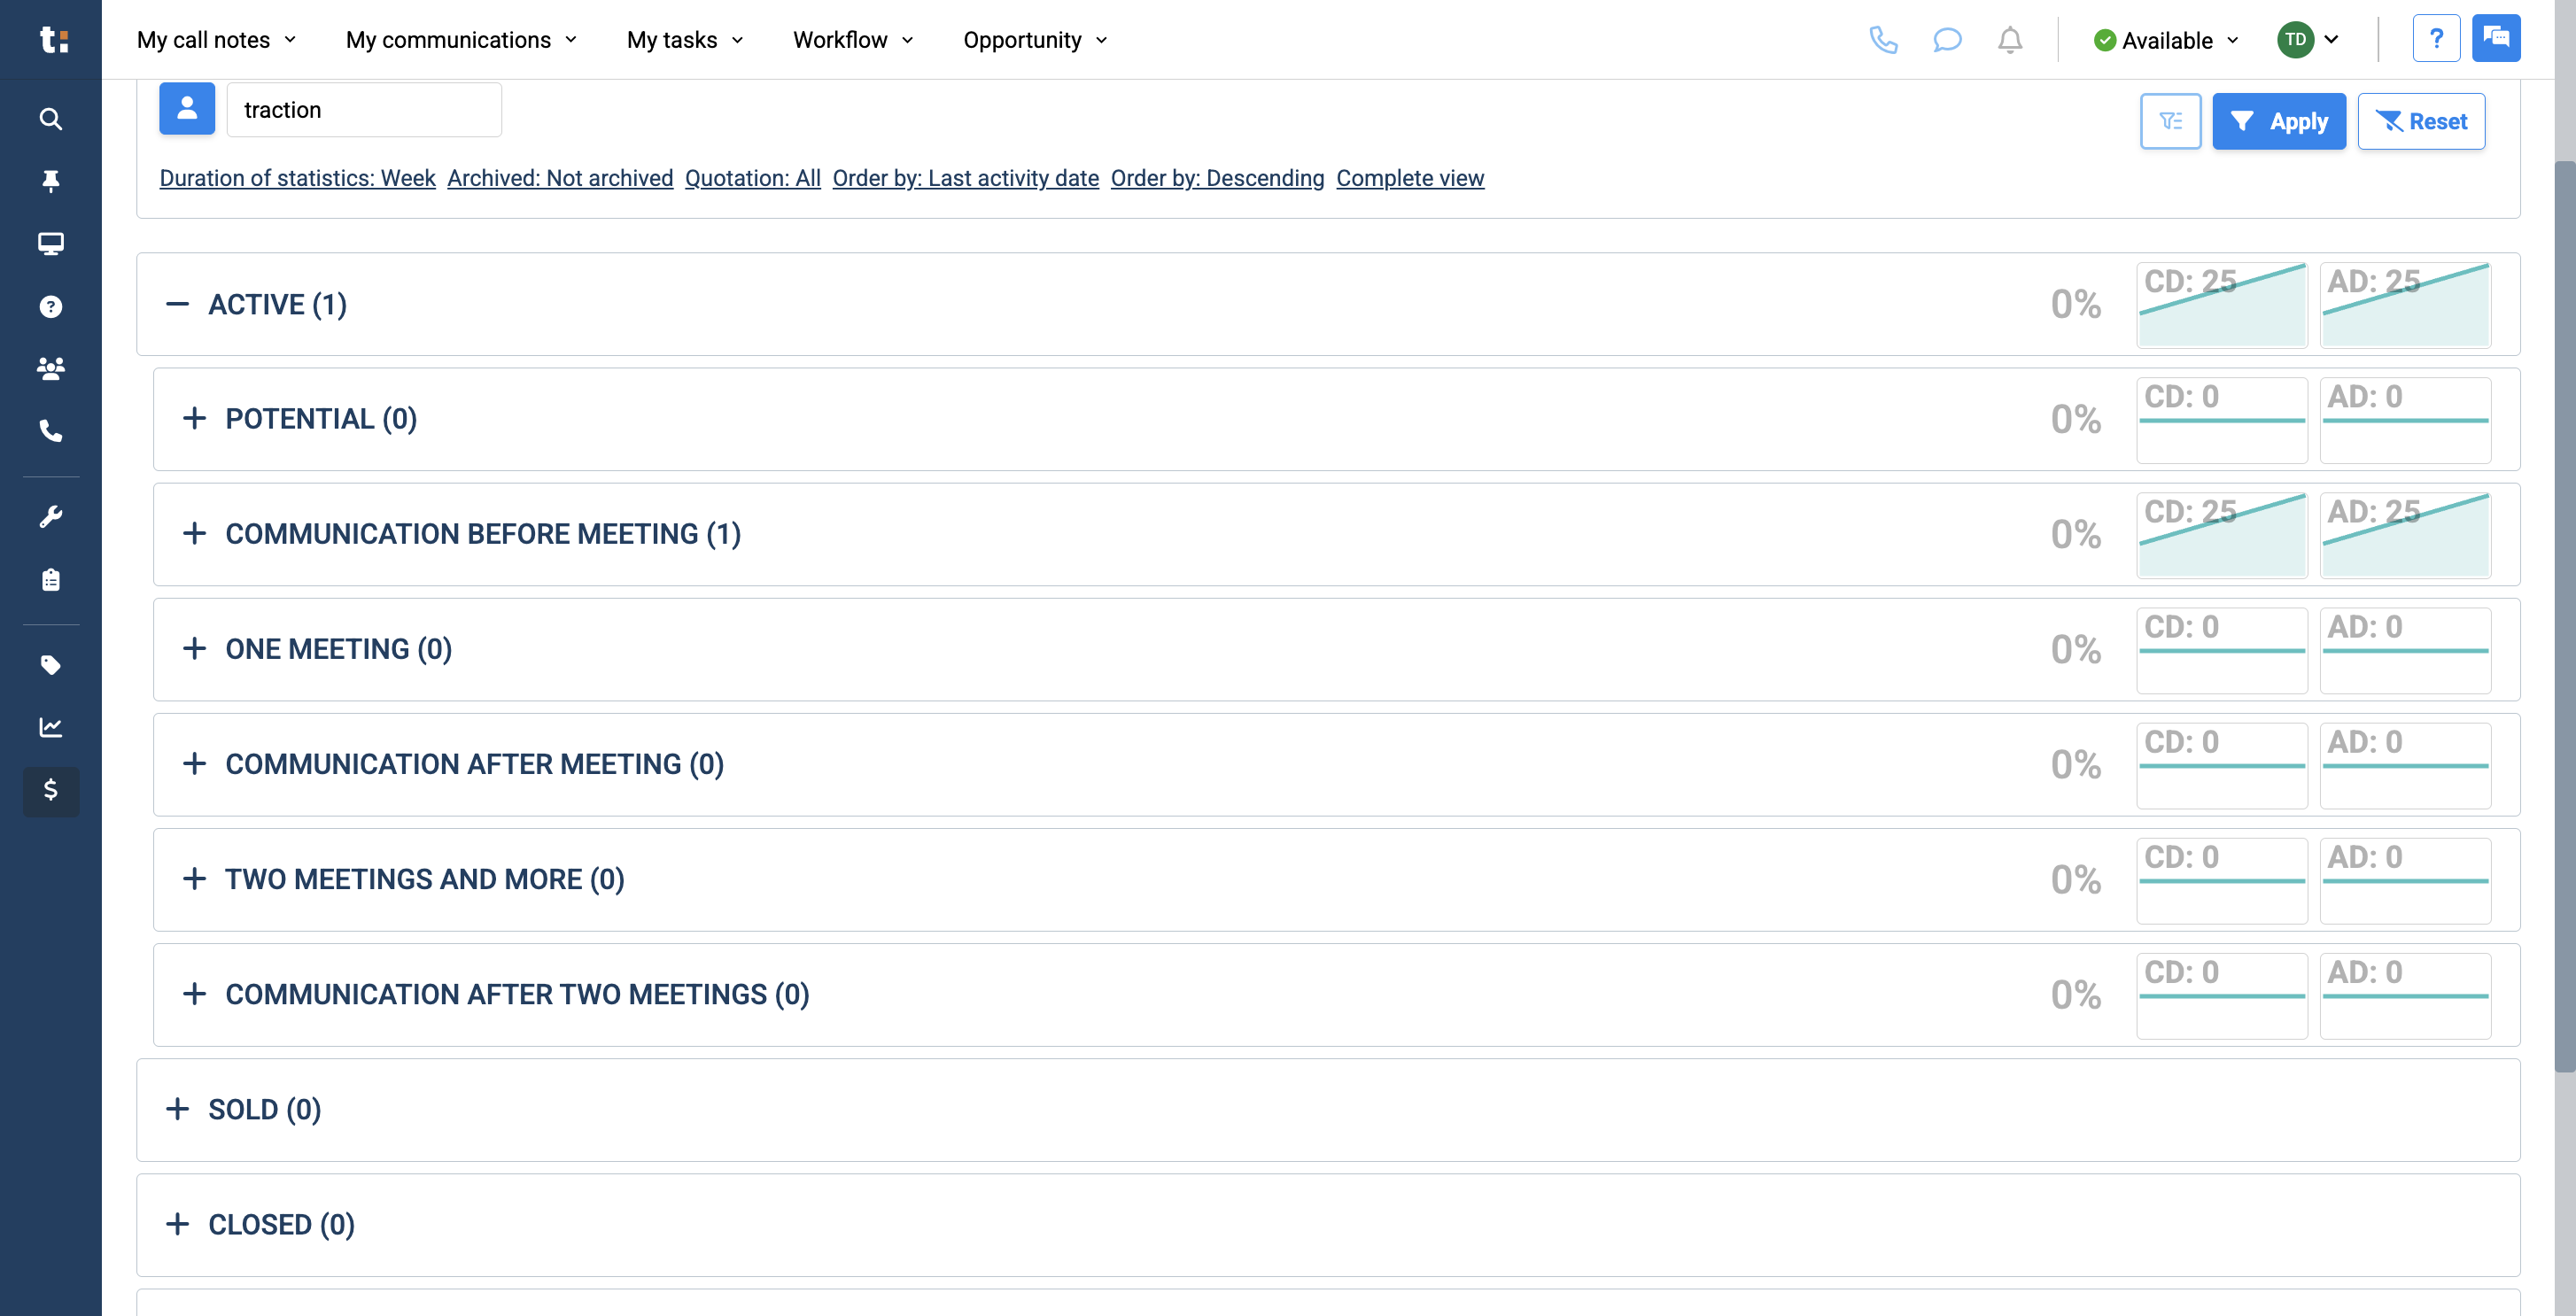
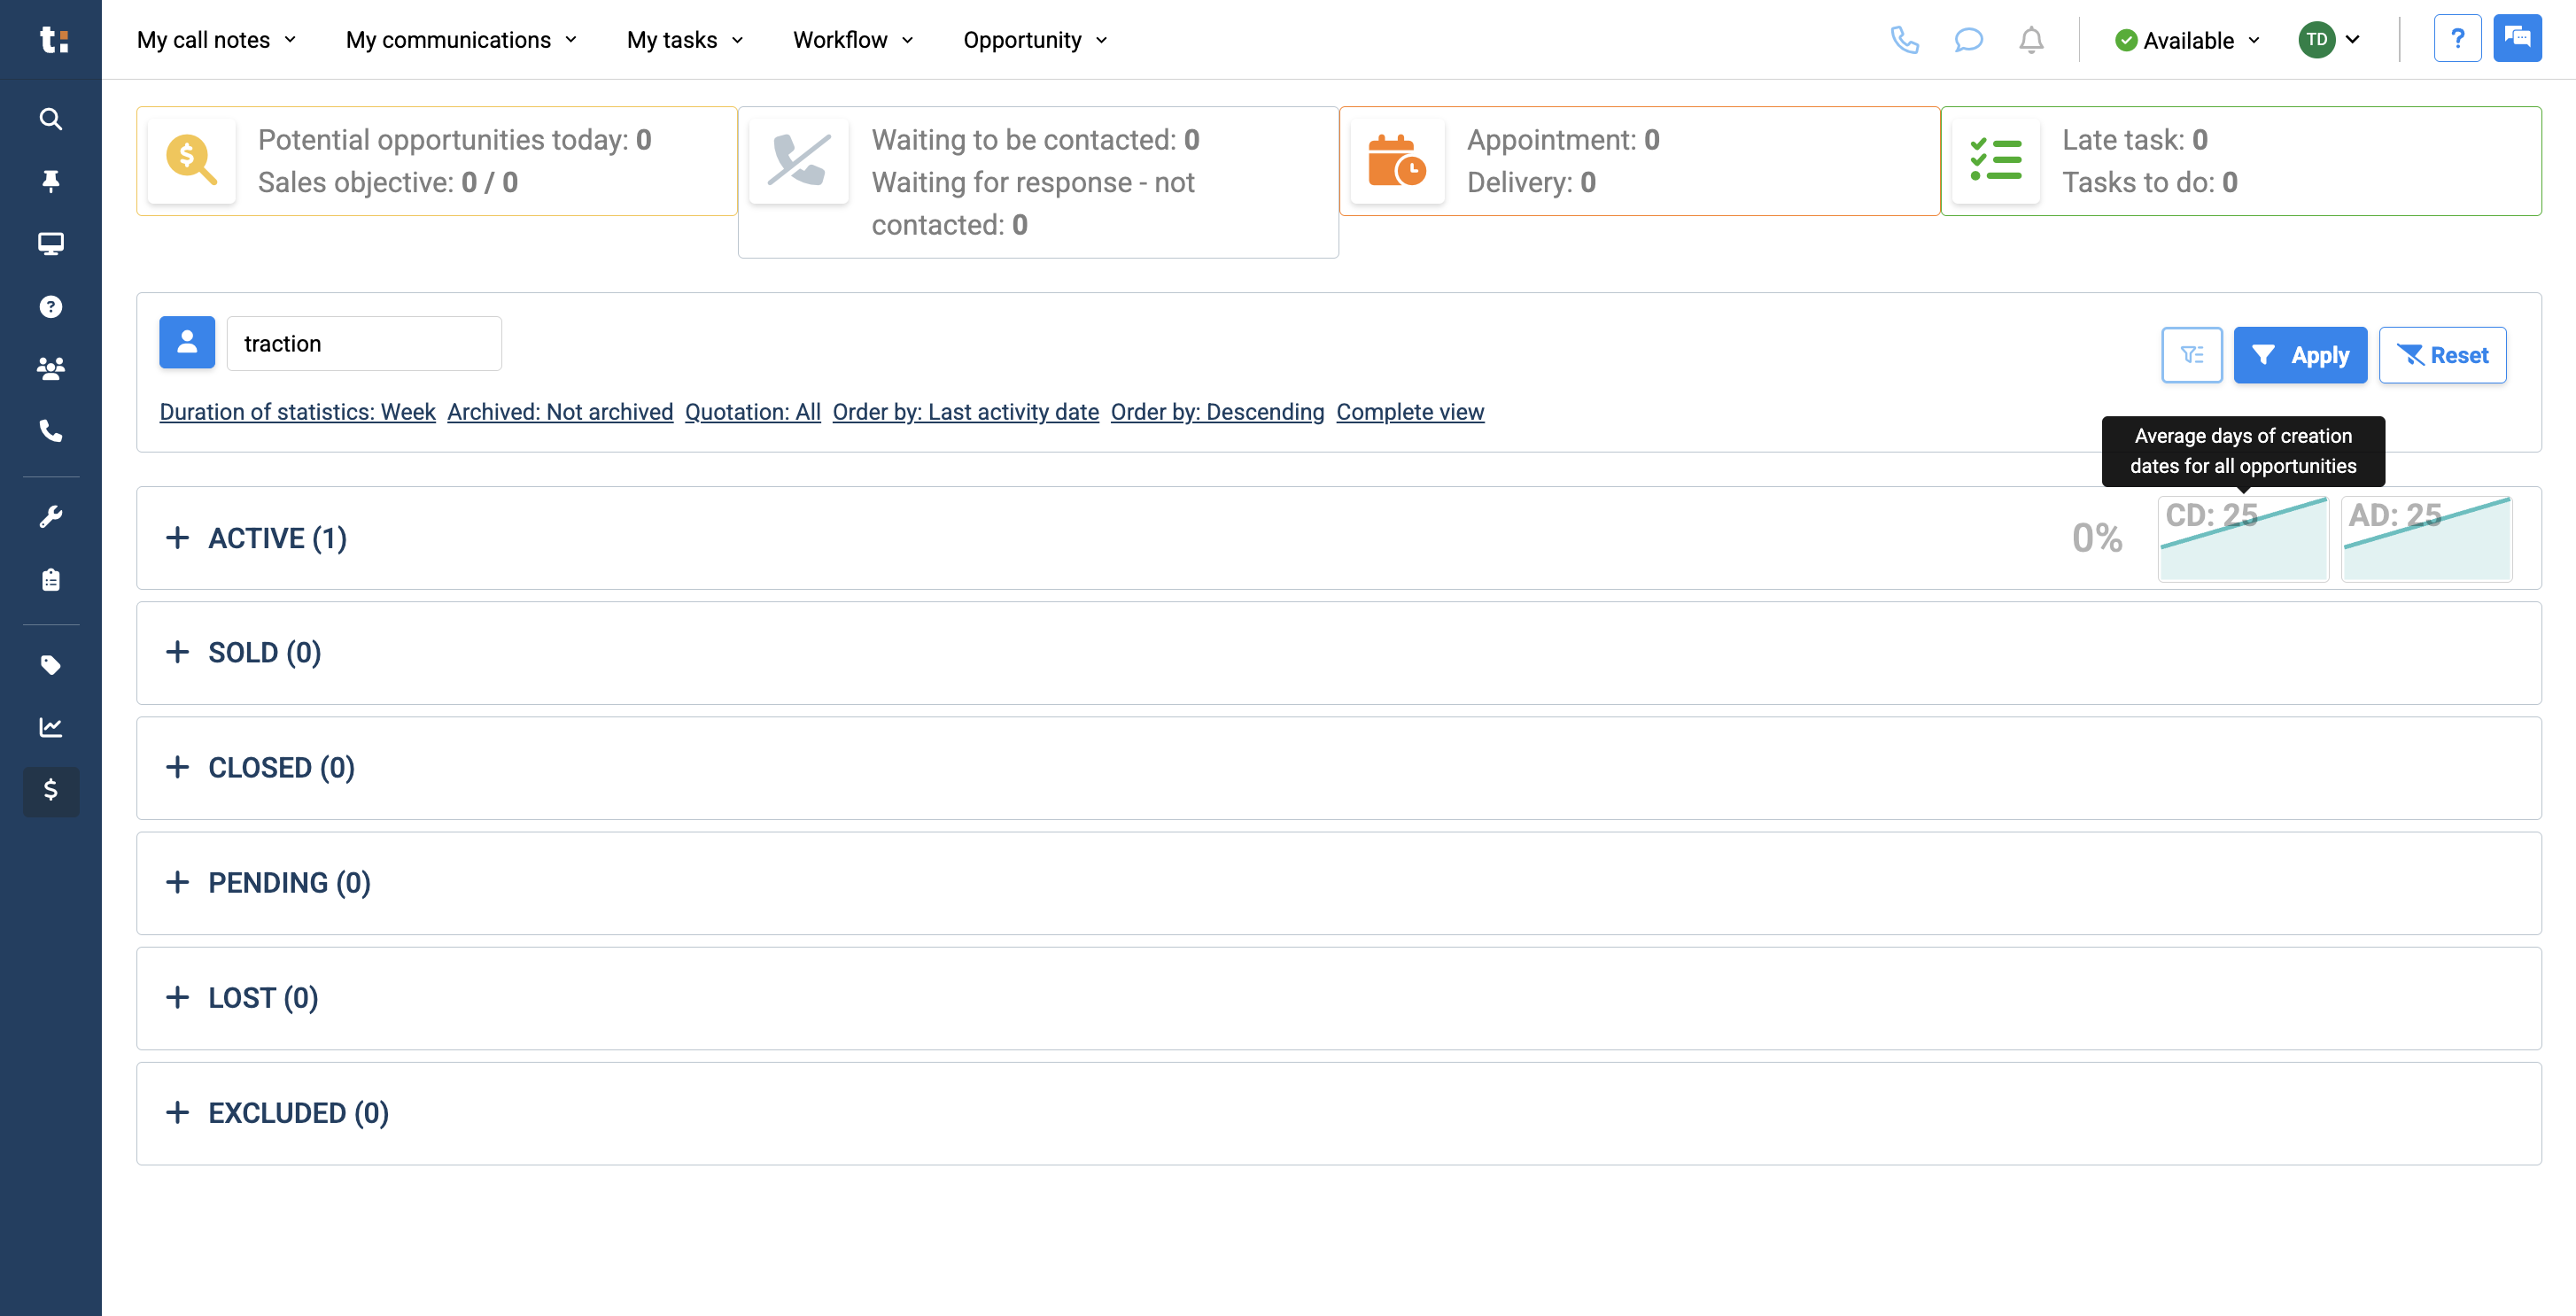
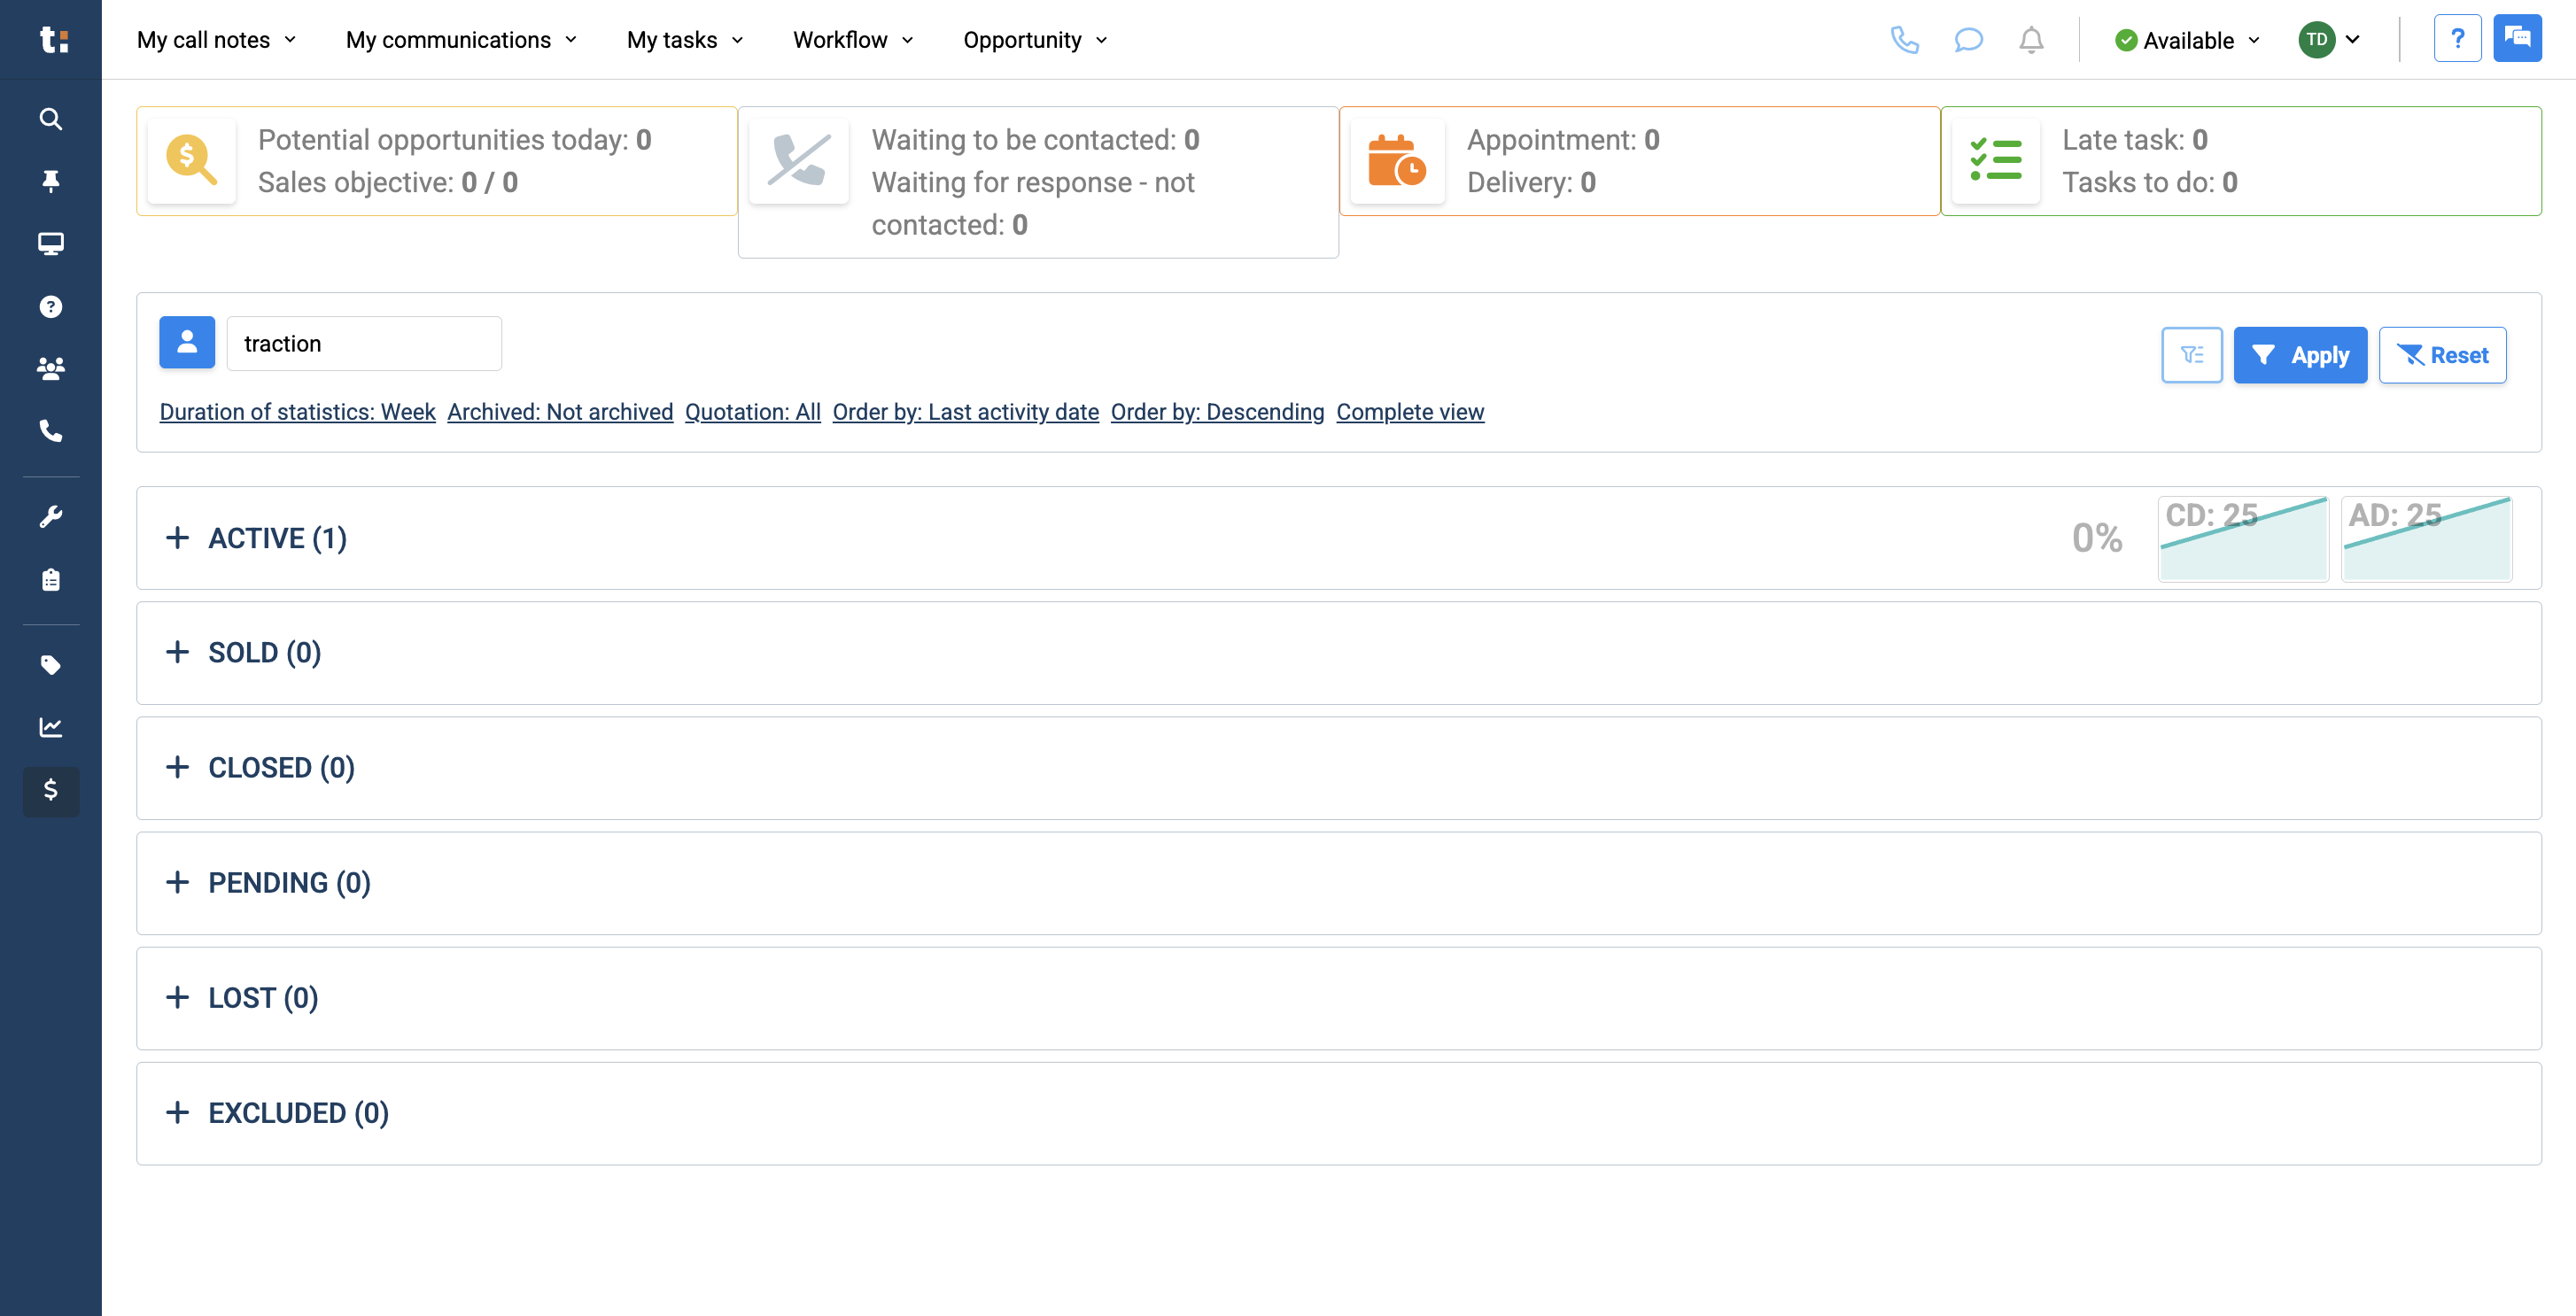
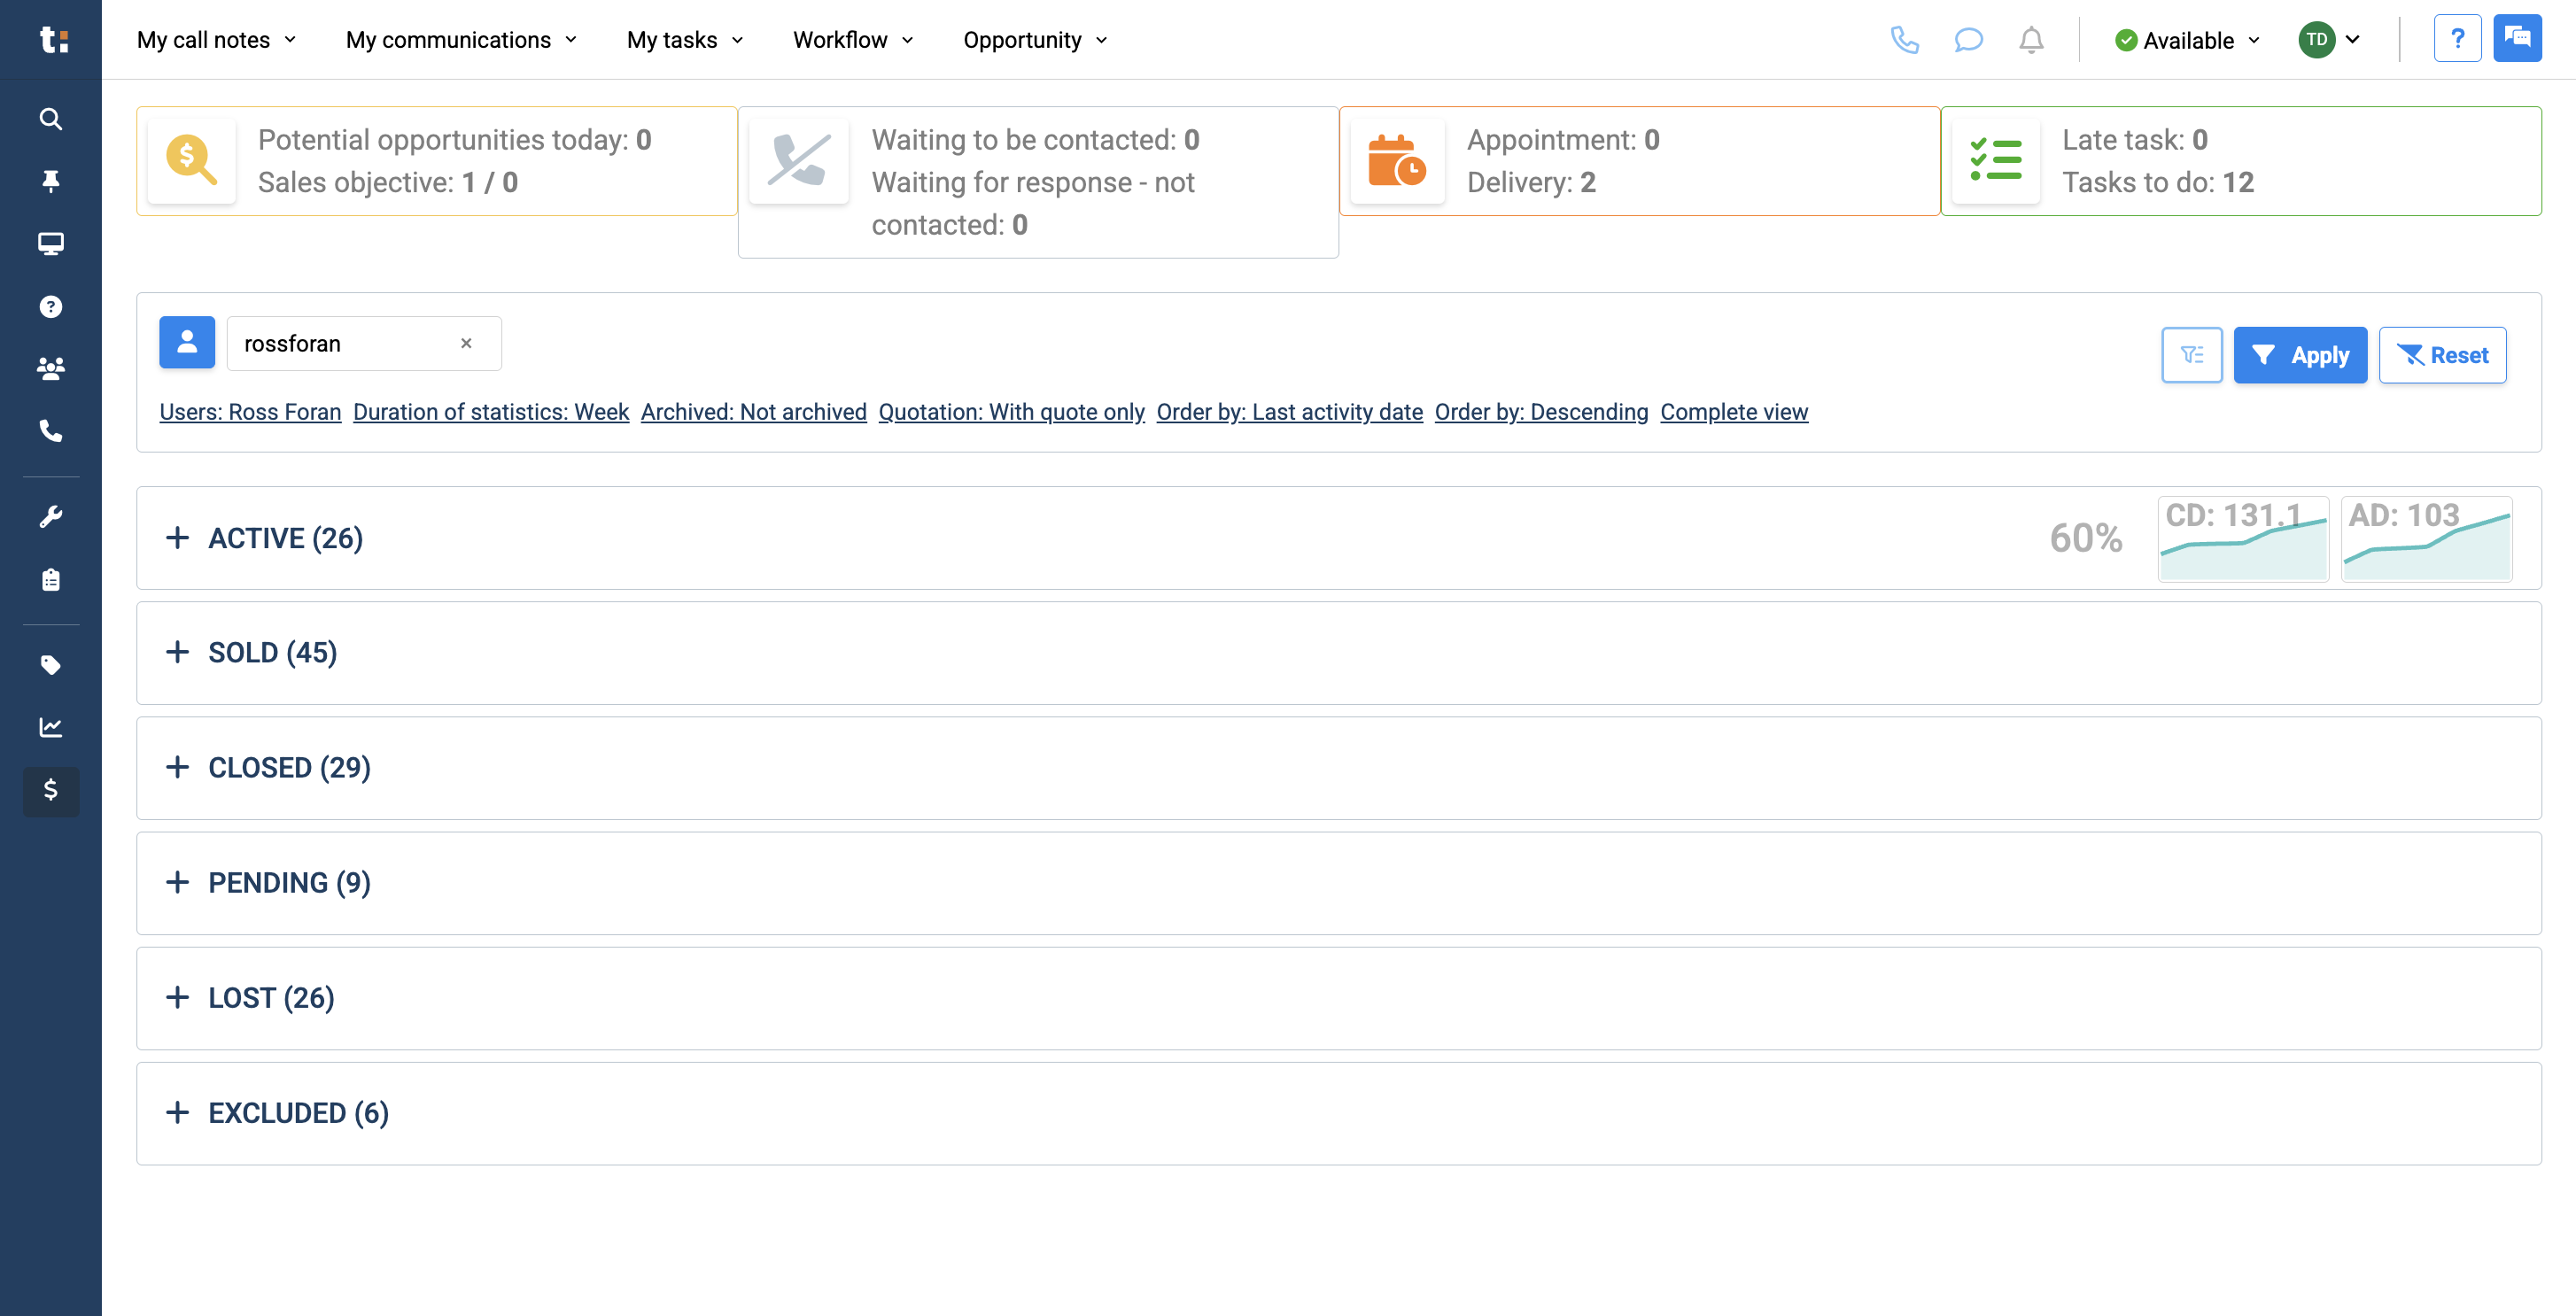
Here, you will see various statuses showing how all your sales opportunities are classified.
5
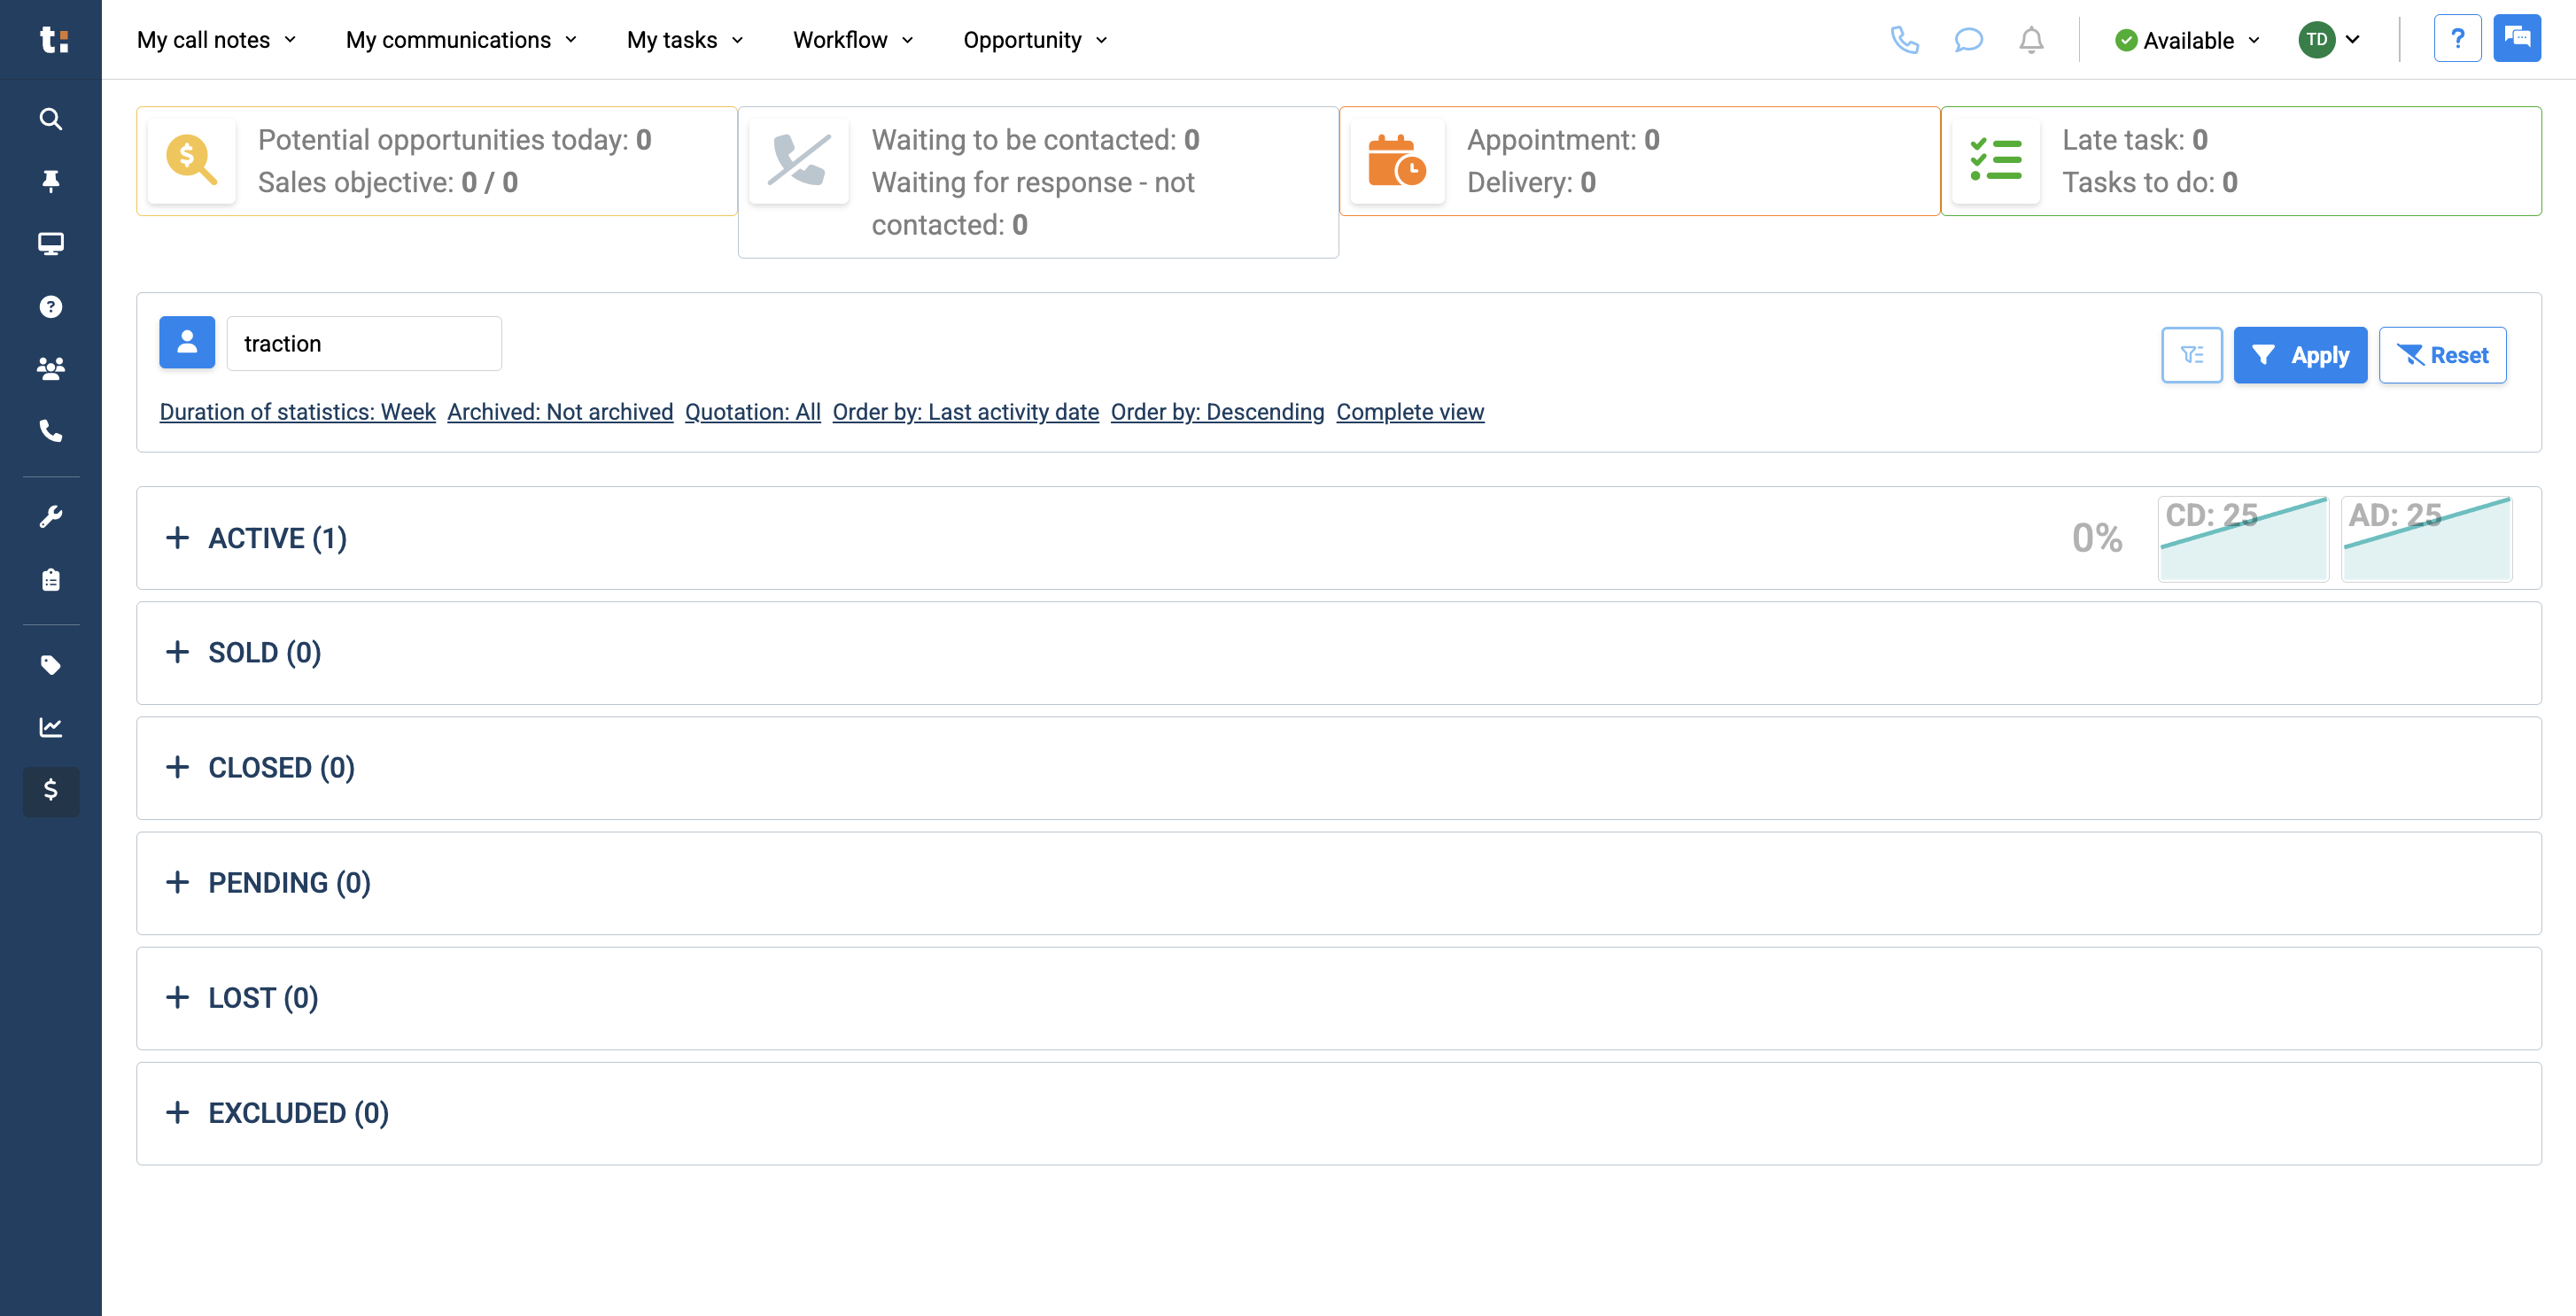
Next to each status name, you will see a number showing how many cards are in that status. Clicking on a status shows its related subcategories. This helps you classify any type of card more accurately.

6
Your active status applies to items you are currently working on that have not been sold yet.
7
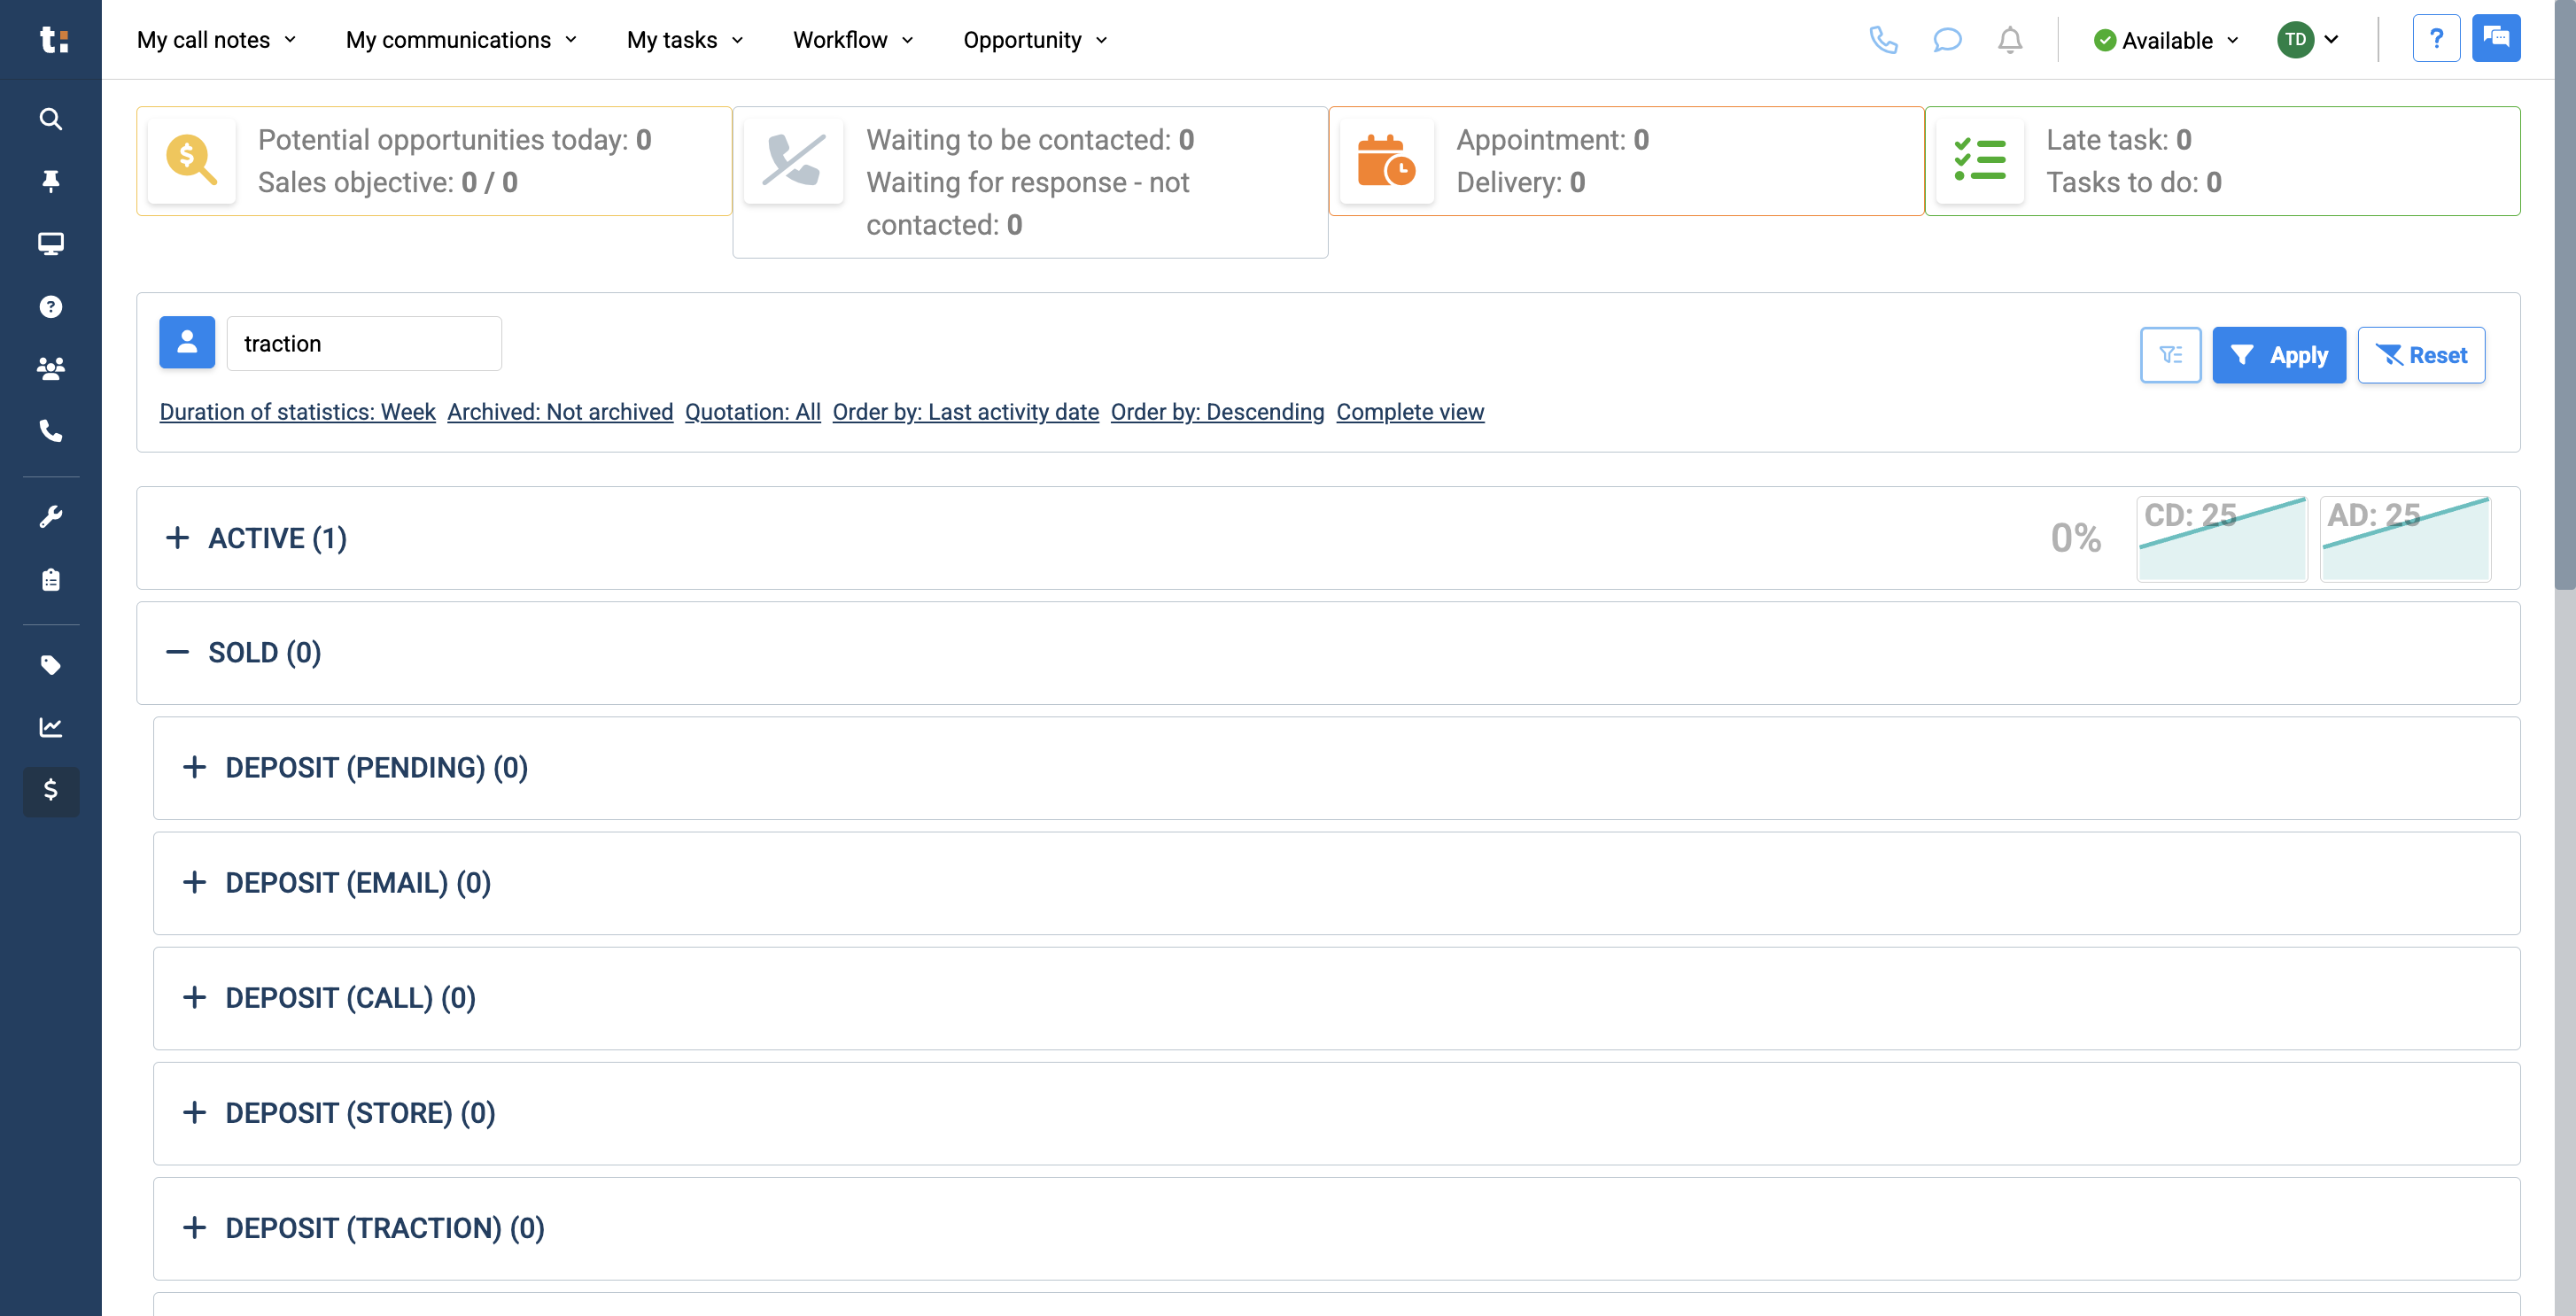
Sold status is for any opportunities that have been sold.
8
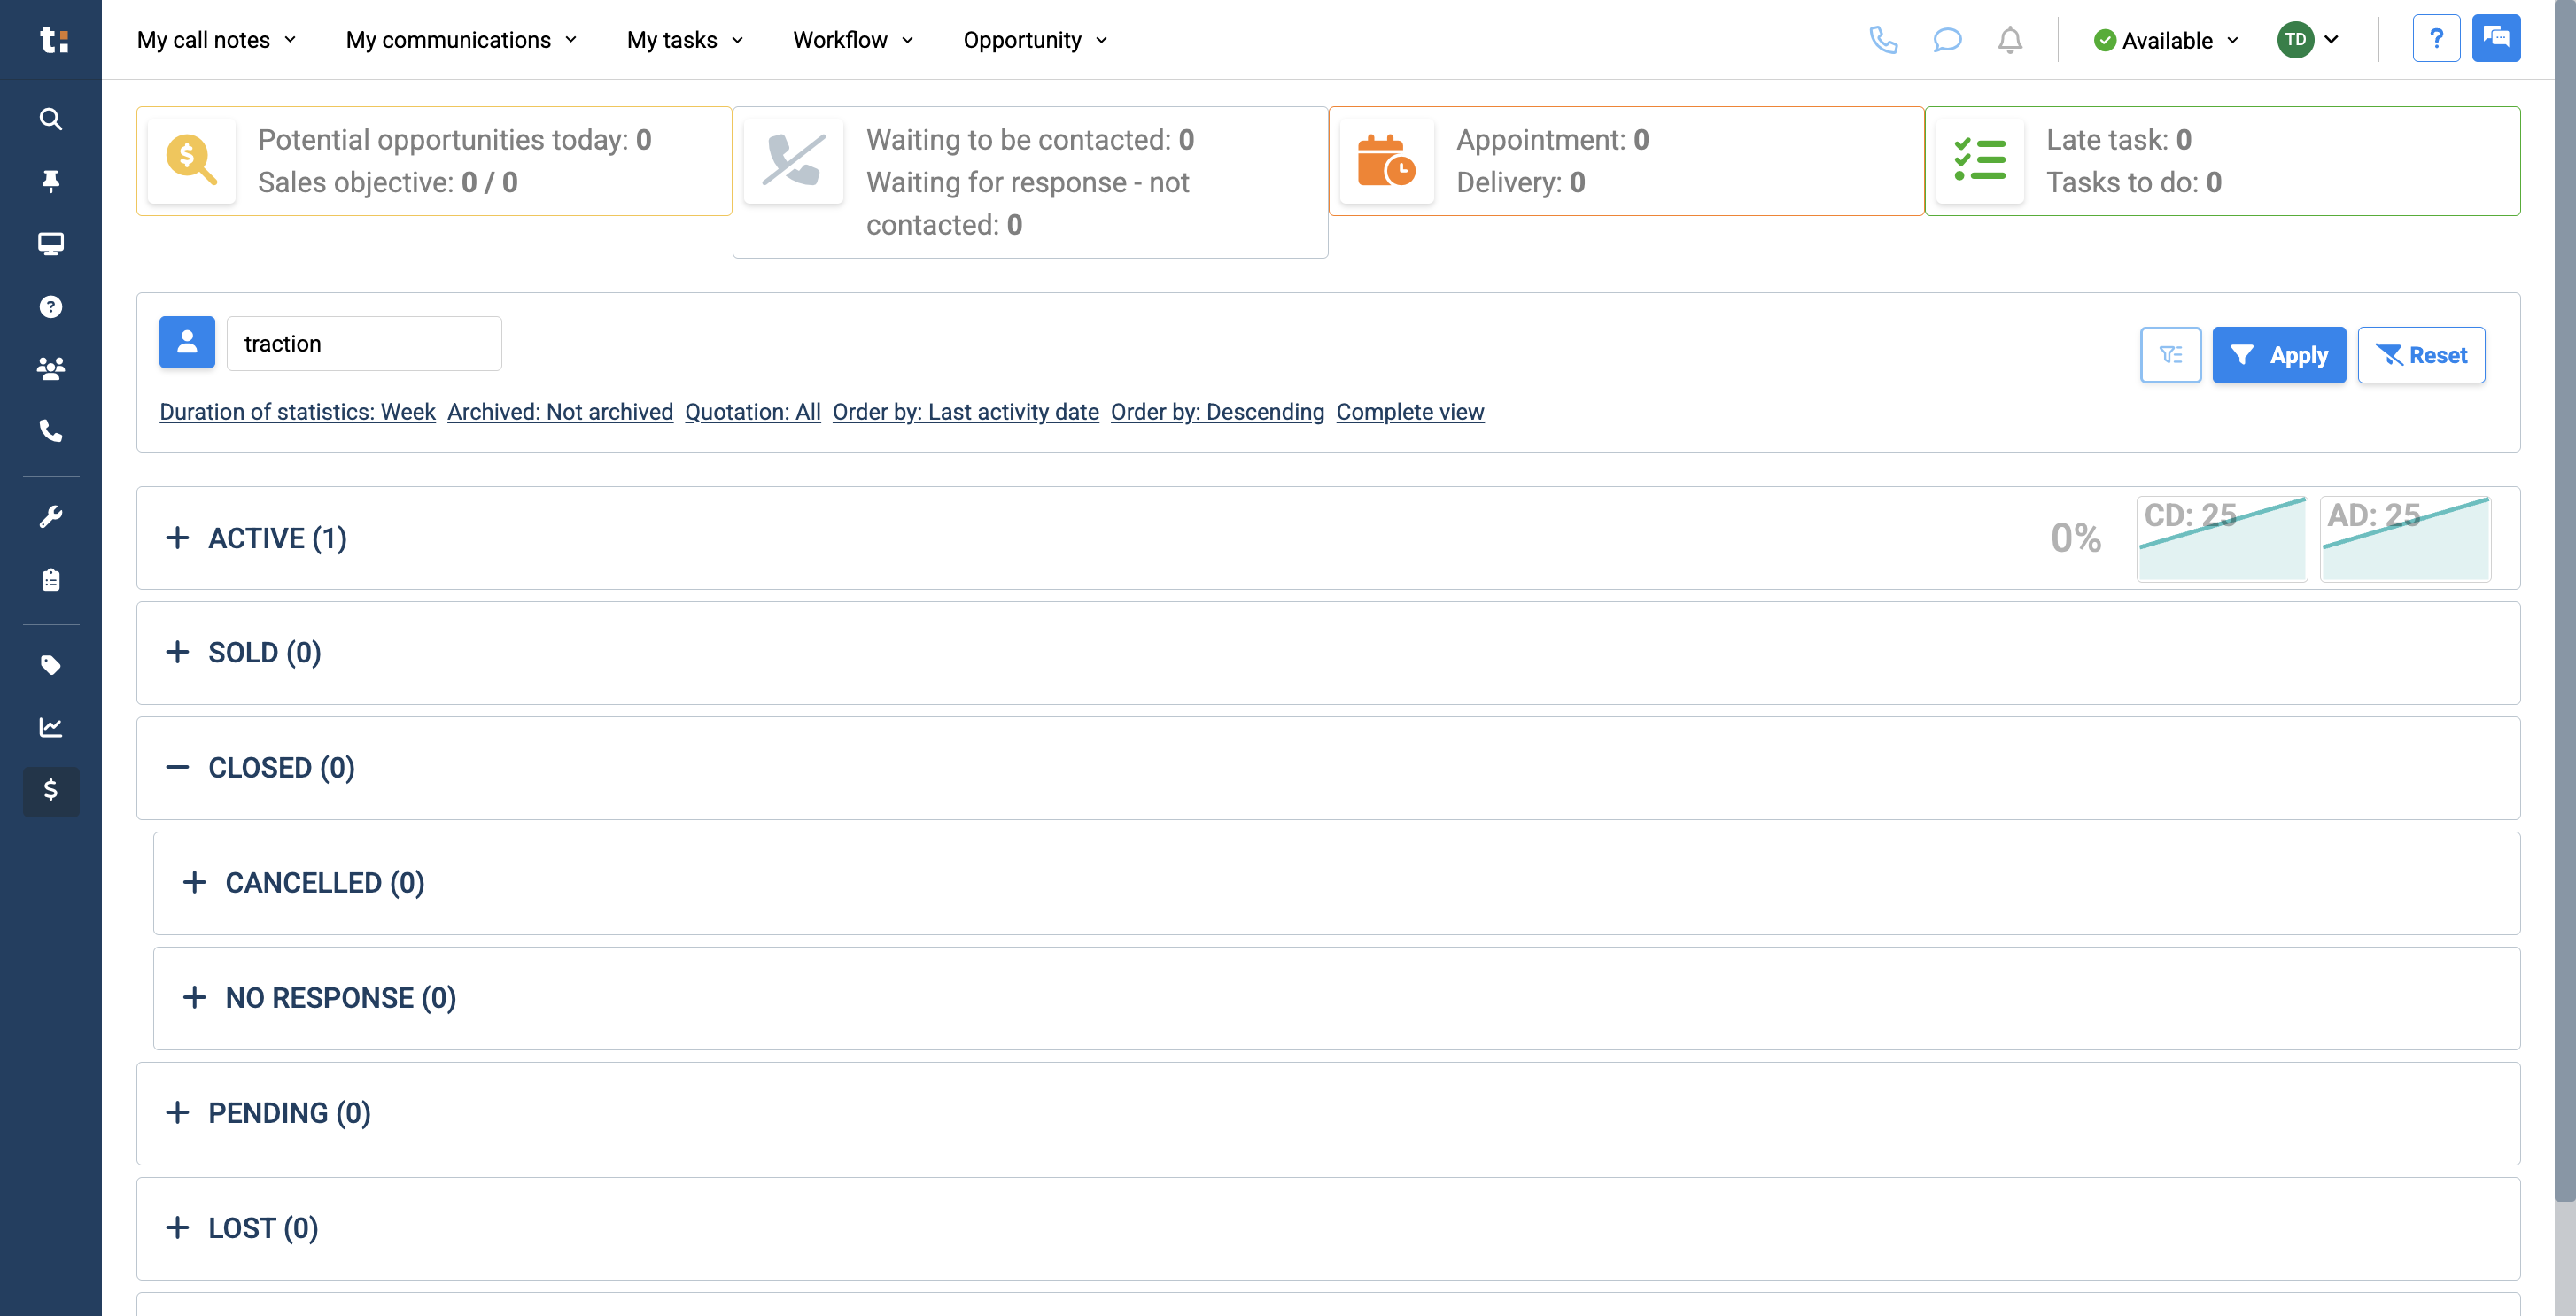
Closed status refers to a sale that has been canceled.
9
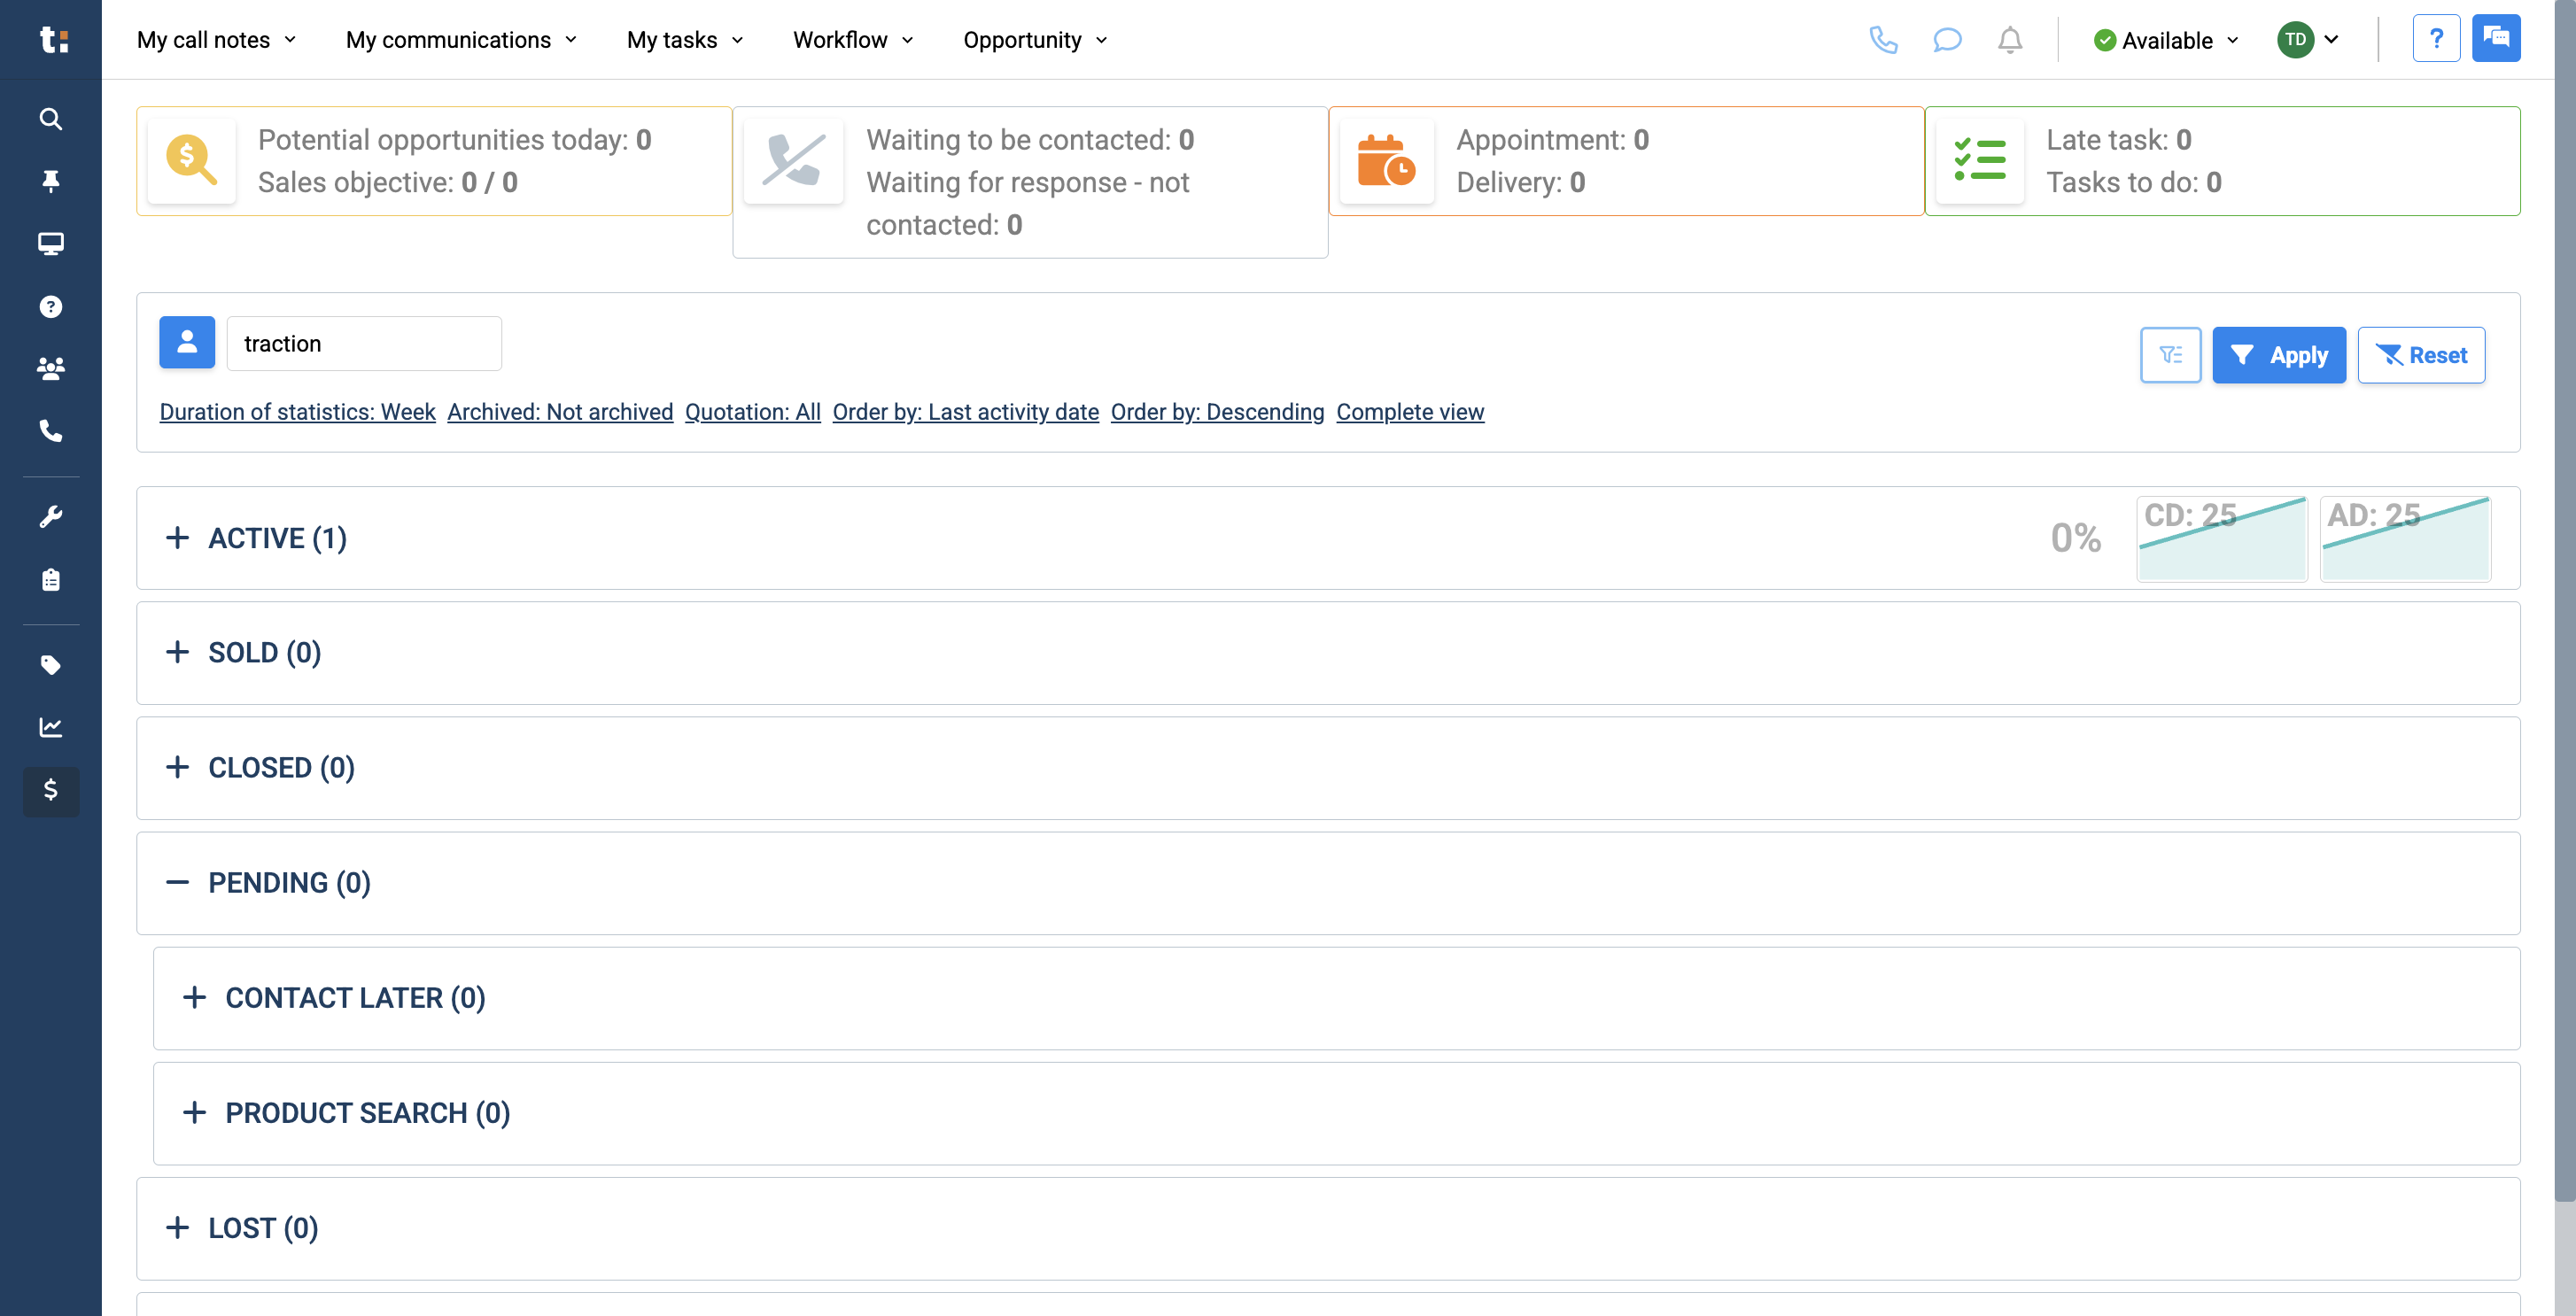
Pending status can be used for customers you want to contact later or who are looking for a specific product.
10
Lost status means you did not make the sale for one of the following reasons.
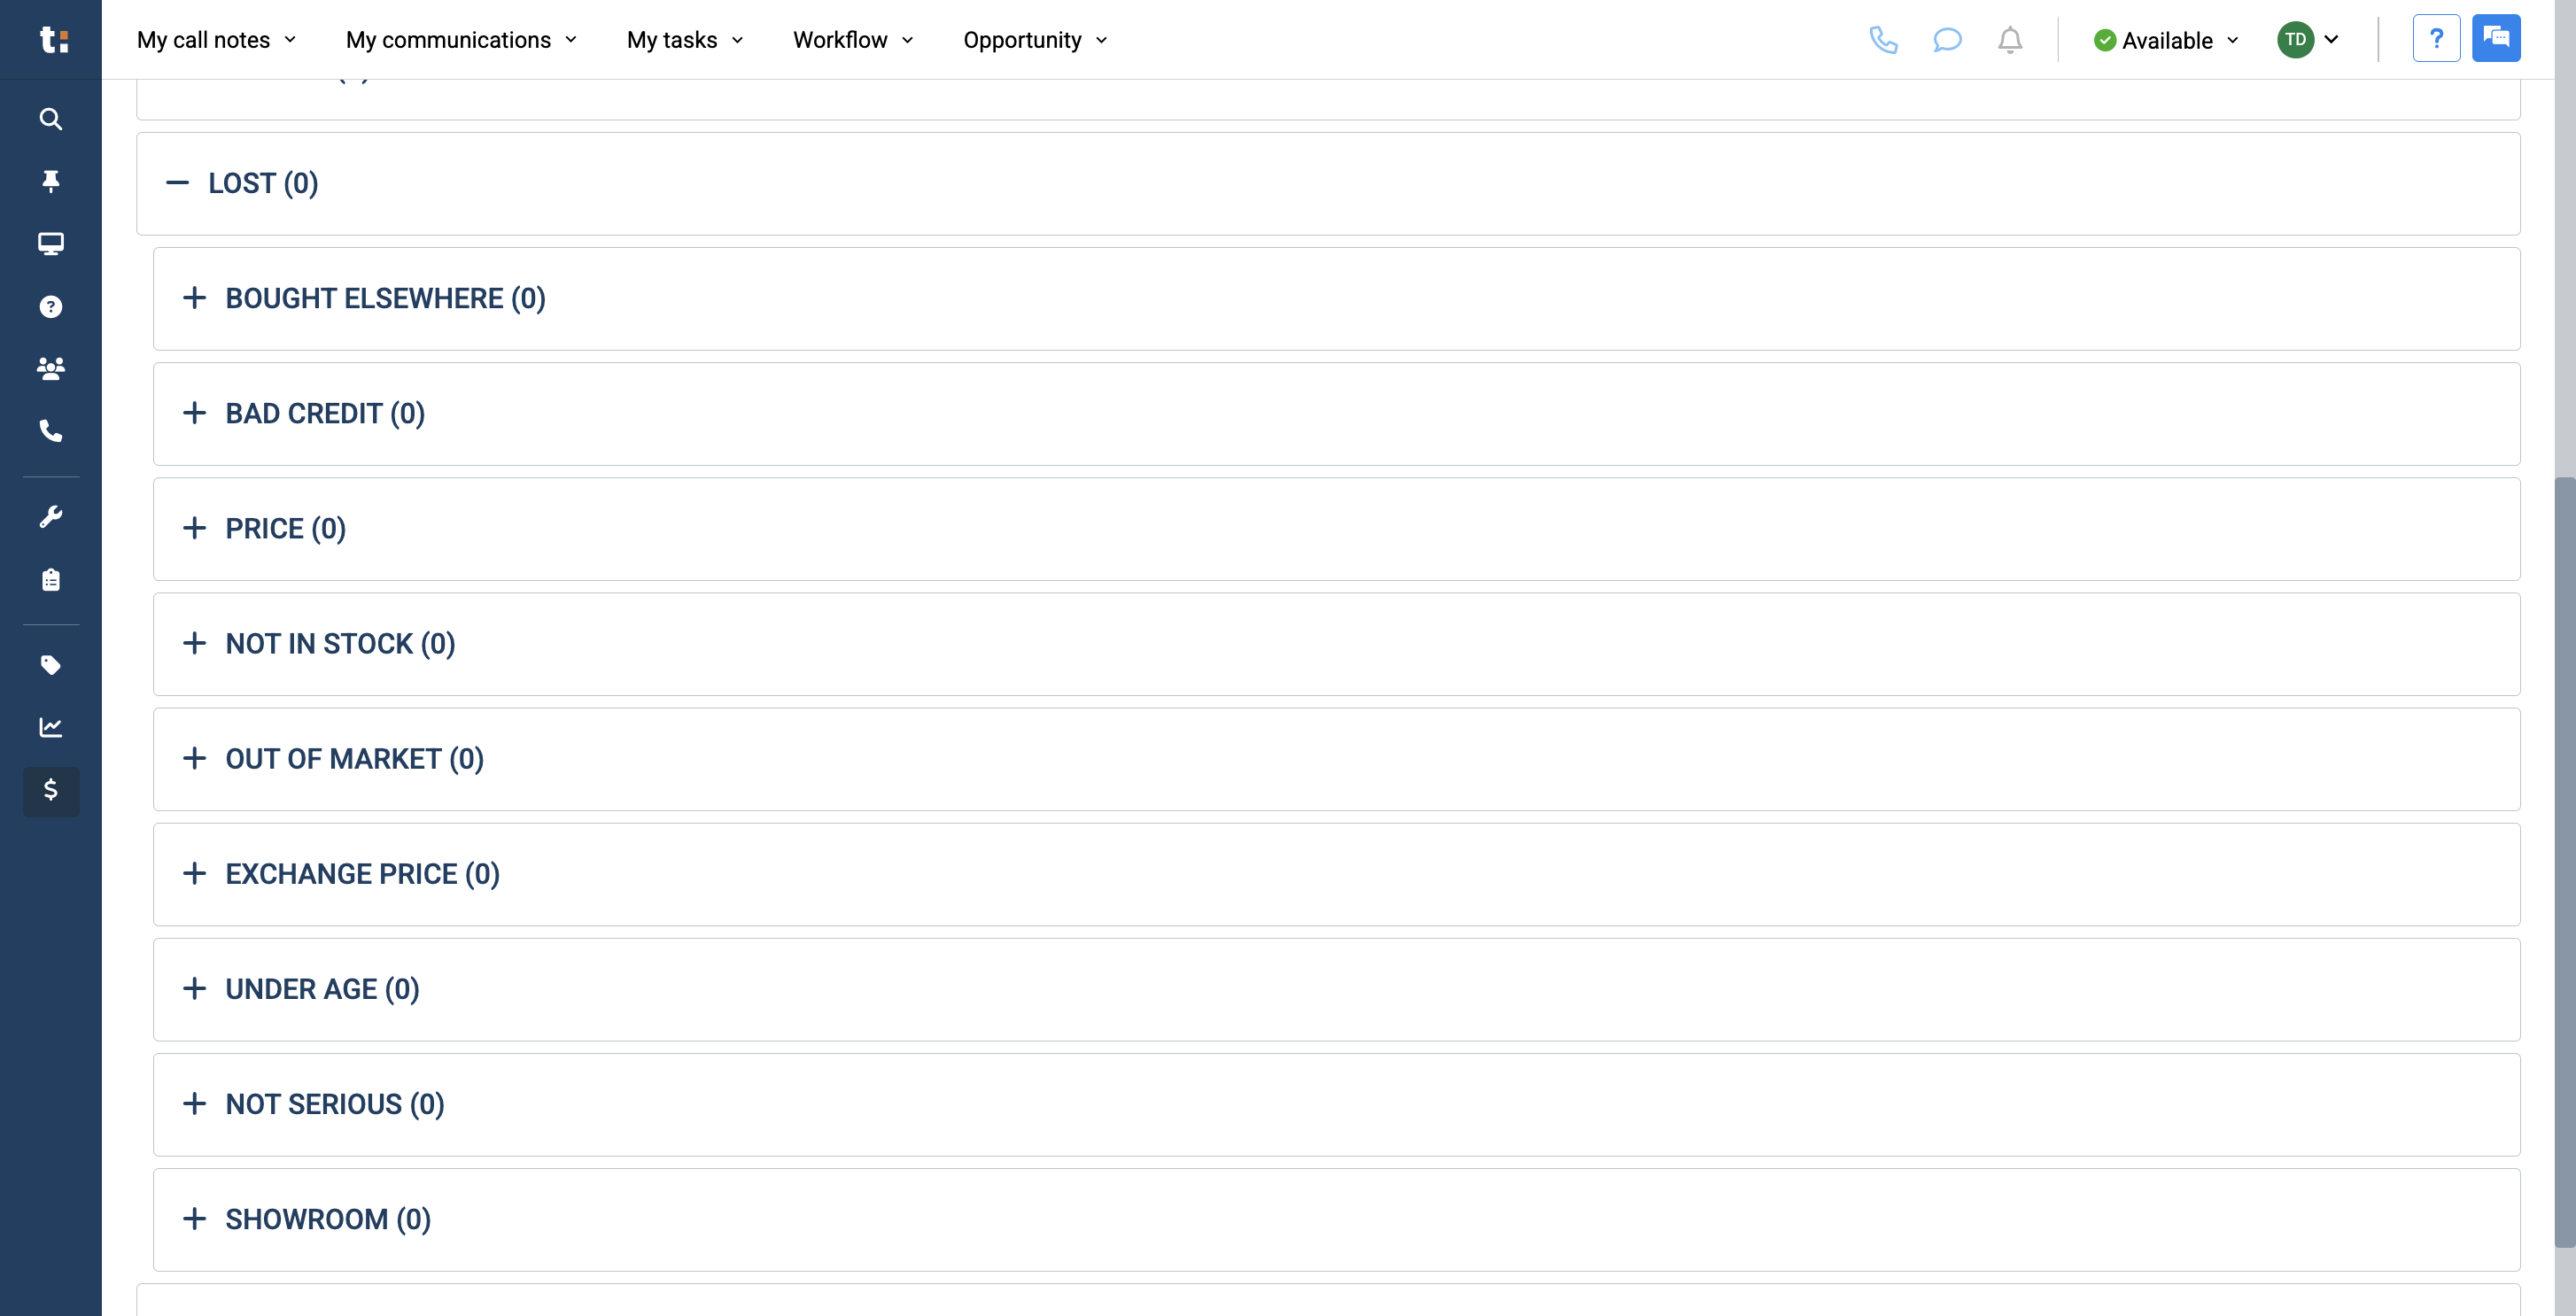
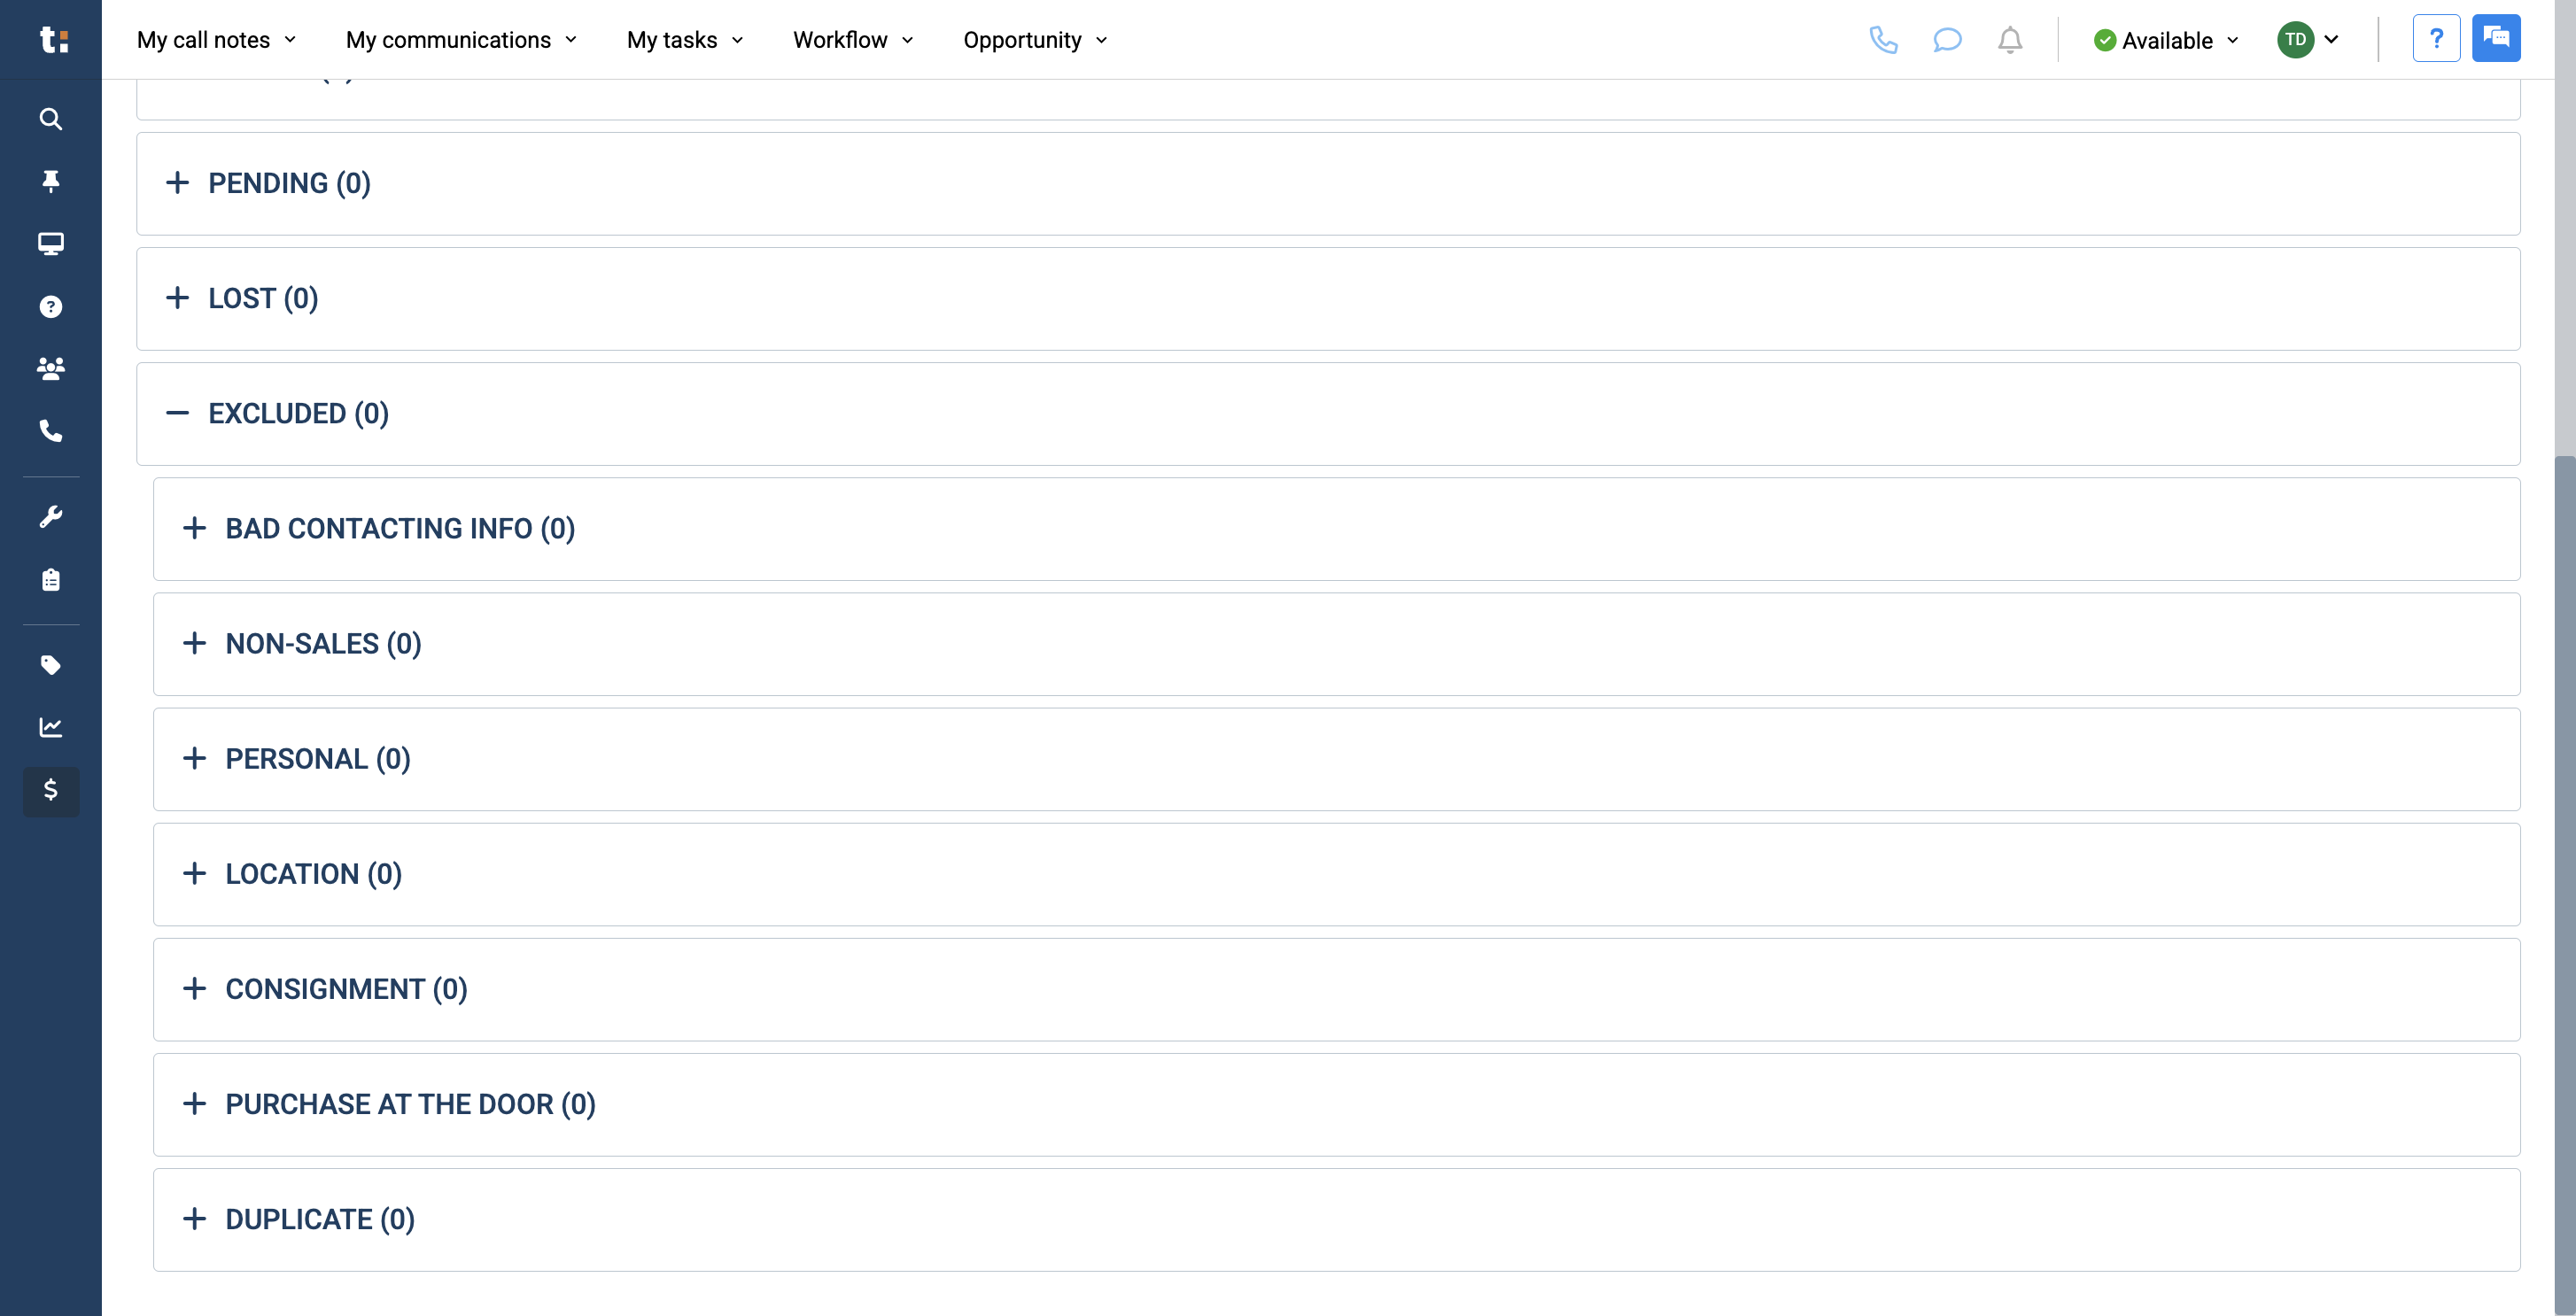
11
Lastly, excluded status removes these cards from your statistics, so they won't affect your conversion rate. This may be due to a personal issue, incorrect contact information, or a lack of interest in sales.
12
Next to that, you can see statistics showing the average number of days since the creation dates for all your opportunities.
13
It also displays the average days since your last activity for all opportunities,
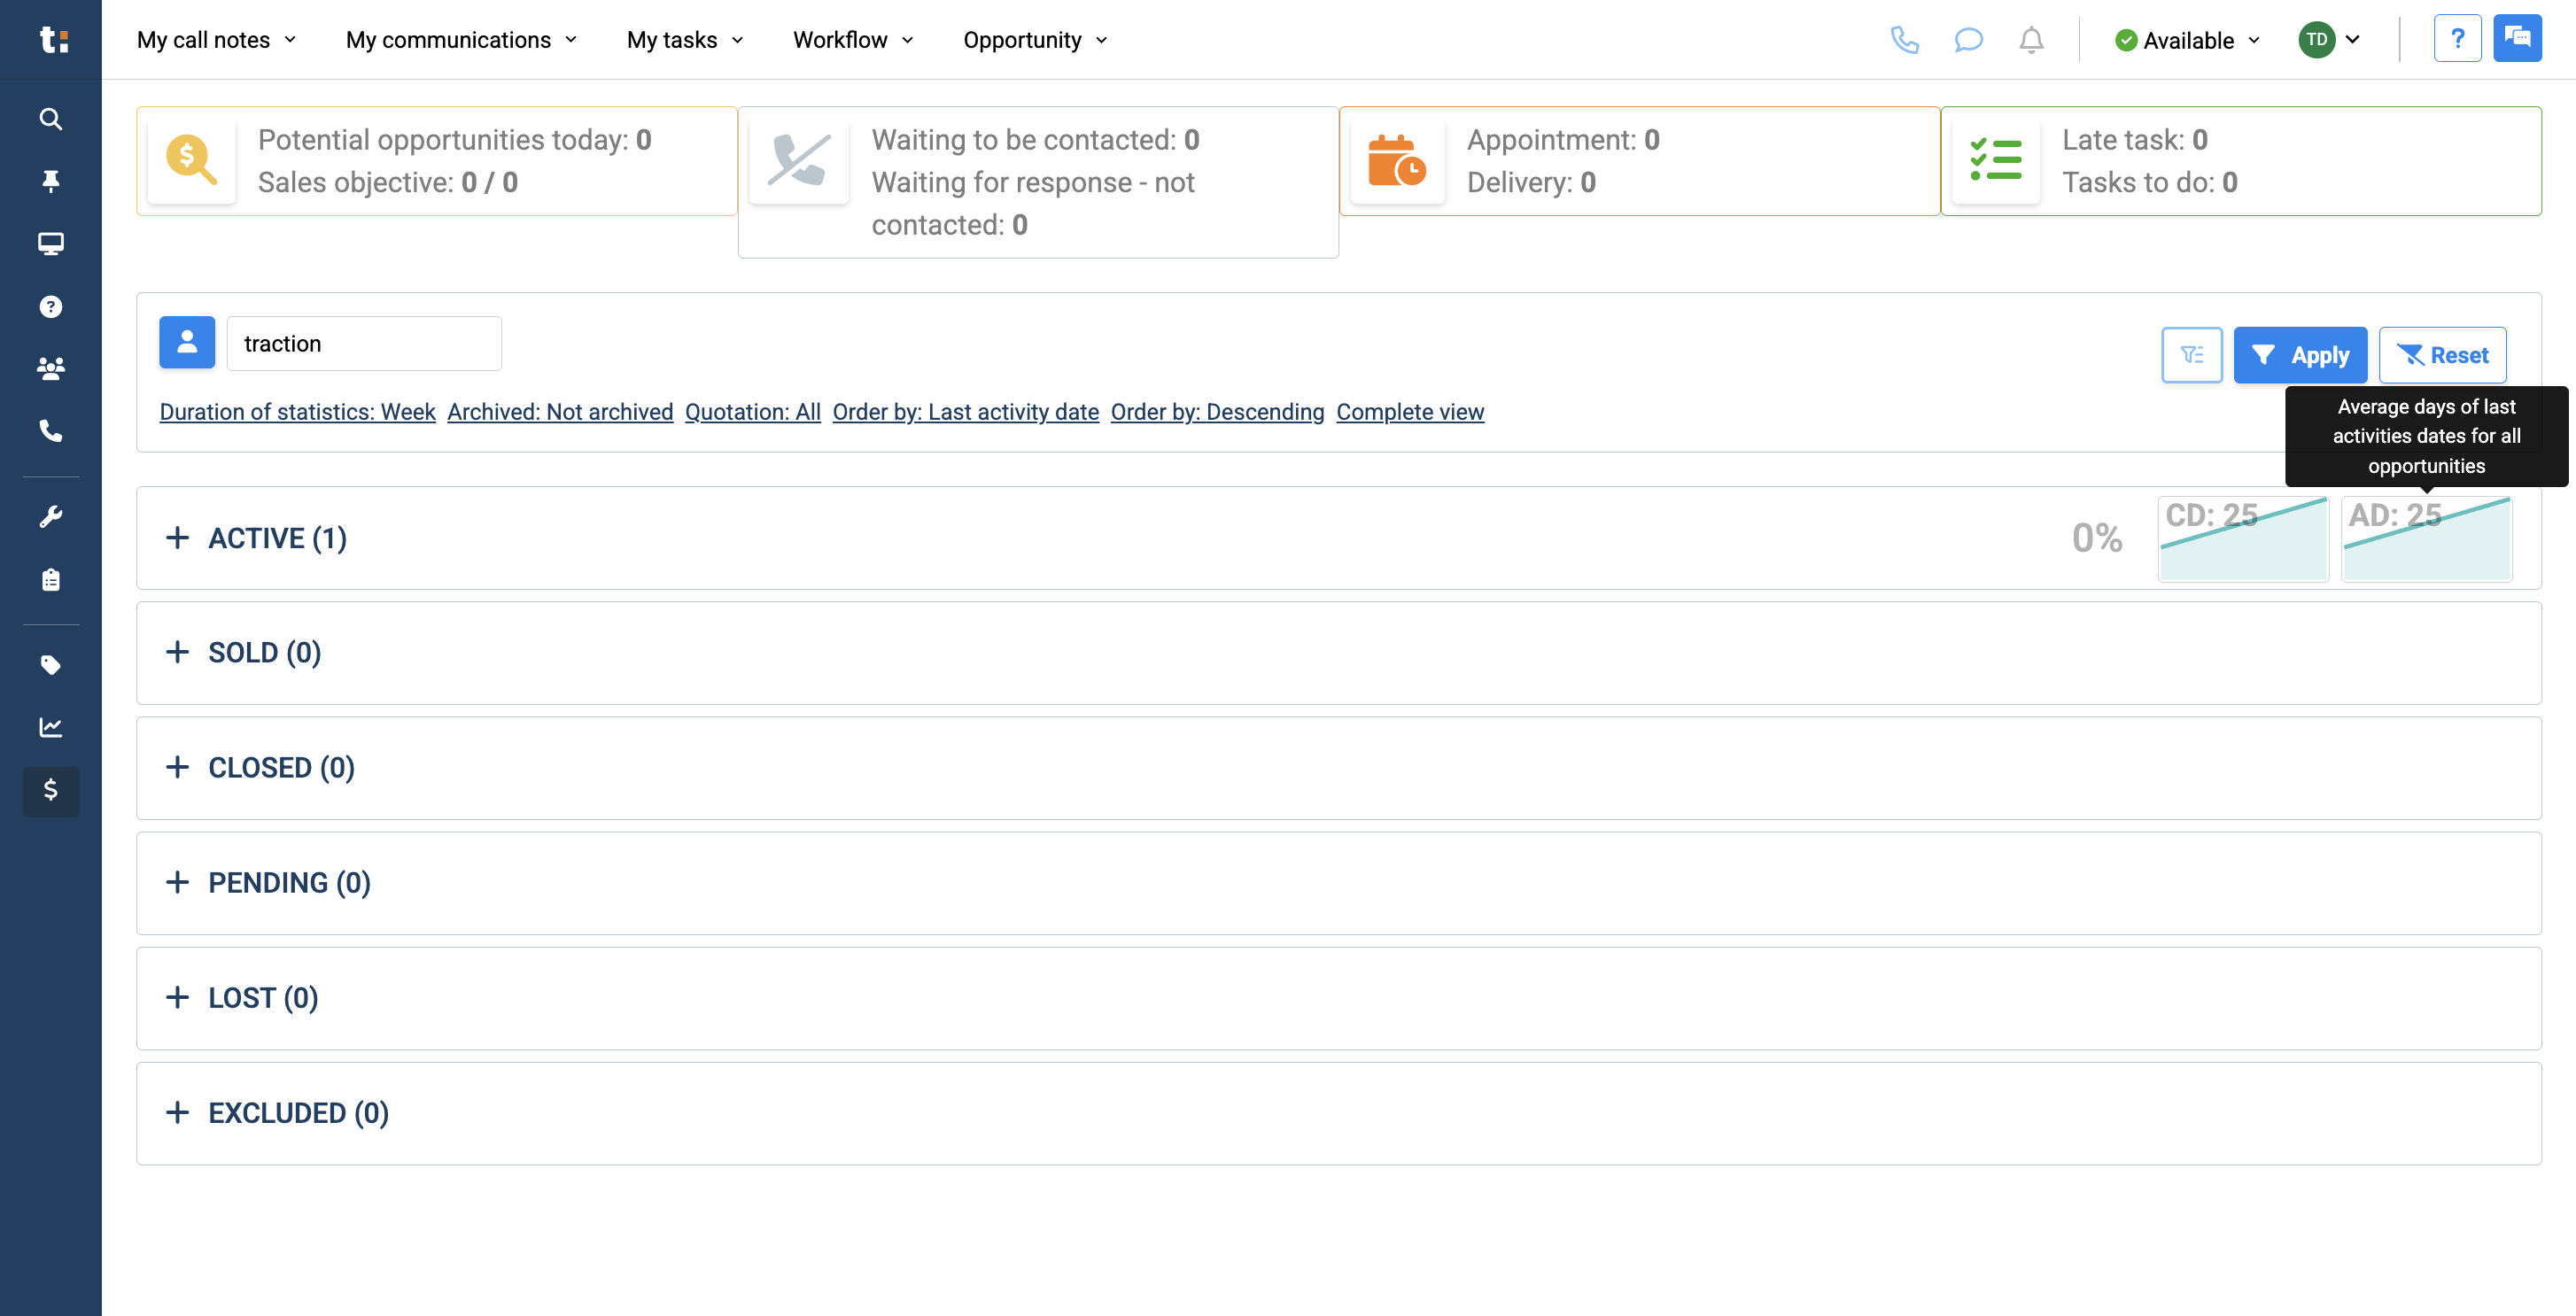
14
along with a percentage.
15
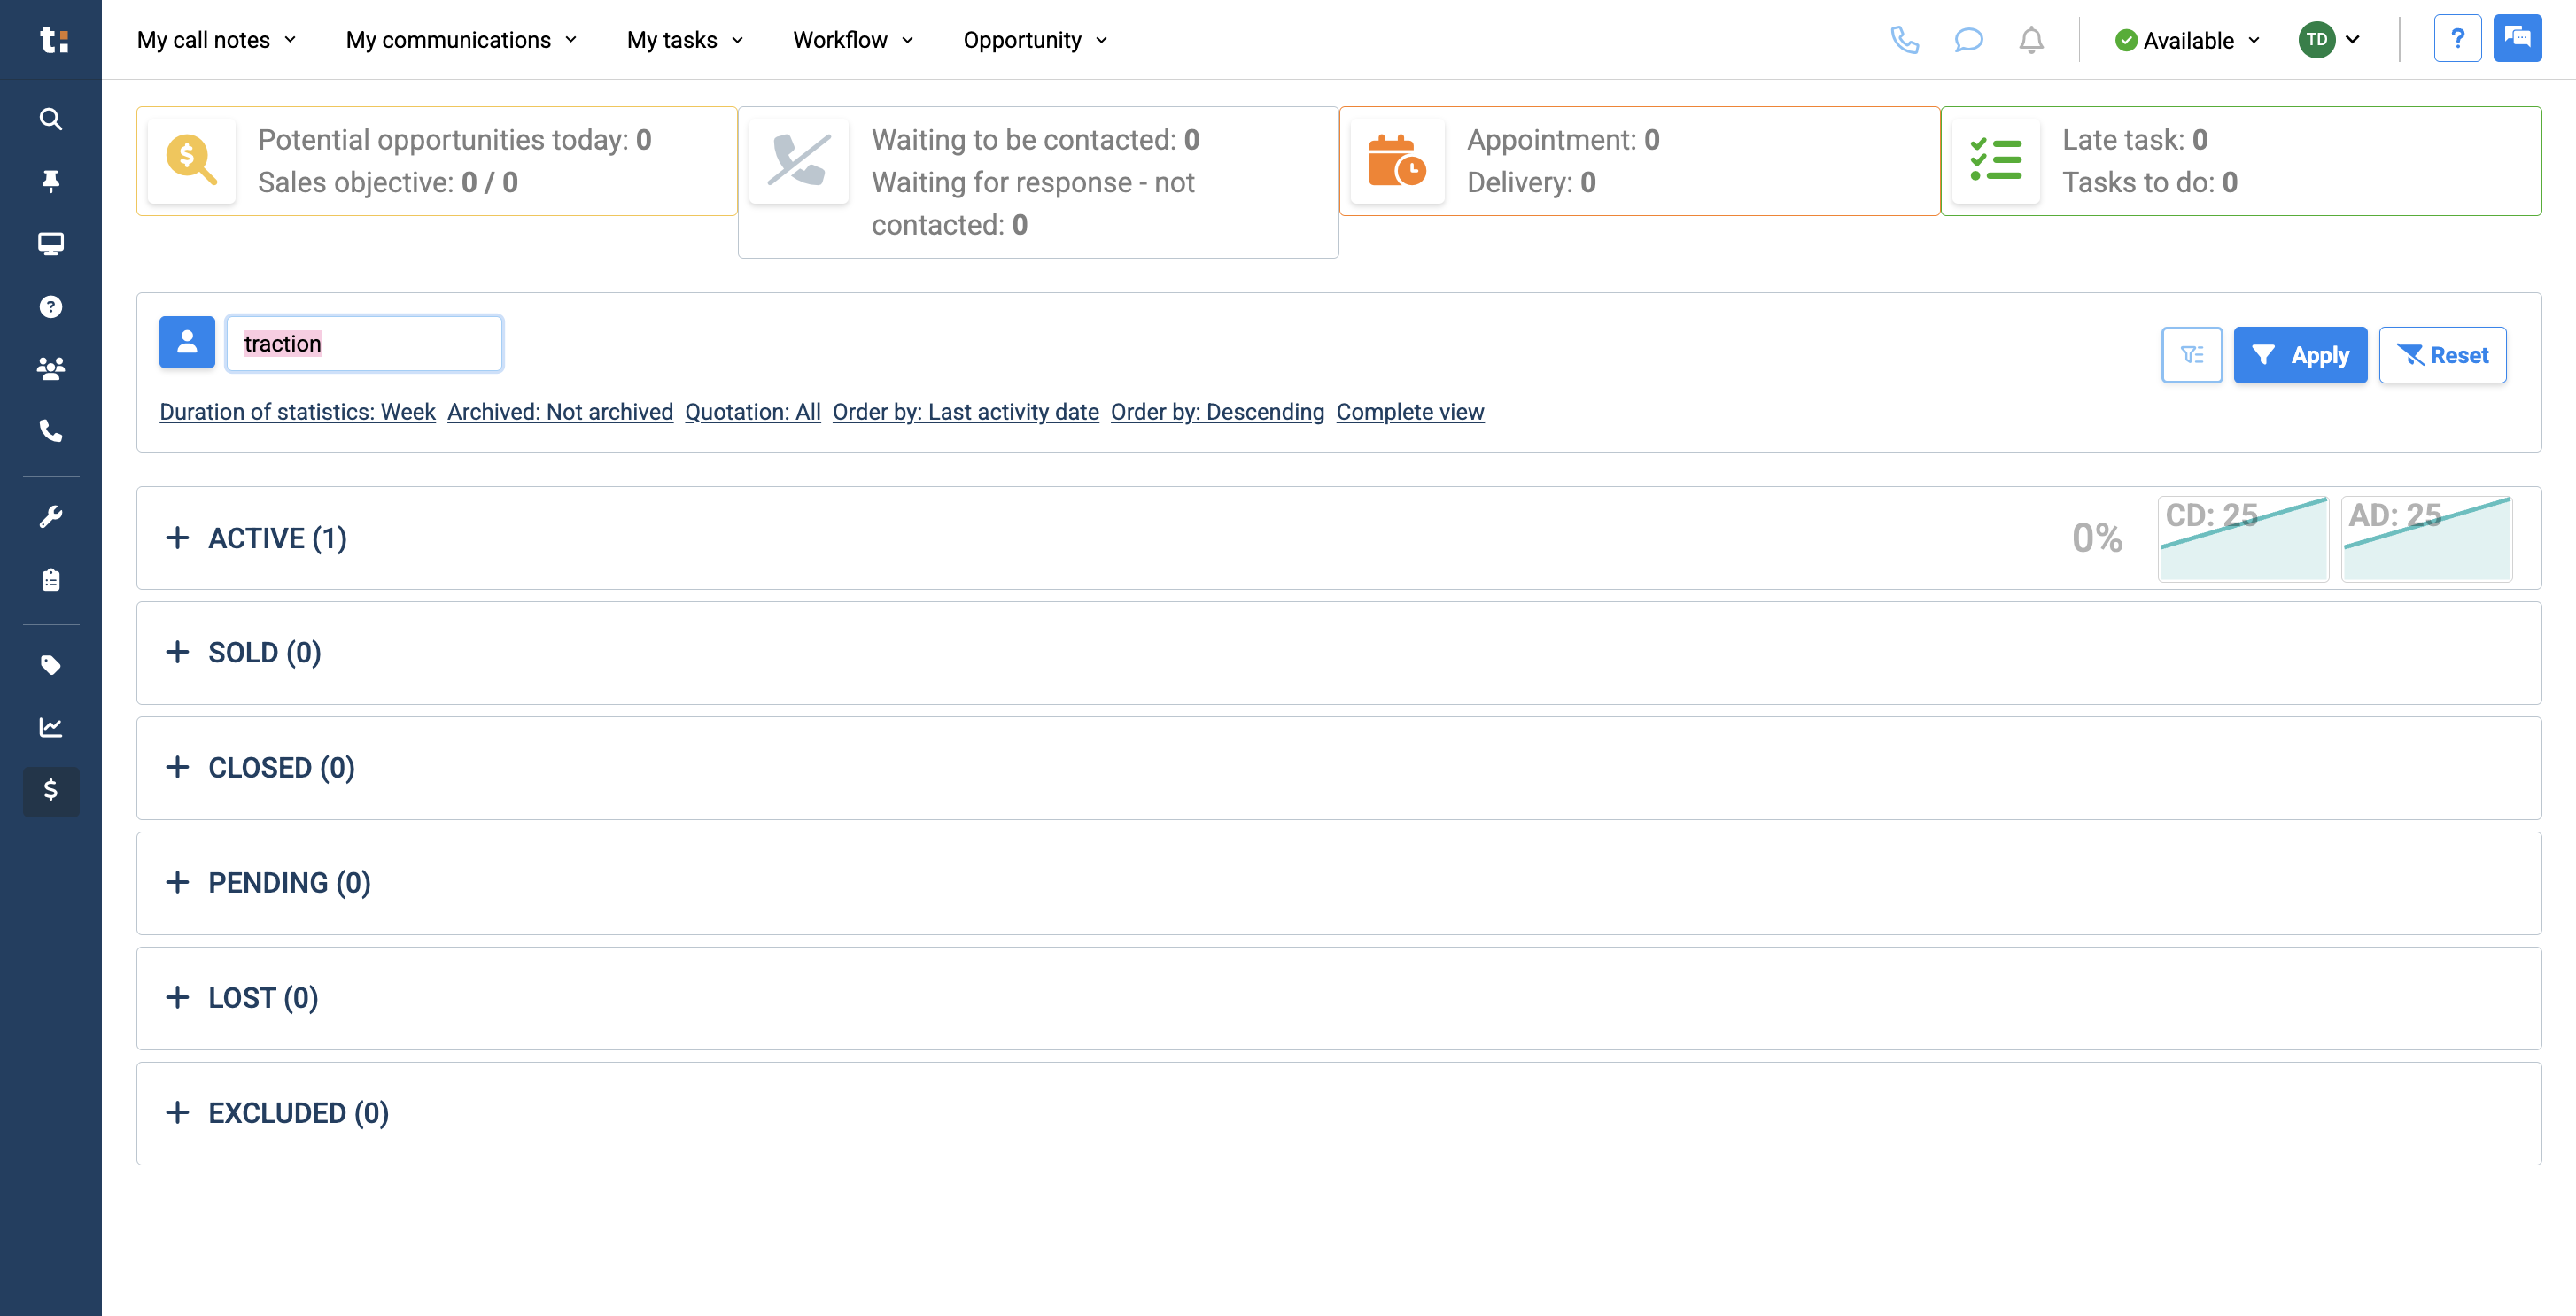
You can view anyone's sales dashboard by entering their username in the search bar
16
and clicking apply.
17
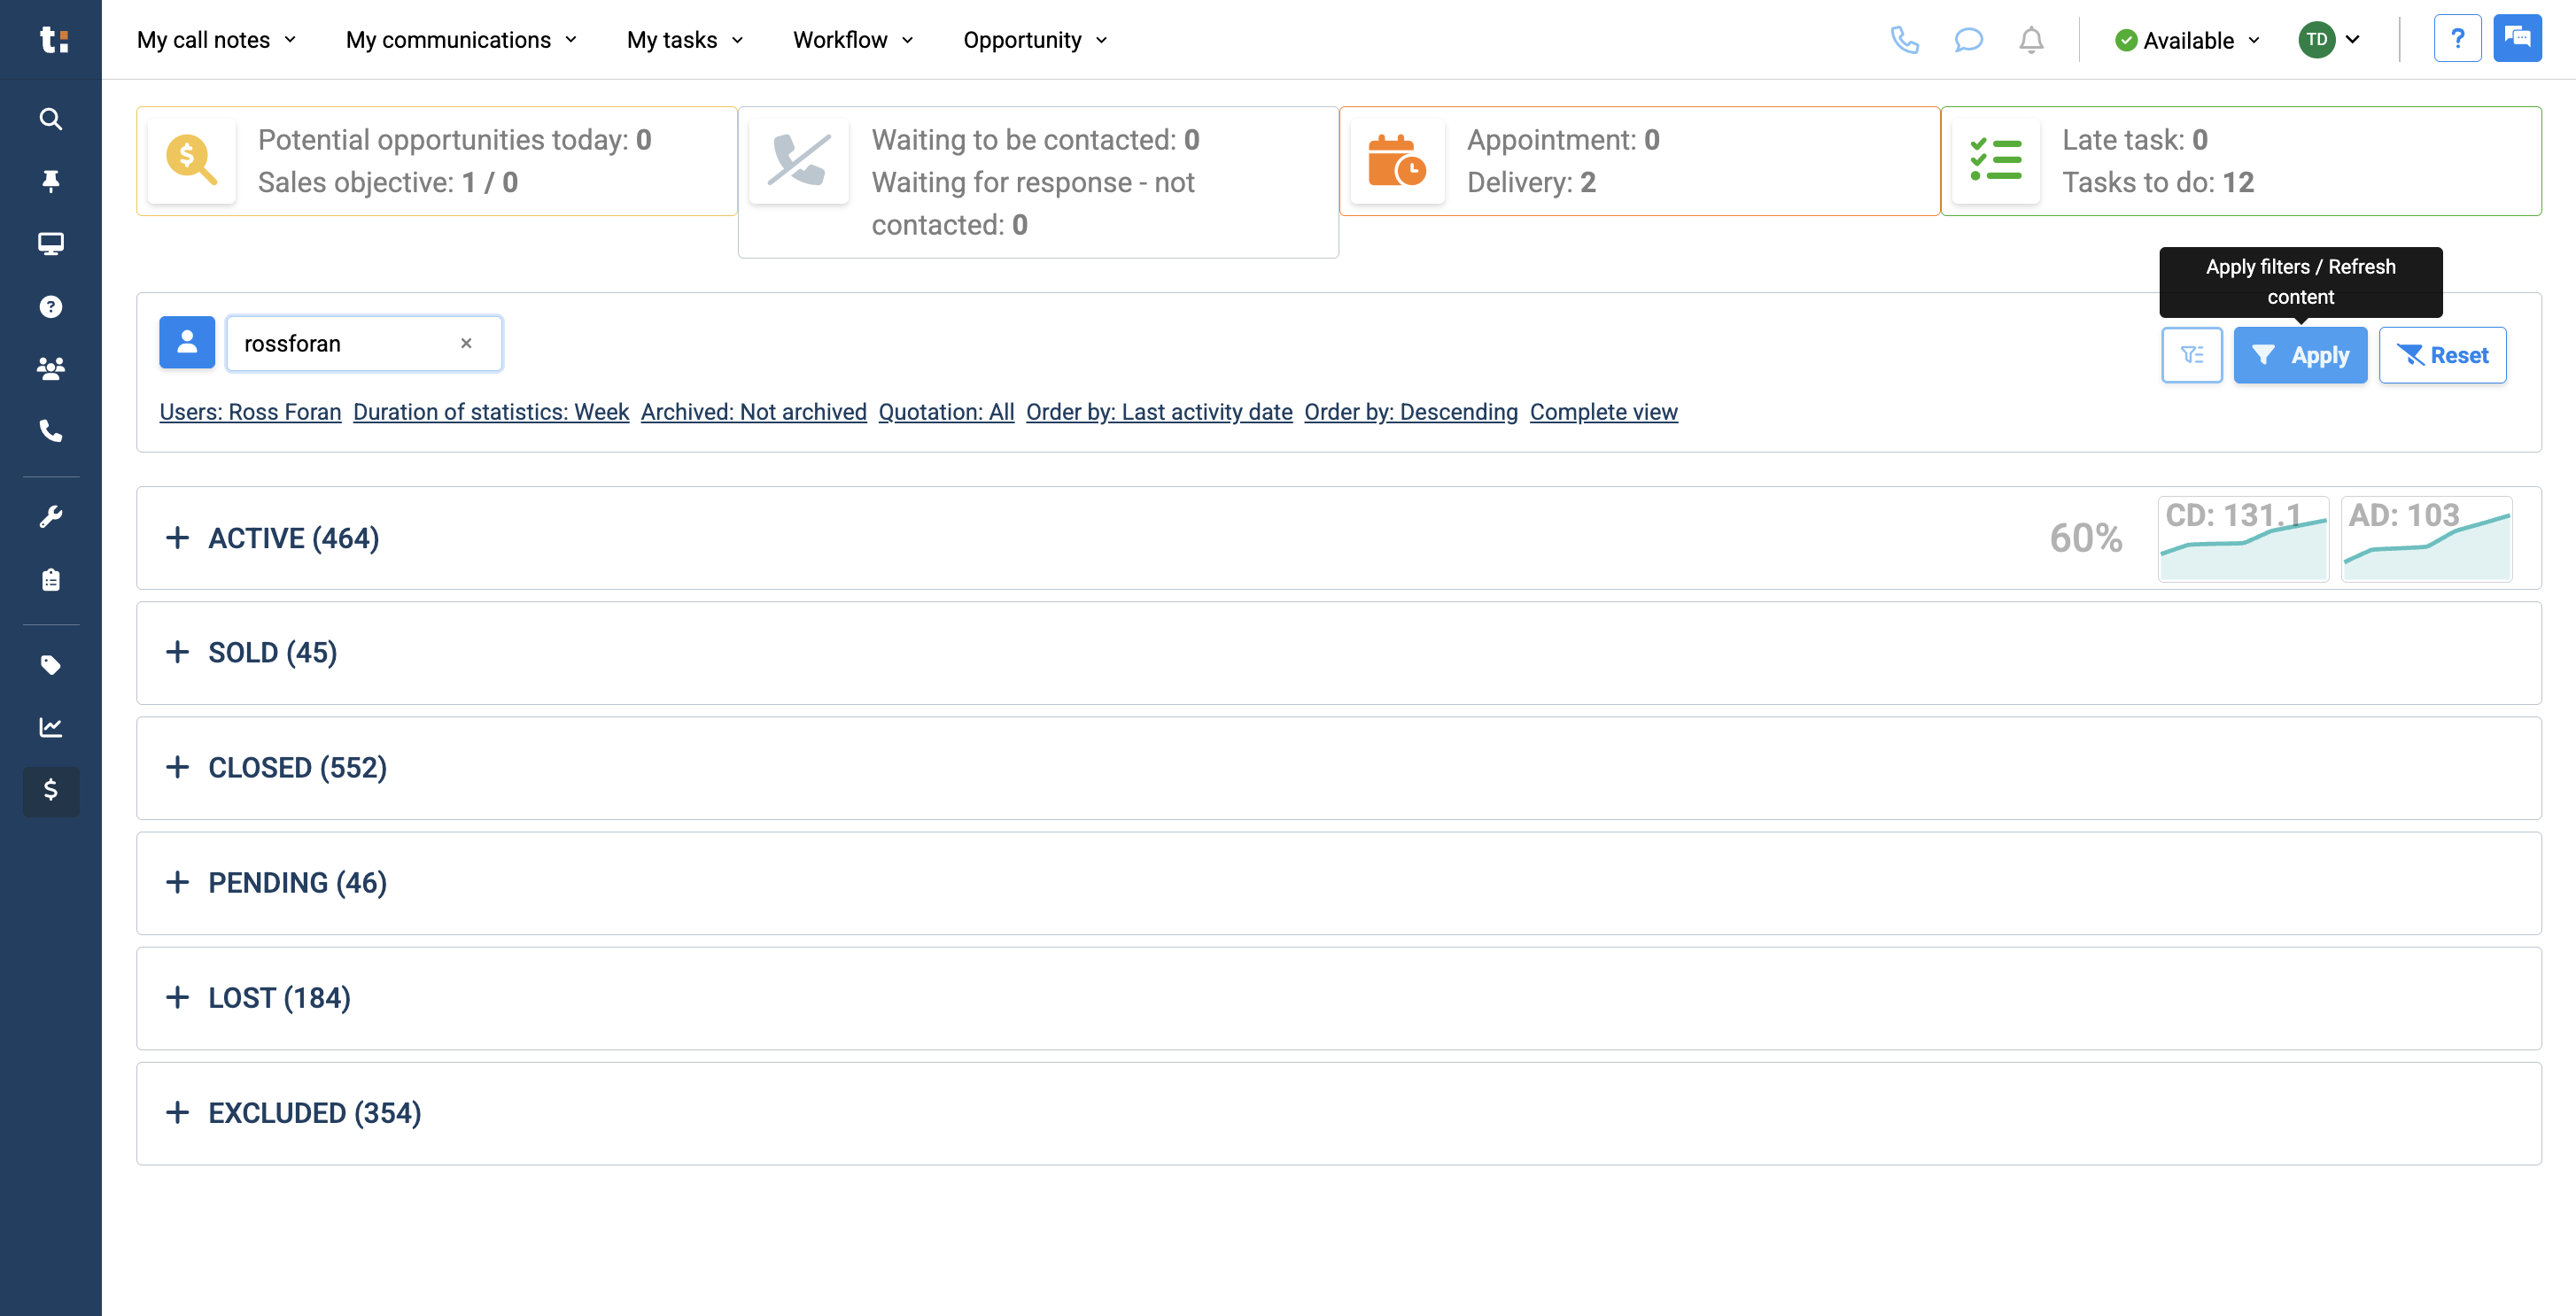
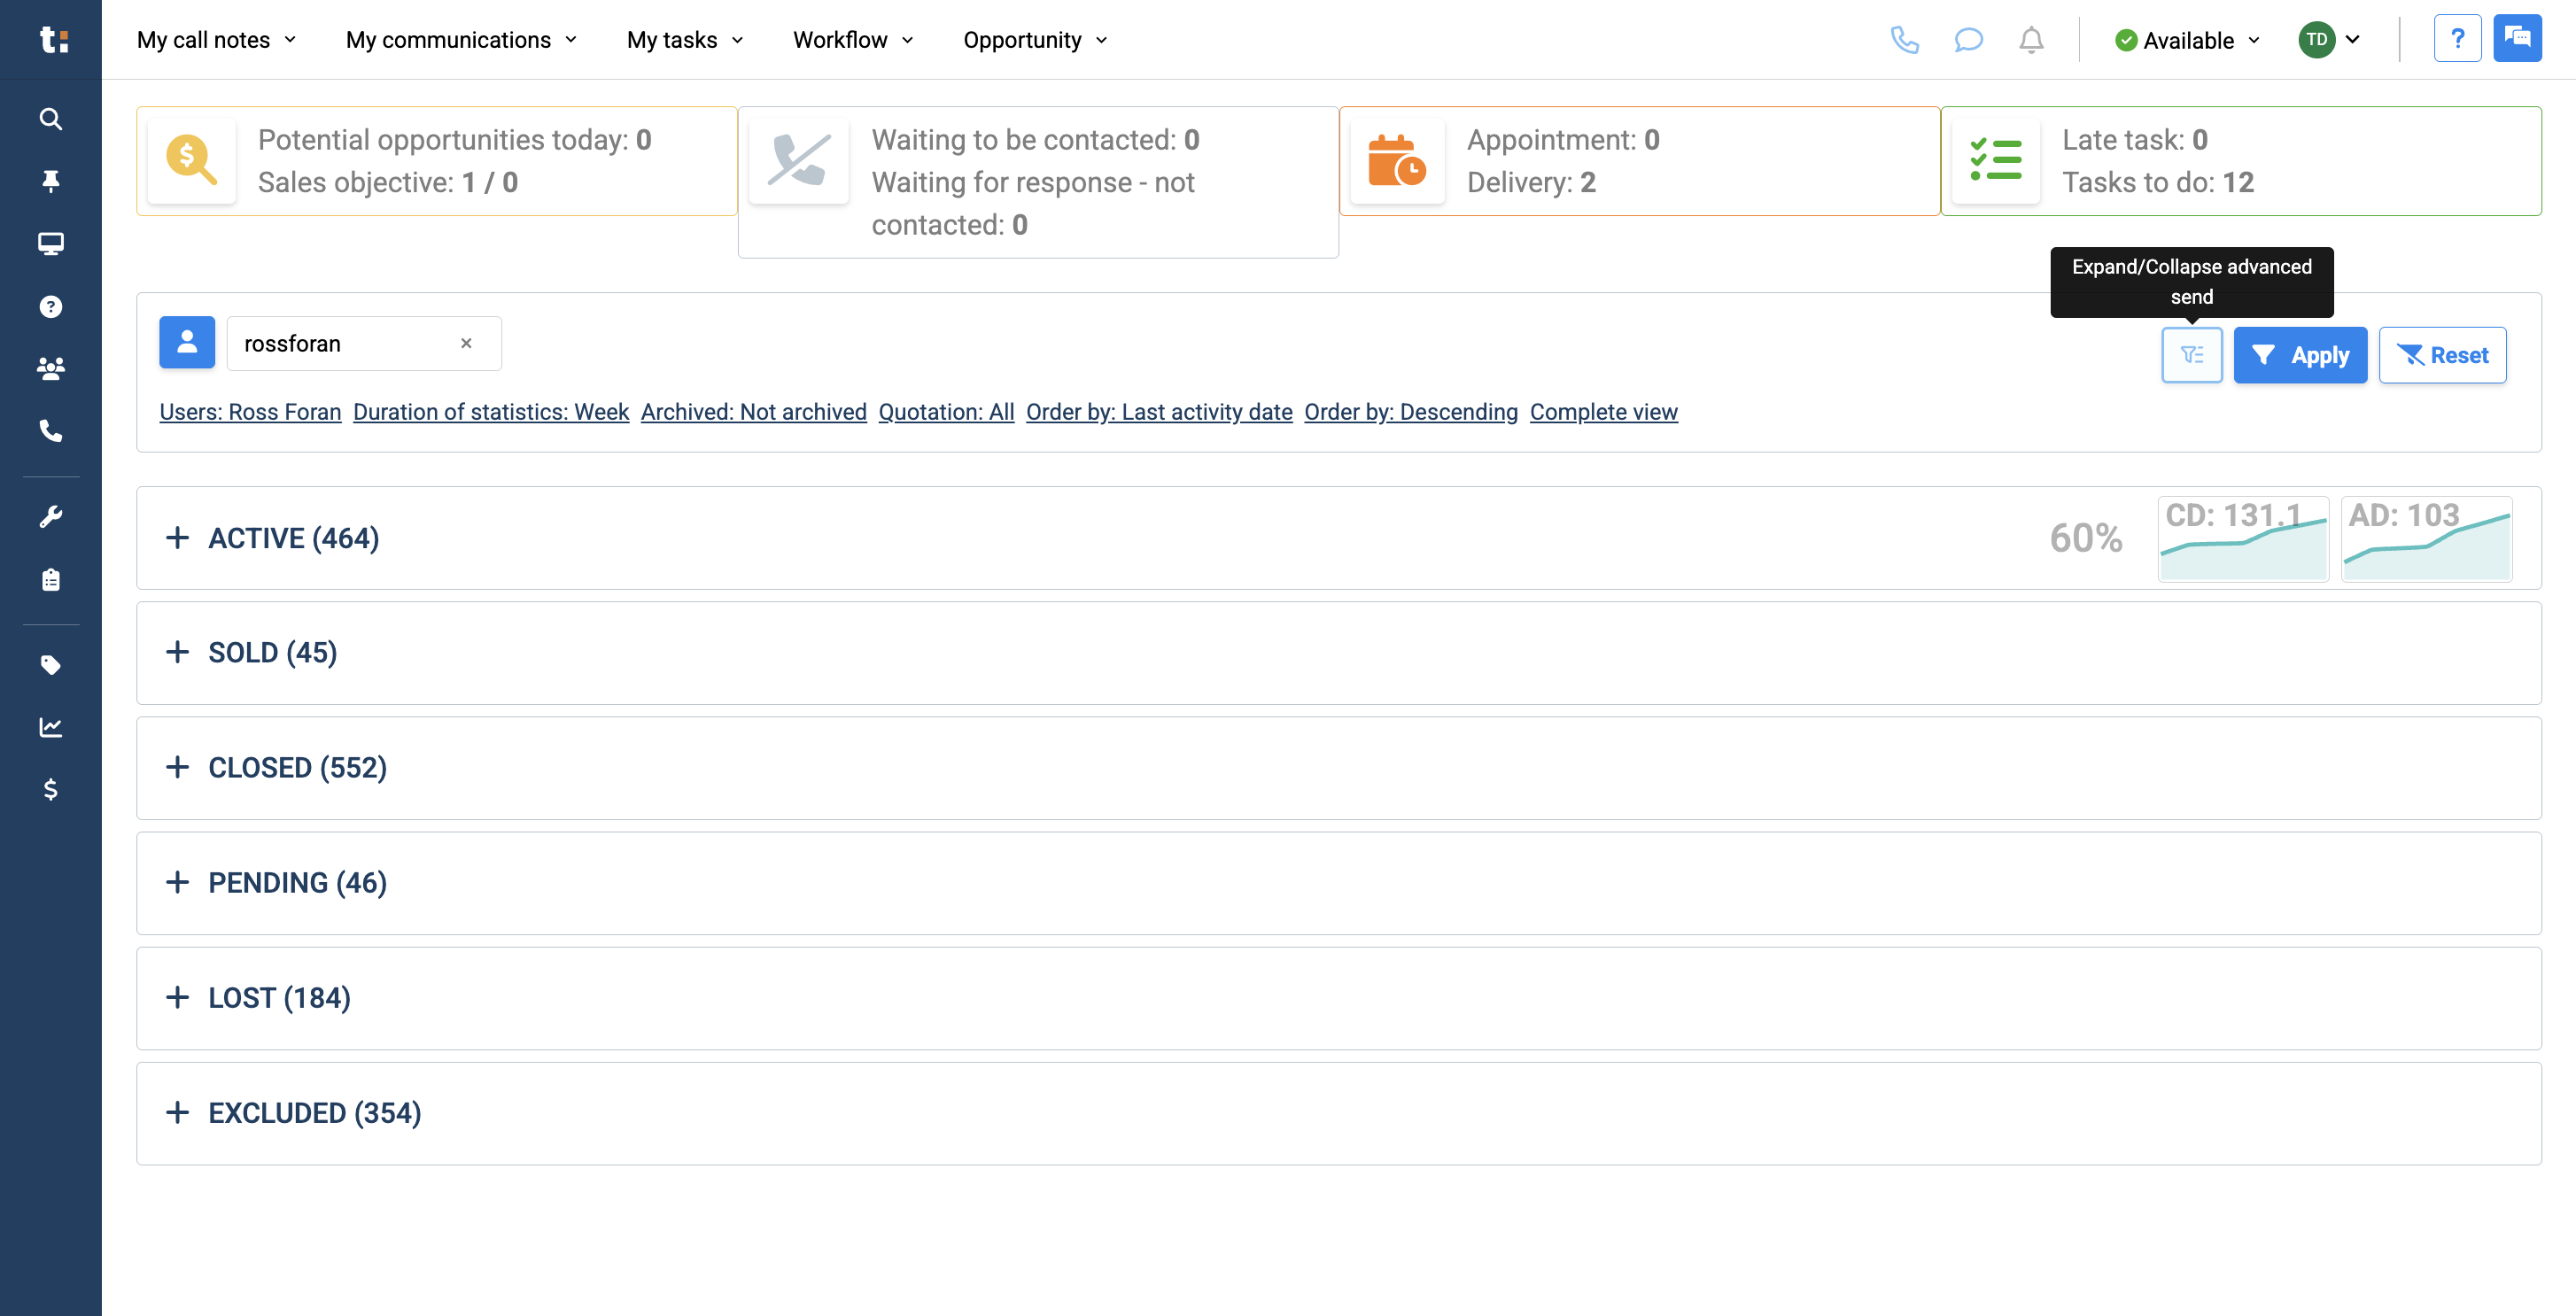
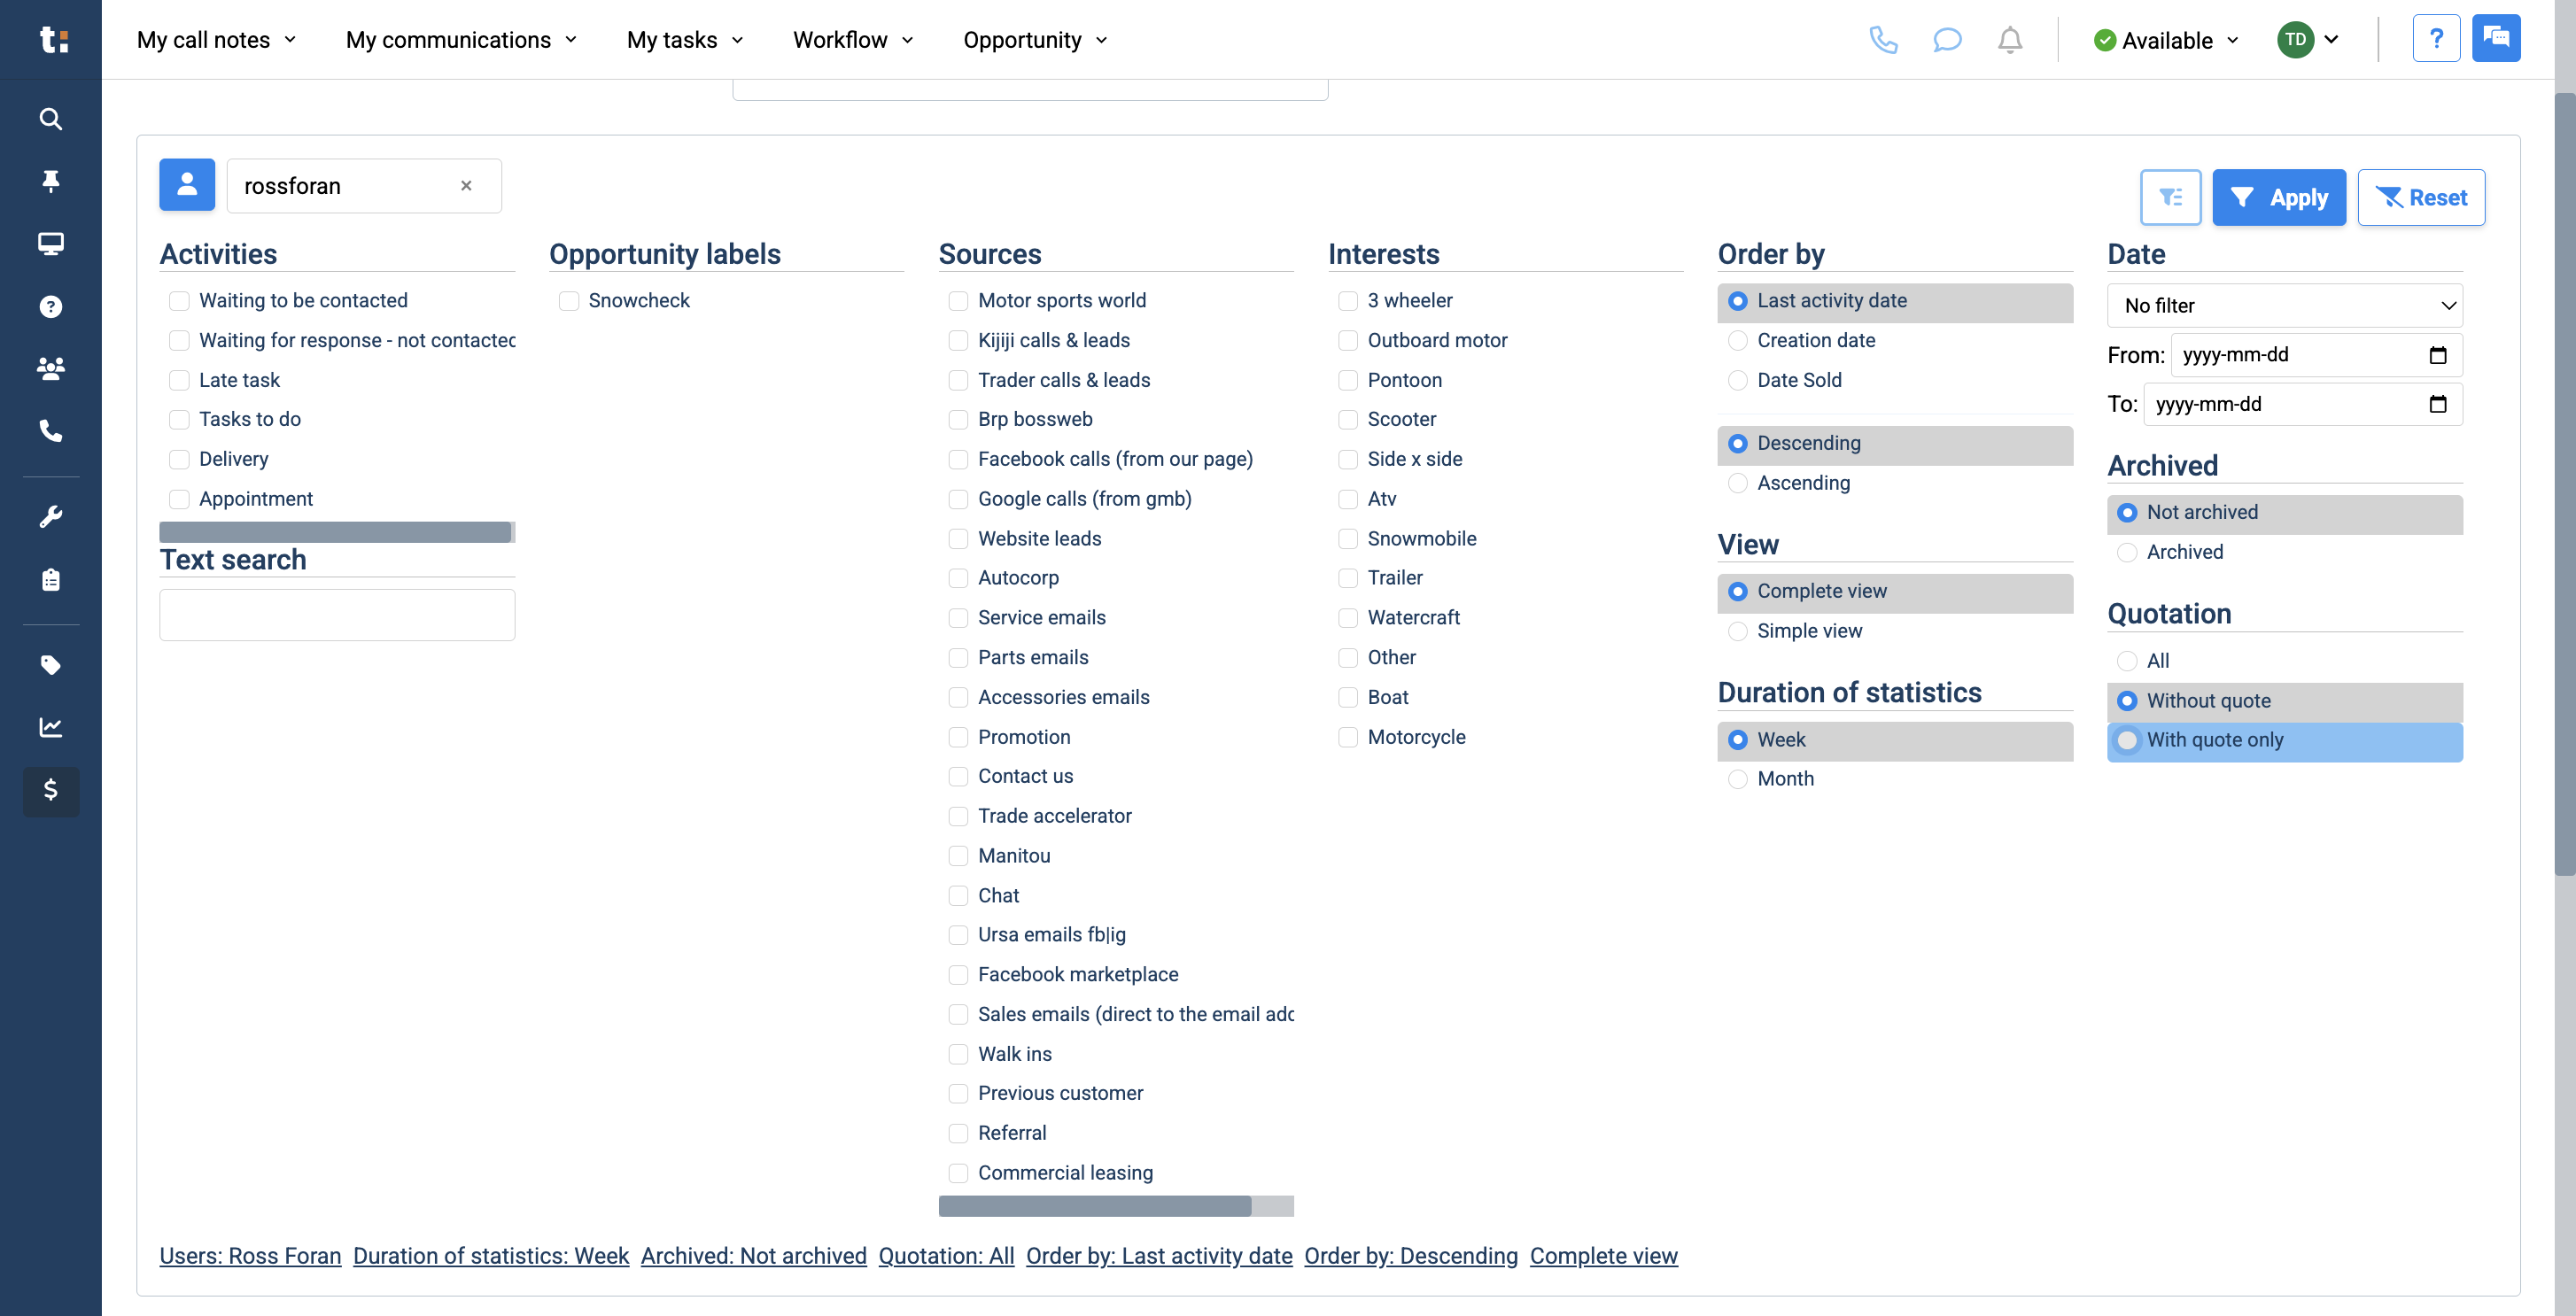
This gives you full access to view everyone's sales opportunities. We also have a filter button that lets you filter your opportunities as you prefer.
18
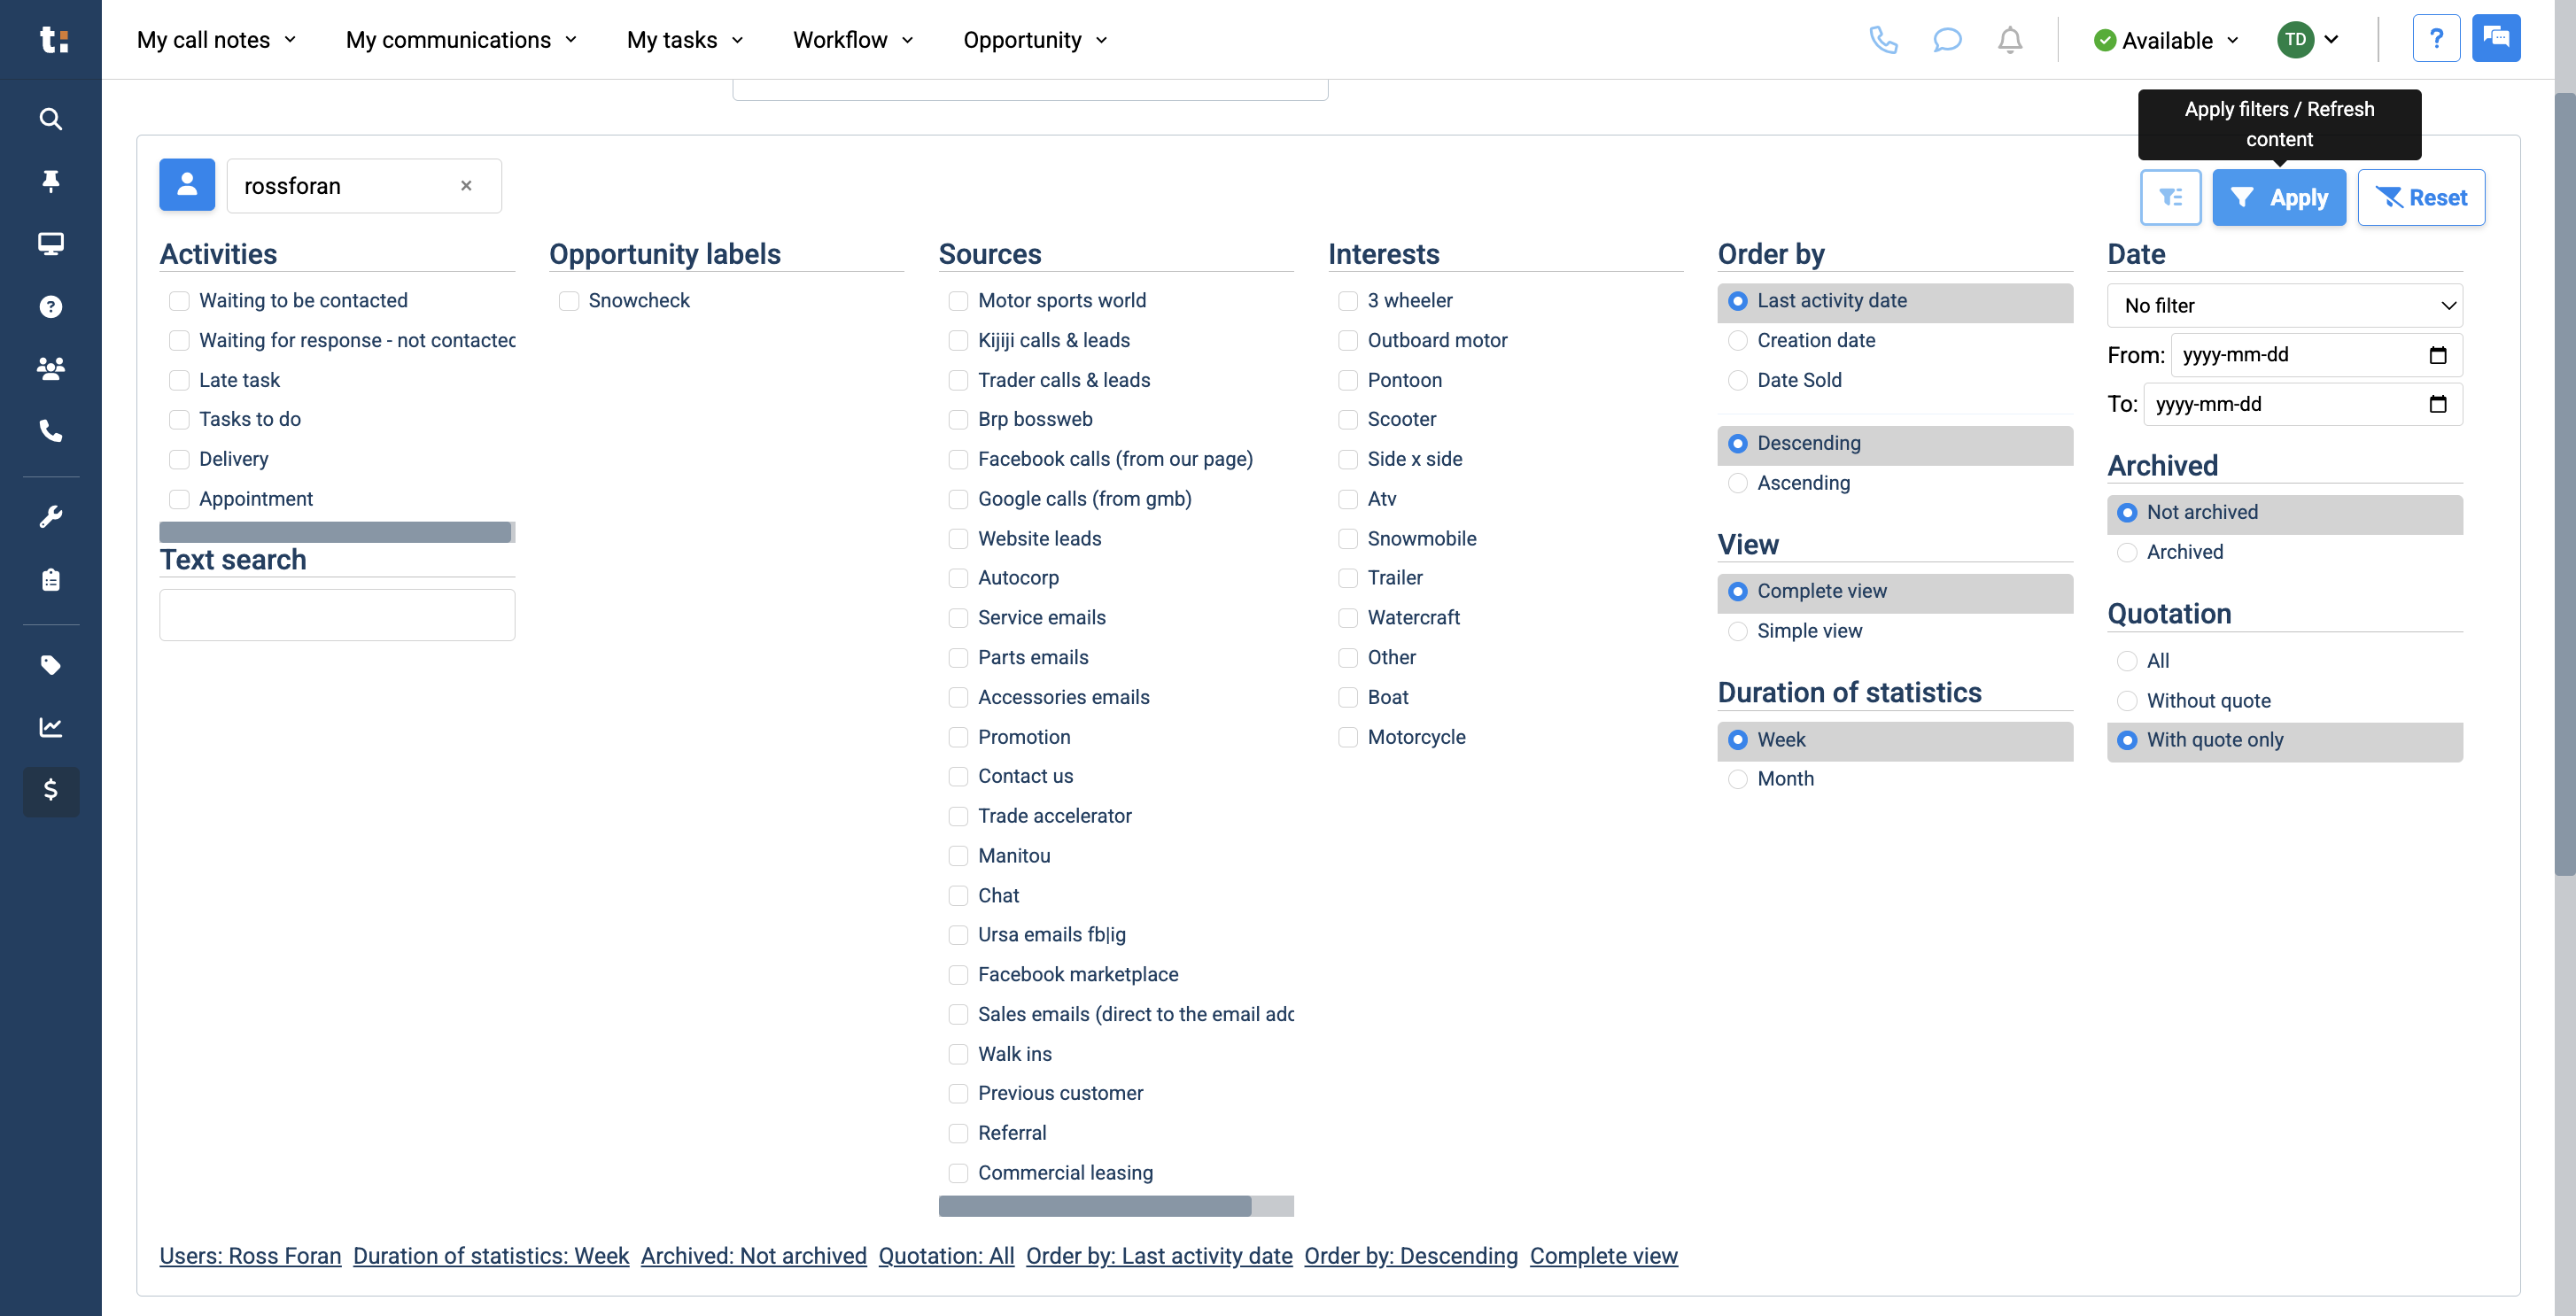
Salespeople may be more interested in viewing all opportunities, either those without a quote or only those with a quote.
19
Click apply
20
When I apply, all the numbers in my statuses are now assigned to those with a quote applied.
21
At the top of your sales dashboard, you can see key information. This includes your potential opportunities for today, your sales objectives.....

22
the number of customers waiting to be contacted or to respond....

23
your booked appointments, upcoming deliveries....

24
and the number of late tasks compared to your total tasks.

If you still have questions after consulting this article, please feel free to contact our support team at: support@tractiondk.zohodesk.com