
How to Use Analytics in Capstack Pro
Use this guide to navigate Analytics in Capstack Pro, including dashboards, peer group comparisons, CAMELS reports, and forecasting tools. Follow each step to understand your institution’s performance and compare against peers.
Overview
Capstack Pro’s Analytics feature provides FDIC peer benchmarking, credit profile analysis, and forecasting tools designed for community and regional banks. You can evaluate your loan concentrations, compare against peers, and forecast trends — all inside Capstack Pro.
Before you start
1. Make sure you have Capstack Pro access and are logged into your account
Know your institution’s key areas of focus (CRE, residential, capital, profitability, etc.)
Decide which peer banks or regions you want to compare against
Getting started
Analytics is divided into five main areas:
Dashboard — Quick view of concentrations and peer averages
Credit Profile — Capital, profitability, and asset mix details
Peer Groups — Custom benchmarking against selected banks
CAMELS — Regulatory-style peer analysis
Forecasting — Forward-looking performance predictions
Section 1: Dashboard Overview

From the left navigation bar, click Analytics to open the Analytics feature.

Open the Insights tab to see your concentration data compared to peers.

Click on the CRE concentration card to see detailed breakdowns and trend charts over time.
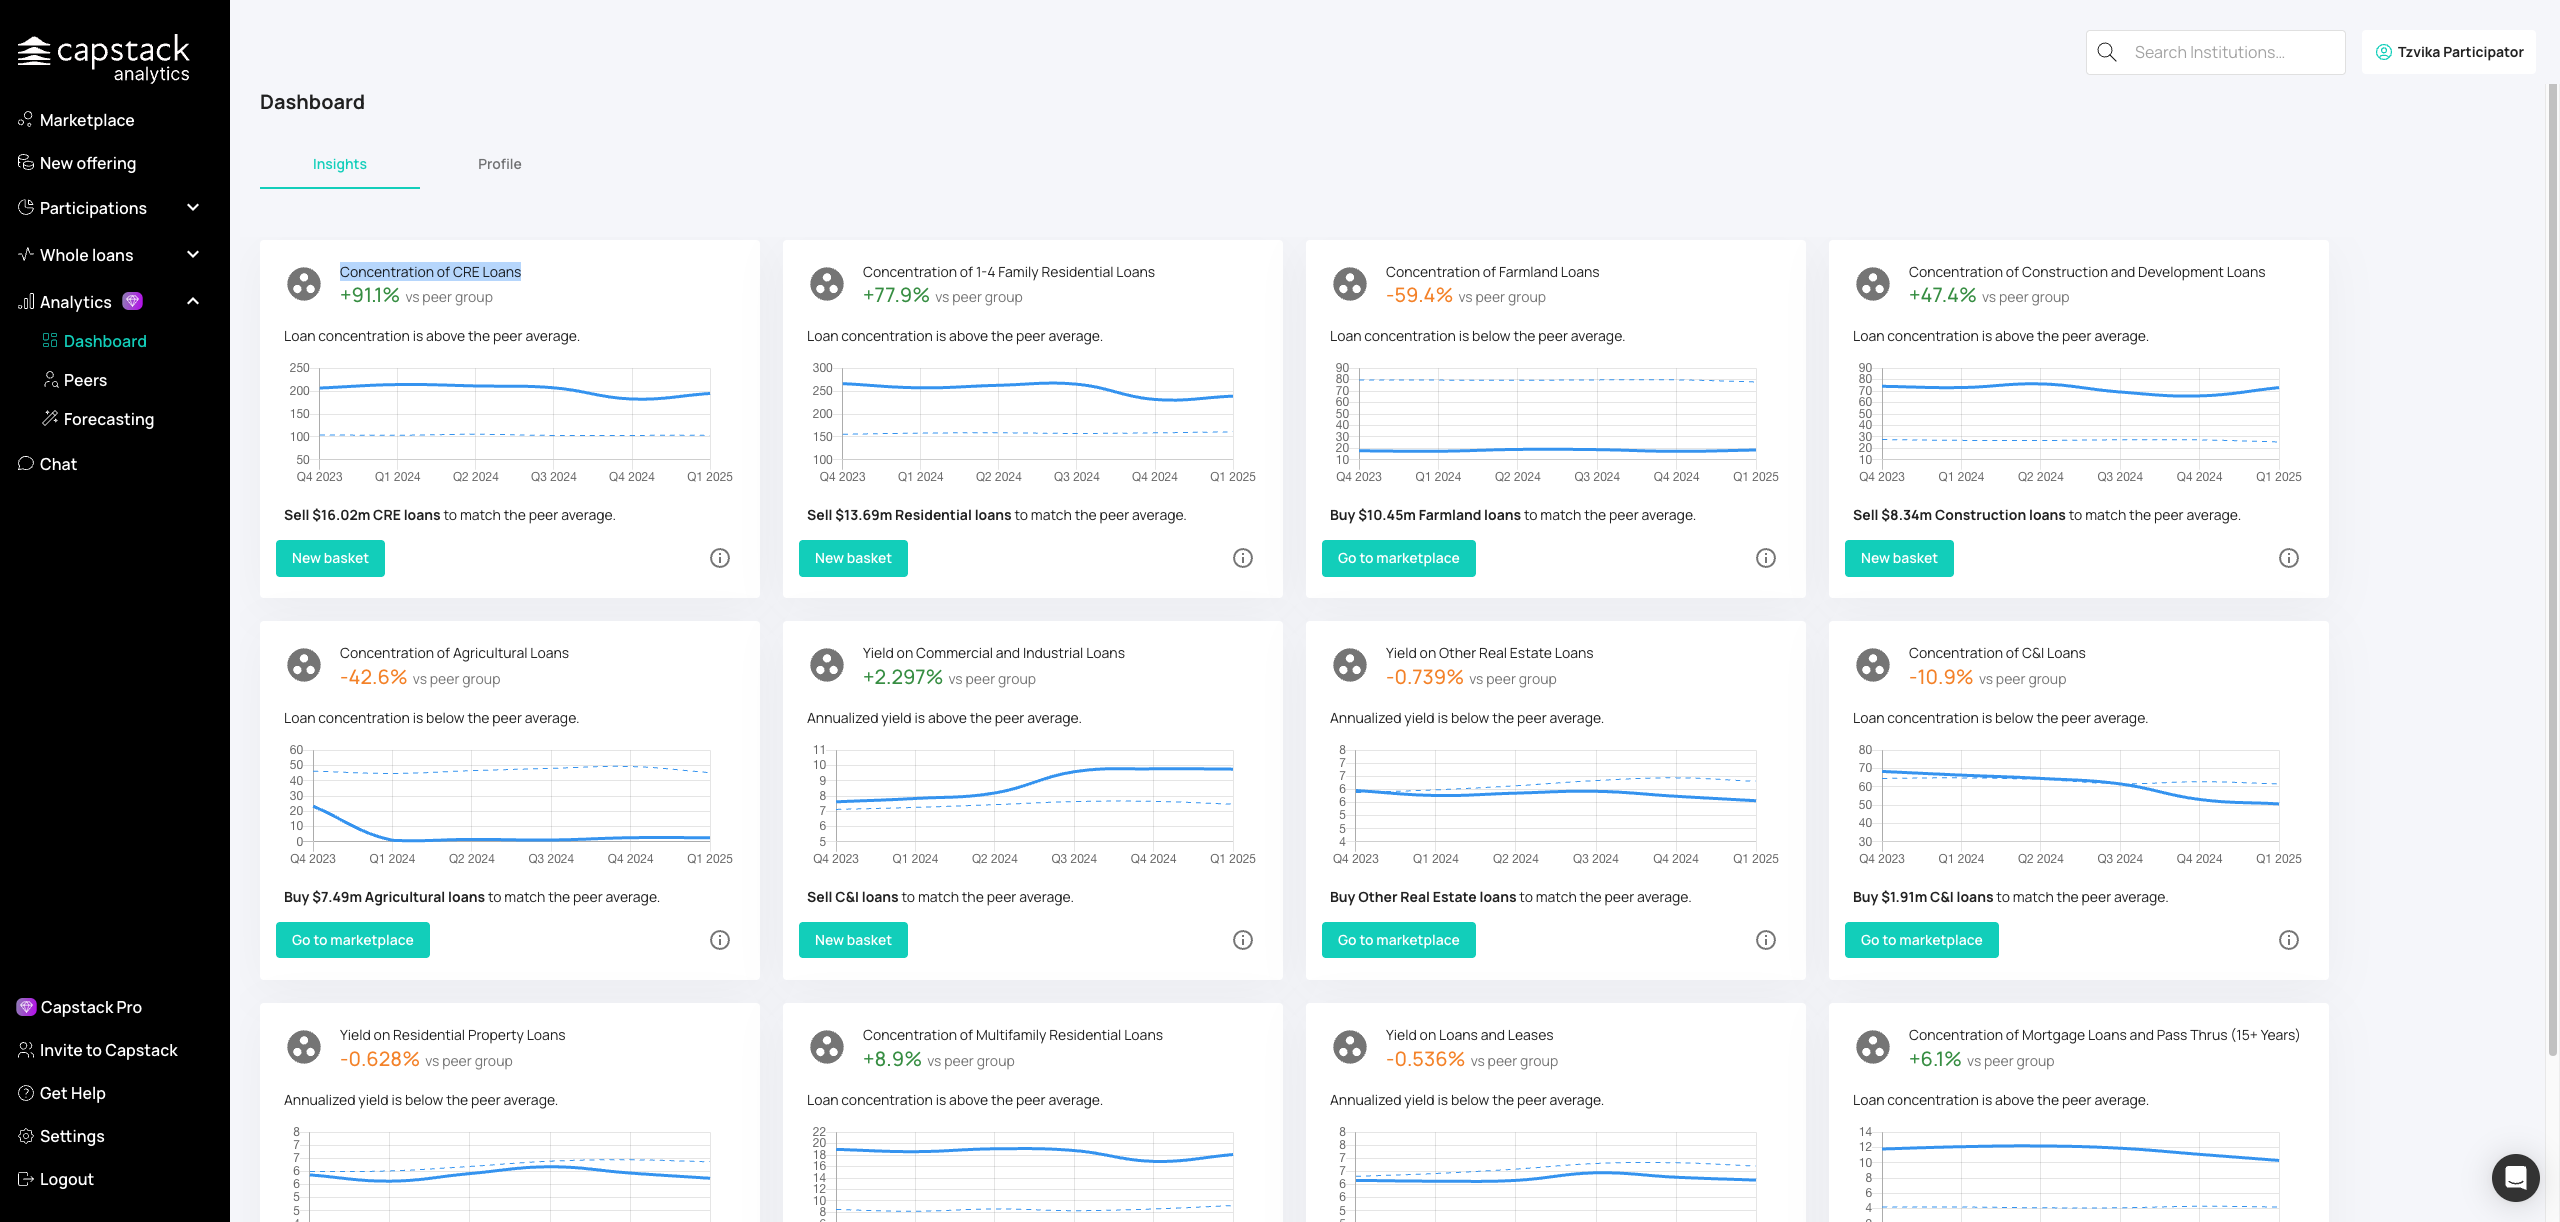
Click on the residential concentration area to access additional loan data and comparisons.
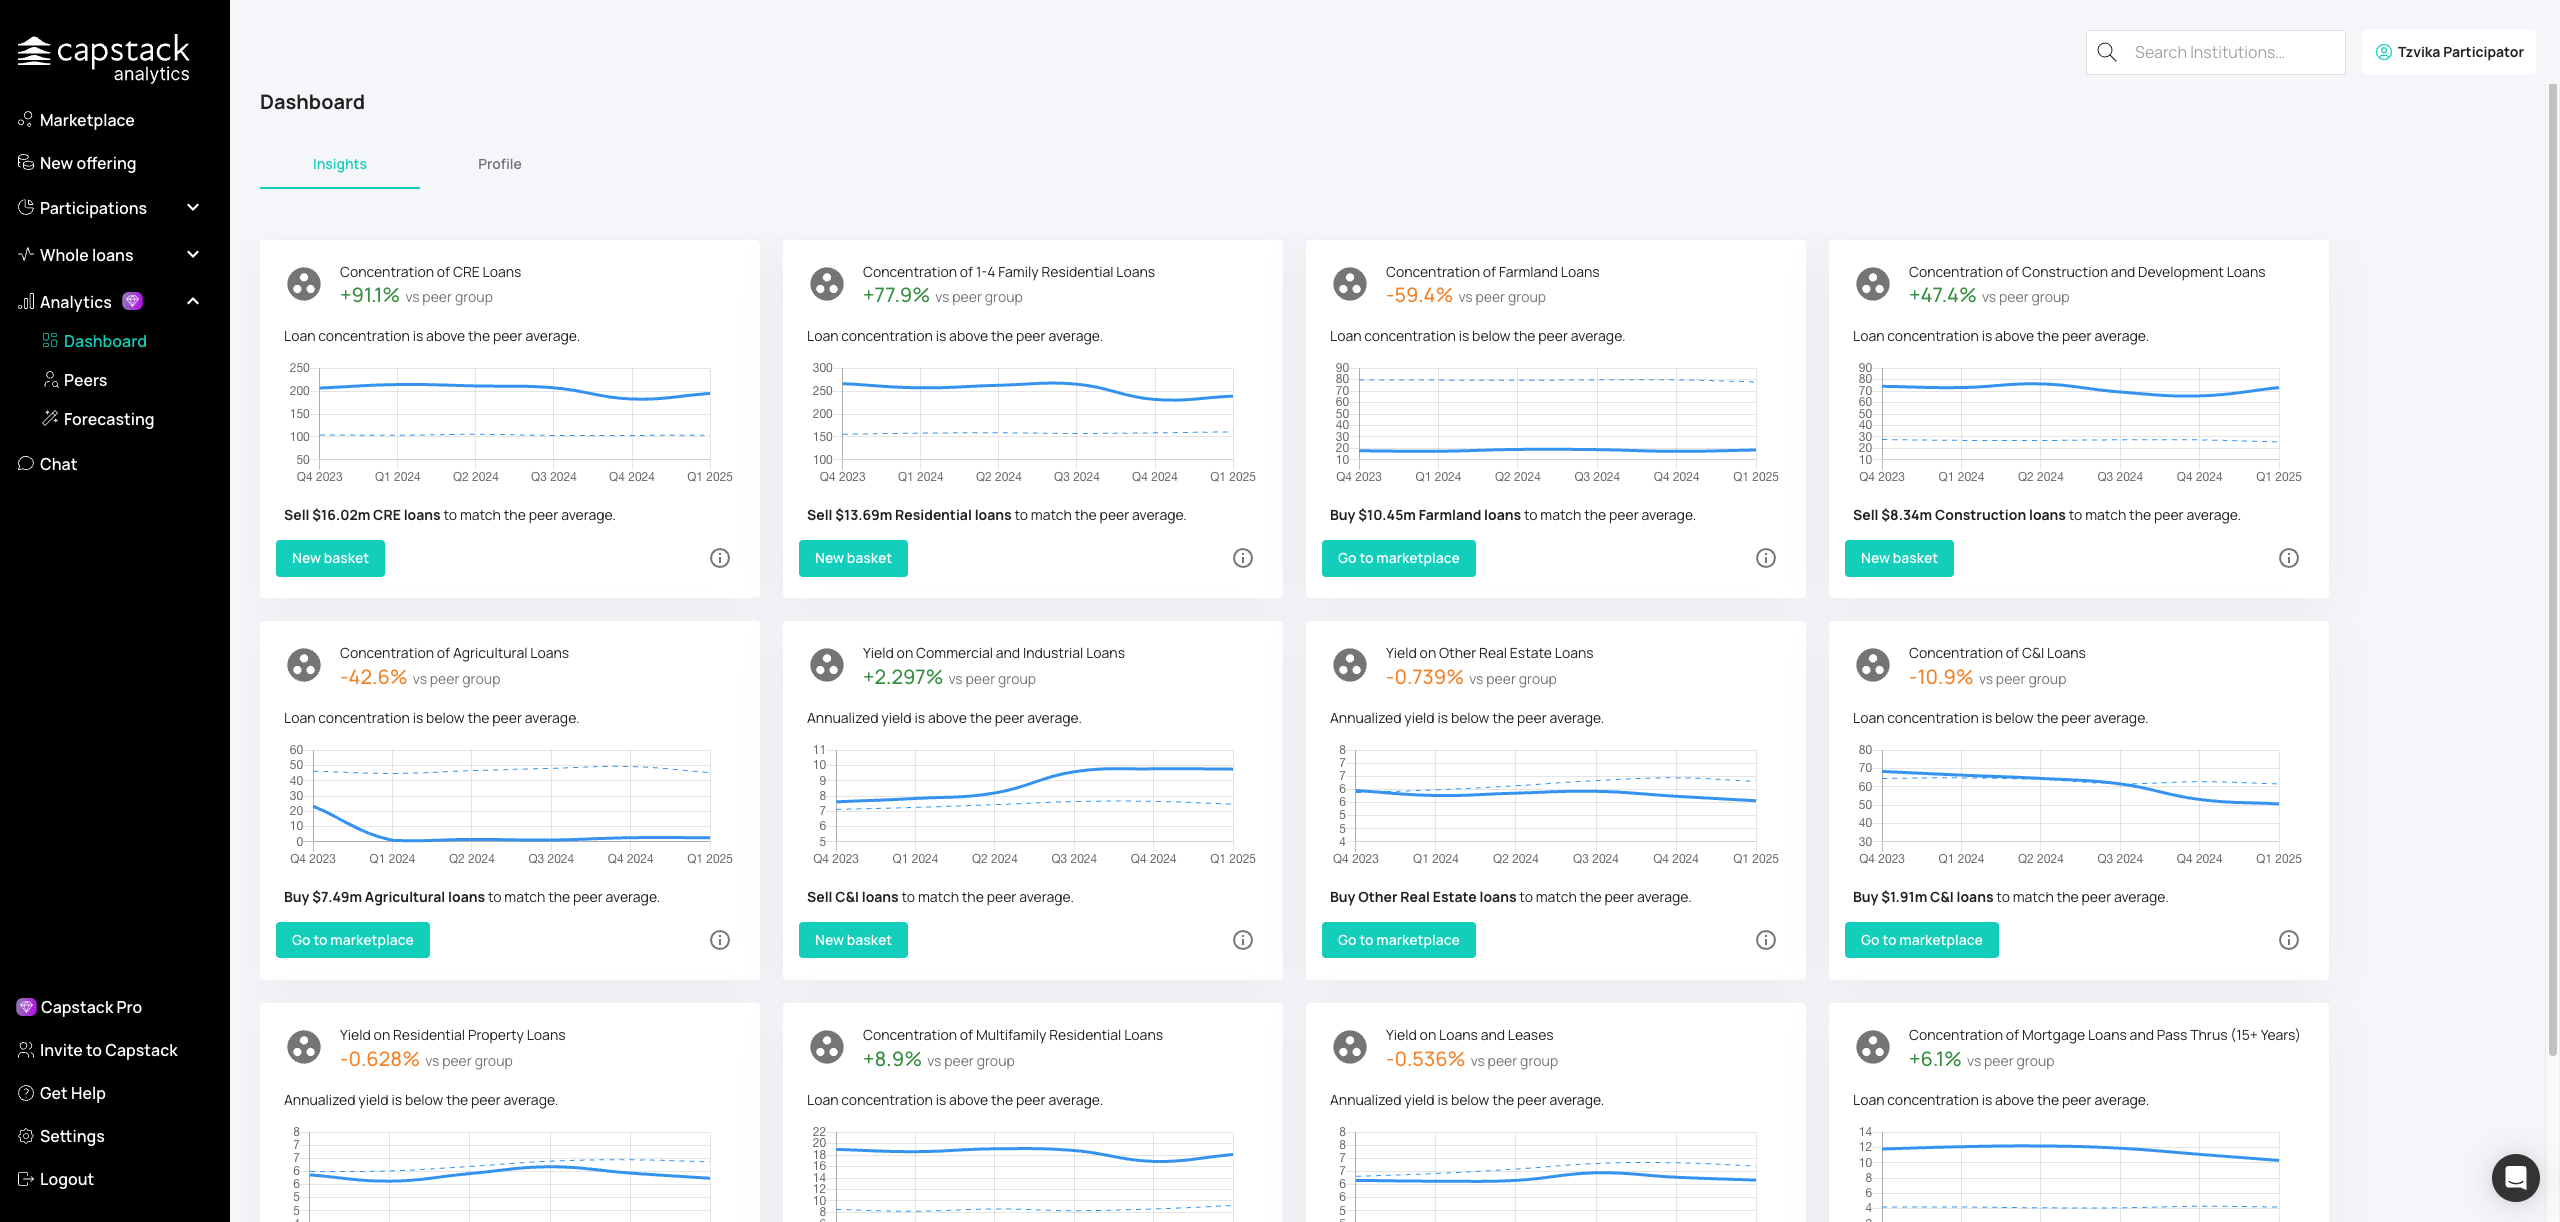
Review your residential lending patterns and compare your mix against peers.
Section 2: Credit Profile Analysis

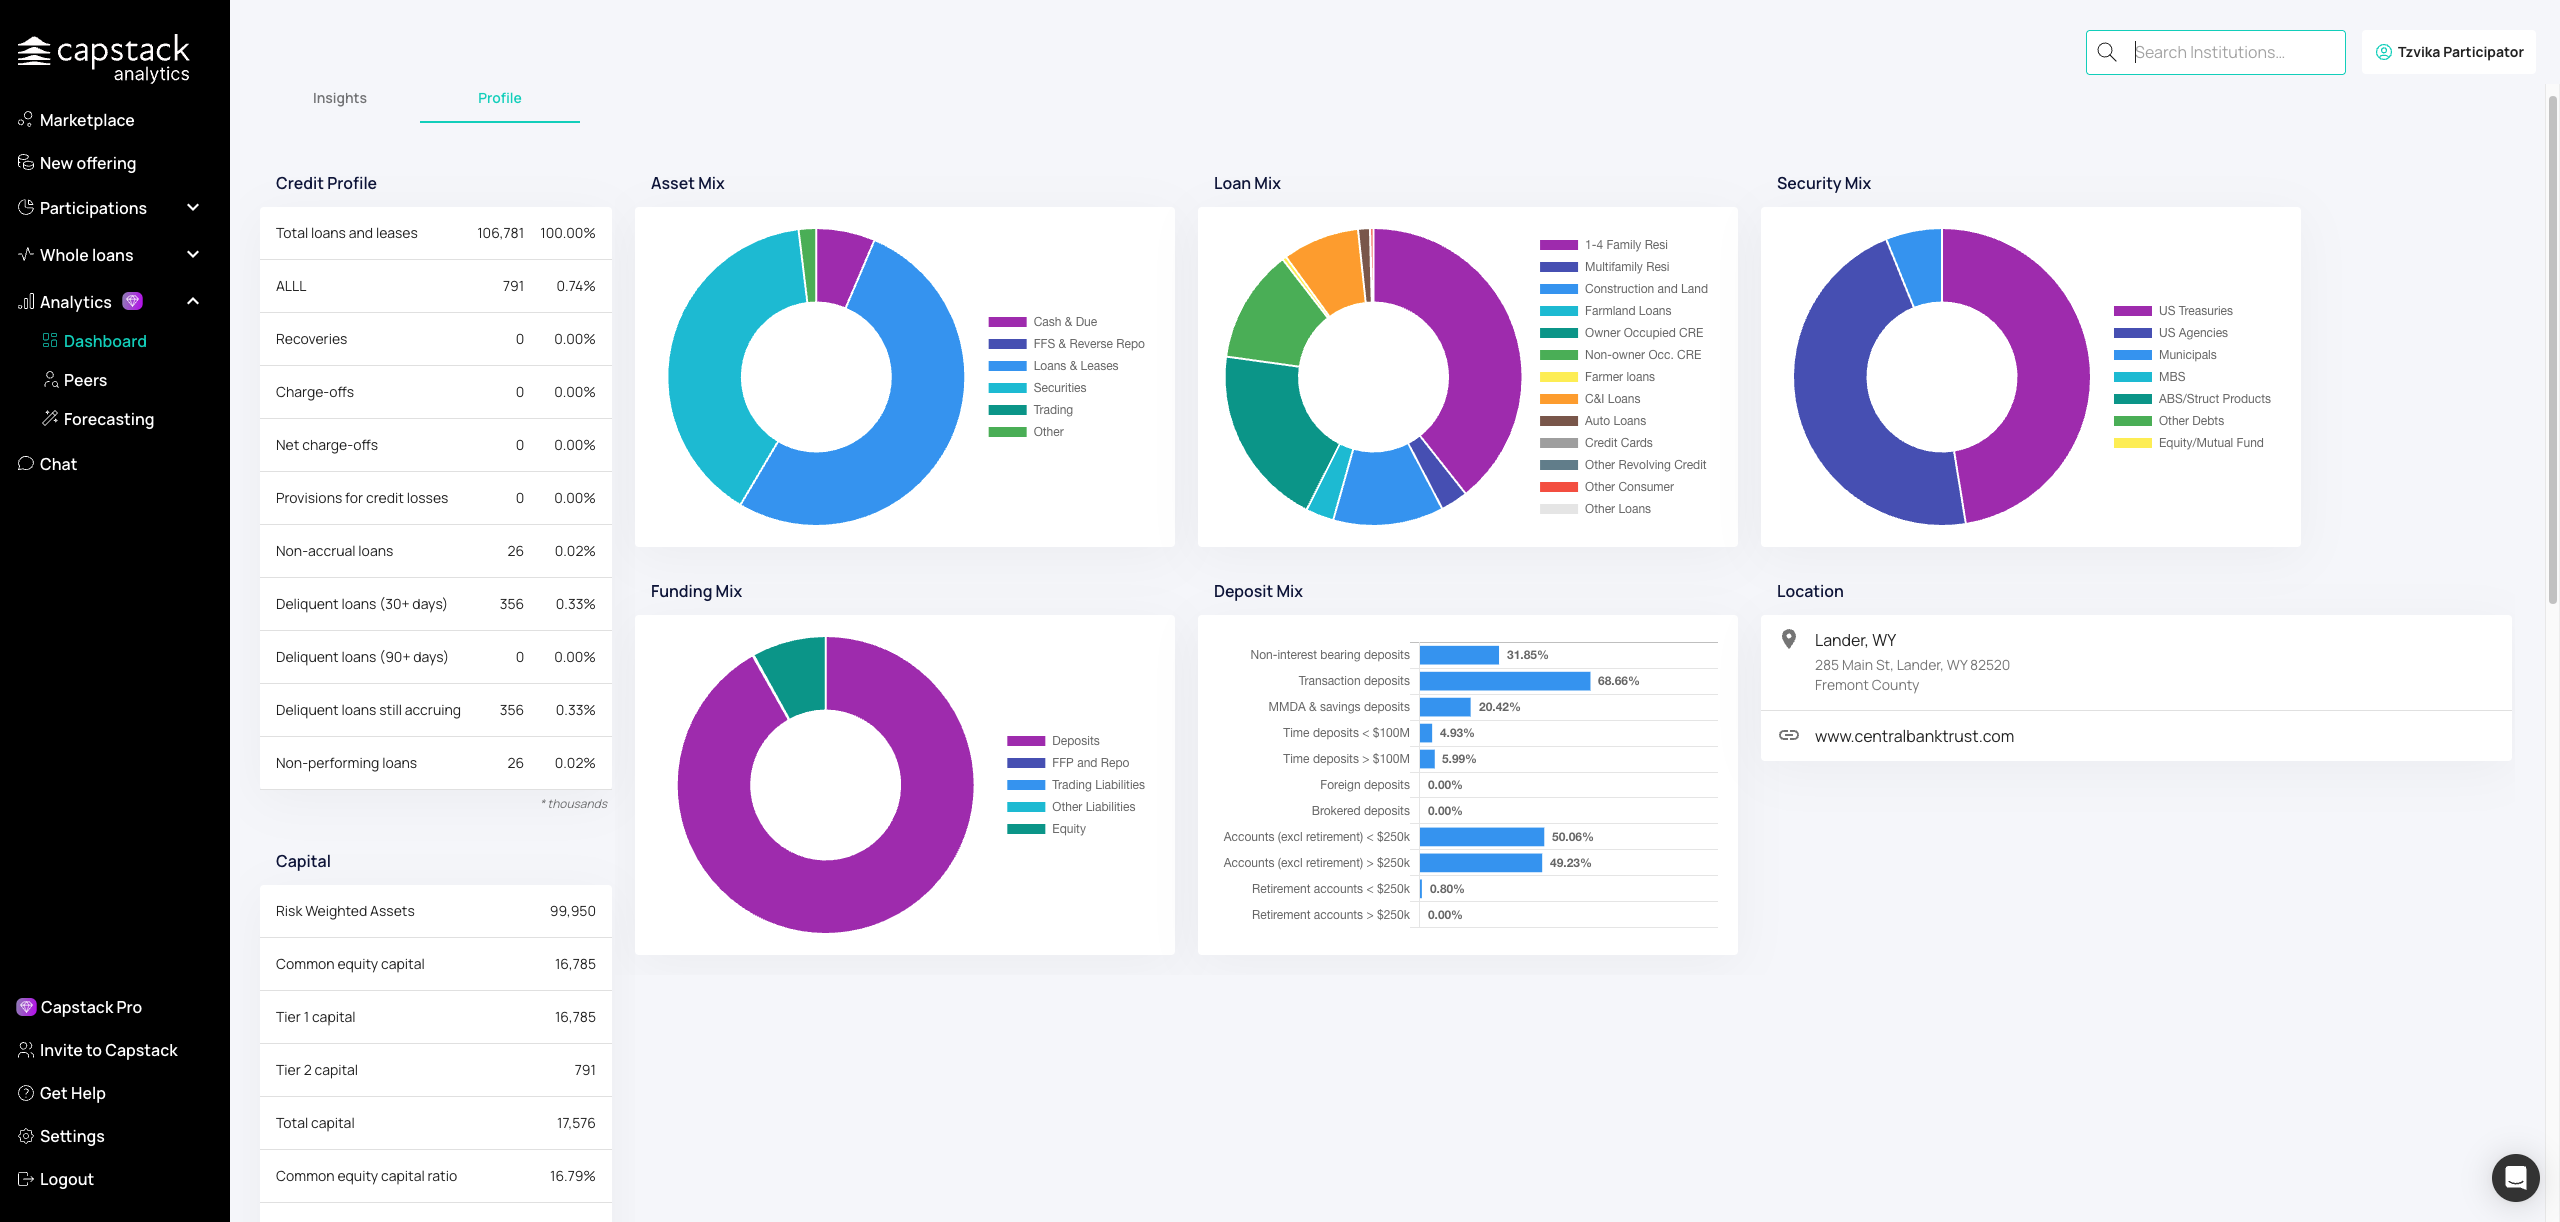
Navigate to the Profile tab to view your credit profile score and see details about your current loan portfolio, loss allowances, charge-offs, and recoveries. You can also review your capital structure, including risk-weighted assets, common equity capital, and Tier 1 capital. Additionally, you will find profitability metrics and bank information.
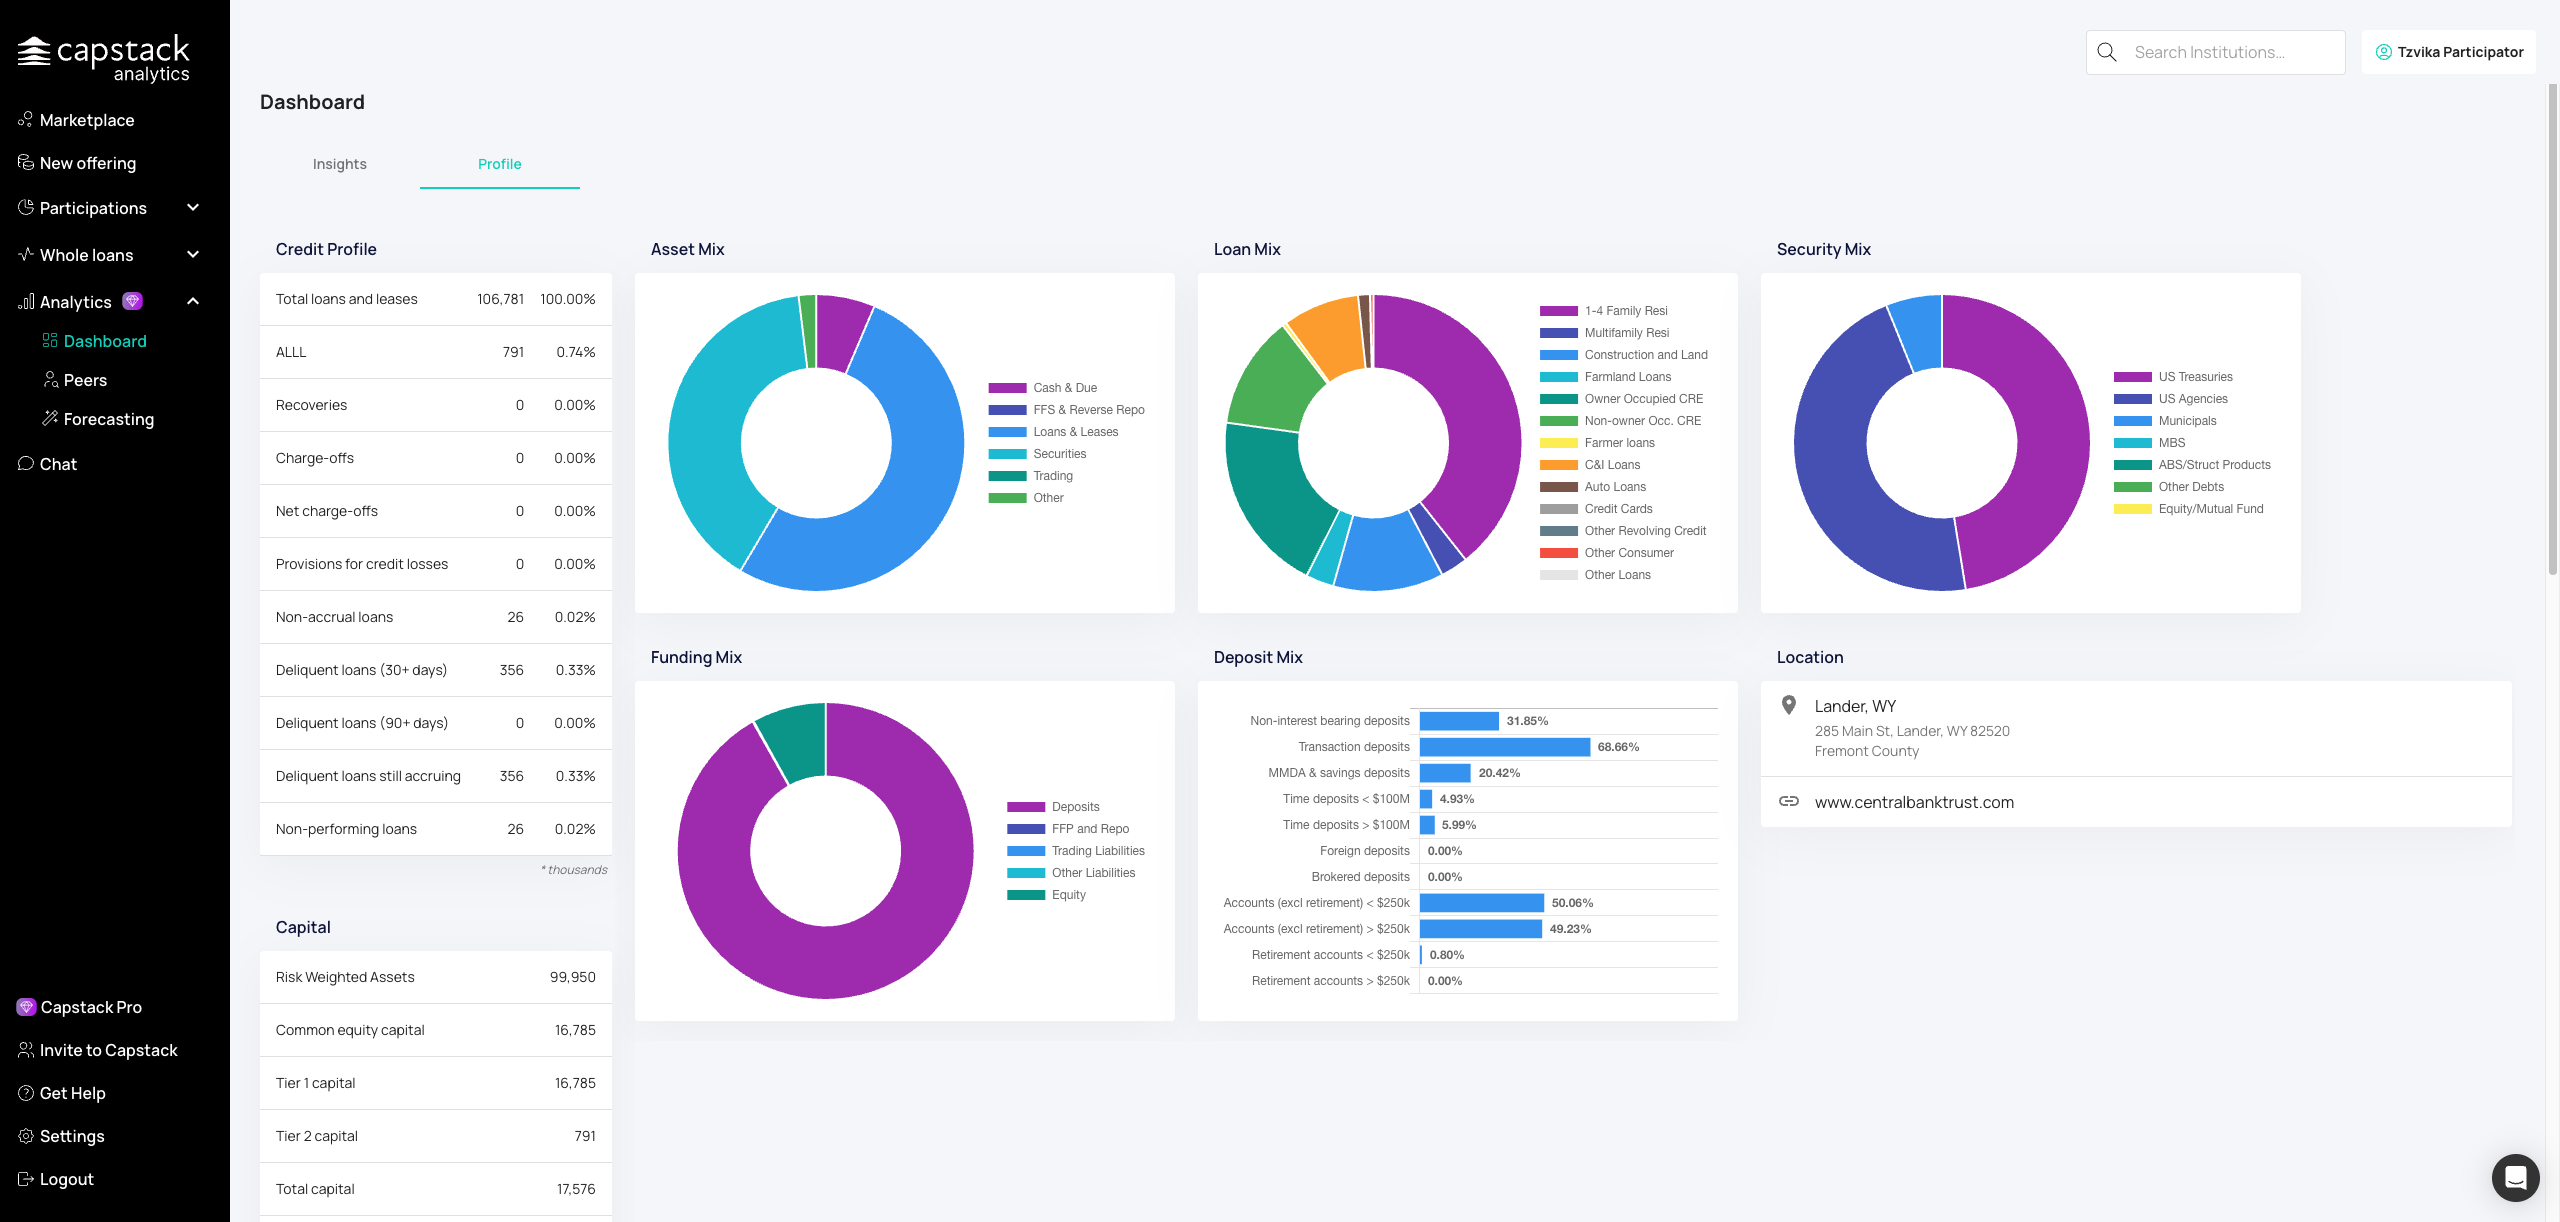
Access details on your loan portfolio, loss allowances, and credit quality metrics.
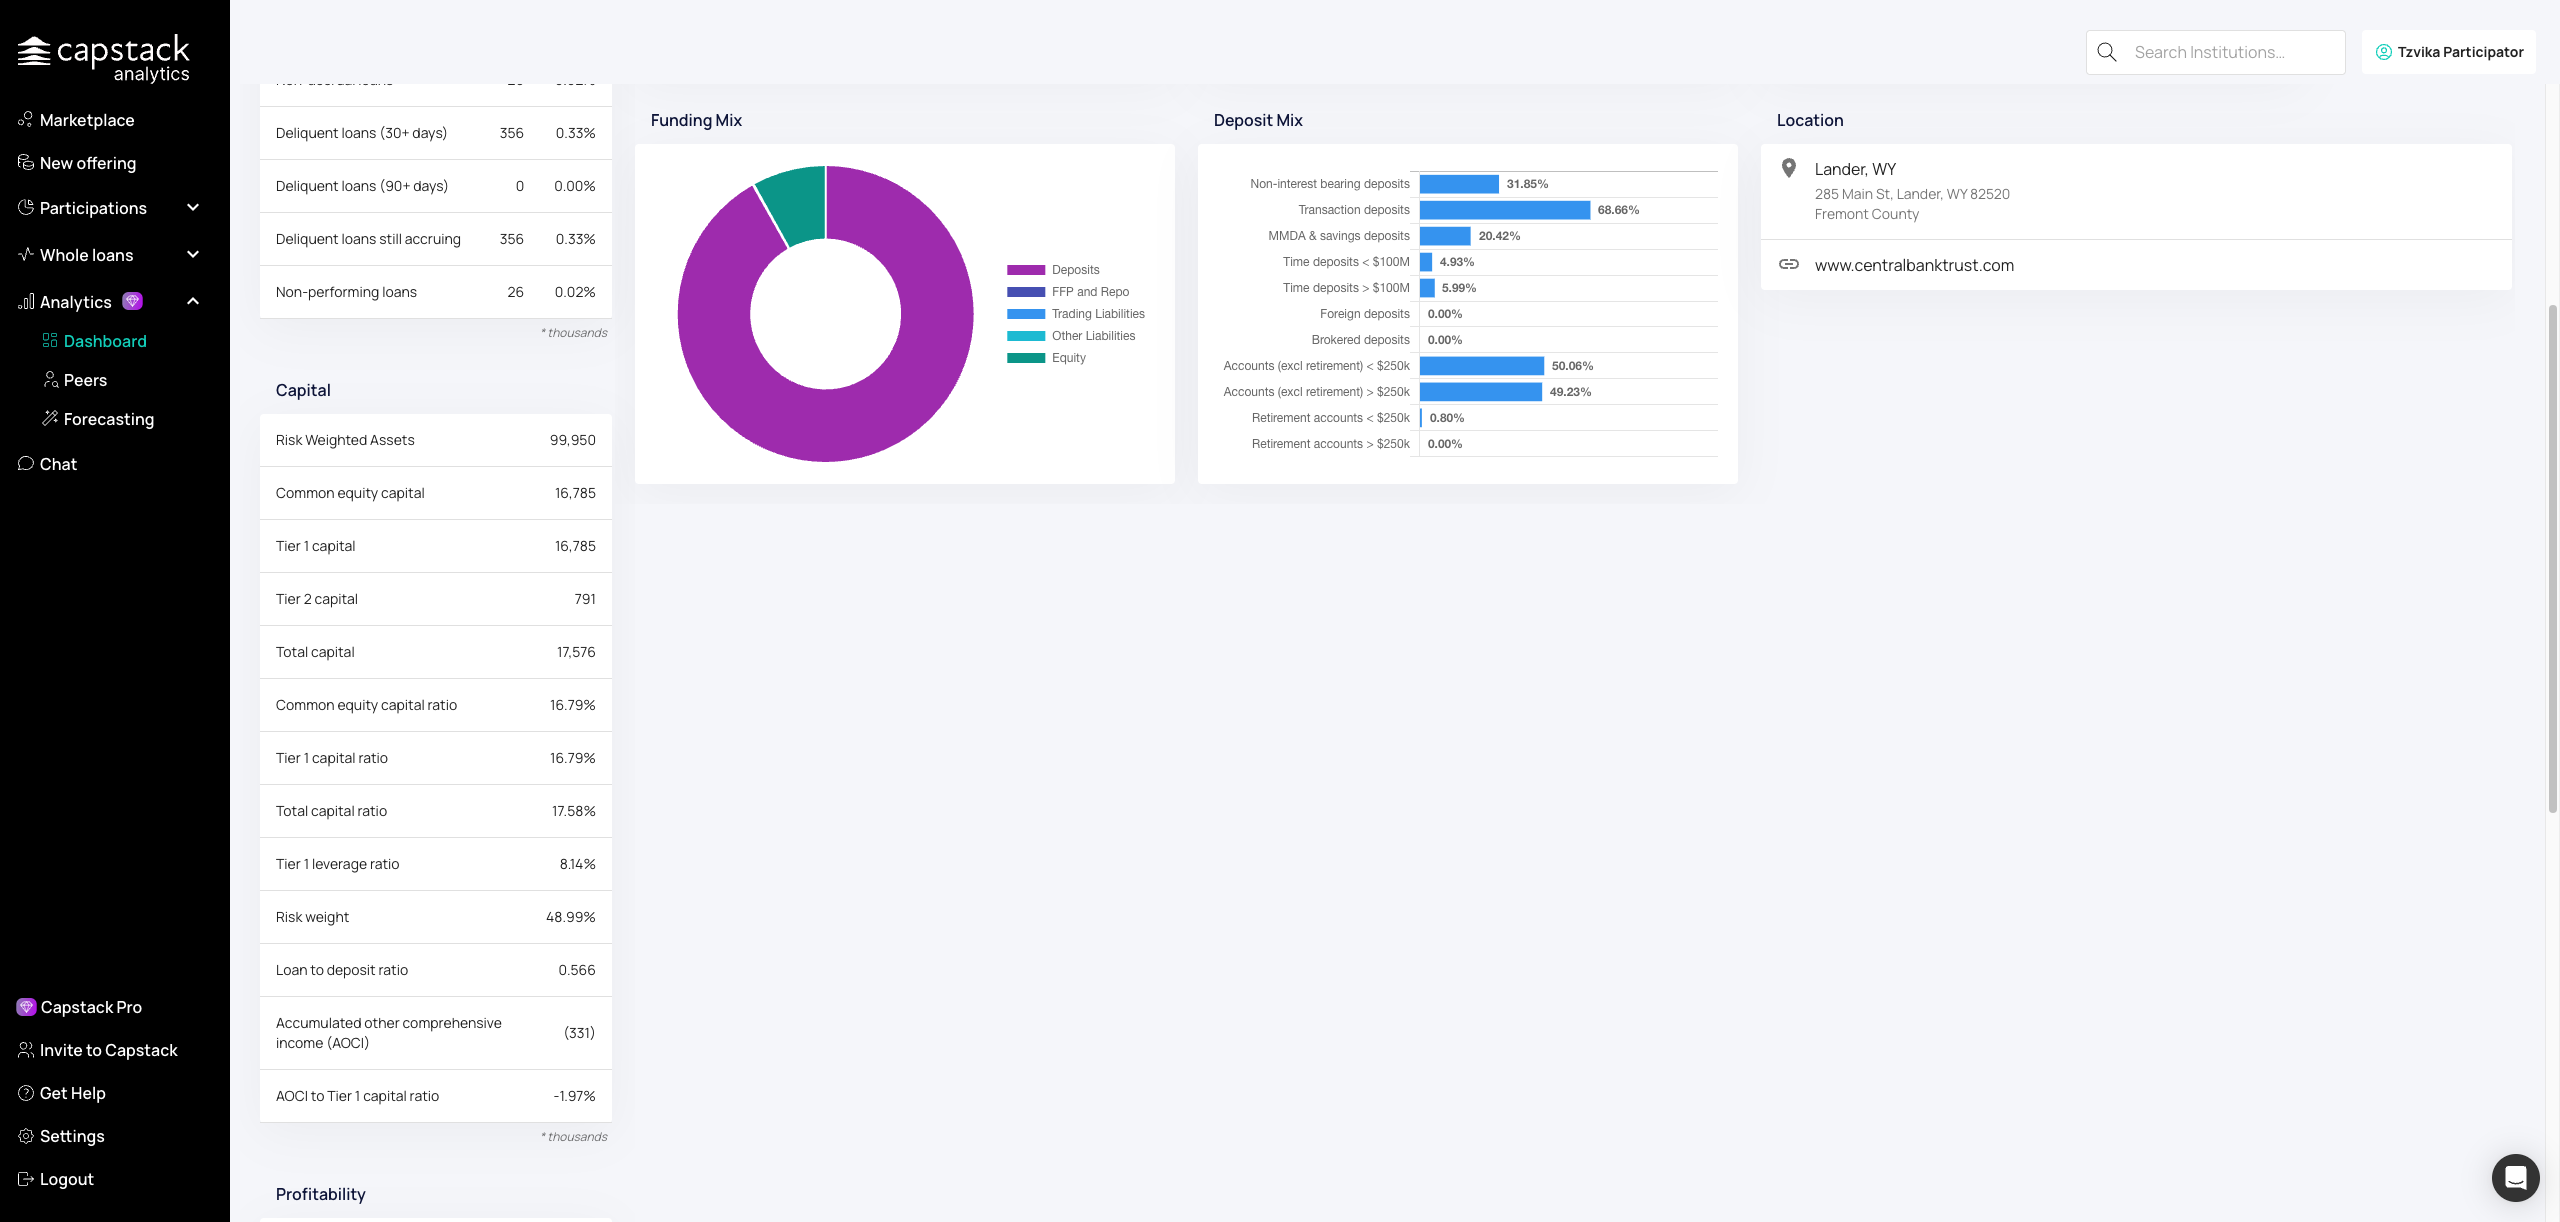
View capital adequacy including risk-weighted assets and capital ratios.
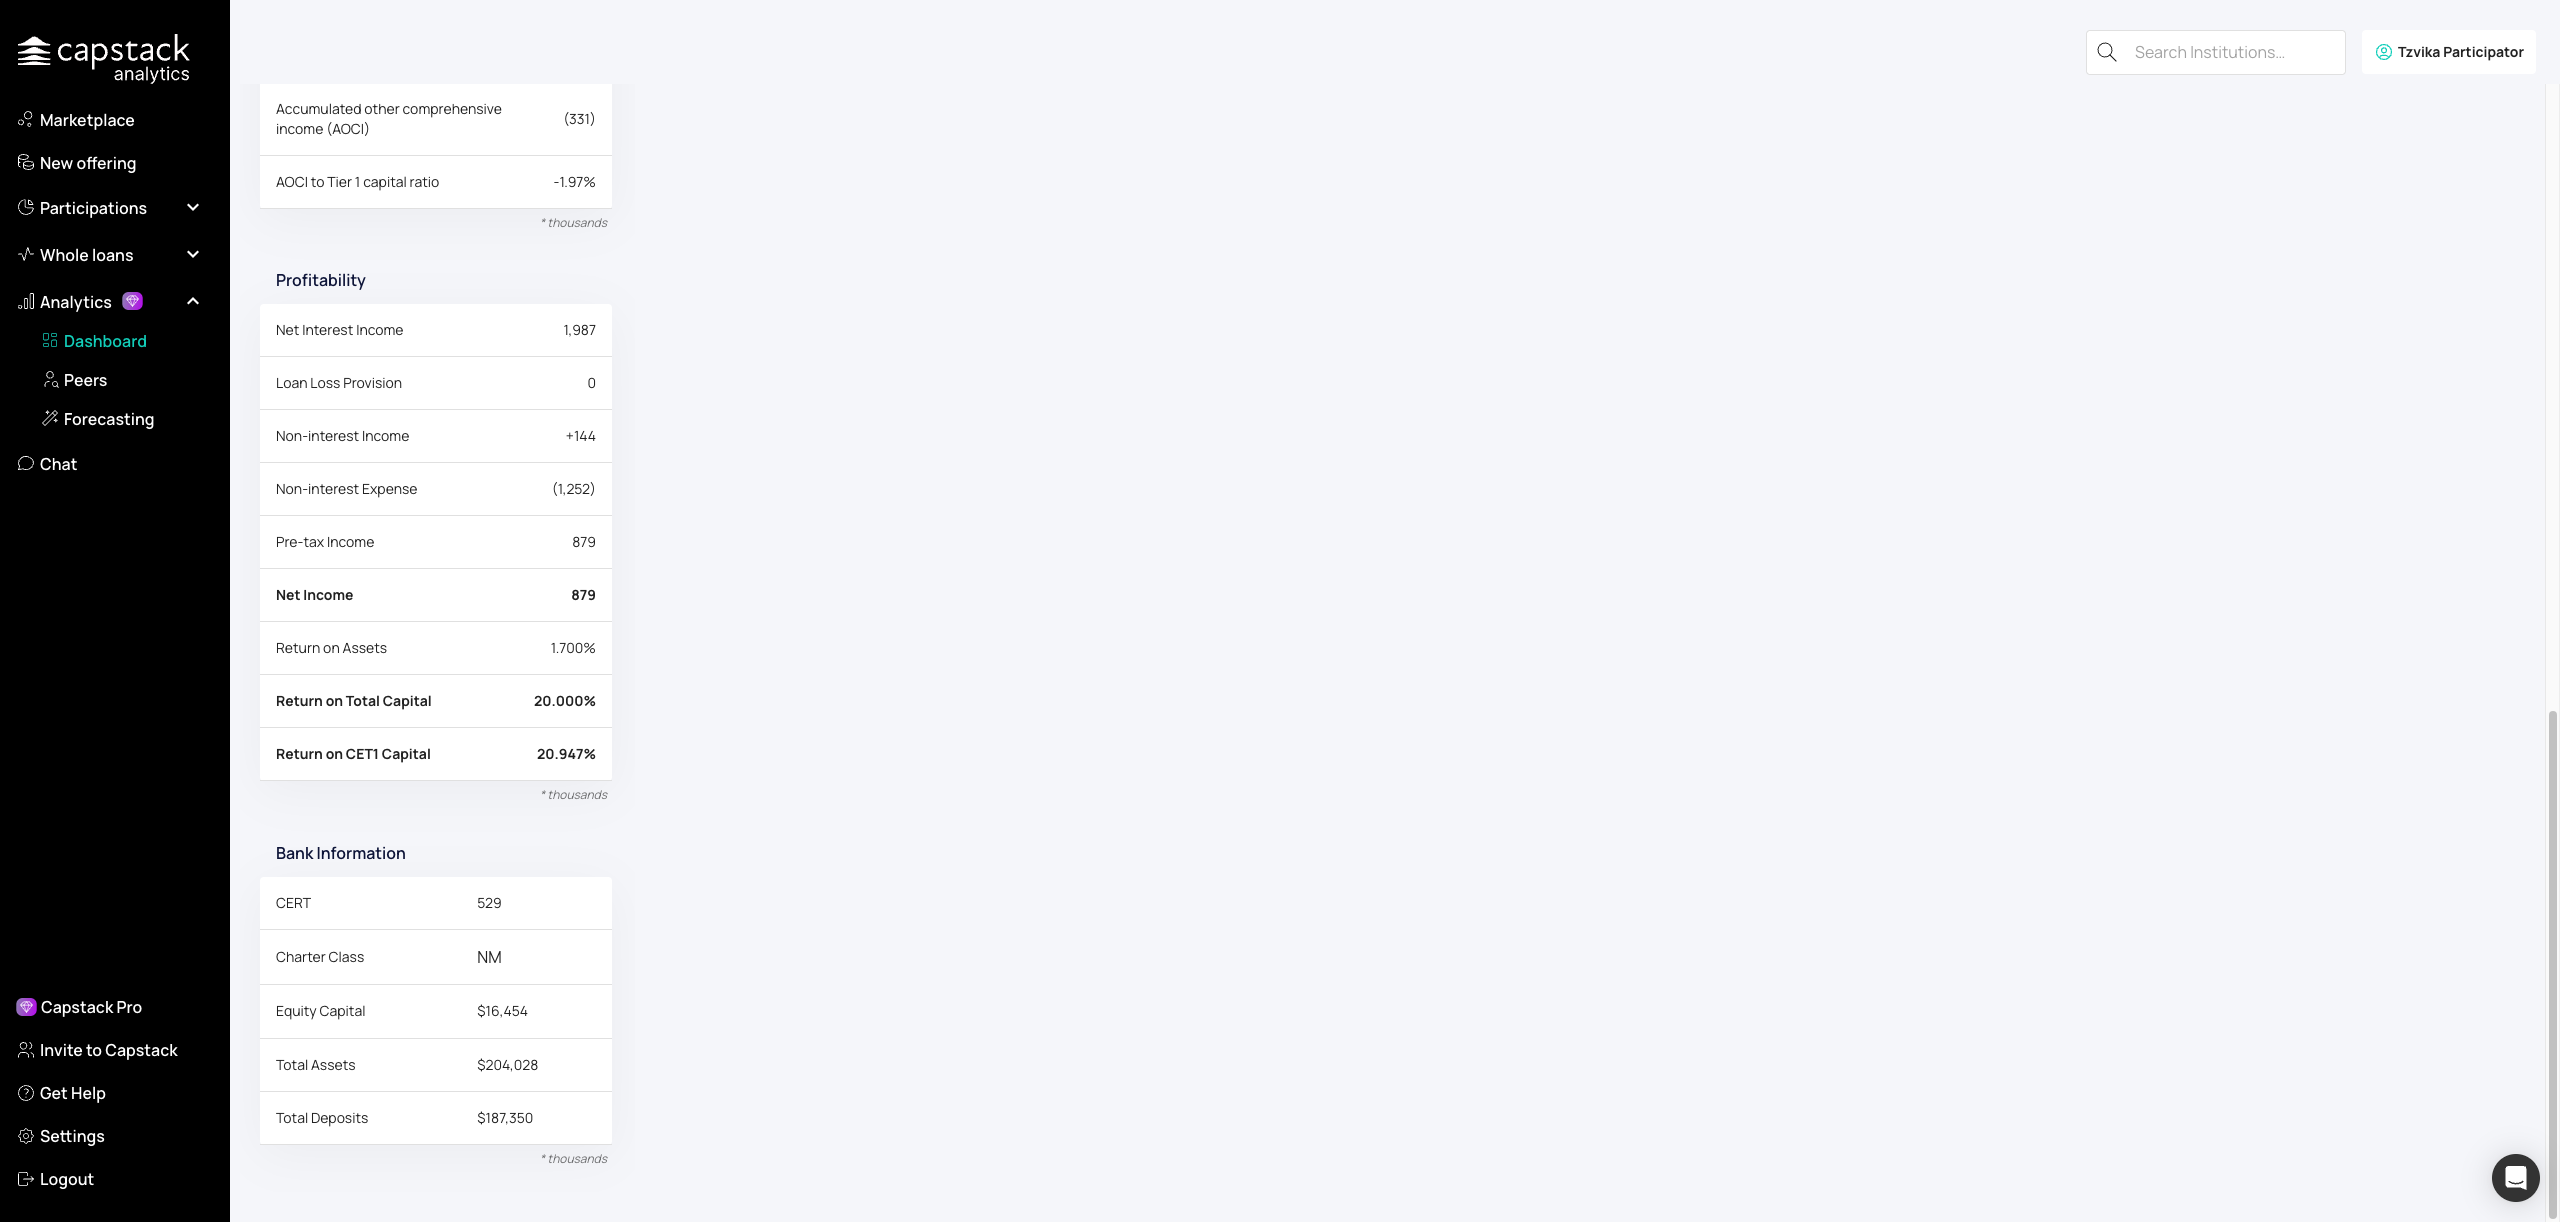
See profitability metrics like net interest income, expenses, and net income.

Review your portfolio composition and how it compares to peers.
Open the search function to find specific banks for comparison.
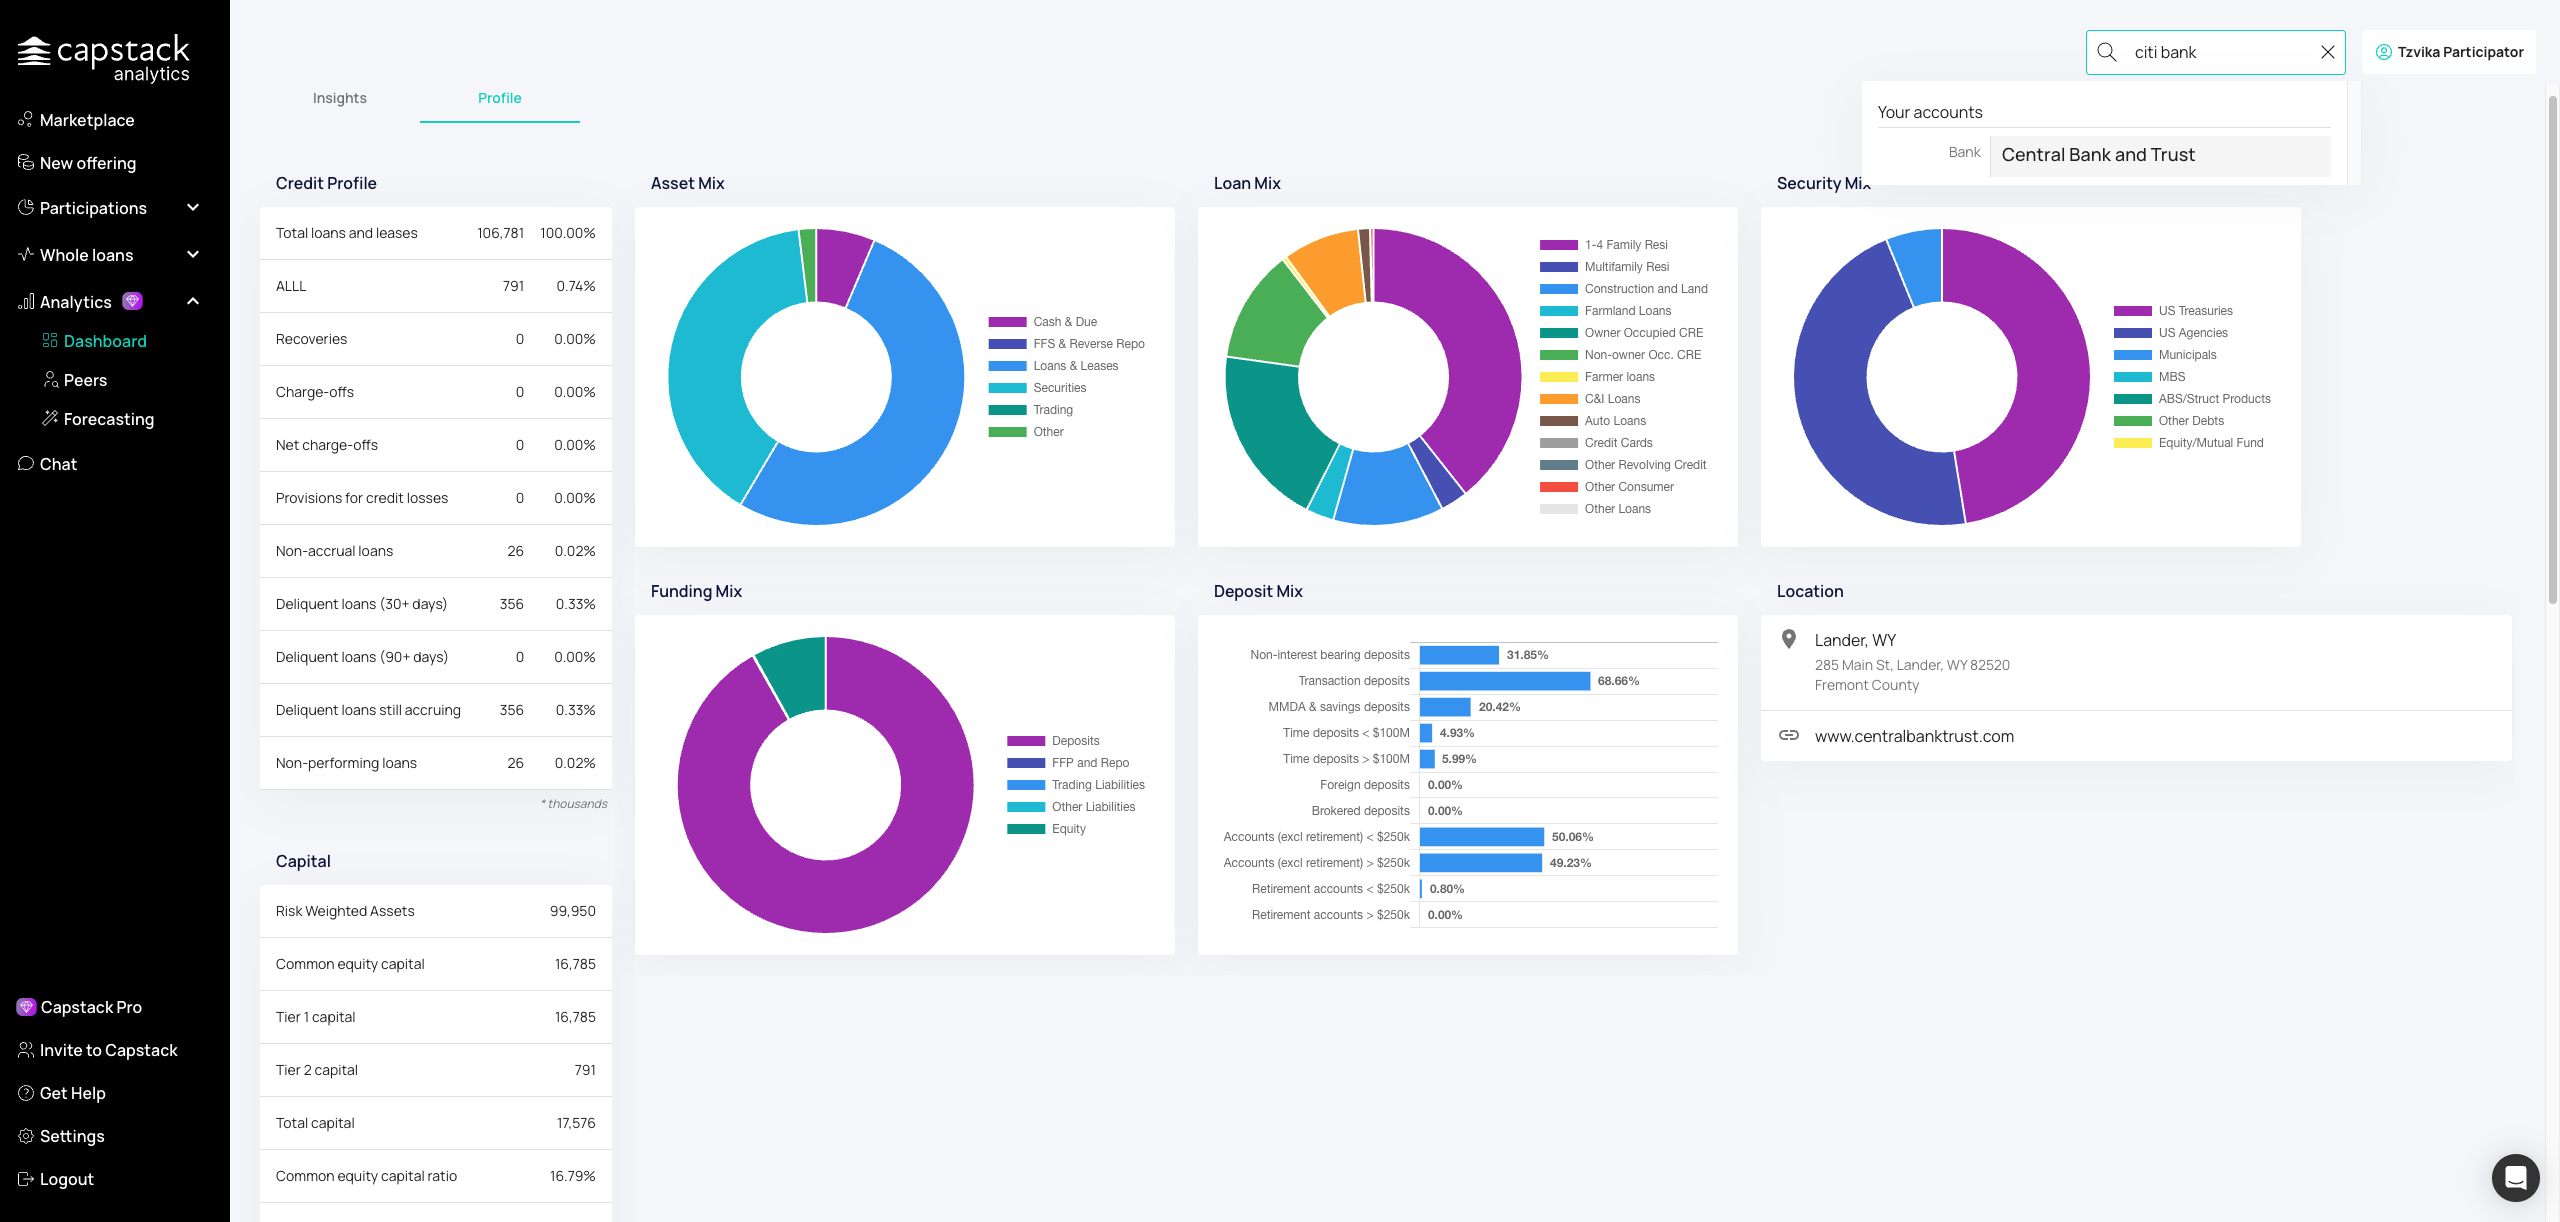
Enter the institution name in the search field to access their financial data.
Section 3: Peer Group Analysis

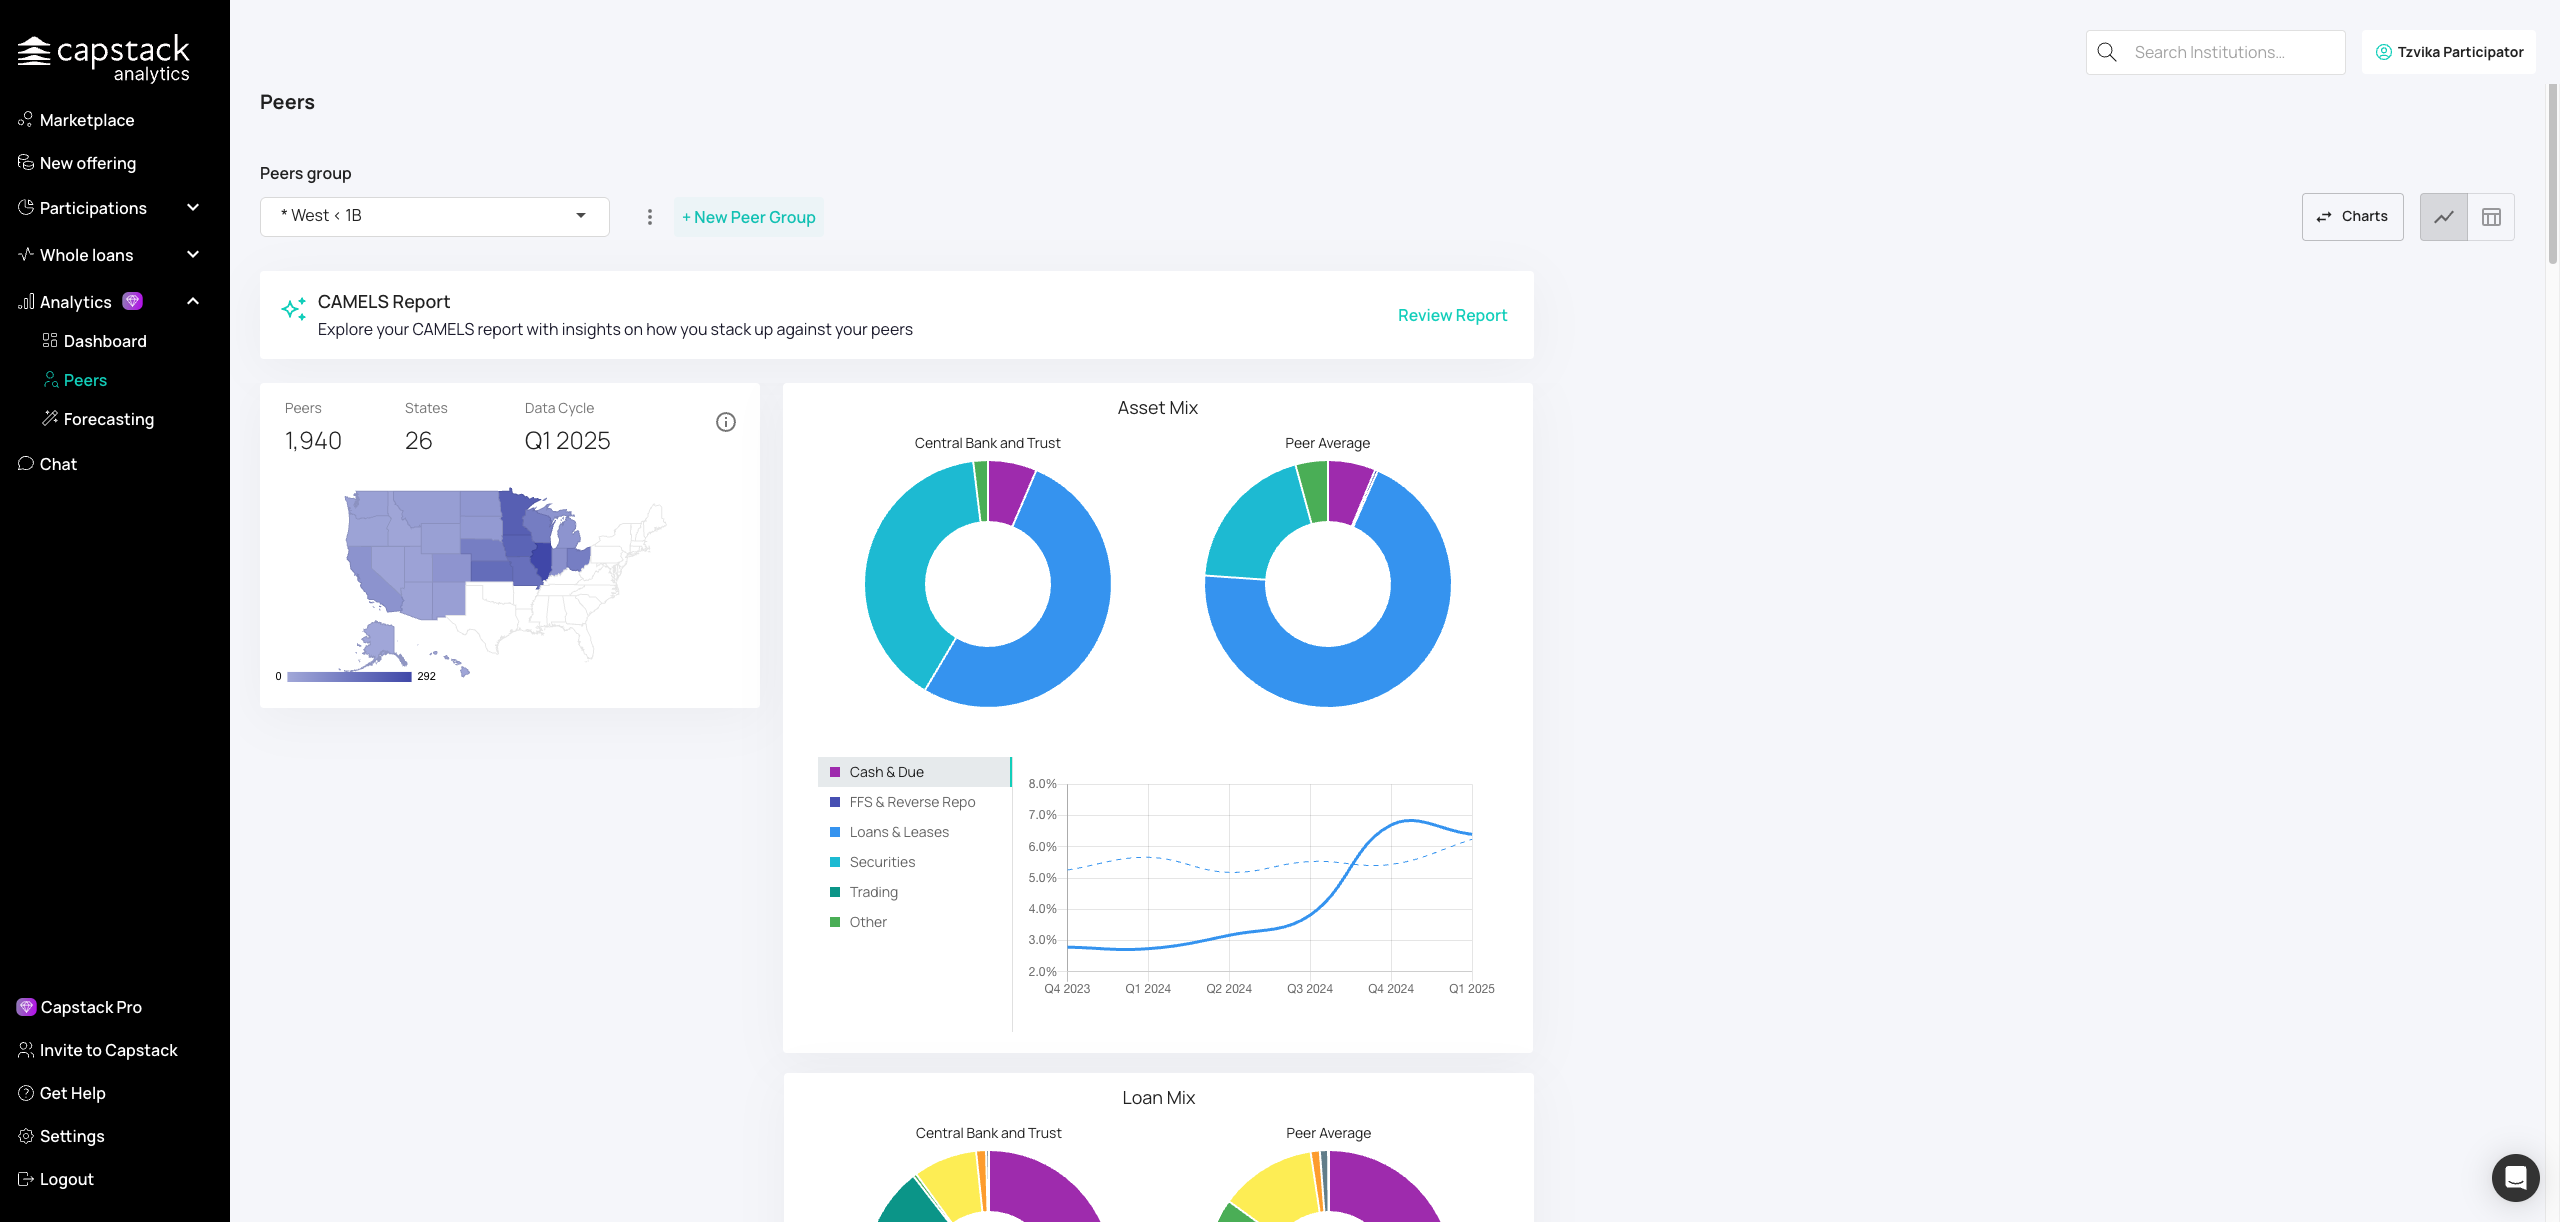
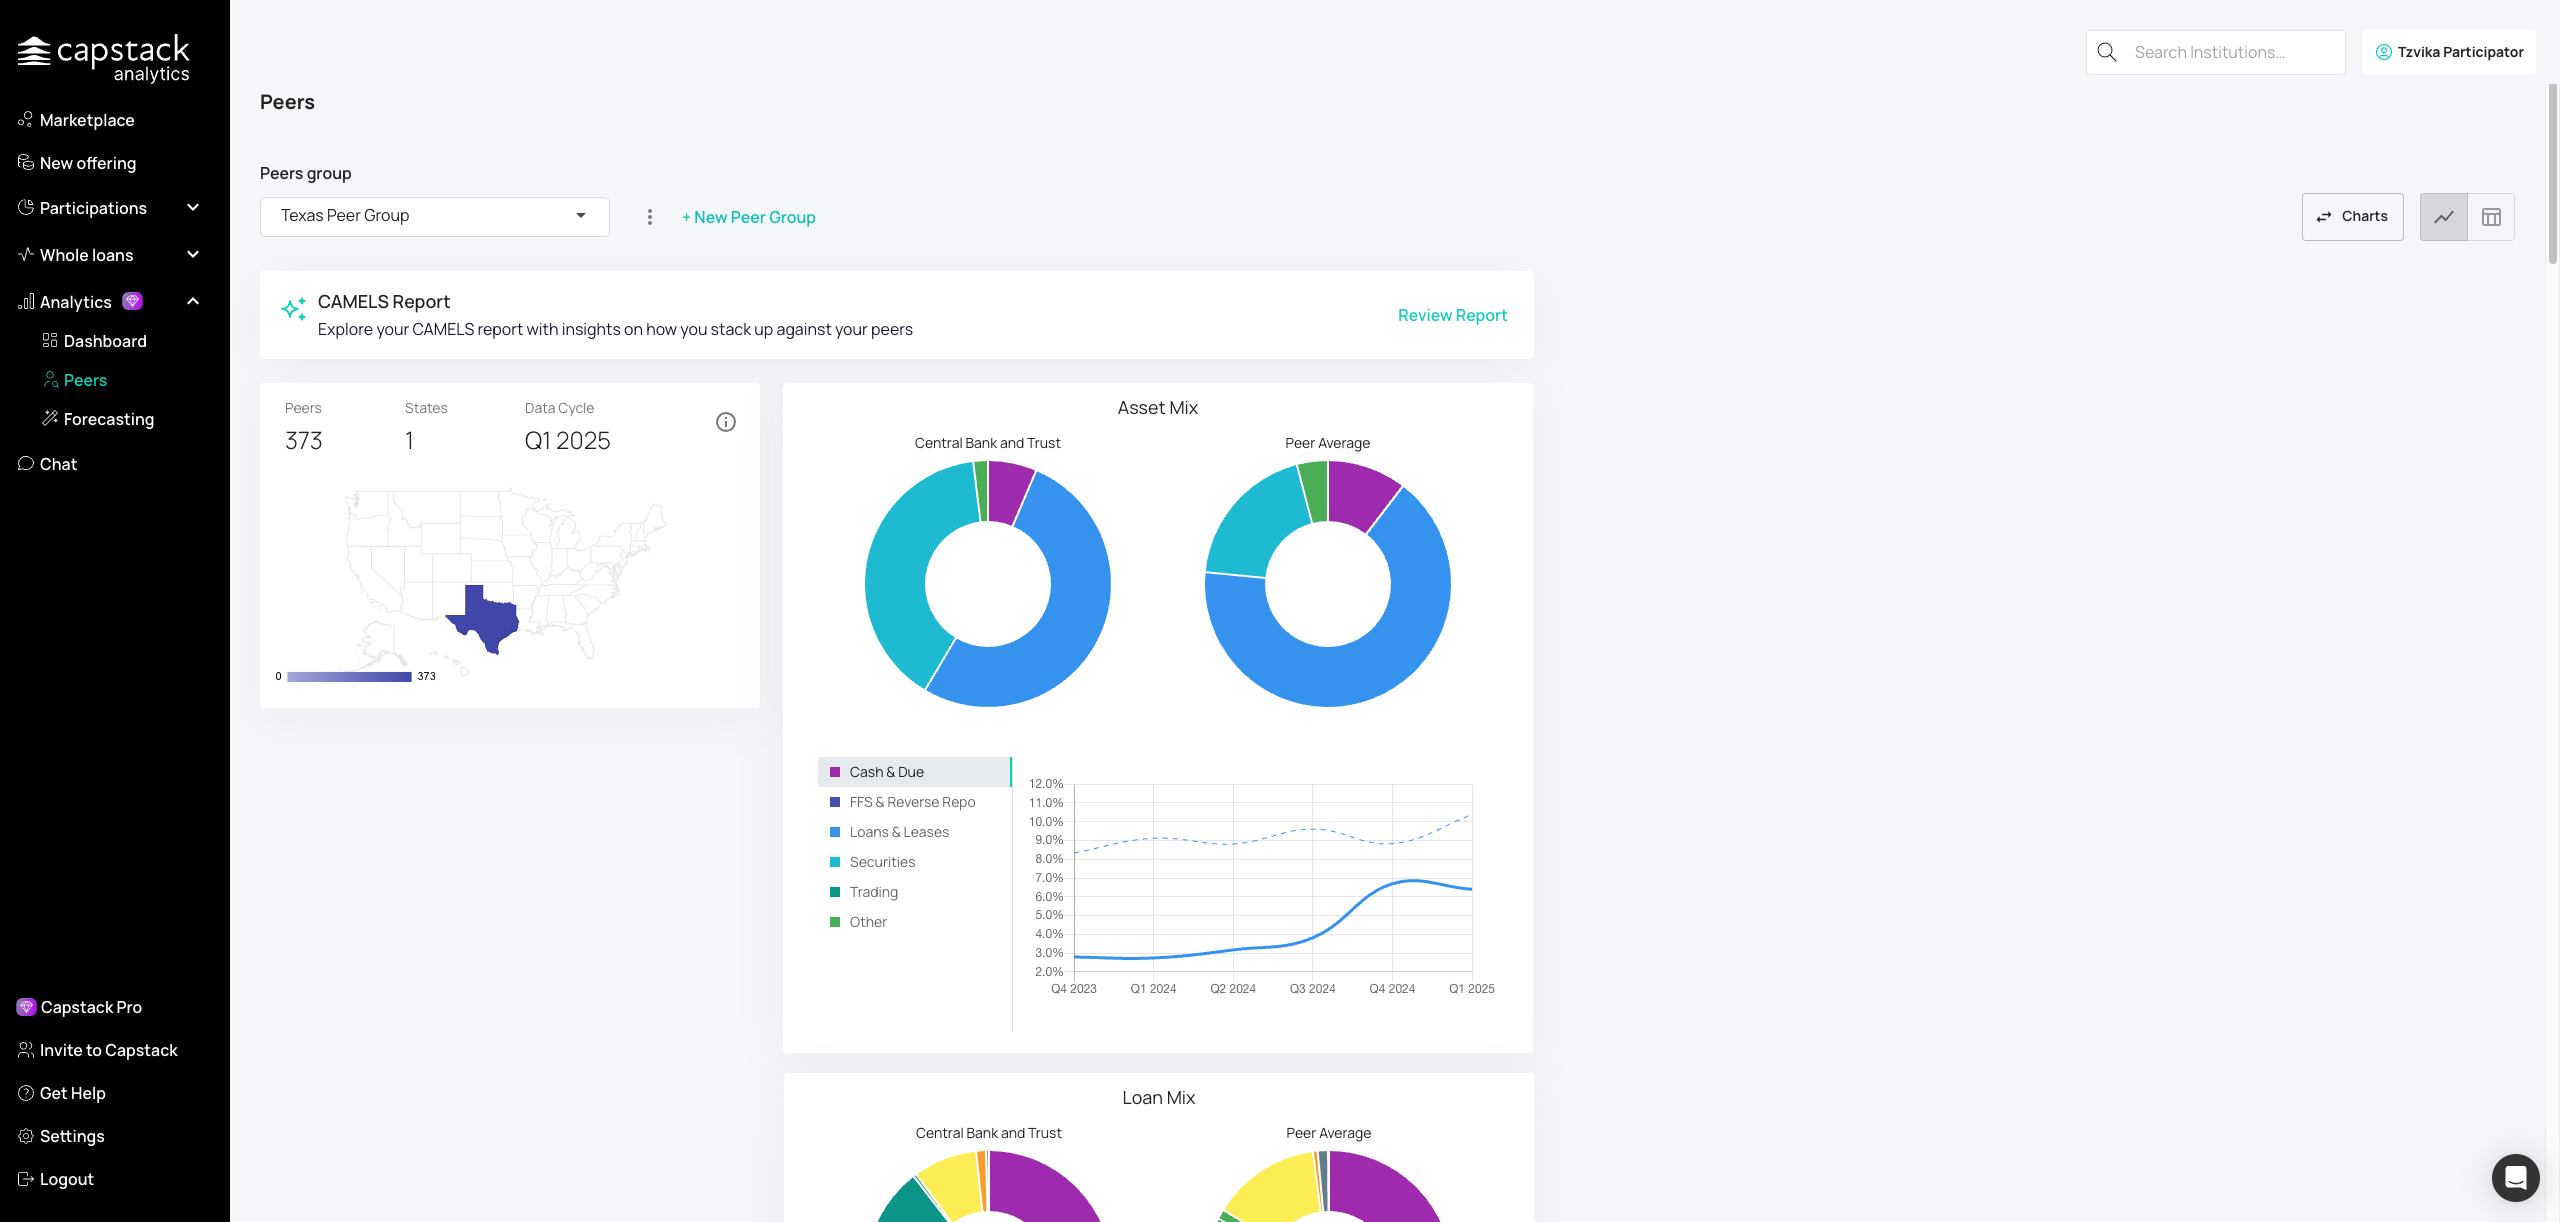
Navigate to the Peers section to create and view peer group comparisons. In the Peer Groups tab, you can see a comparison between yourself and your peer groups, including asset mix, loan mix, security mix, and funding risks. You will also see graphs that compare your data to your peer groups and can create new peer groups by selecting banks from specific states or regions.
Start building a new custom peer group for benchmarking.
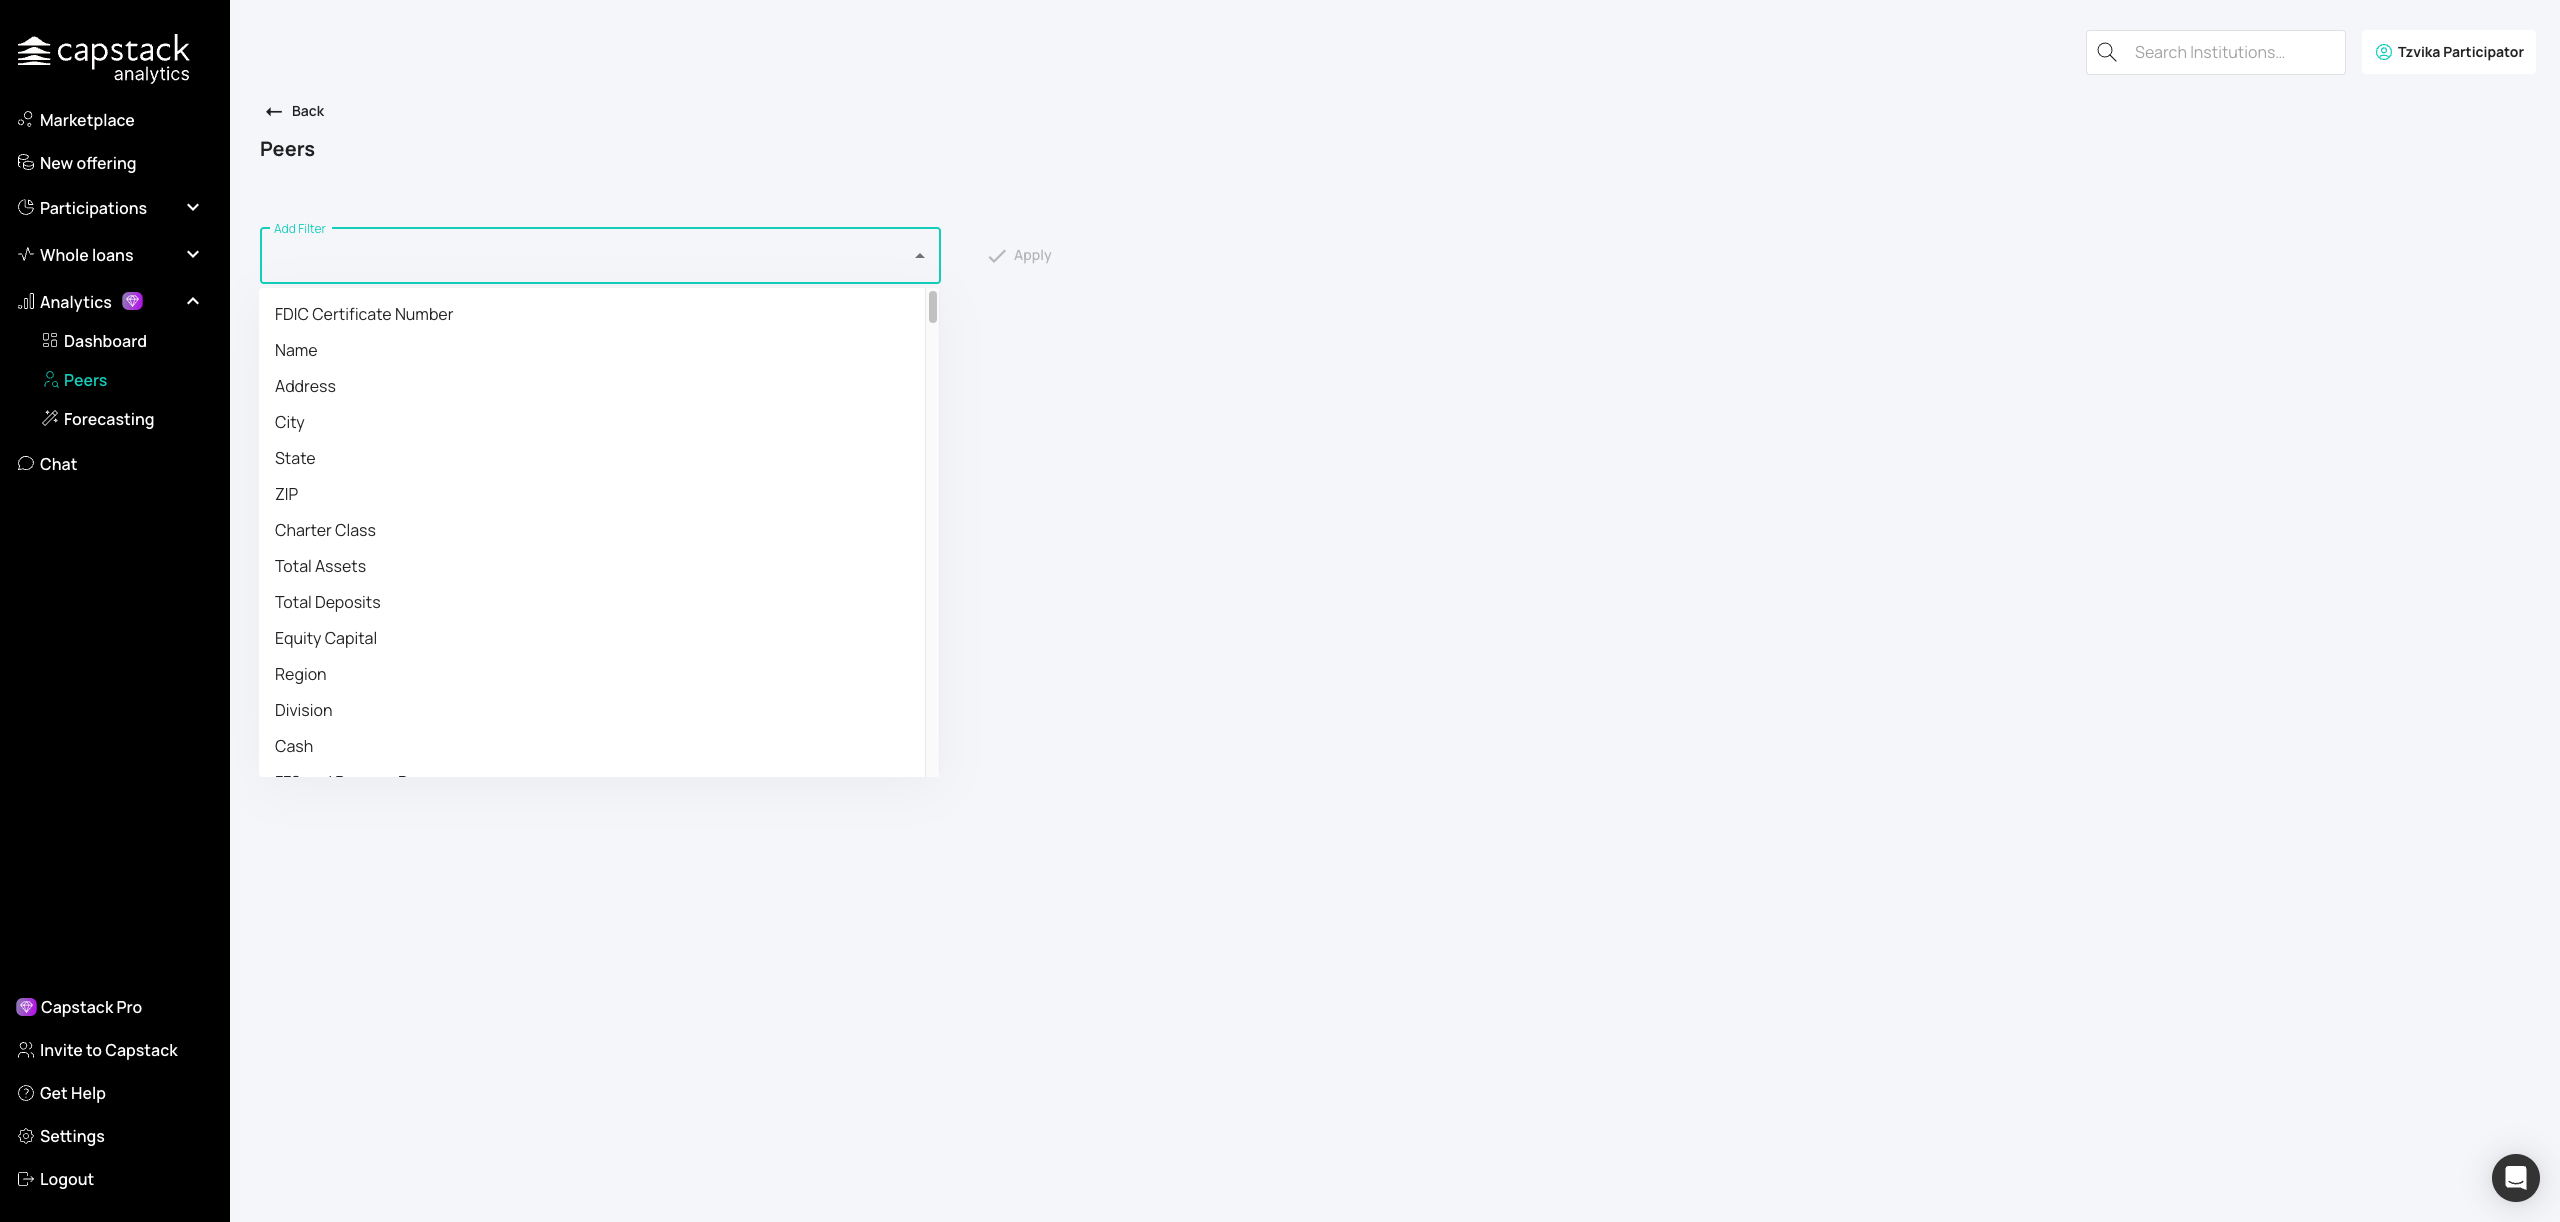
Use the filter options to narrow your peer group by criteria like geography, asset size, or charter type.
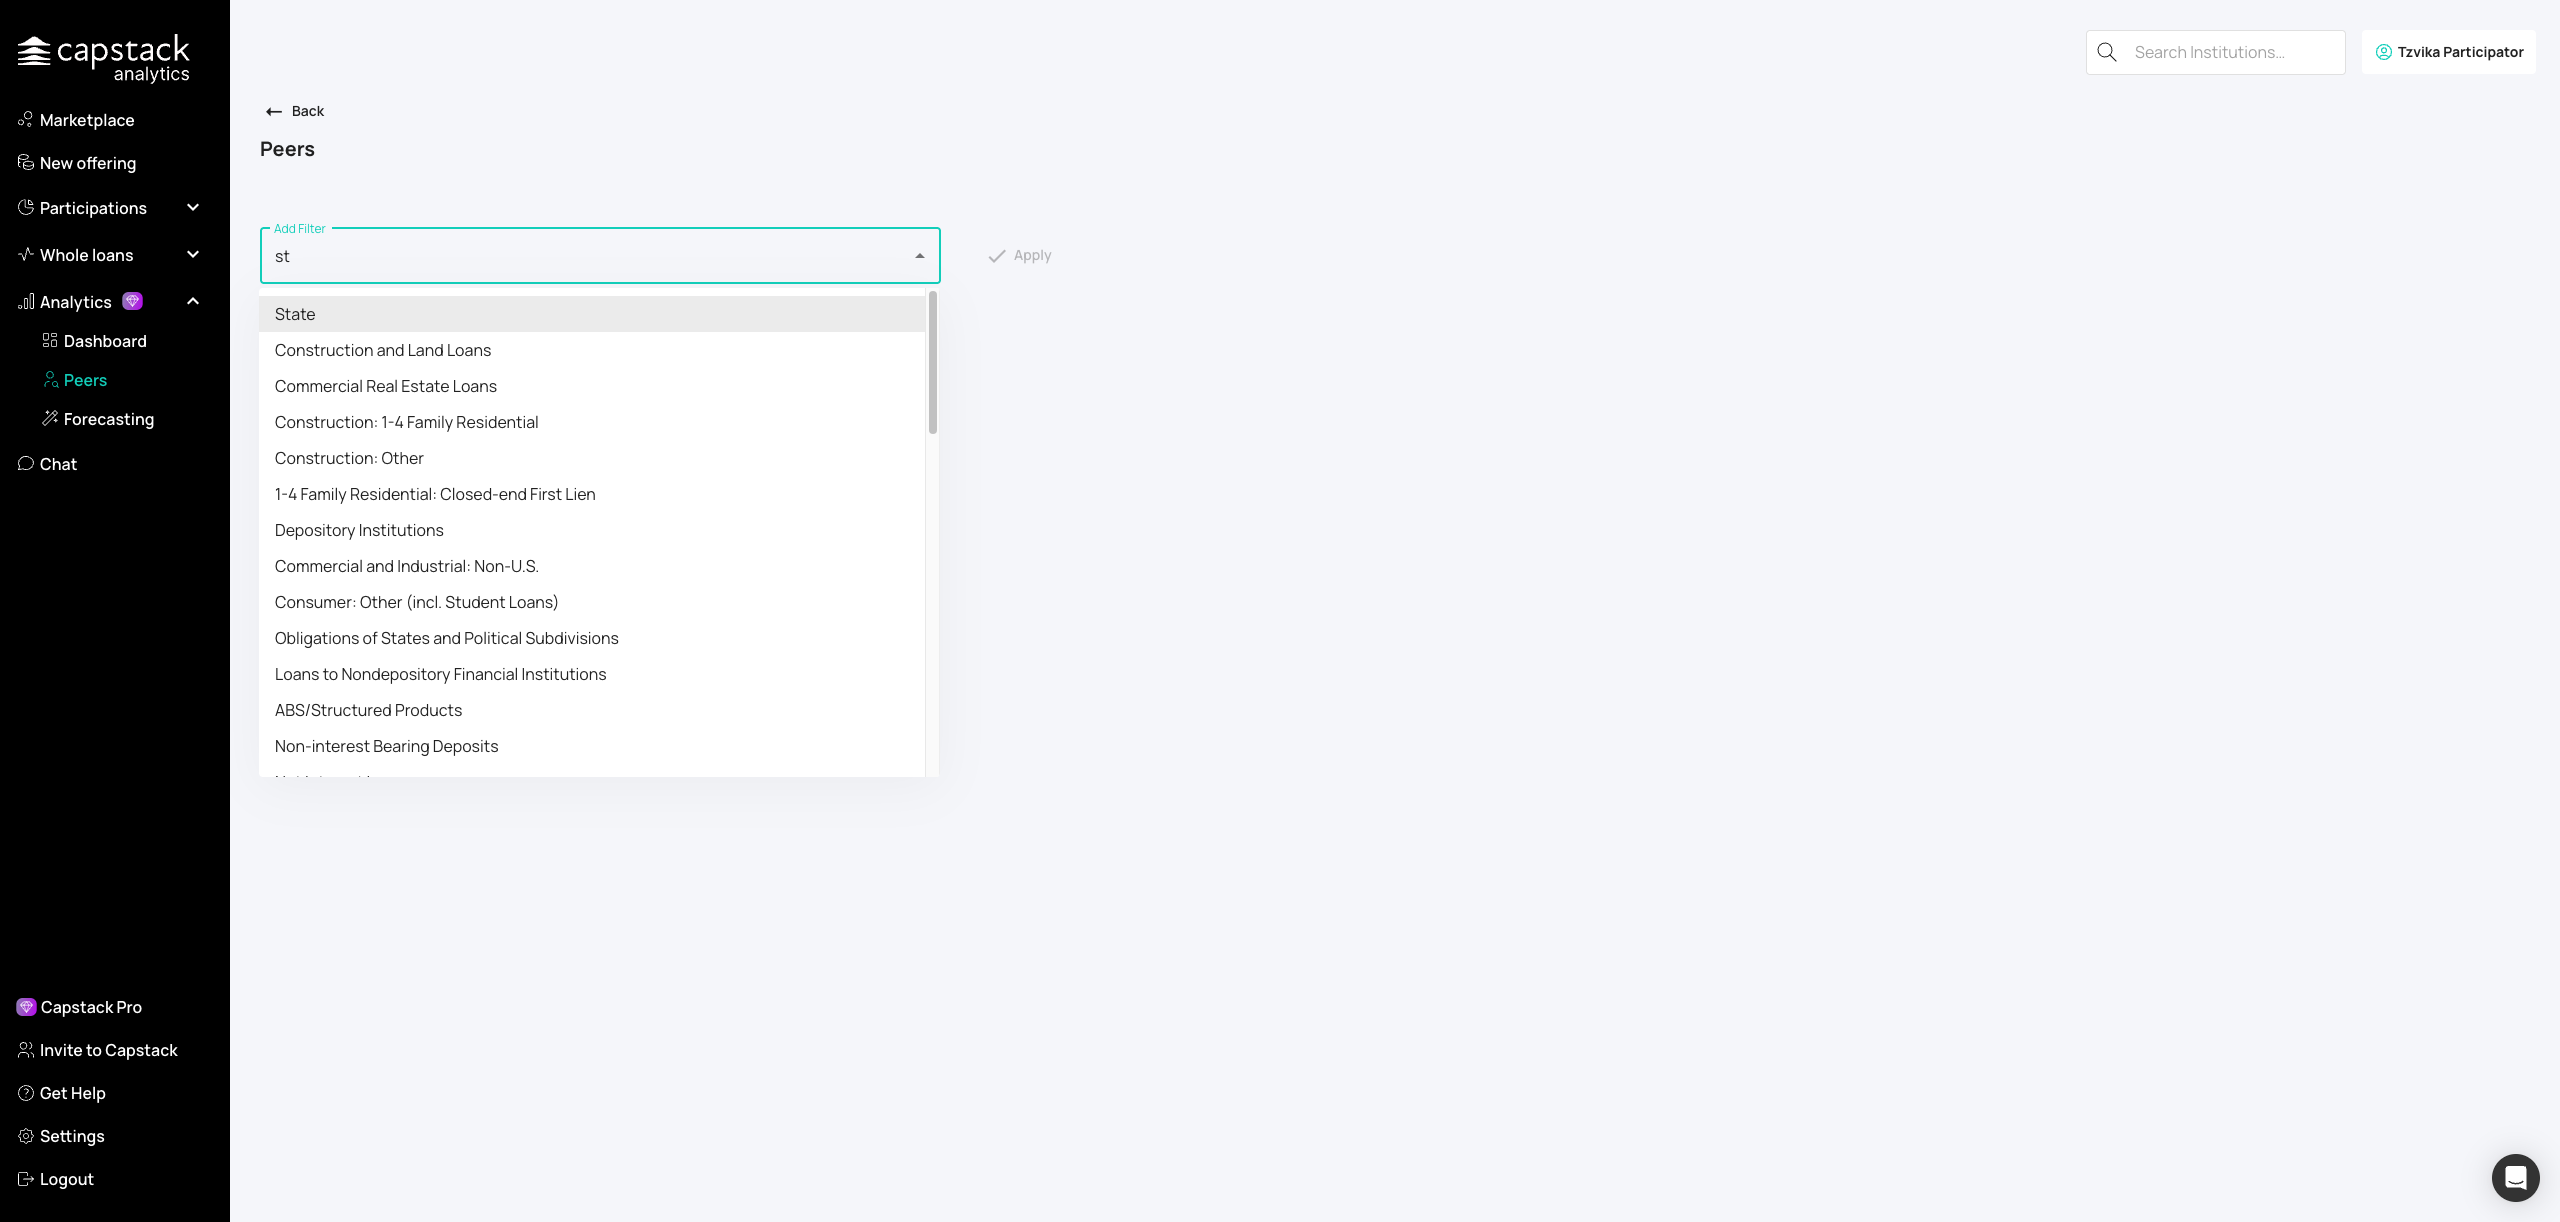
Click on the state dropdown to select geographic filters for your peer group.
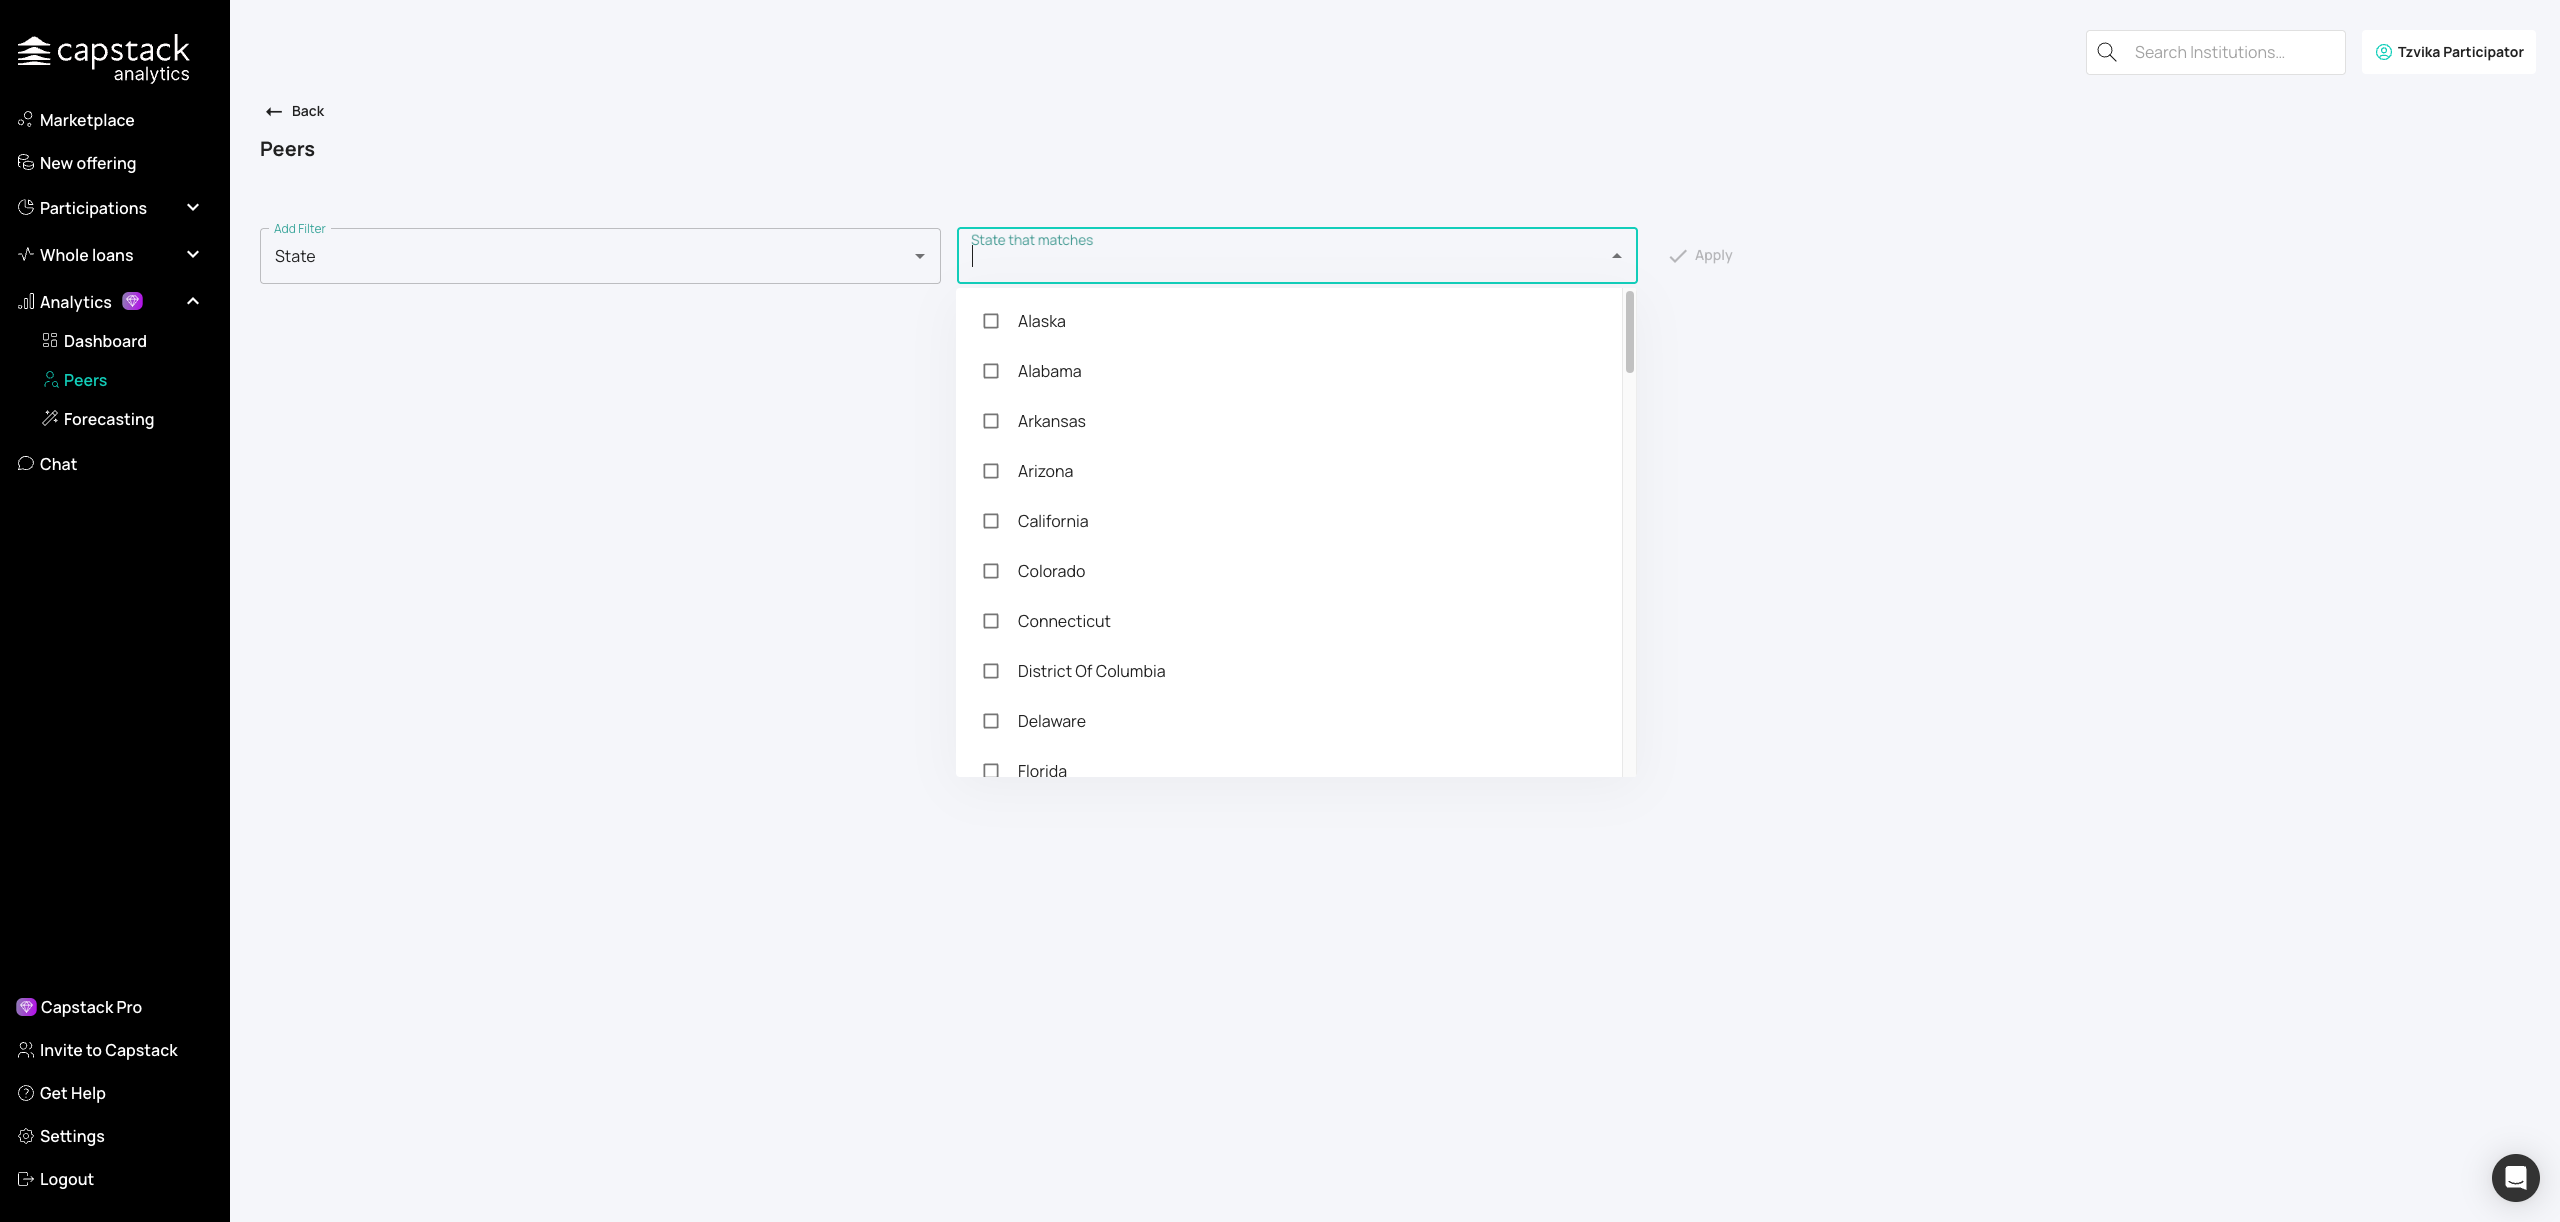
Choose a state for regional benchmarking — Texas is used as an example here.
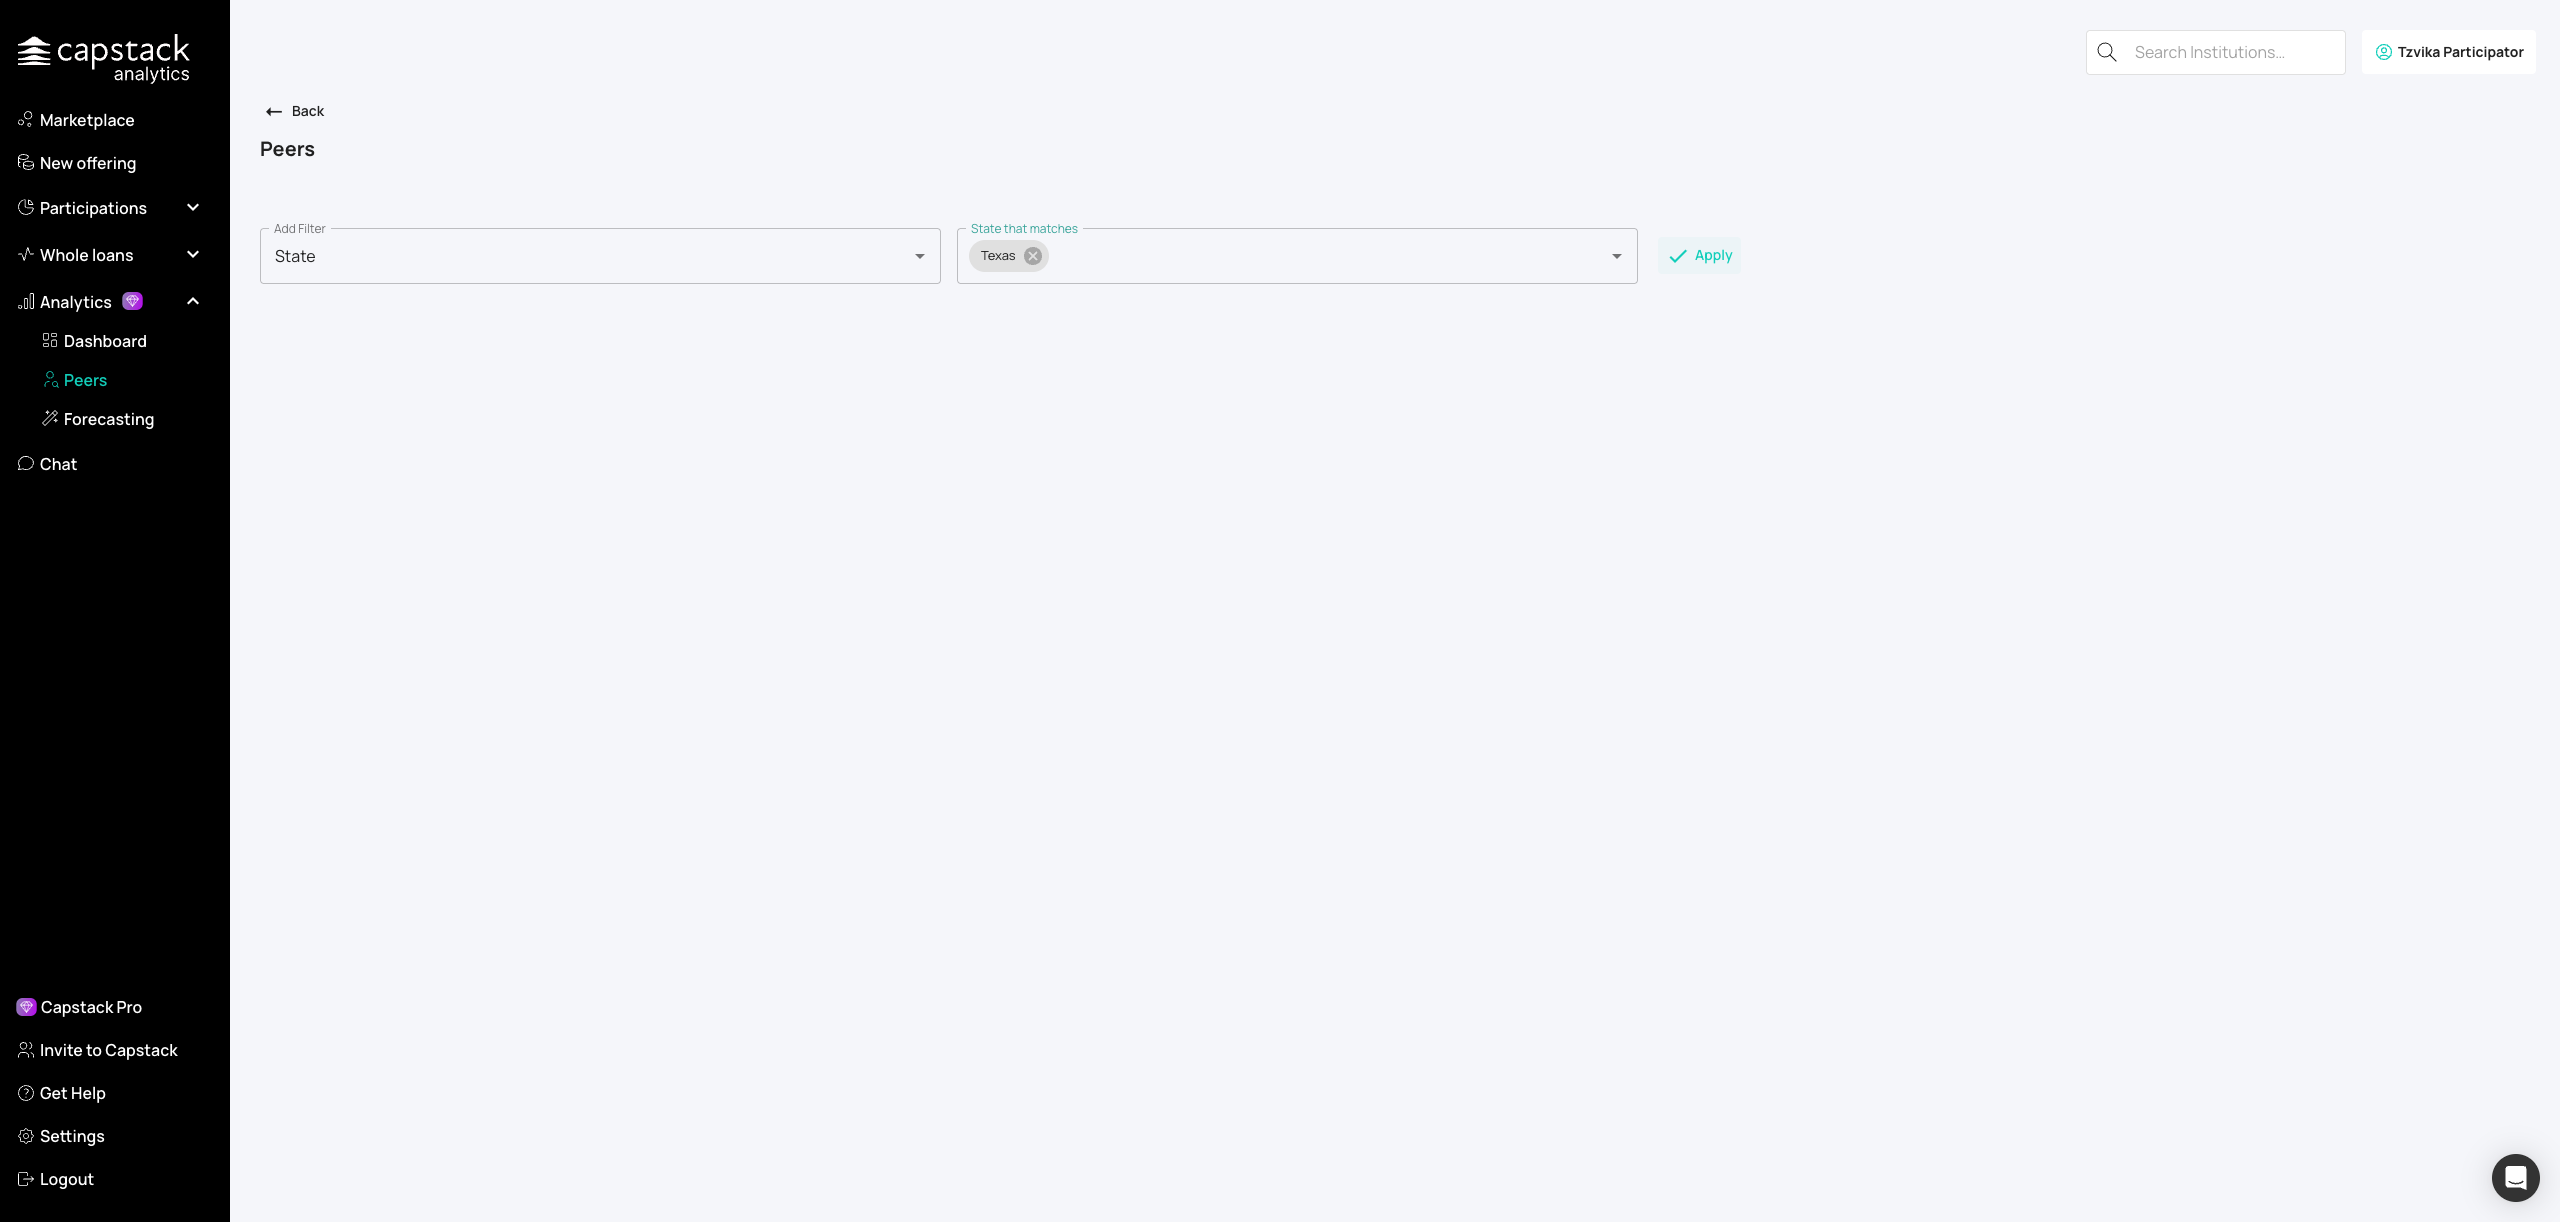
Apply your selected filters to generate the peer group.
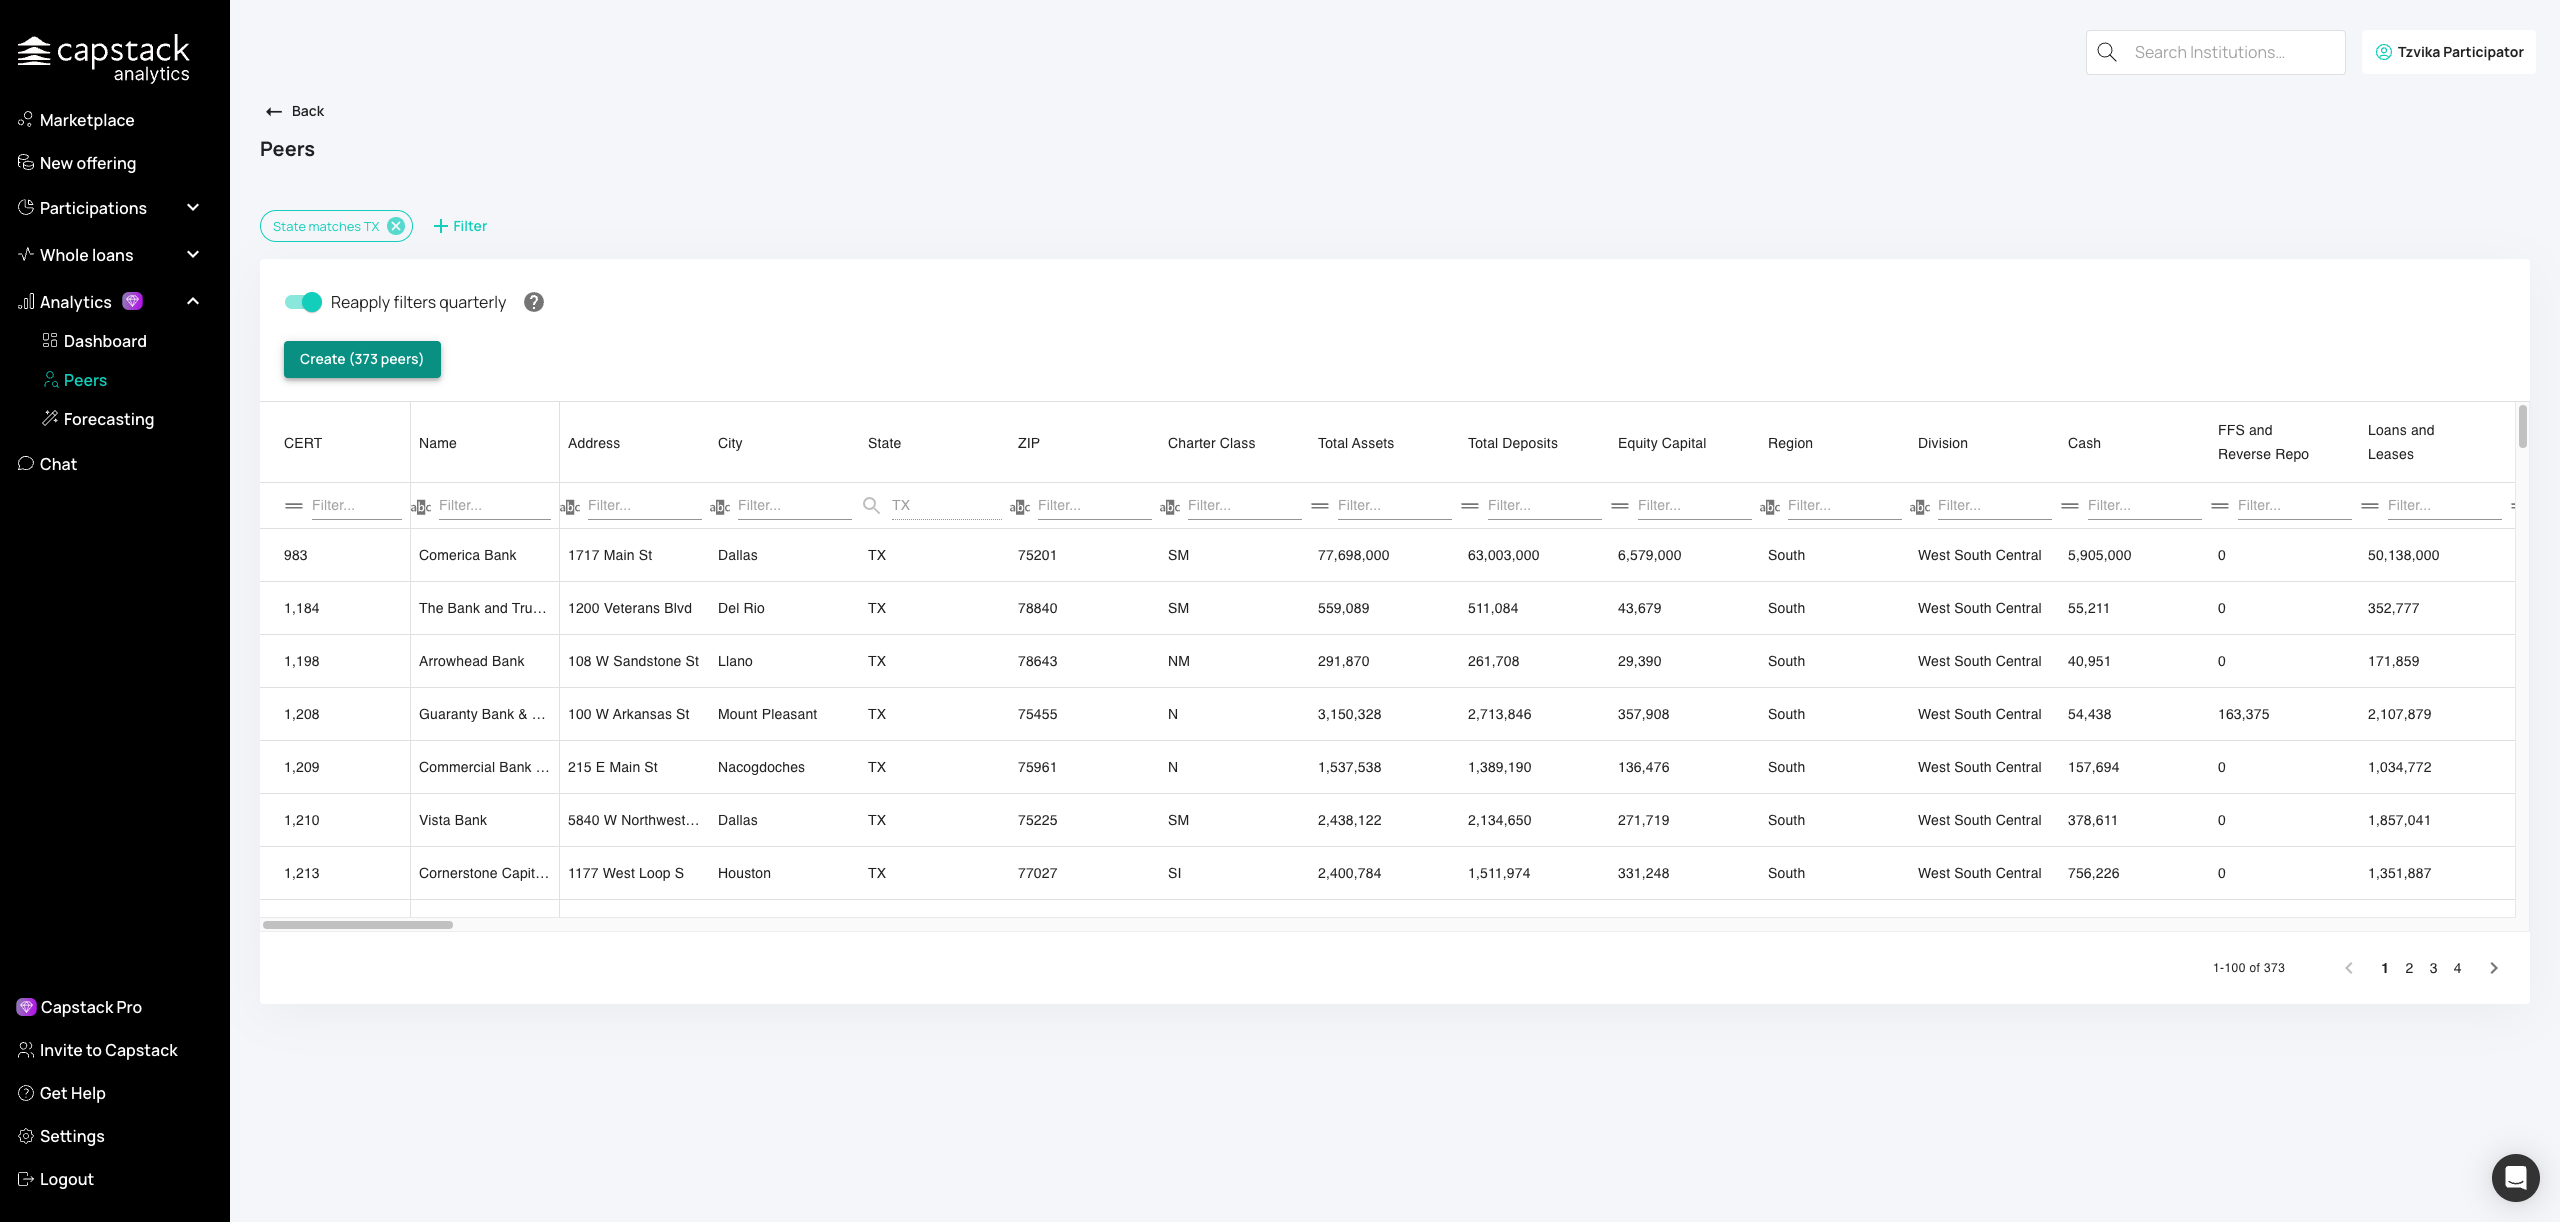
Finalize and save your peer group for ongoing analysis.
Section 4: CAMELS Report Analysis
Access CAMELS report data to see details comparing you to your peer groups for each quarter. You can switch between quarters and view information on capital, assets, management, earnings, and liquidity.

Access the CAMELS report section to see regulatory-style analysis.

Use the dropdown to switch between different reporting quarters.
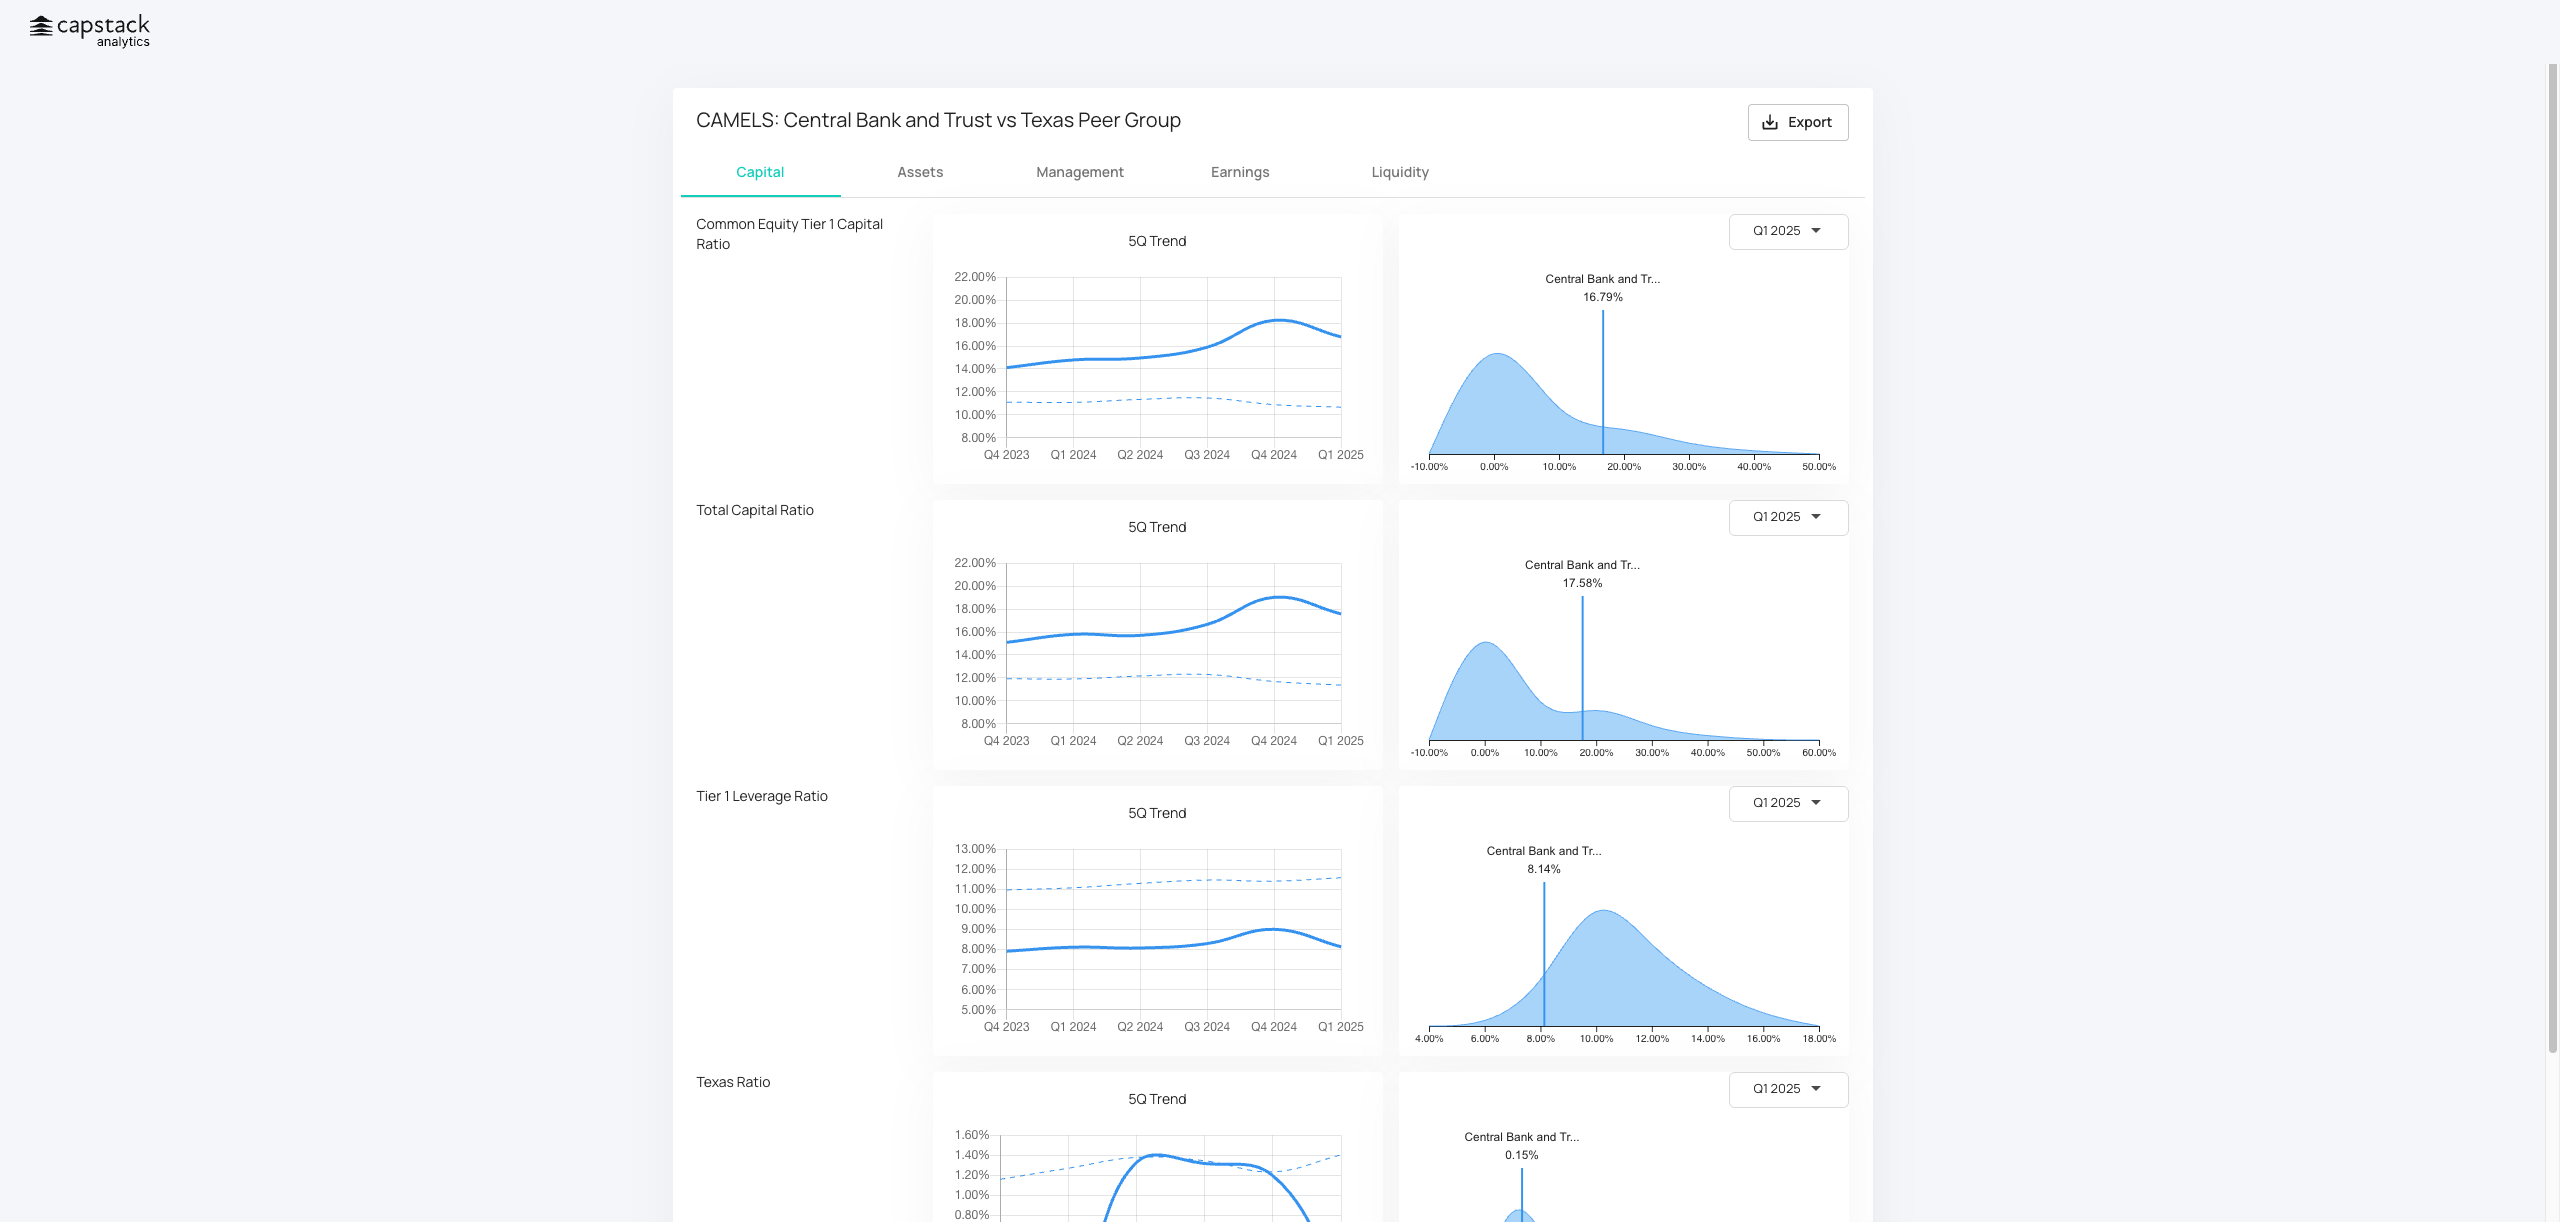
Navigate between Capital, Assets, Management, Earnings, and Liquidity sections for detailed regulatory views.
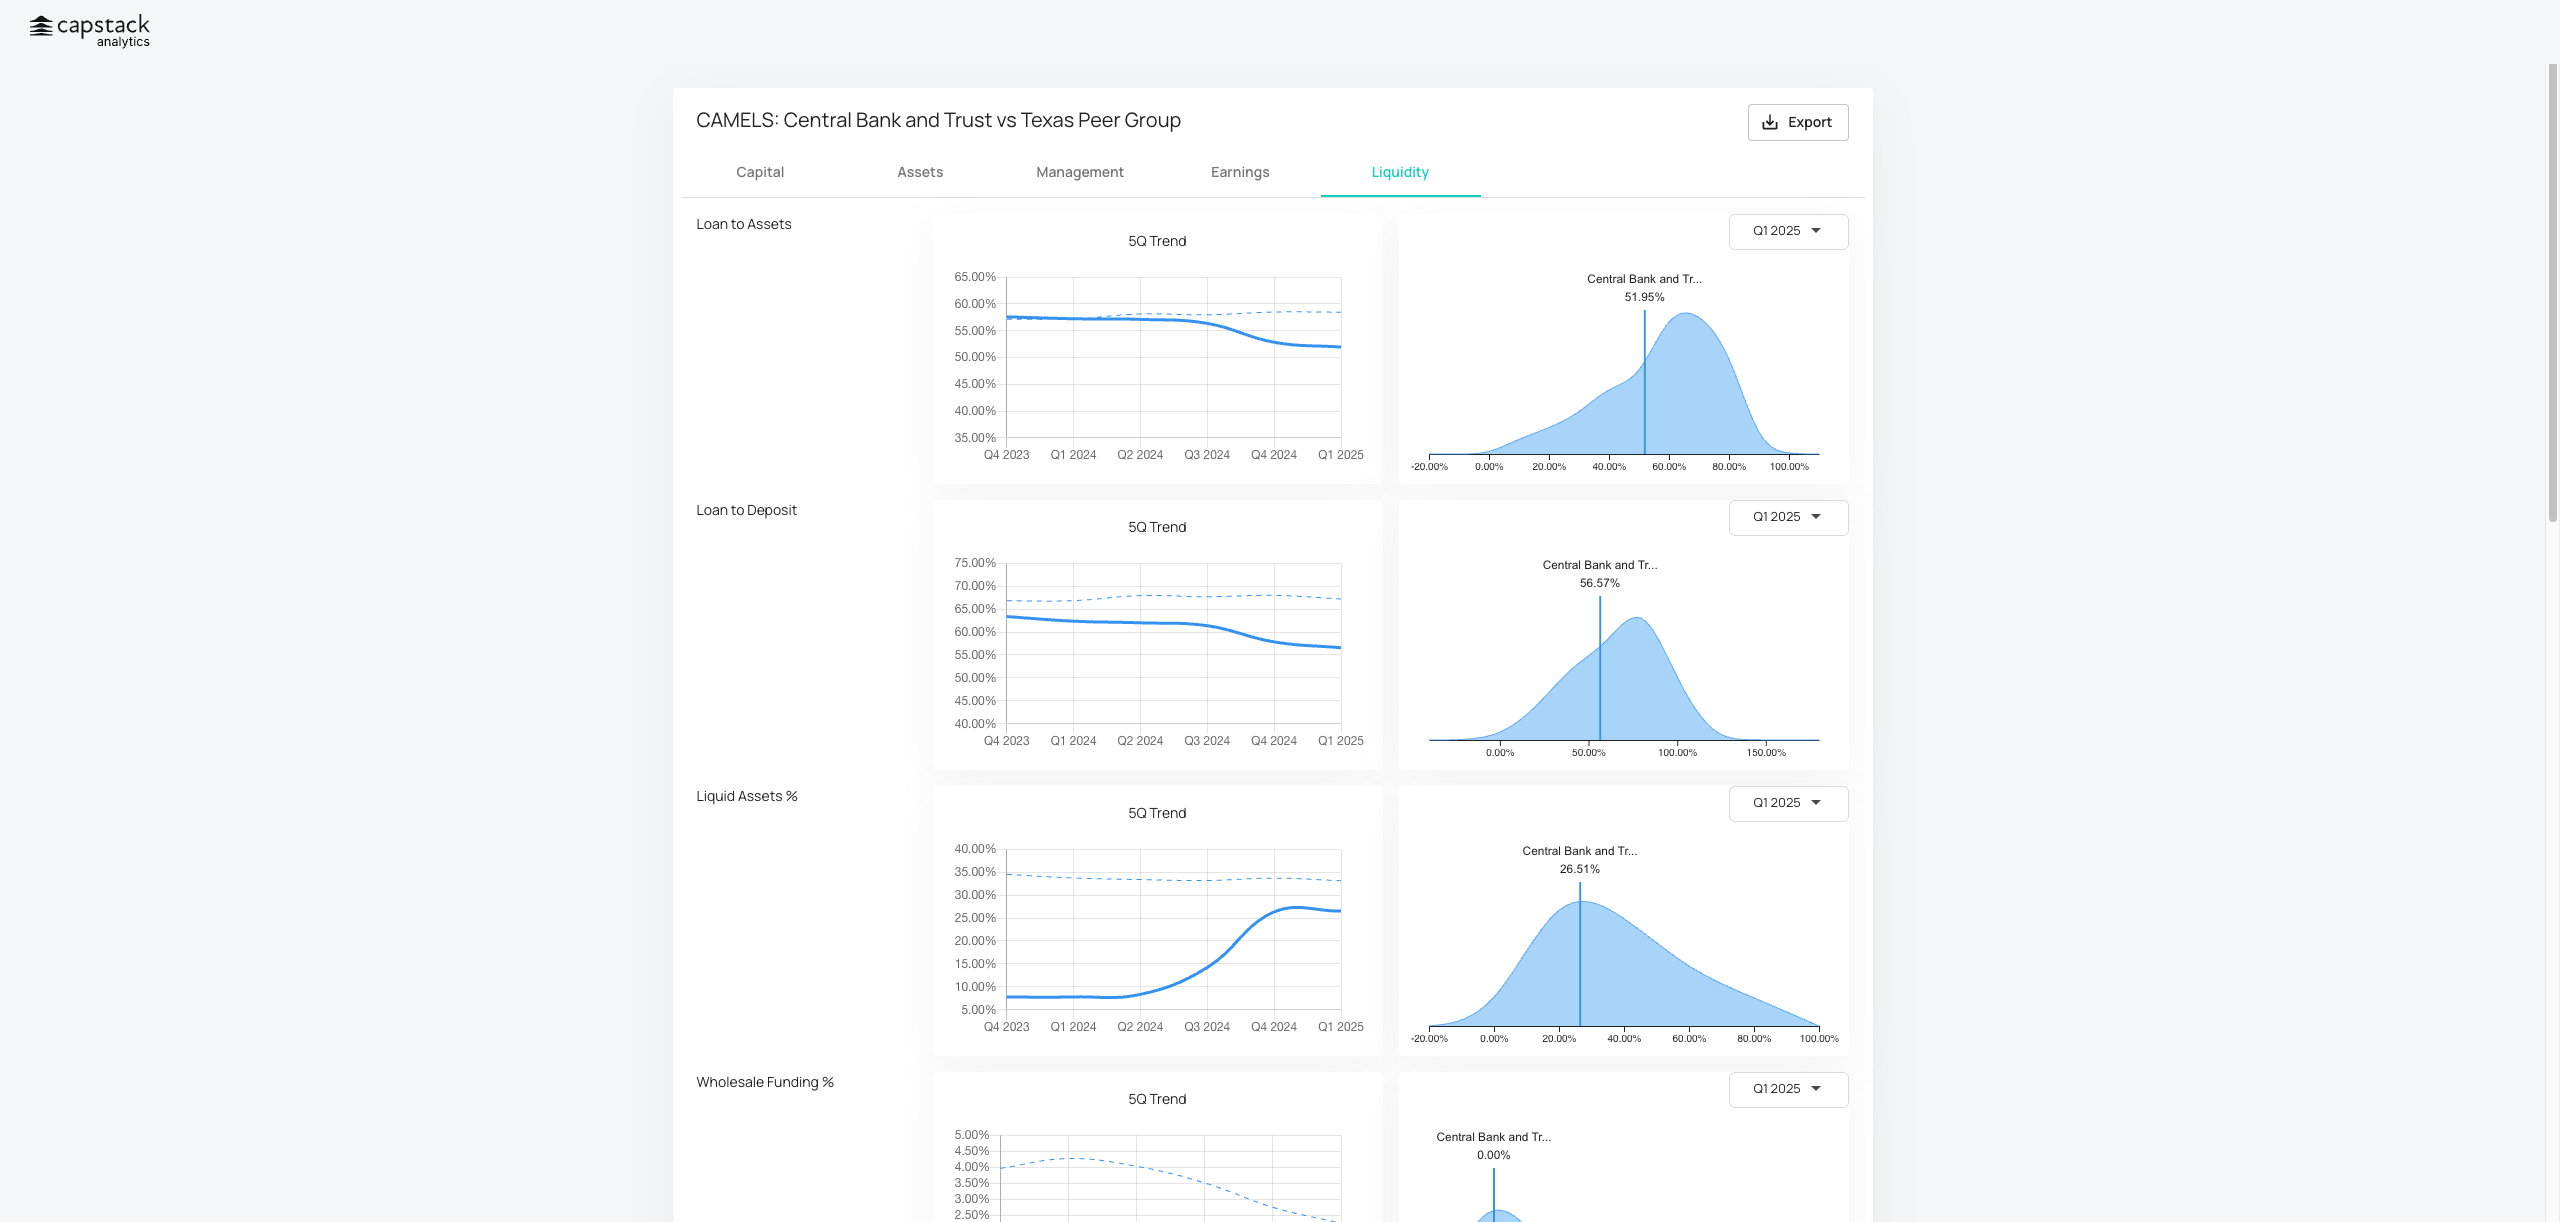
Download the CAMELS report for board or regulatory presentations.
Section 5: Forecasting
Navigate to the Forecasting section for predictive analytics. There is a future forecasting tool that enables you to forecast data for the next two quarters and compare it to your peer group.
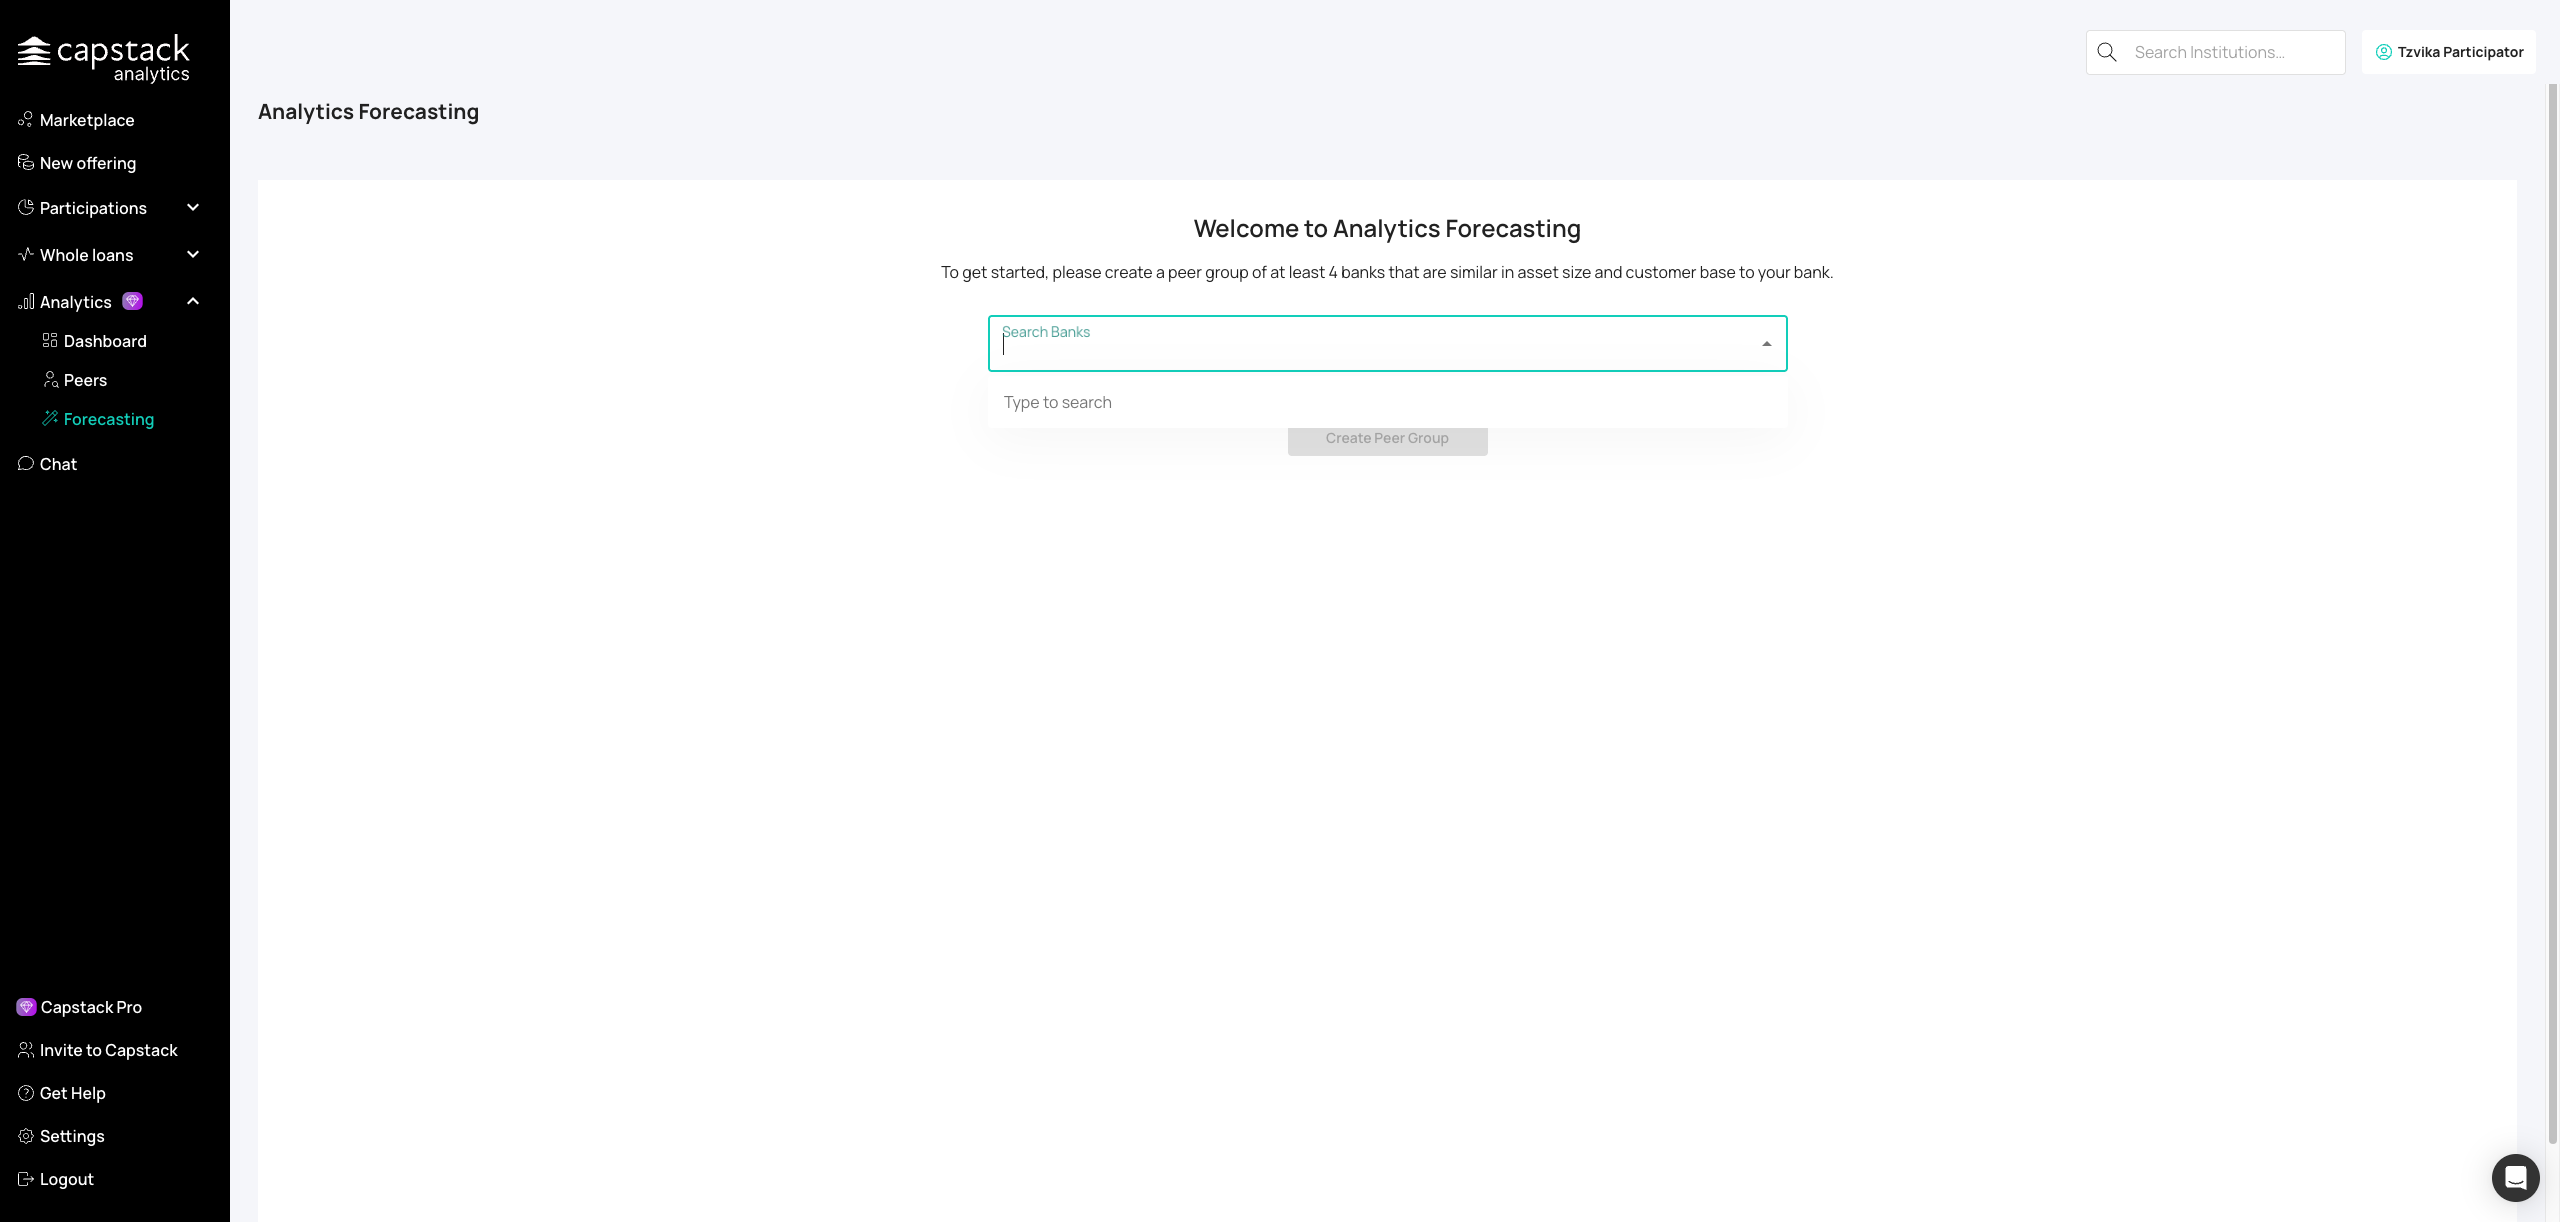
Choose four or more comparable banks as your forecasting baseline (minimum required for accurate predictions).
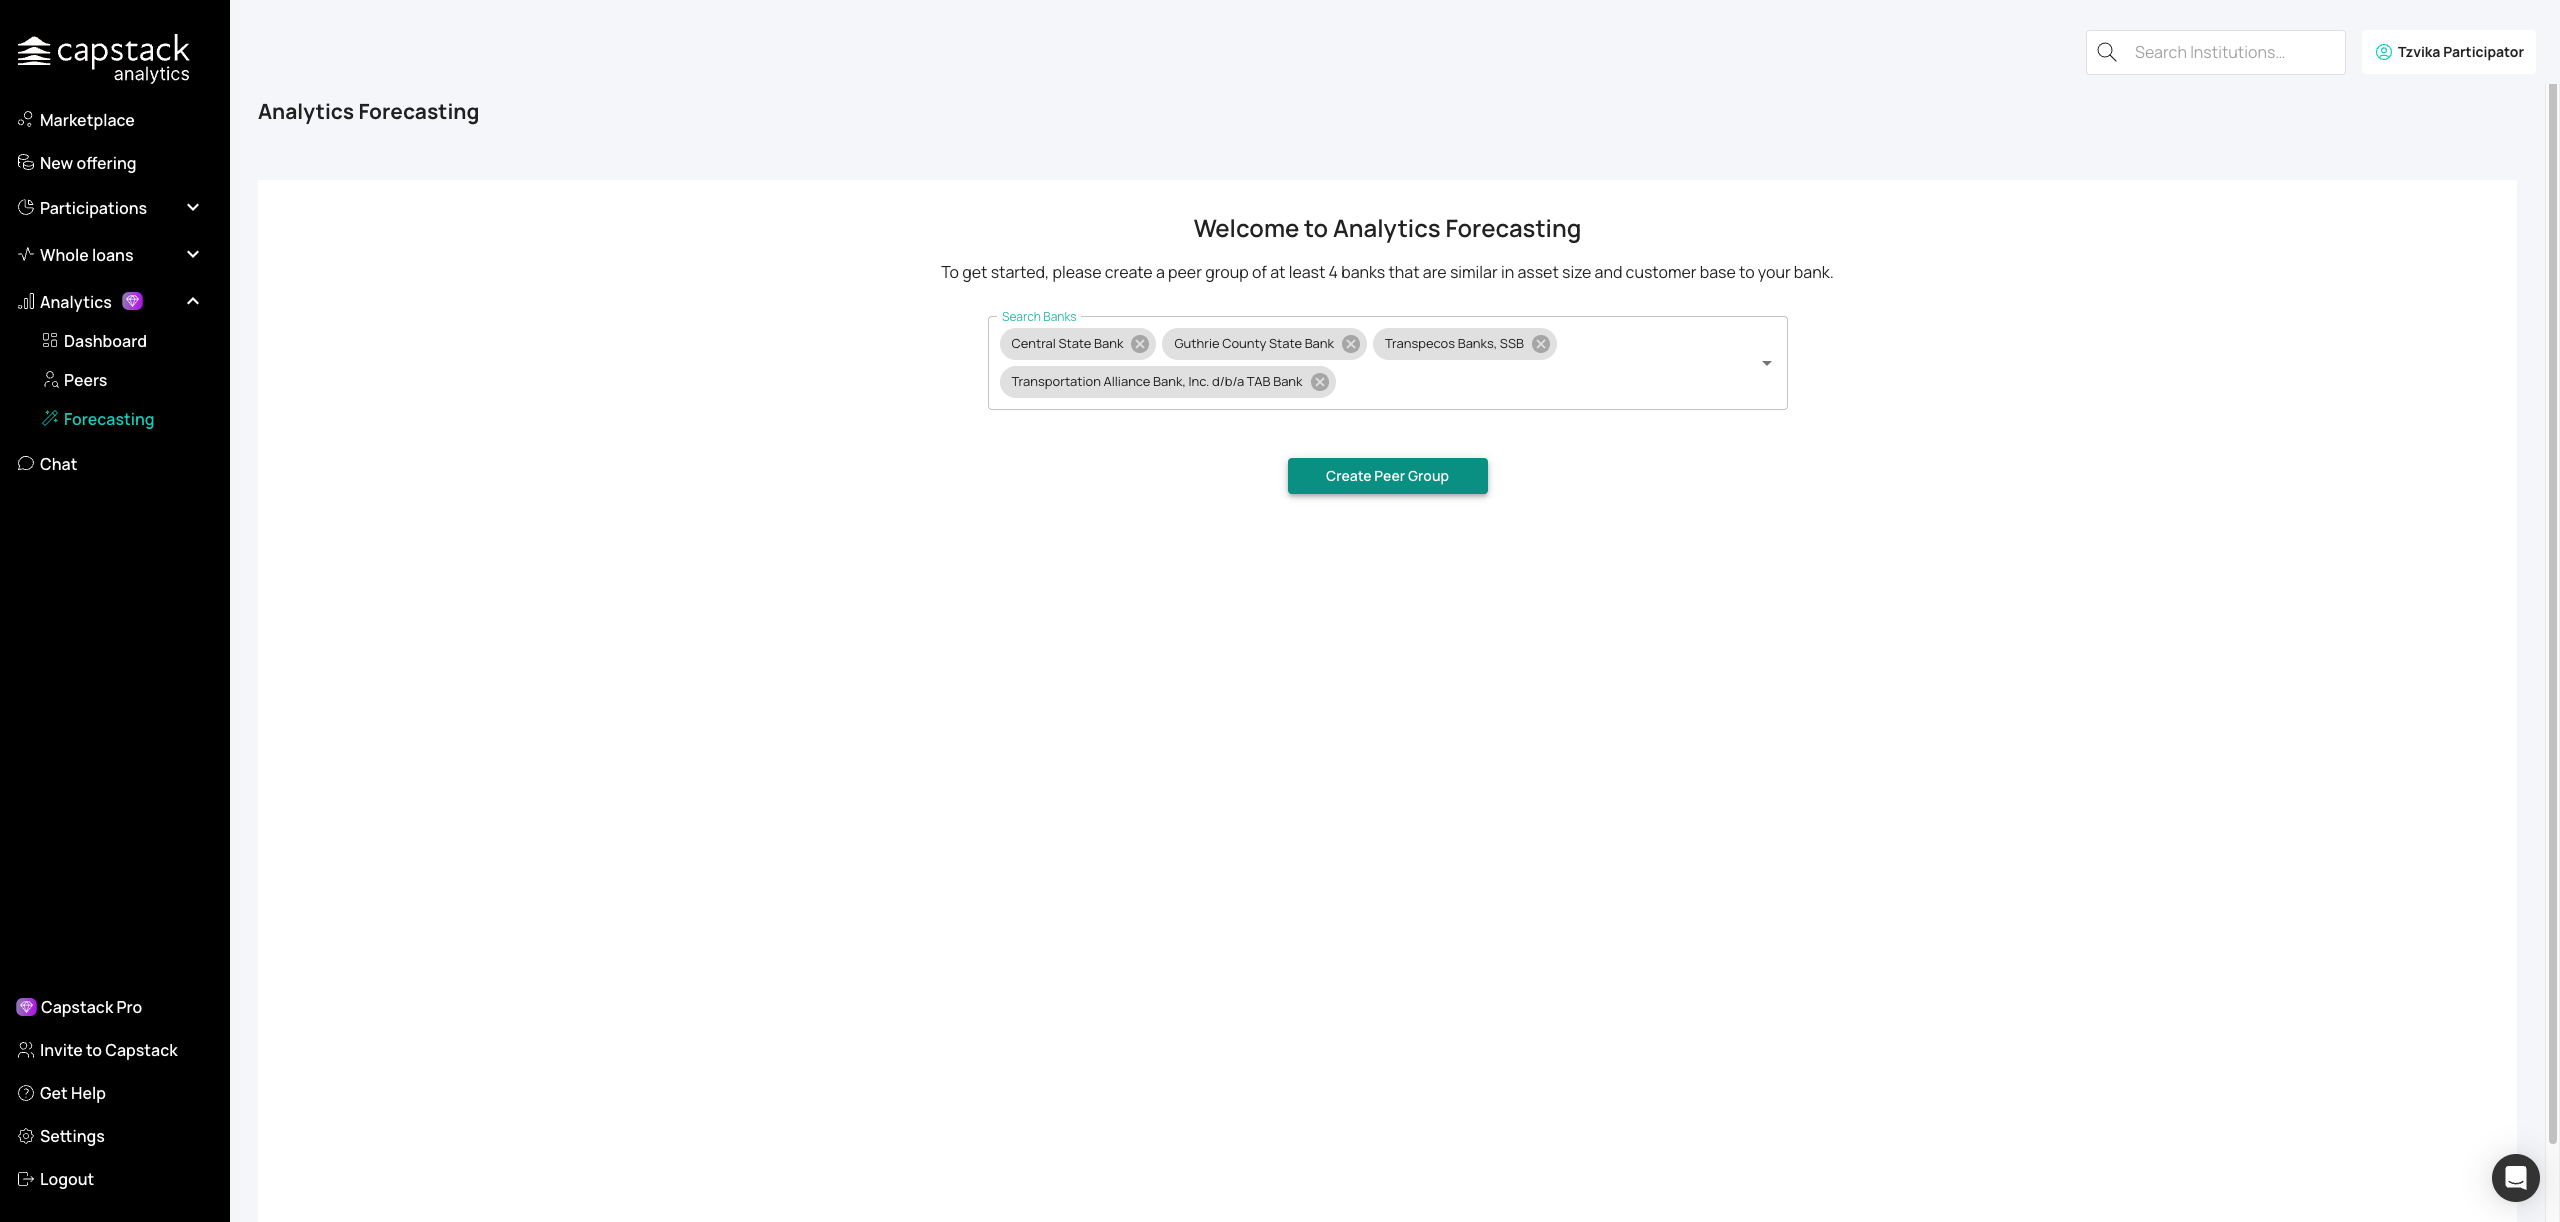
Finalize your forecasting peer group after selecting institutions.

View projections for loan yields, asset yields, and margins over the next two quarters. You can also view your performance compared to your peer group. In the dashboard, you can see the forecasting for each of these features. Forecasting allows you to predict up to two quarters ahead.
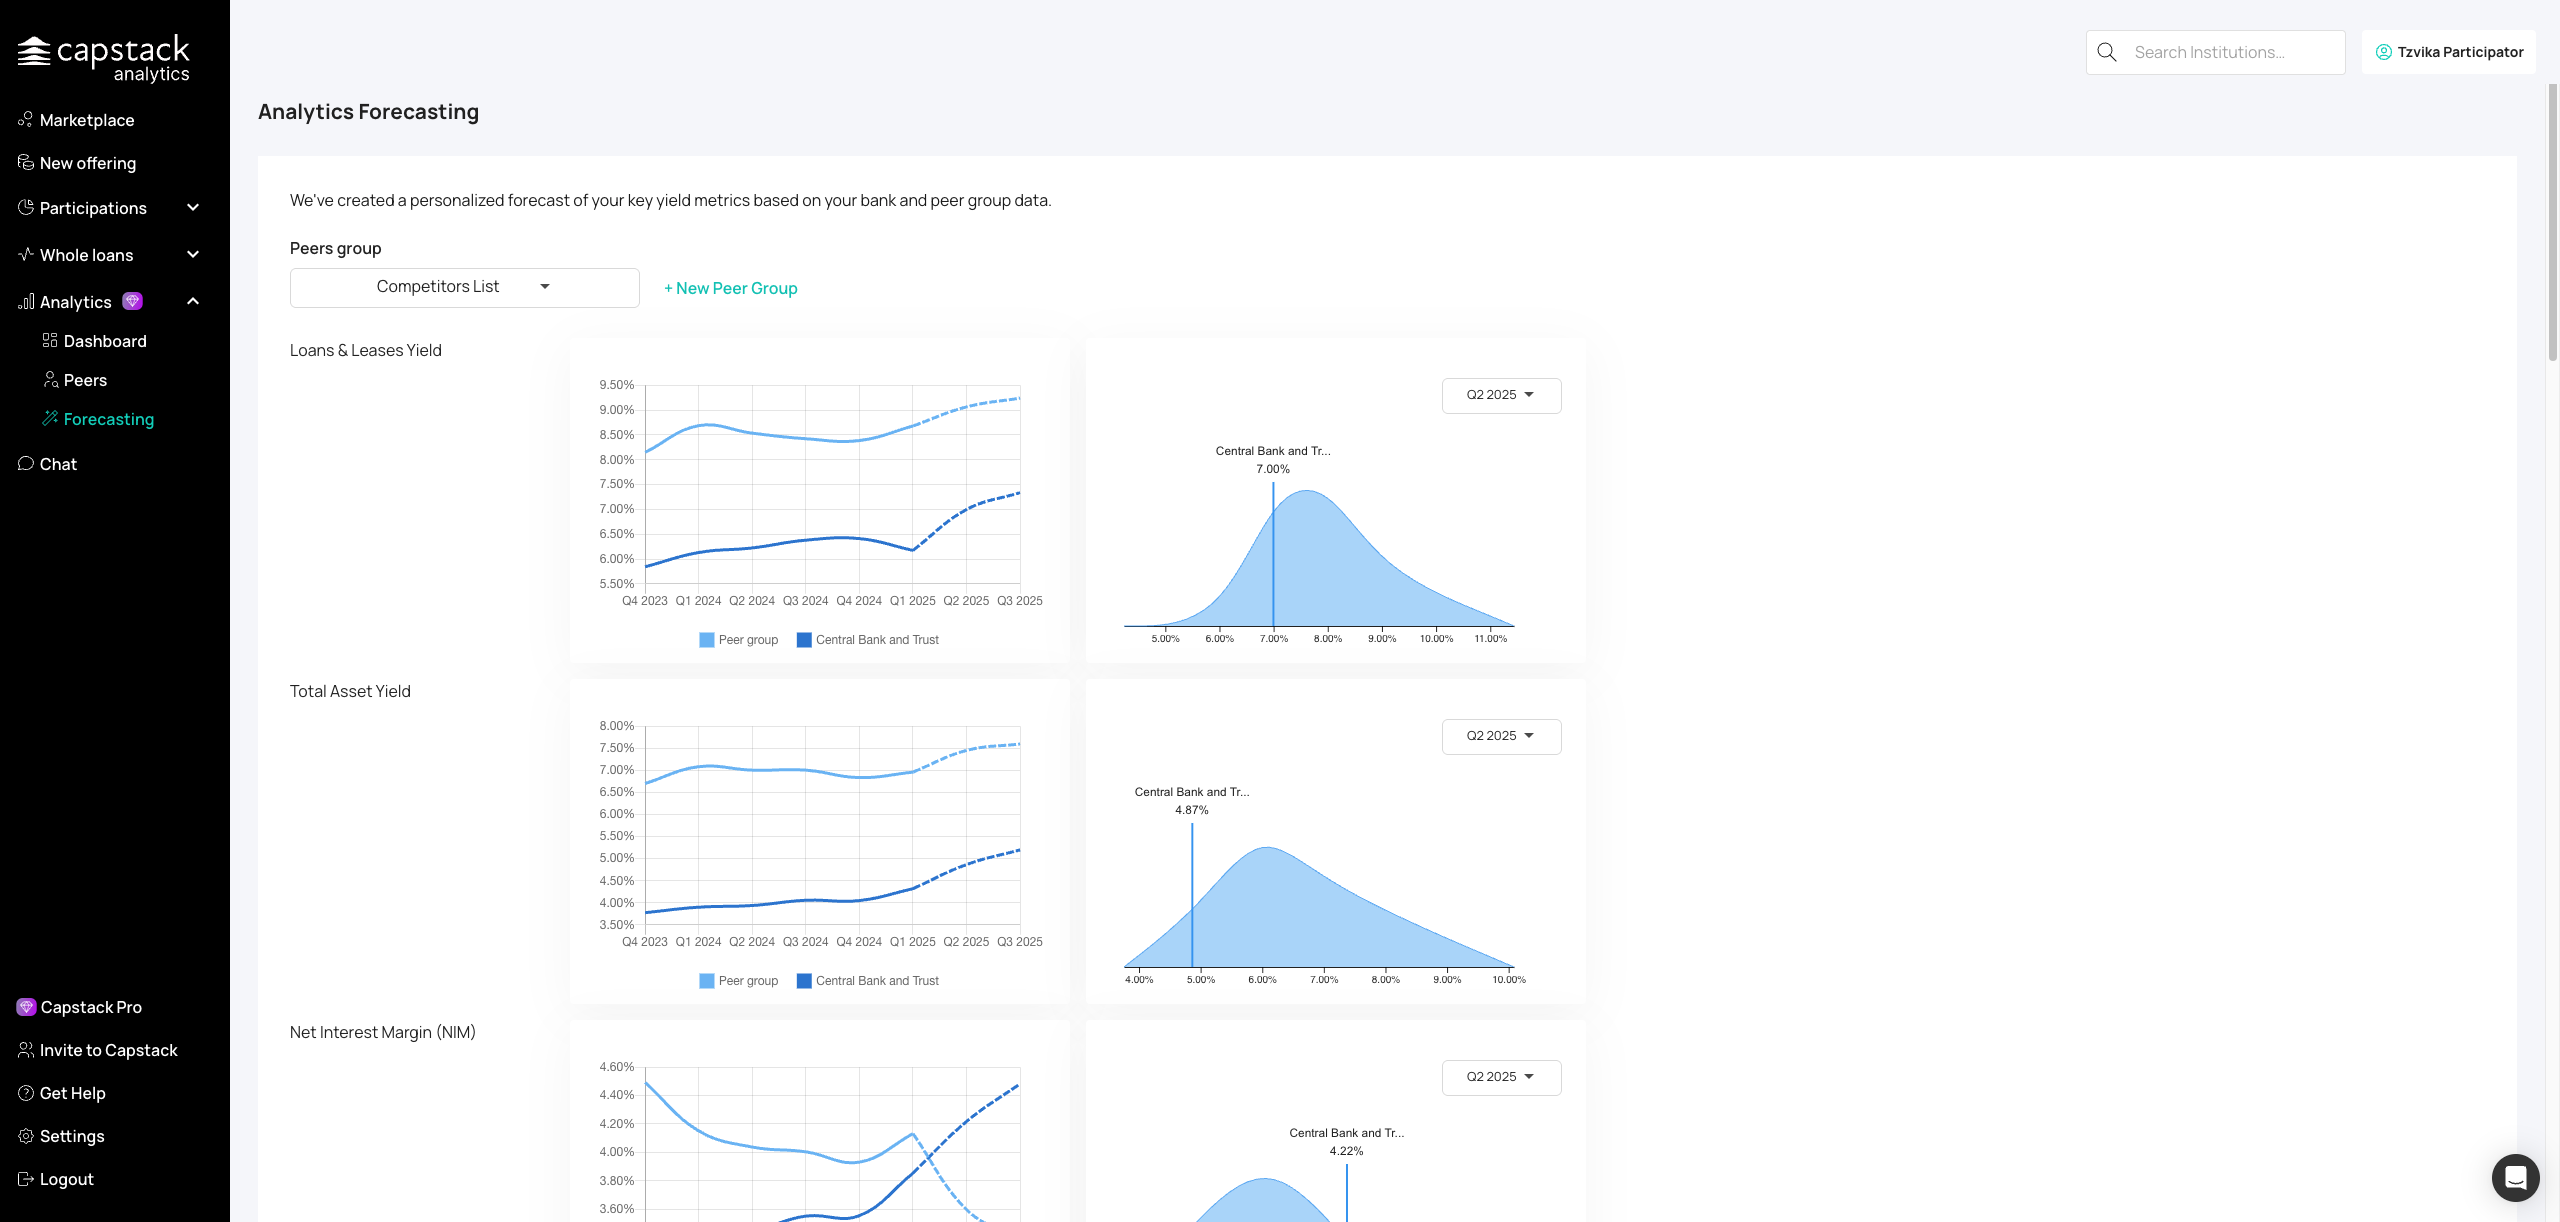
Choose specific quarters to see predicted variations and peer comparisons. To view the variation, select a specific quarter. You will then see your data compared to your peer groups' data.
After you finish
Save peer groups for recurring analysis
Export reports for board or regulatory presentations
Use forecasting for quarterly planning and stress testing
Troubleshooting
Peer comparisons don't look right: Ensure you've selected truly comparable institutions (similar asset size, region, and business model) for meaningful benchmarks
Best practices
Build multiple peer groups (regional, asset size, specialty focus)
Review Analytics monthly to spot trends early
Use CAMELS and Forecasting exports in board prep