How to Use the Dashboard: Filters, Metrics, and Automation Explained
Learn how to navigate and utilize the dashboard, including user and client filters, transaction metrics, automation rules, categorization accuracy, and productivity insights. Understand key features like batch success rate, queue length, and system learning for optimal performance.
In this guide, we'll learn how to use a dashboard to monitor and analyze user activity, transactions, and system performance. We'll look at how to filter data by user or client, understand key metrics like transaction volume, processing times, and categorization accuracy, and see how to interpret trends in automation and system learning.
This guide will help you make sense of the dashboard's different sections and use filters to get the information you need.
Let's get started
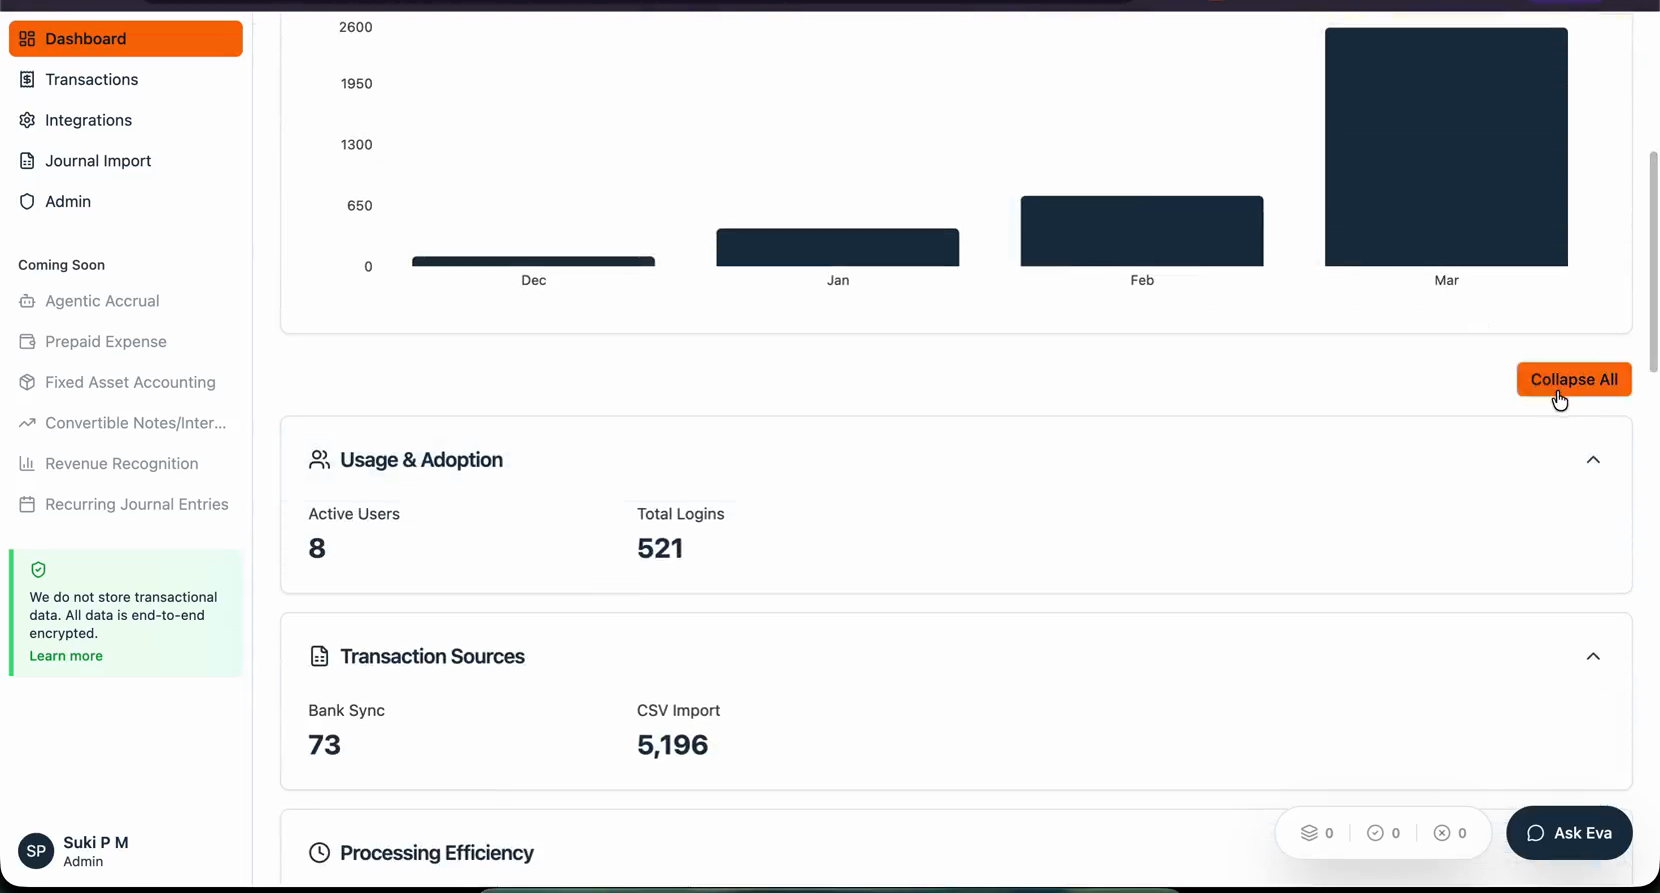
The dashboard provides a centralized view of platform activity, including user engagement, transaction data, and system usage metrics. It helps administrators and team members monitor system performance, track financial data processing, and understand user adoption trends.
By using the available filters and metrics, users can quickly analyze activity across different users, clients, and time periods.
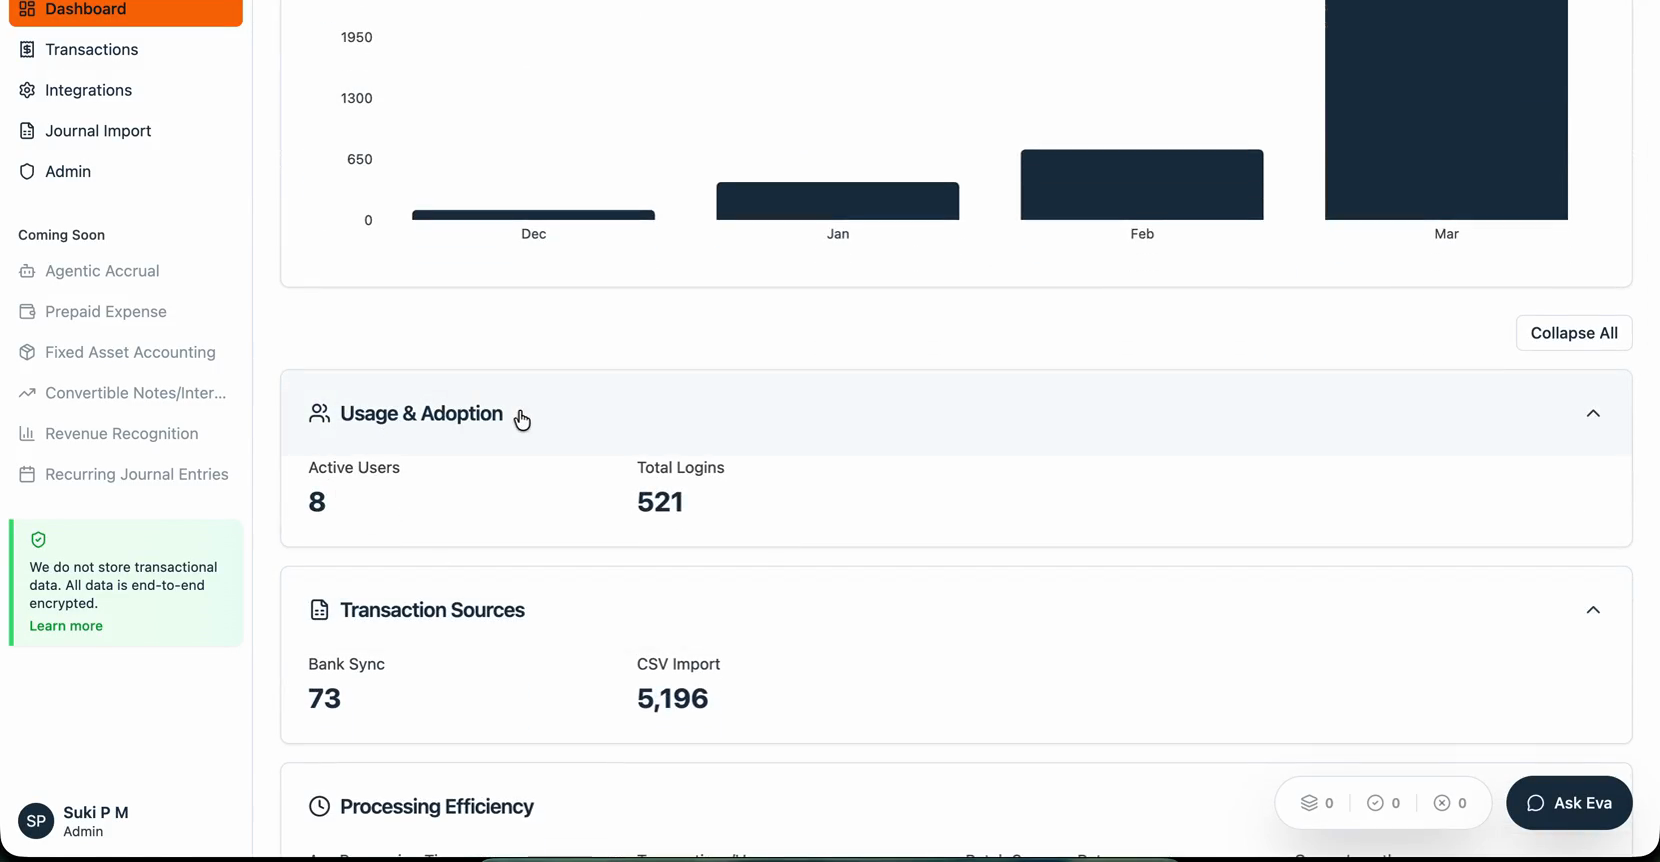
Then you see transaction sources.
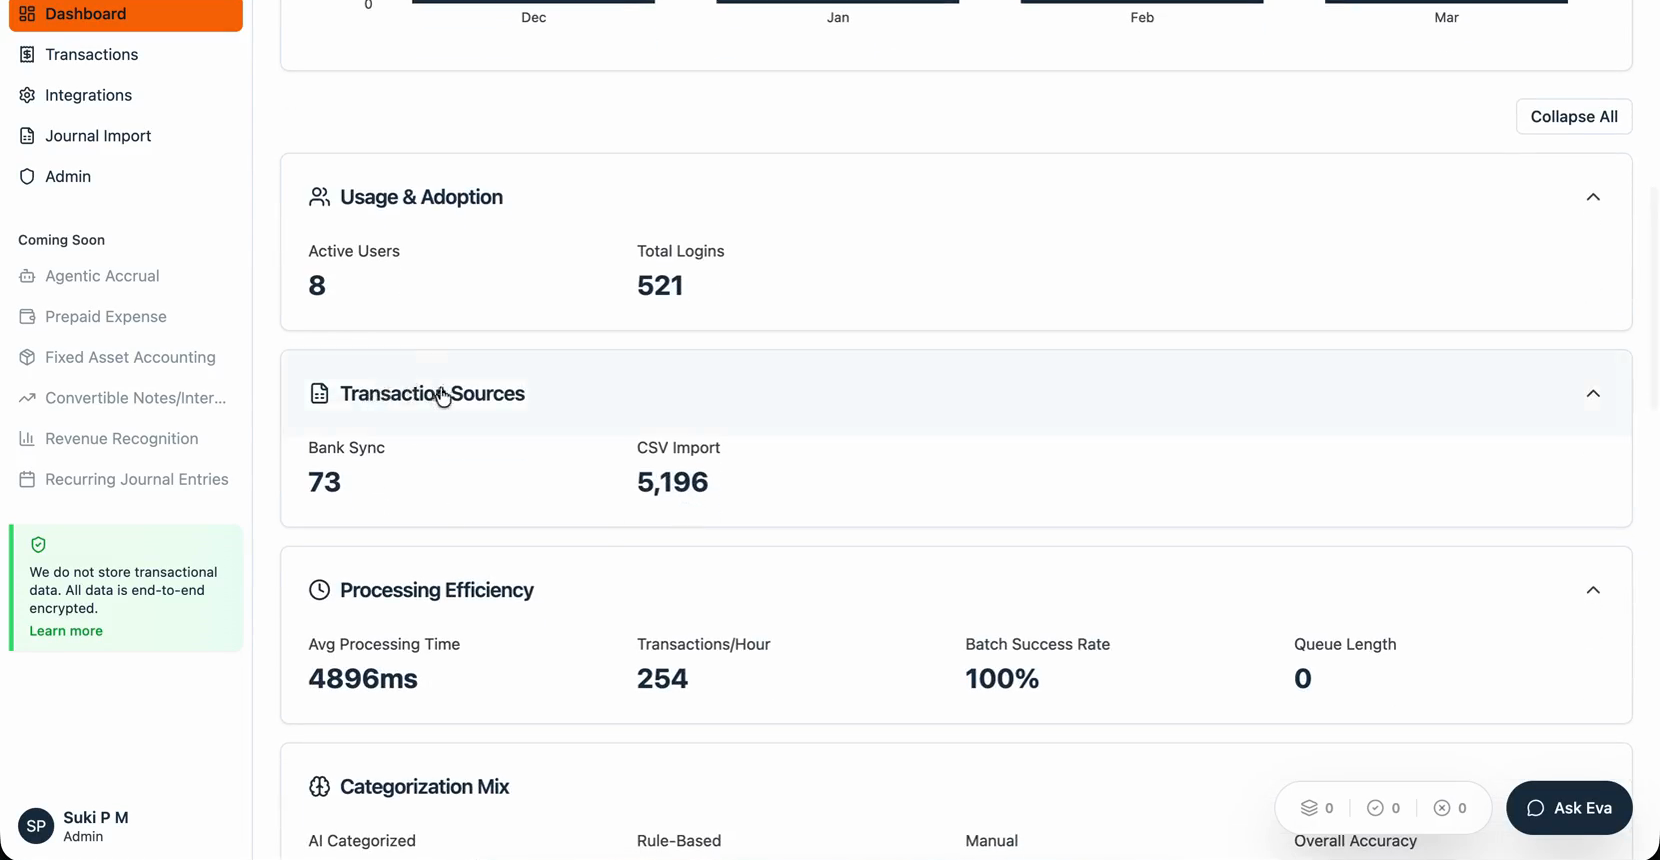
Processing Efficiency section to analyze key system performance metrics, including:
Average Processing Time – The average time taken to process transactions.
Transactions per Hour – The number of transactions processed by the system within one hour.
Batch Success Rate – The percentage of transaction batches successfully processed.
Queue Length – The number of transactions currently waiting to be processed.
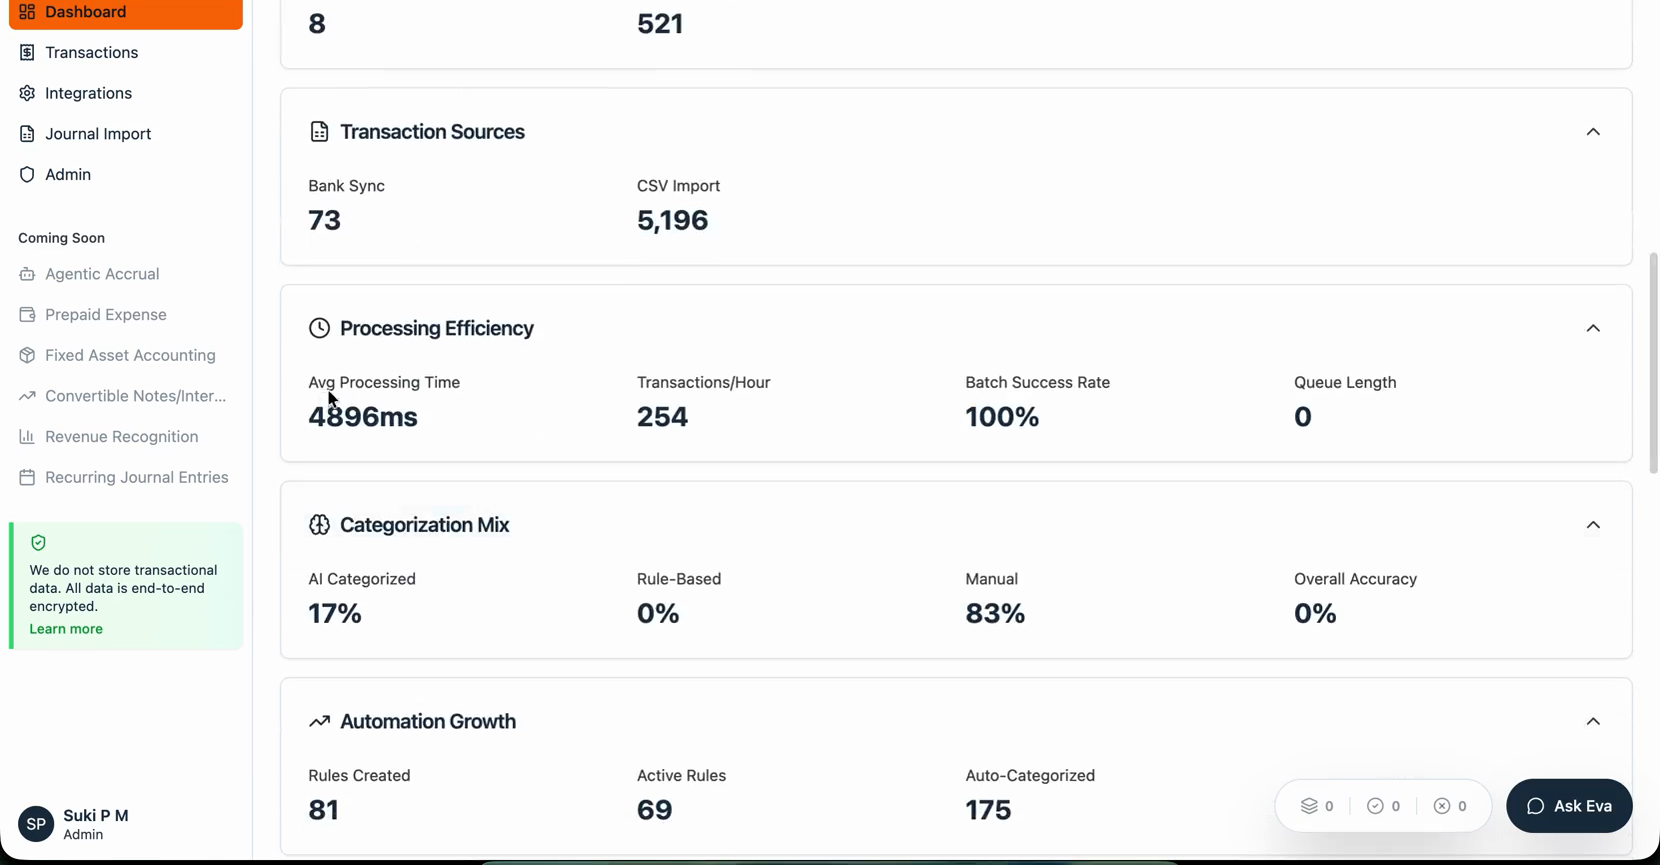
The Categorization Mix section shows how transactions are categorized within the system.
This section displays the percentage of transactions categorized using the following methods:
AI Categorization – Transactions categorized automatically using the AI model.
Rule-Based Categorization – Transactions categorized using predefined rules created in the system.
Manual Categorization – Transactions categorized manually by users.
Overall Accuracy - This section also displays the , which reflects how accurately transactions are categorized across the system.
Automation Growth
The Automation Growth section provides insights into how automation within the system is improving over time.
This section displays the following metrics:
Total Rules Created – The total number of categorization rules created in the system.
Active Rules – The number of rules that are currently active and recently used during transaction categorization.
Auto-Categorized – The number of transactions automatically categorized by the system without manual intervention.
Active rules represent the rules that are most frequently applied during recent transaction processing. Monitoring this section helps track the overall growth and effectiveness of rule-based automation.
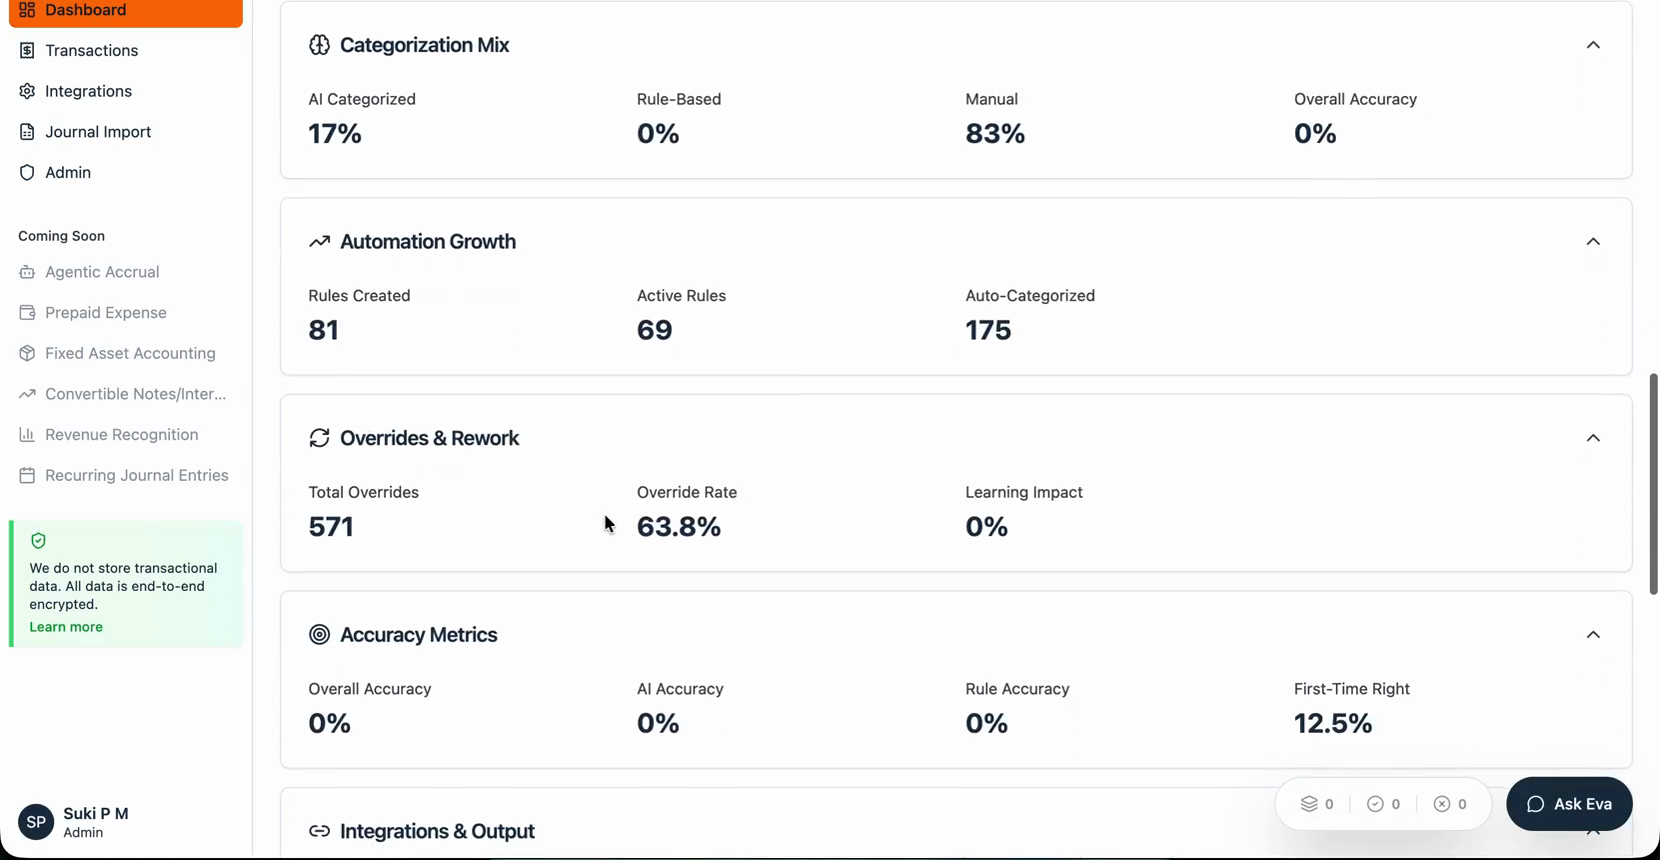
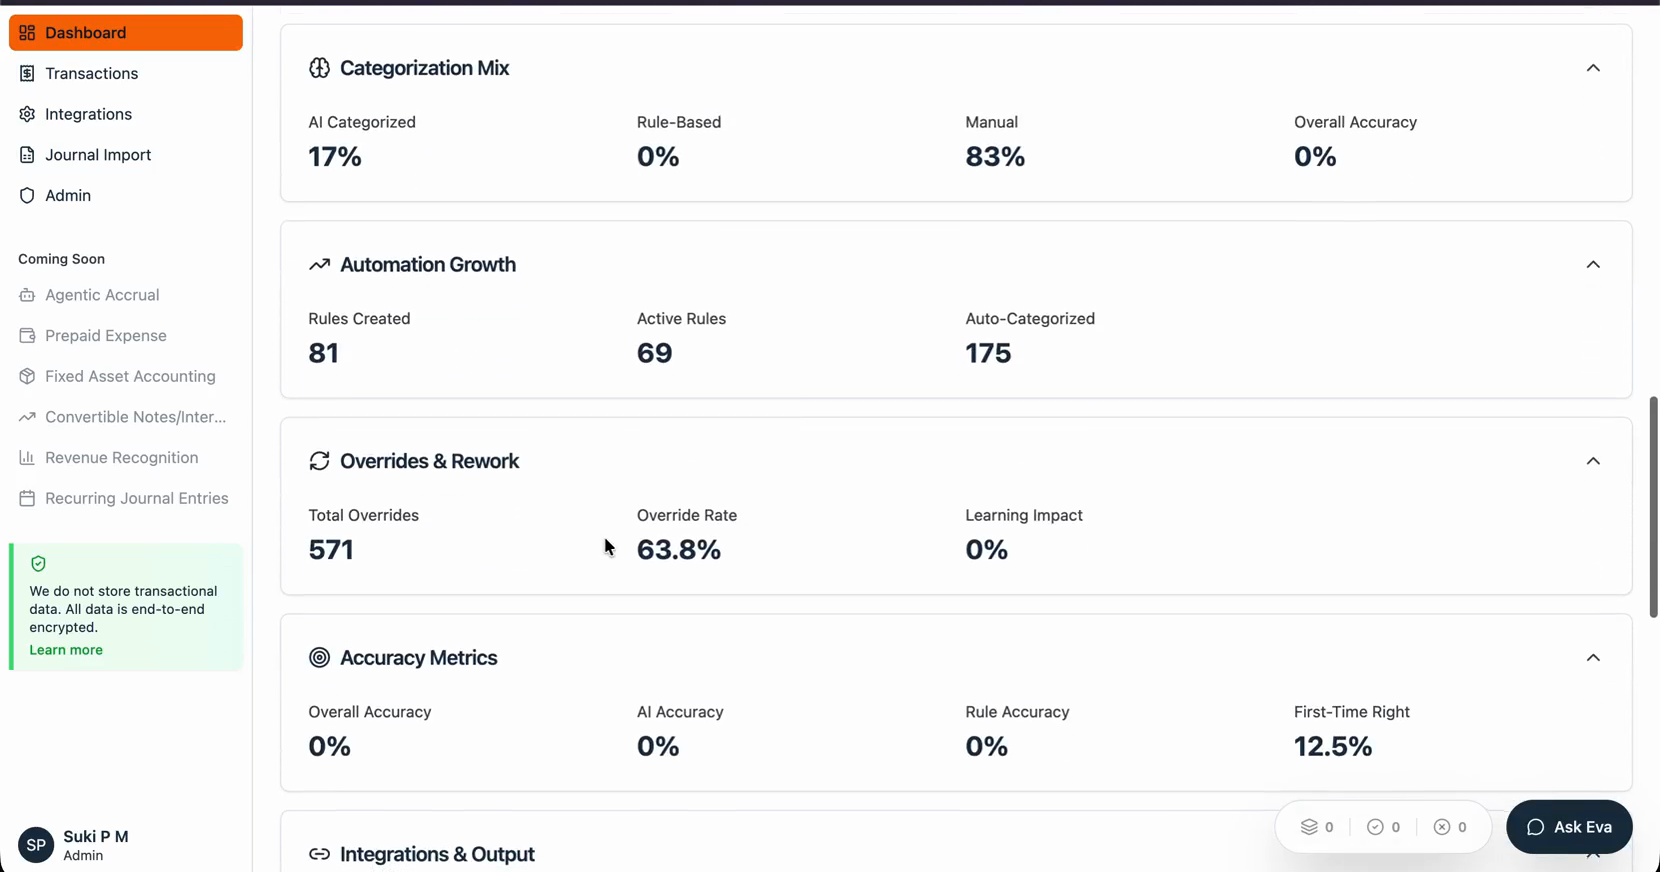
Overrides & Rework
The Overrides & Rework section provides insights into situations where system-generated categorizations are changed by users.
Total Overrides – The number of times a user changes the category suggested by the system. When a different category is selected by the user, the user's selection overrides the system's suggestion.
Override Rate – The percentage of transactions where the system’s suggested category was overridden by the user.
These metrics help evaluate how often system-generated suggestions require manual correction.
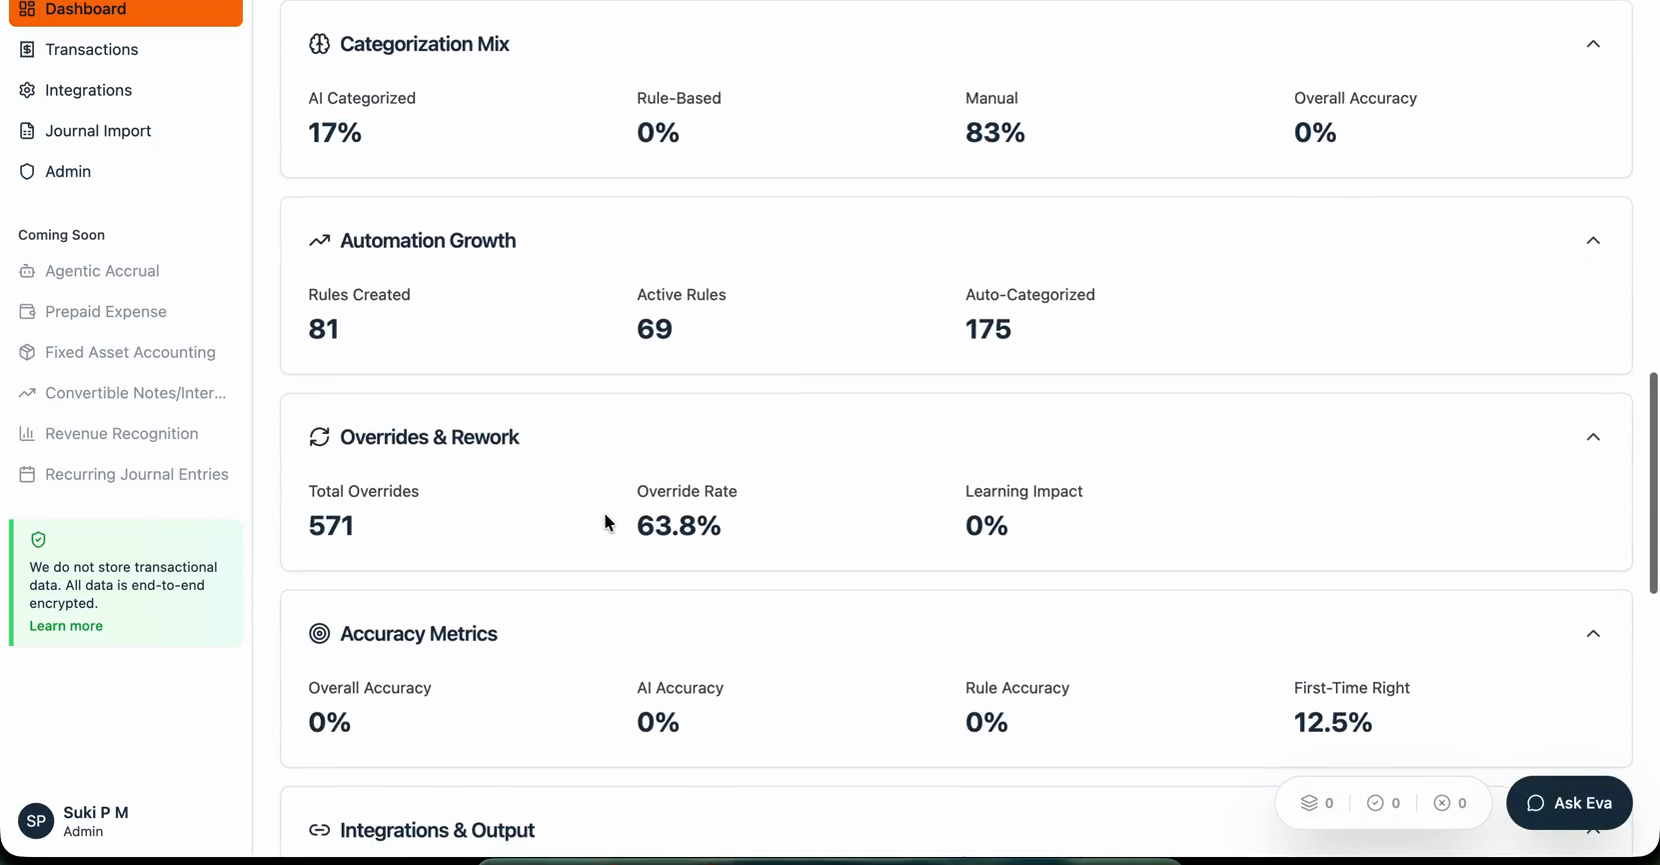
Accuracy Metrics
The Accuracy Metrics section provides insights into how accurately transactions are categorized within the system. These metrics help evaluate the performance of both AI-based categorization and rule-based automation.
The following metrics are included:
Overall Accuracy – The overall percentage of transactions that were categorized correctly across the entire system.
AI Accuracy – The percentage of transactions accurately categorized by the AI model.
Rule Accuracy – The percentage of transactions accurately categorized using predefined categorization rules.
First-Time Accuracy – The percentage of transactions that were correctly categorized on the first attempt, without requiring any manual corrections or overrides.
These metrics improve over time as the system processes more transactions and learns from user interactions. Monitoring these values helps evaluate the effectiveness of automation and categorization strategies within the platform.
Integration and Output
The Integration and Output section provides insights into how the system connects with external platforms and how processed transaction data is synchronized.
This section helps monitor the status and activity of system integrations and ensures that processed data is successfully delivered to connected platforms.
QuickBooks Sync
The QuickBooks Sync metric displays the total number of synchronization events between the system and QuickBooks.
A sync event occurs when the system connects with QuickBooks to update or retrieve financial data. This metric reflects the overall synchronization activity, not the number of posted transactions.
The count may include several background processes such as:
Automatic data synchronization
Token refresh operations
System-triggered sync events
Because these background operations occur frequently, the total sync count may appear higher than expected.
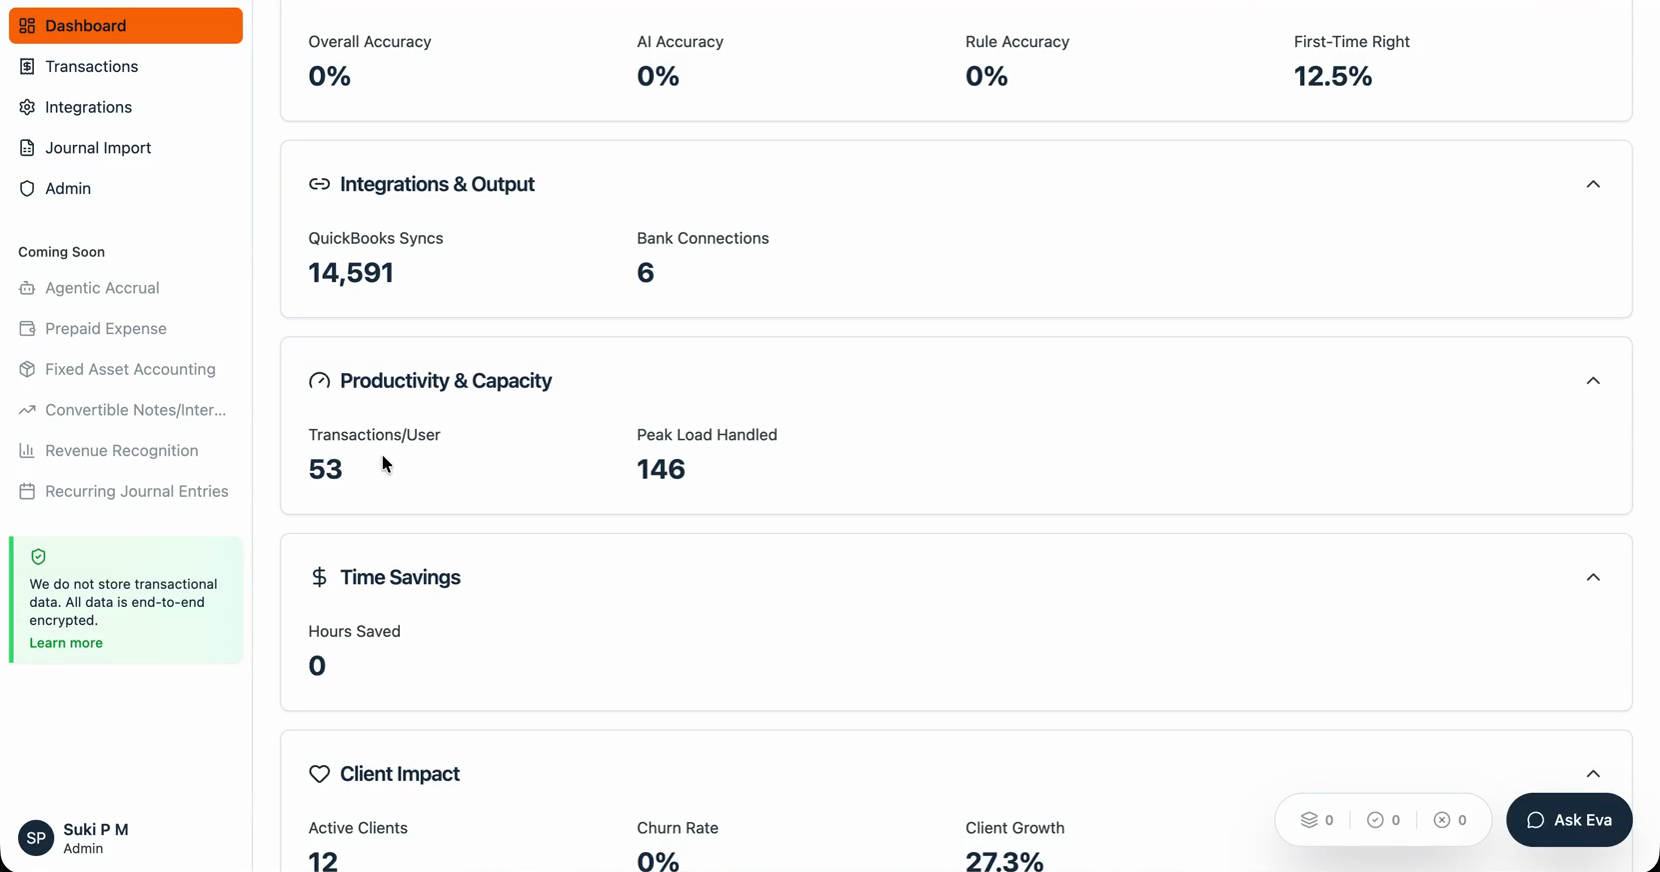
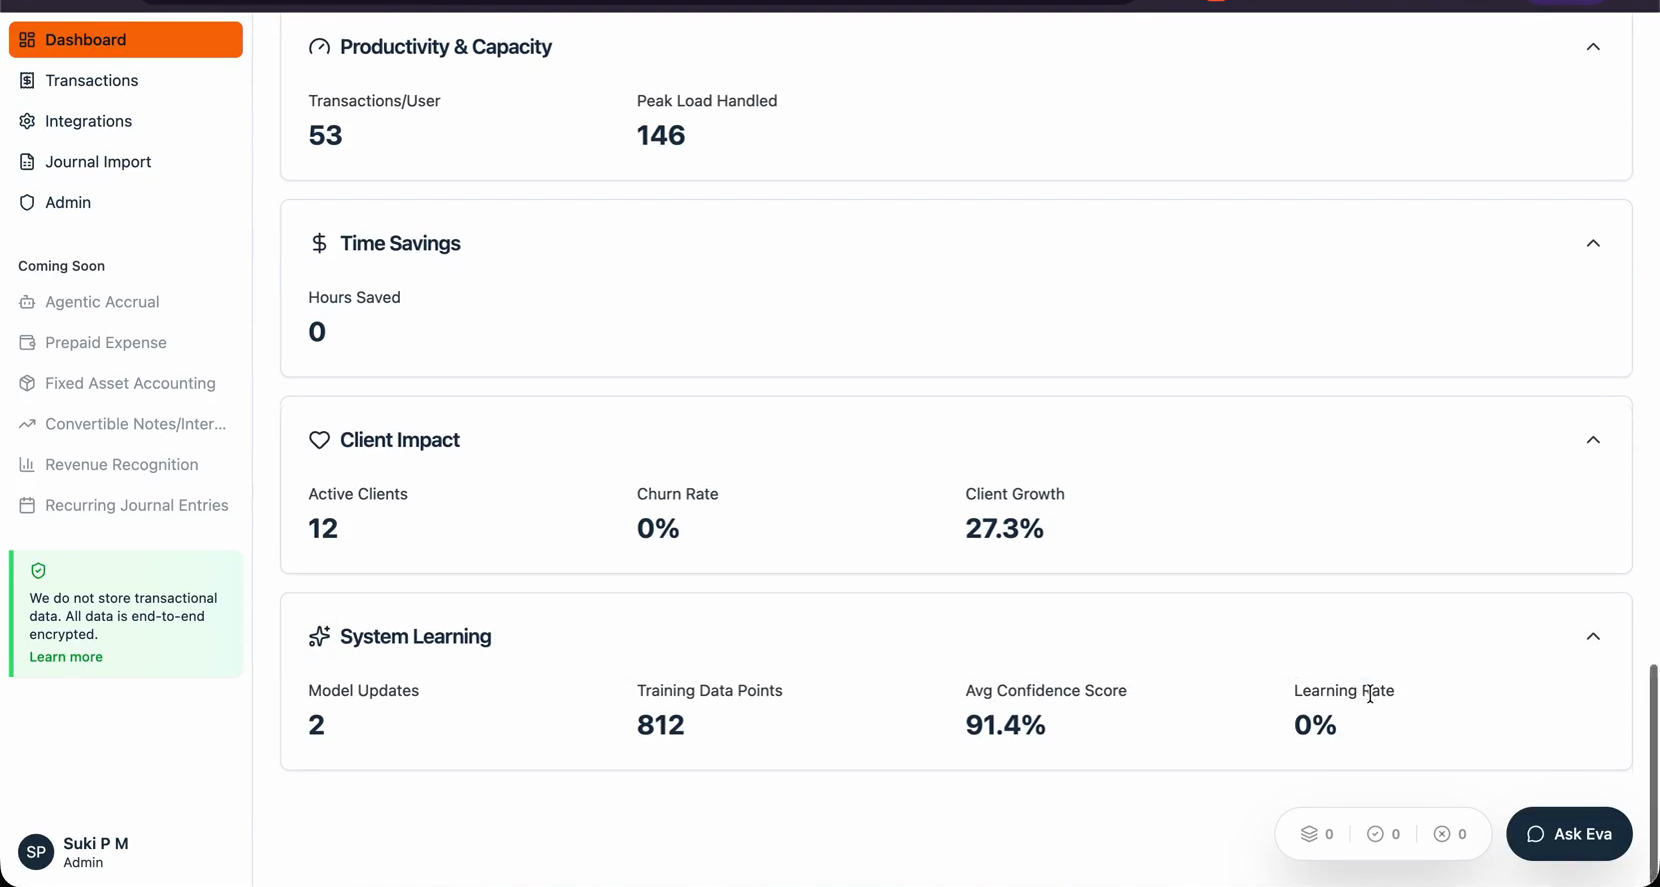
Productivity and Capacity
The Productivity and Capacity section provides insights into how efficiently transactions are processed by users.
Transactions per User
This metric shows the average number of transactions processed per user during a given period. It helps measure user productivity and system usage.
Peak Load Handled
The Peak Load Handled metric indicates the maximum number of transactions uploaded or processed at a single point in time.
This metric helps evaluate the system’s ability to handle high transaction volumes during peak activity periods.
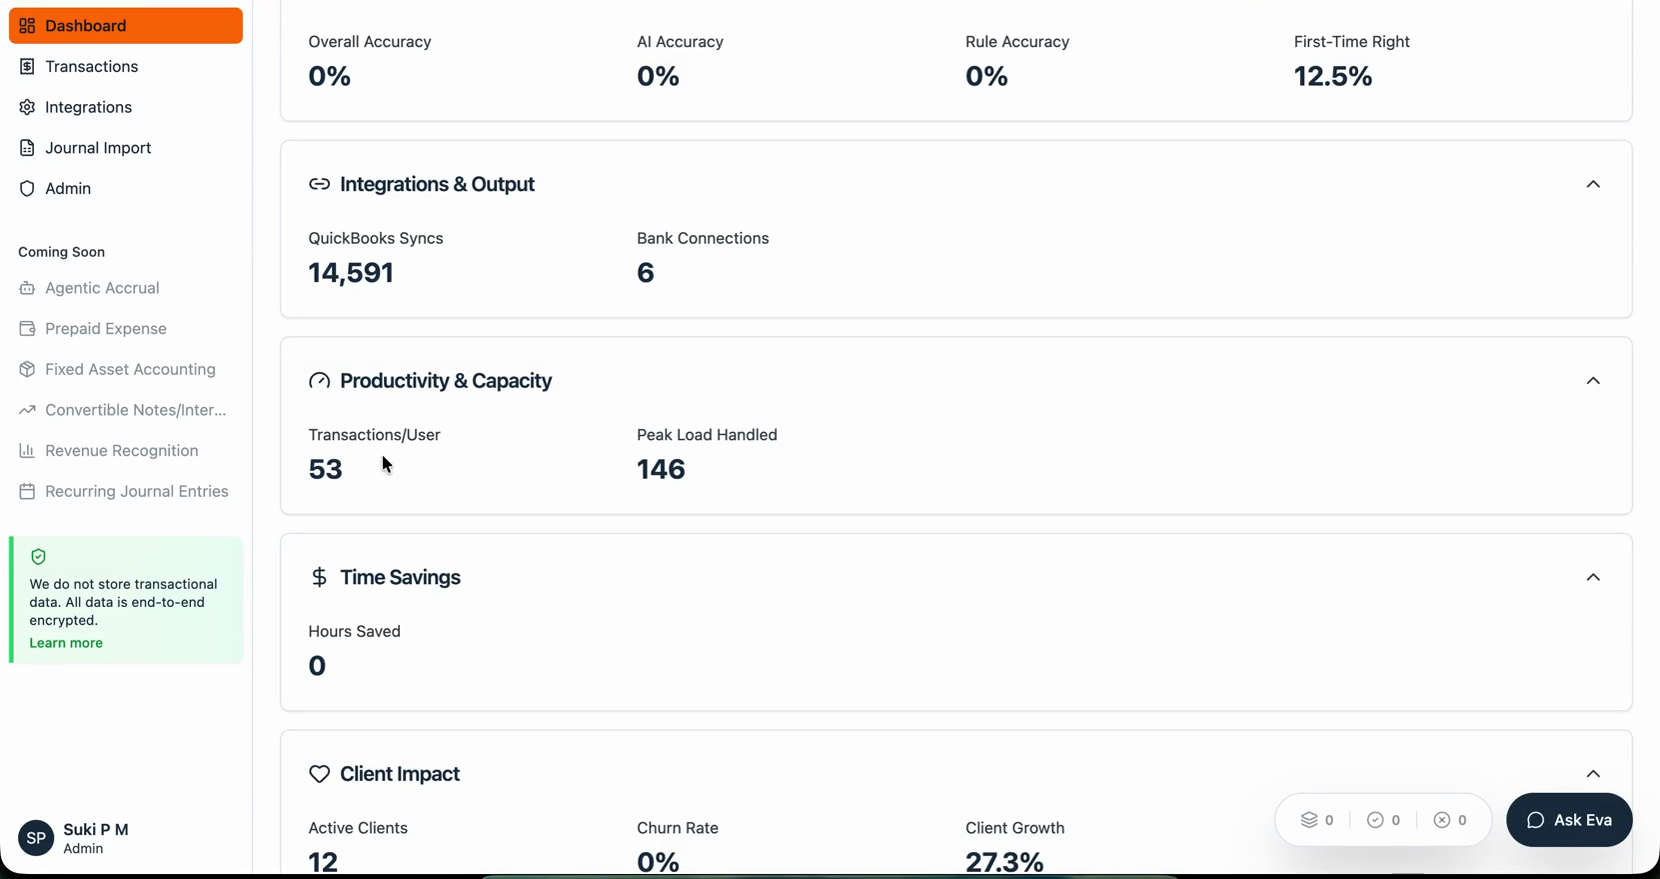
Time Savings
The Time Savings section estimates the total amount of time saved through automation and system efficiencies.
This value is calculated based on the number of transactions processed and the estimated time that would otherwise be required for manual processing.
Because this metric is measured in hours saved, it may take some time before a significant value becomes visible as more transactions are processed within the system.
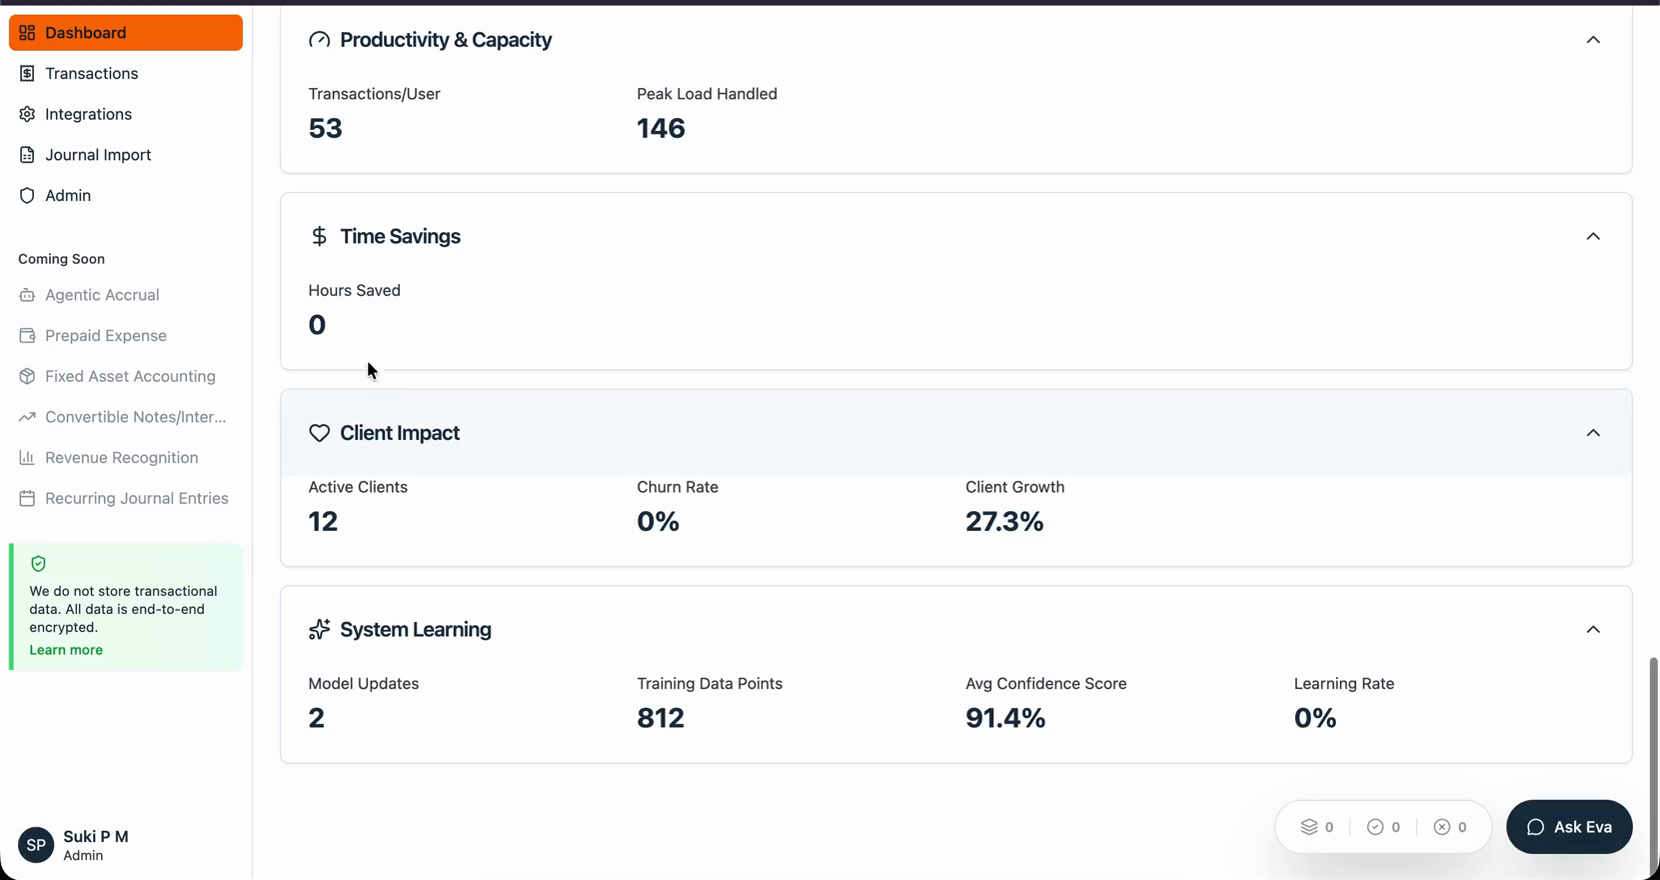
Client Impact
This section provides insights into client growth and retention trends within the platform.
Churn Rate
The Churn Rate measures how many clients have stopped using the platform.
It is calculated by comparing the number of active clients from the previous month with the current month to determine how many clients have left.
Client Growth
Client Growth measures the increase in the number of clients using the platform.
This metric is calculated by comparing the number of clients in the current month with the number of clients from the previous month.
These metrics help track customer retention and platform adoption trends.
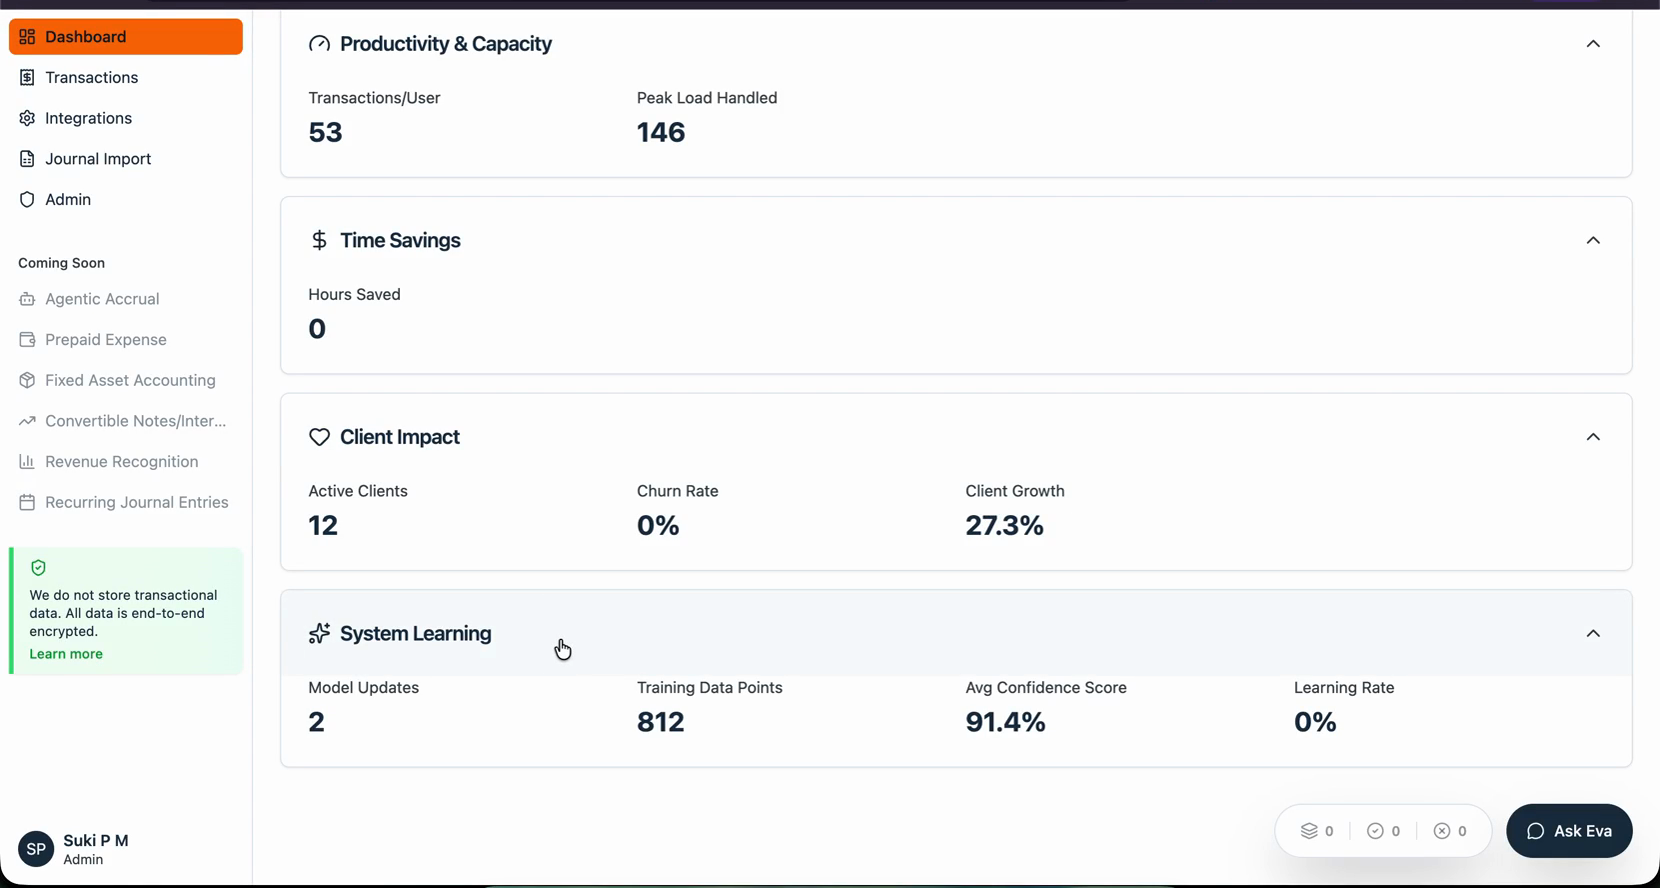
System Learning
The System Learning section provides insights into how the system improves over time through training and machine learning processes.
The following metrics are included:
Model Updates - This metric shows the number of times the system’s AI model has been updated or retrained.
Training Data Points - This represents the total number of transactions or data points used to train the AI model. As more transactions are processed, the amount of training data increases, helping the model improve its categorization accuracy.
Average Confidence Score - The Average Confidence Score represents the average confidence level of the AI model when categorizing transactions. A higher confidence score generally indicates that the system is making more reliable categorization predictions.
Learning Rate - The Learning Rate reflects how quickly the system improves based on new data and user feedback. This metric helps measure how effectively the system adapts and learns from transaction processing patterns.
The dashboard provides key insights into system activity, transaction processing, automation performance, and user engagement. The metrics may change over time as new transactions are uploaded and processed. Since the dashboard does not update in real time, refresh the page to view the latest data. Regularly reviewing these metrics helps monitor system performance and track improvements in automation and accuracy.