
How to: My Analytics Dashboard
Learn how to navigate the Toucan Sales My Analytics dashboard to review KPIs, analyse customer profiles, track orders, and configure your own custom reports.
This guide demonstrates how to navigate the My Analytics dashboard to analyse key performance metrics, review customer profiles, and track sales orders. This section will become your central hub for managing your work and tracking your customer data.
This guide applies to sales managers, account executives, and business analysts who need to monitor sales performance and customer trends.
The My Analytics dashboard provides several reporting modules to help you monitor and analyse your sales operations.
Here is an overview of the main reporting tabs available in the dashboard:
Reporting Tab | Primary Function |
|---|---|
KPIs | View interactive metrics, cumulative sales charts, and top-level performance summaries. |
Customer Profiles | Analyse sales metrics and historical trends segmented by customer categories. |
Outstanding Orders | Track the value and timeline of outstanding and future orders using detailed bar charts. |
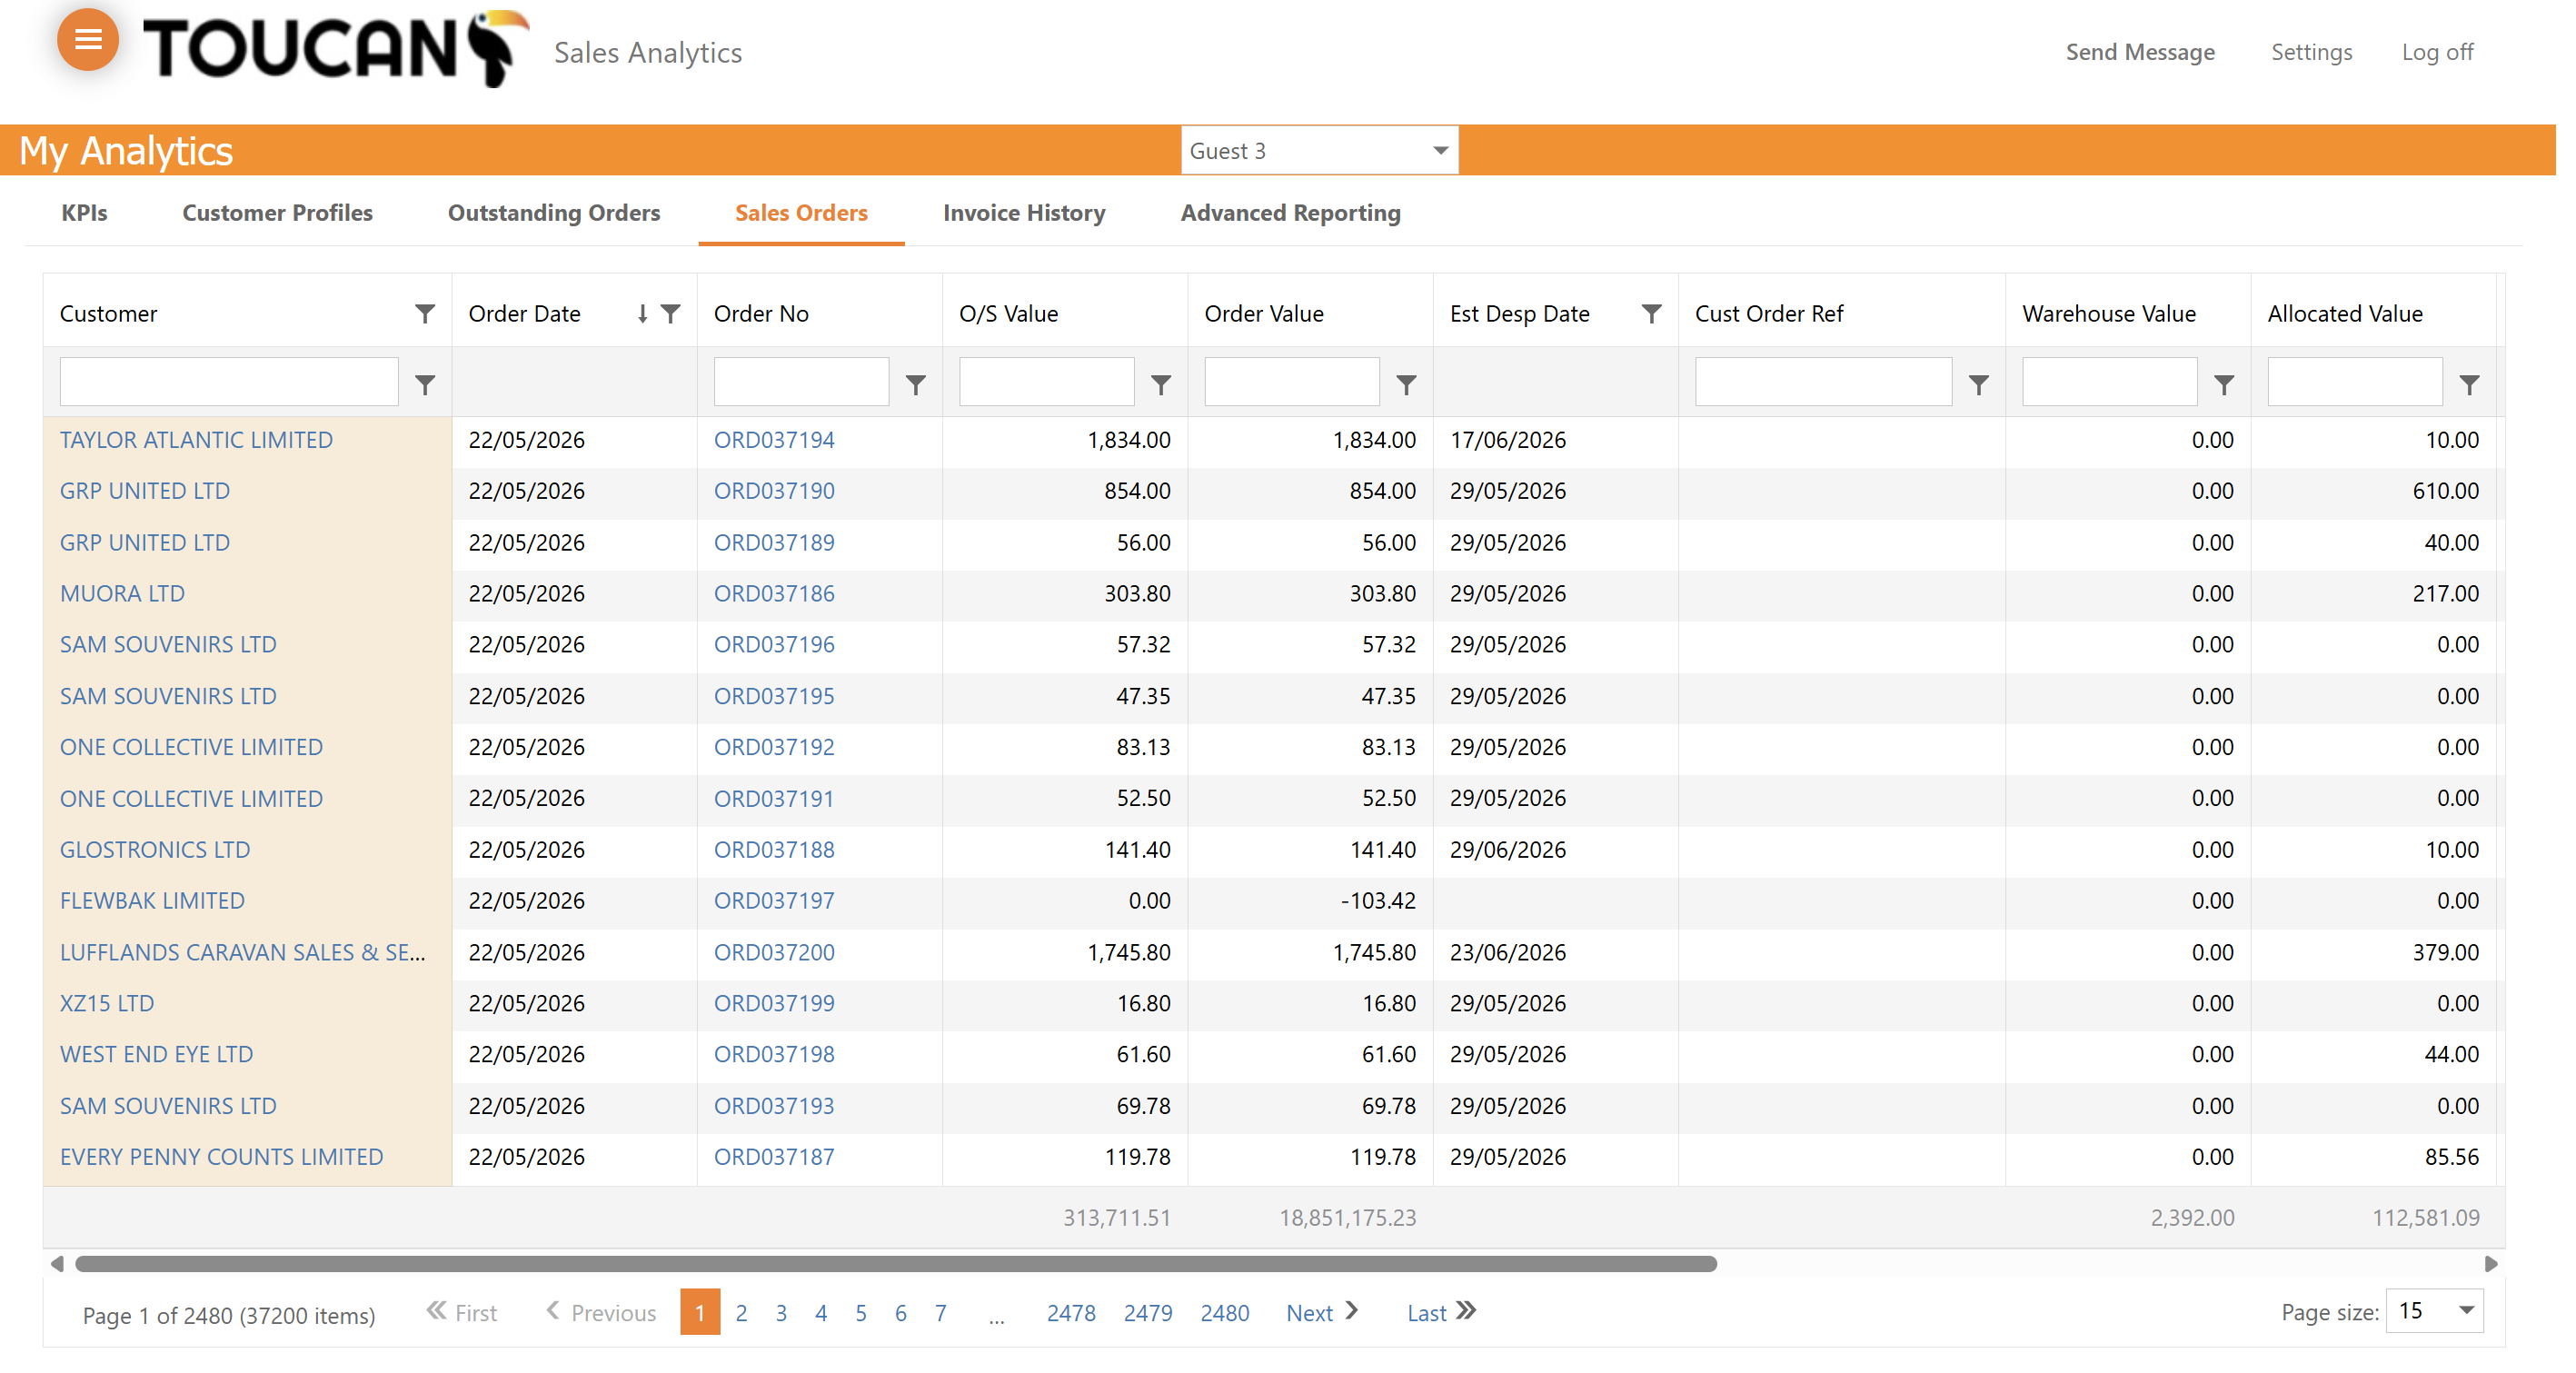
Sales Orders | Browse, sort, and review specific sales orders within a tabular data grid. |
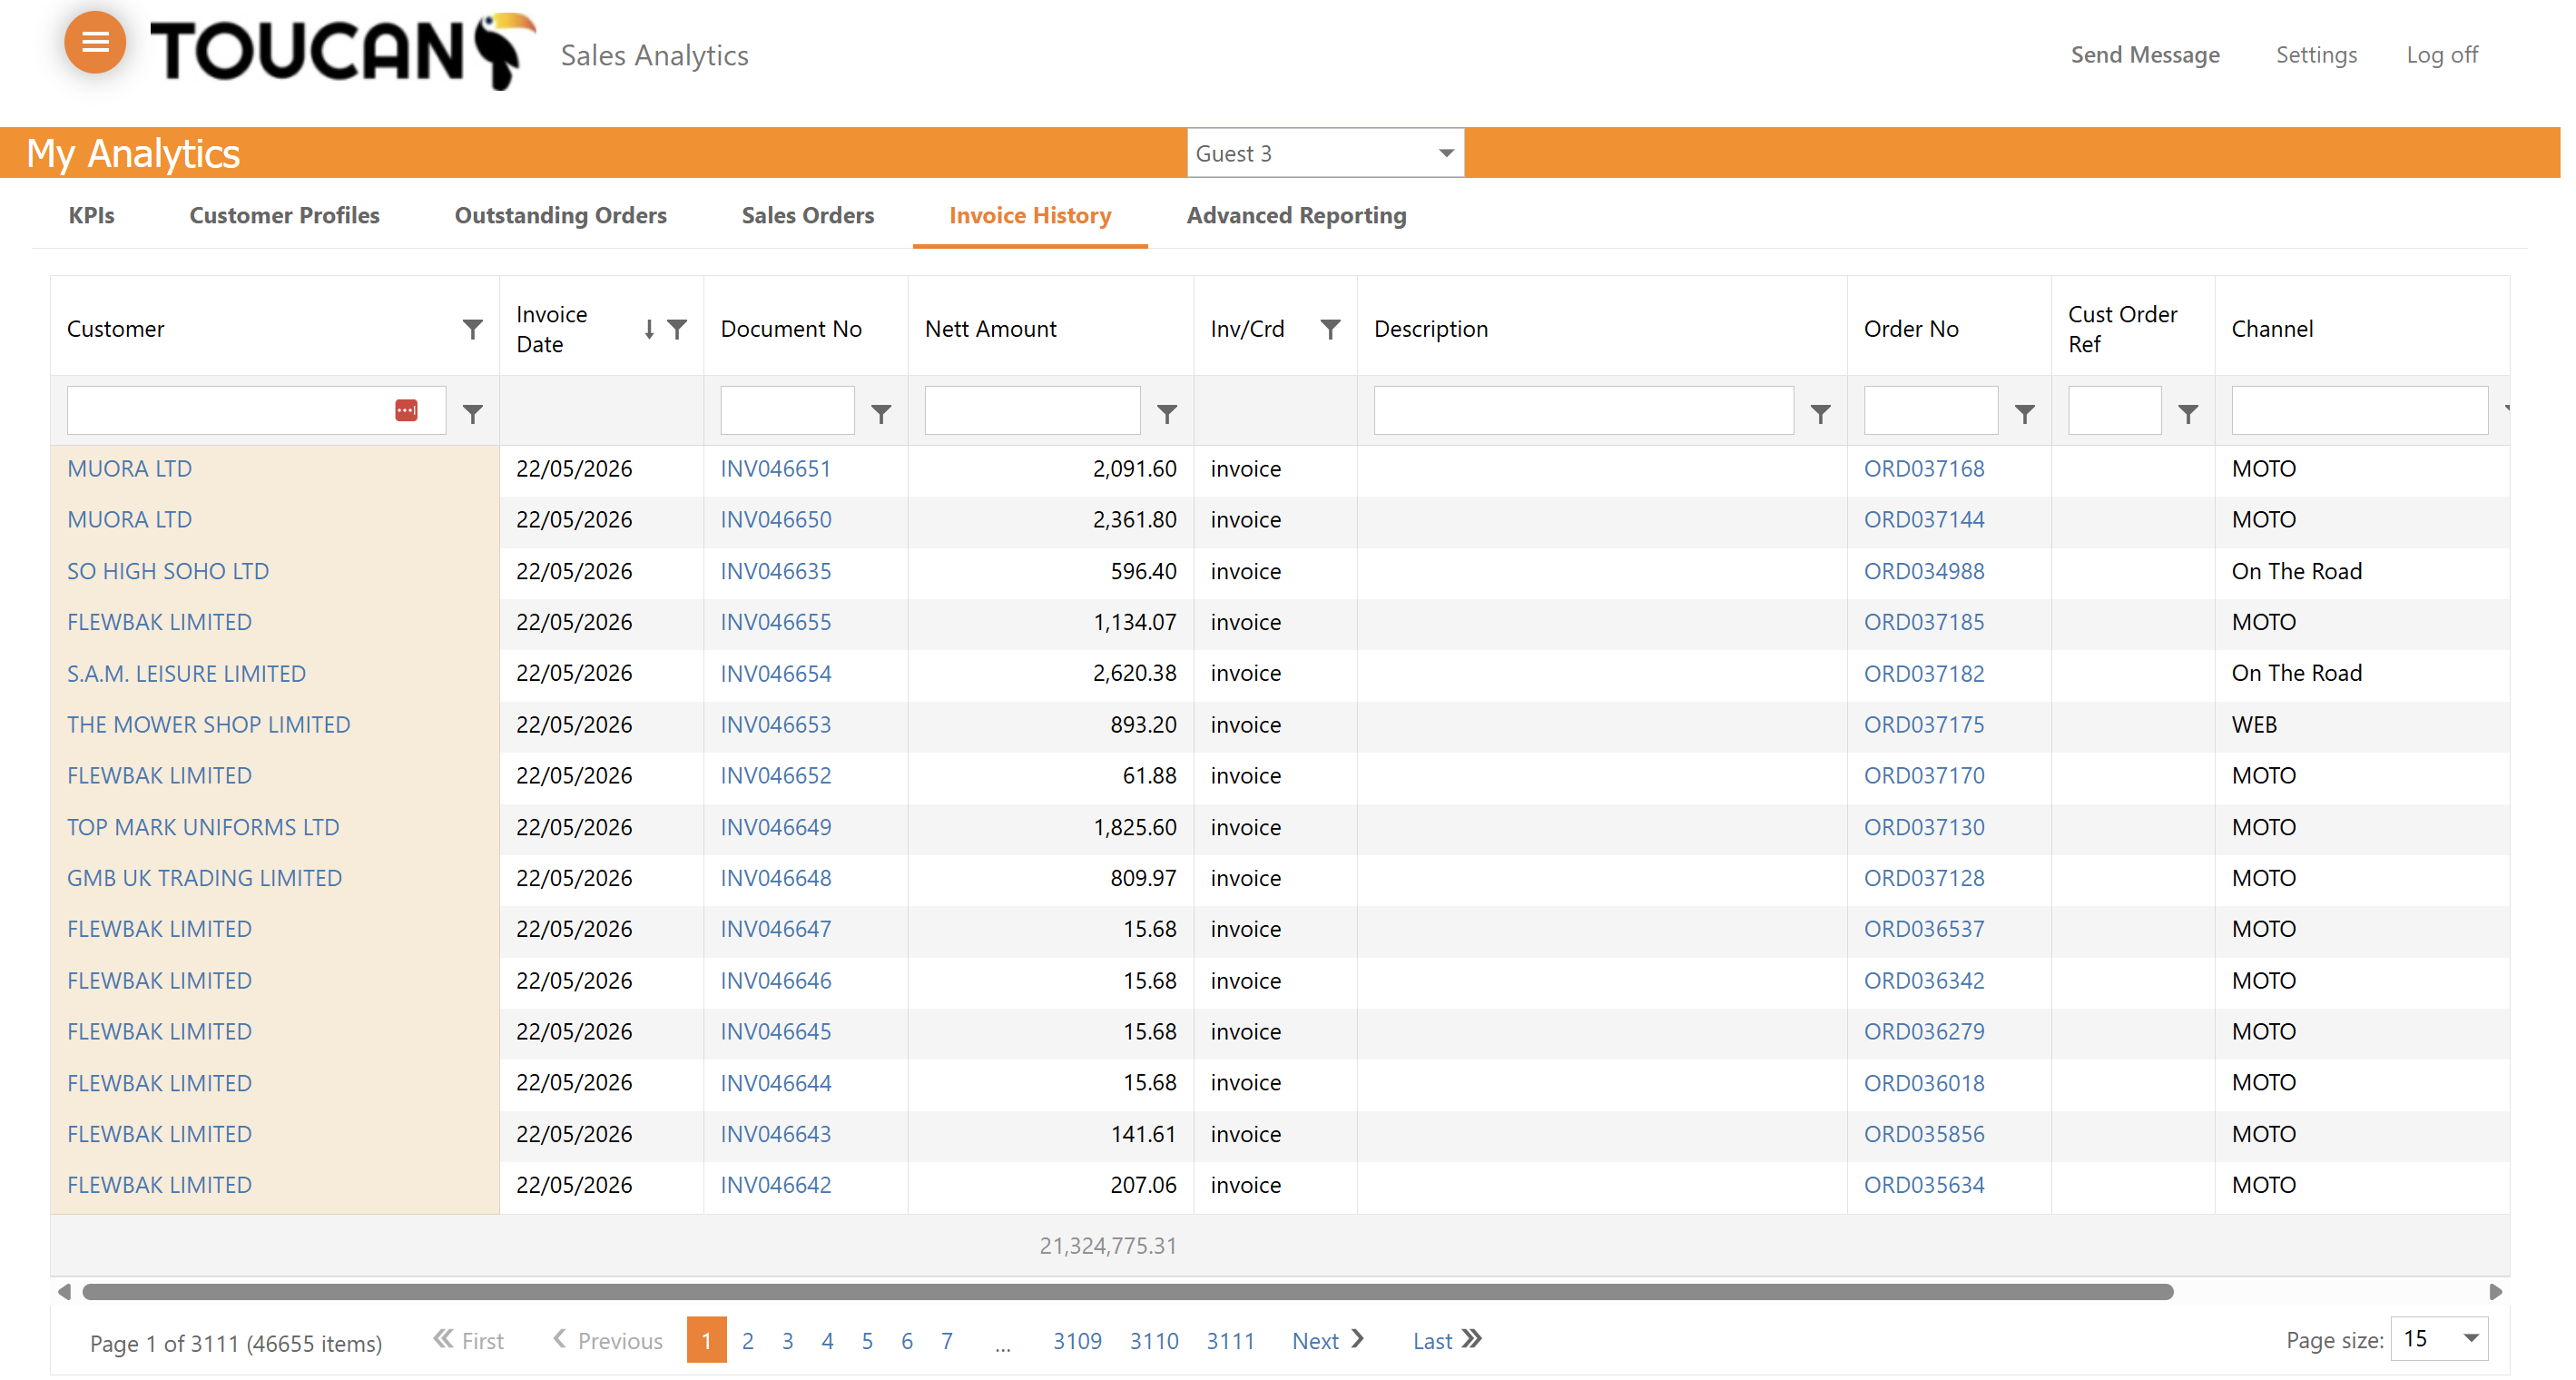
Invoice History | Search, filter, and sort past invoice records by customer, document number, or channel. |
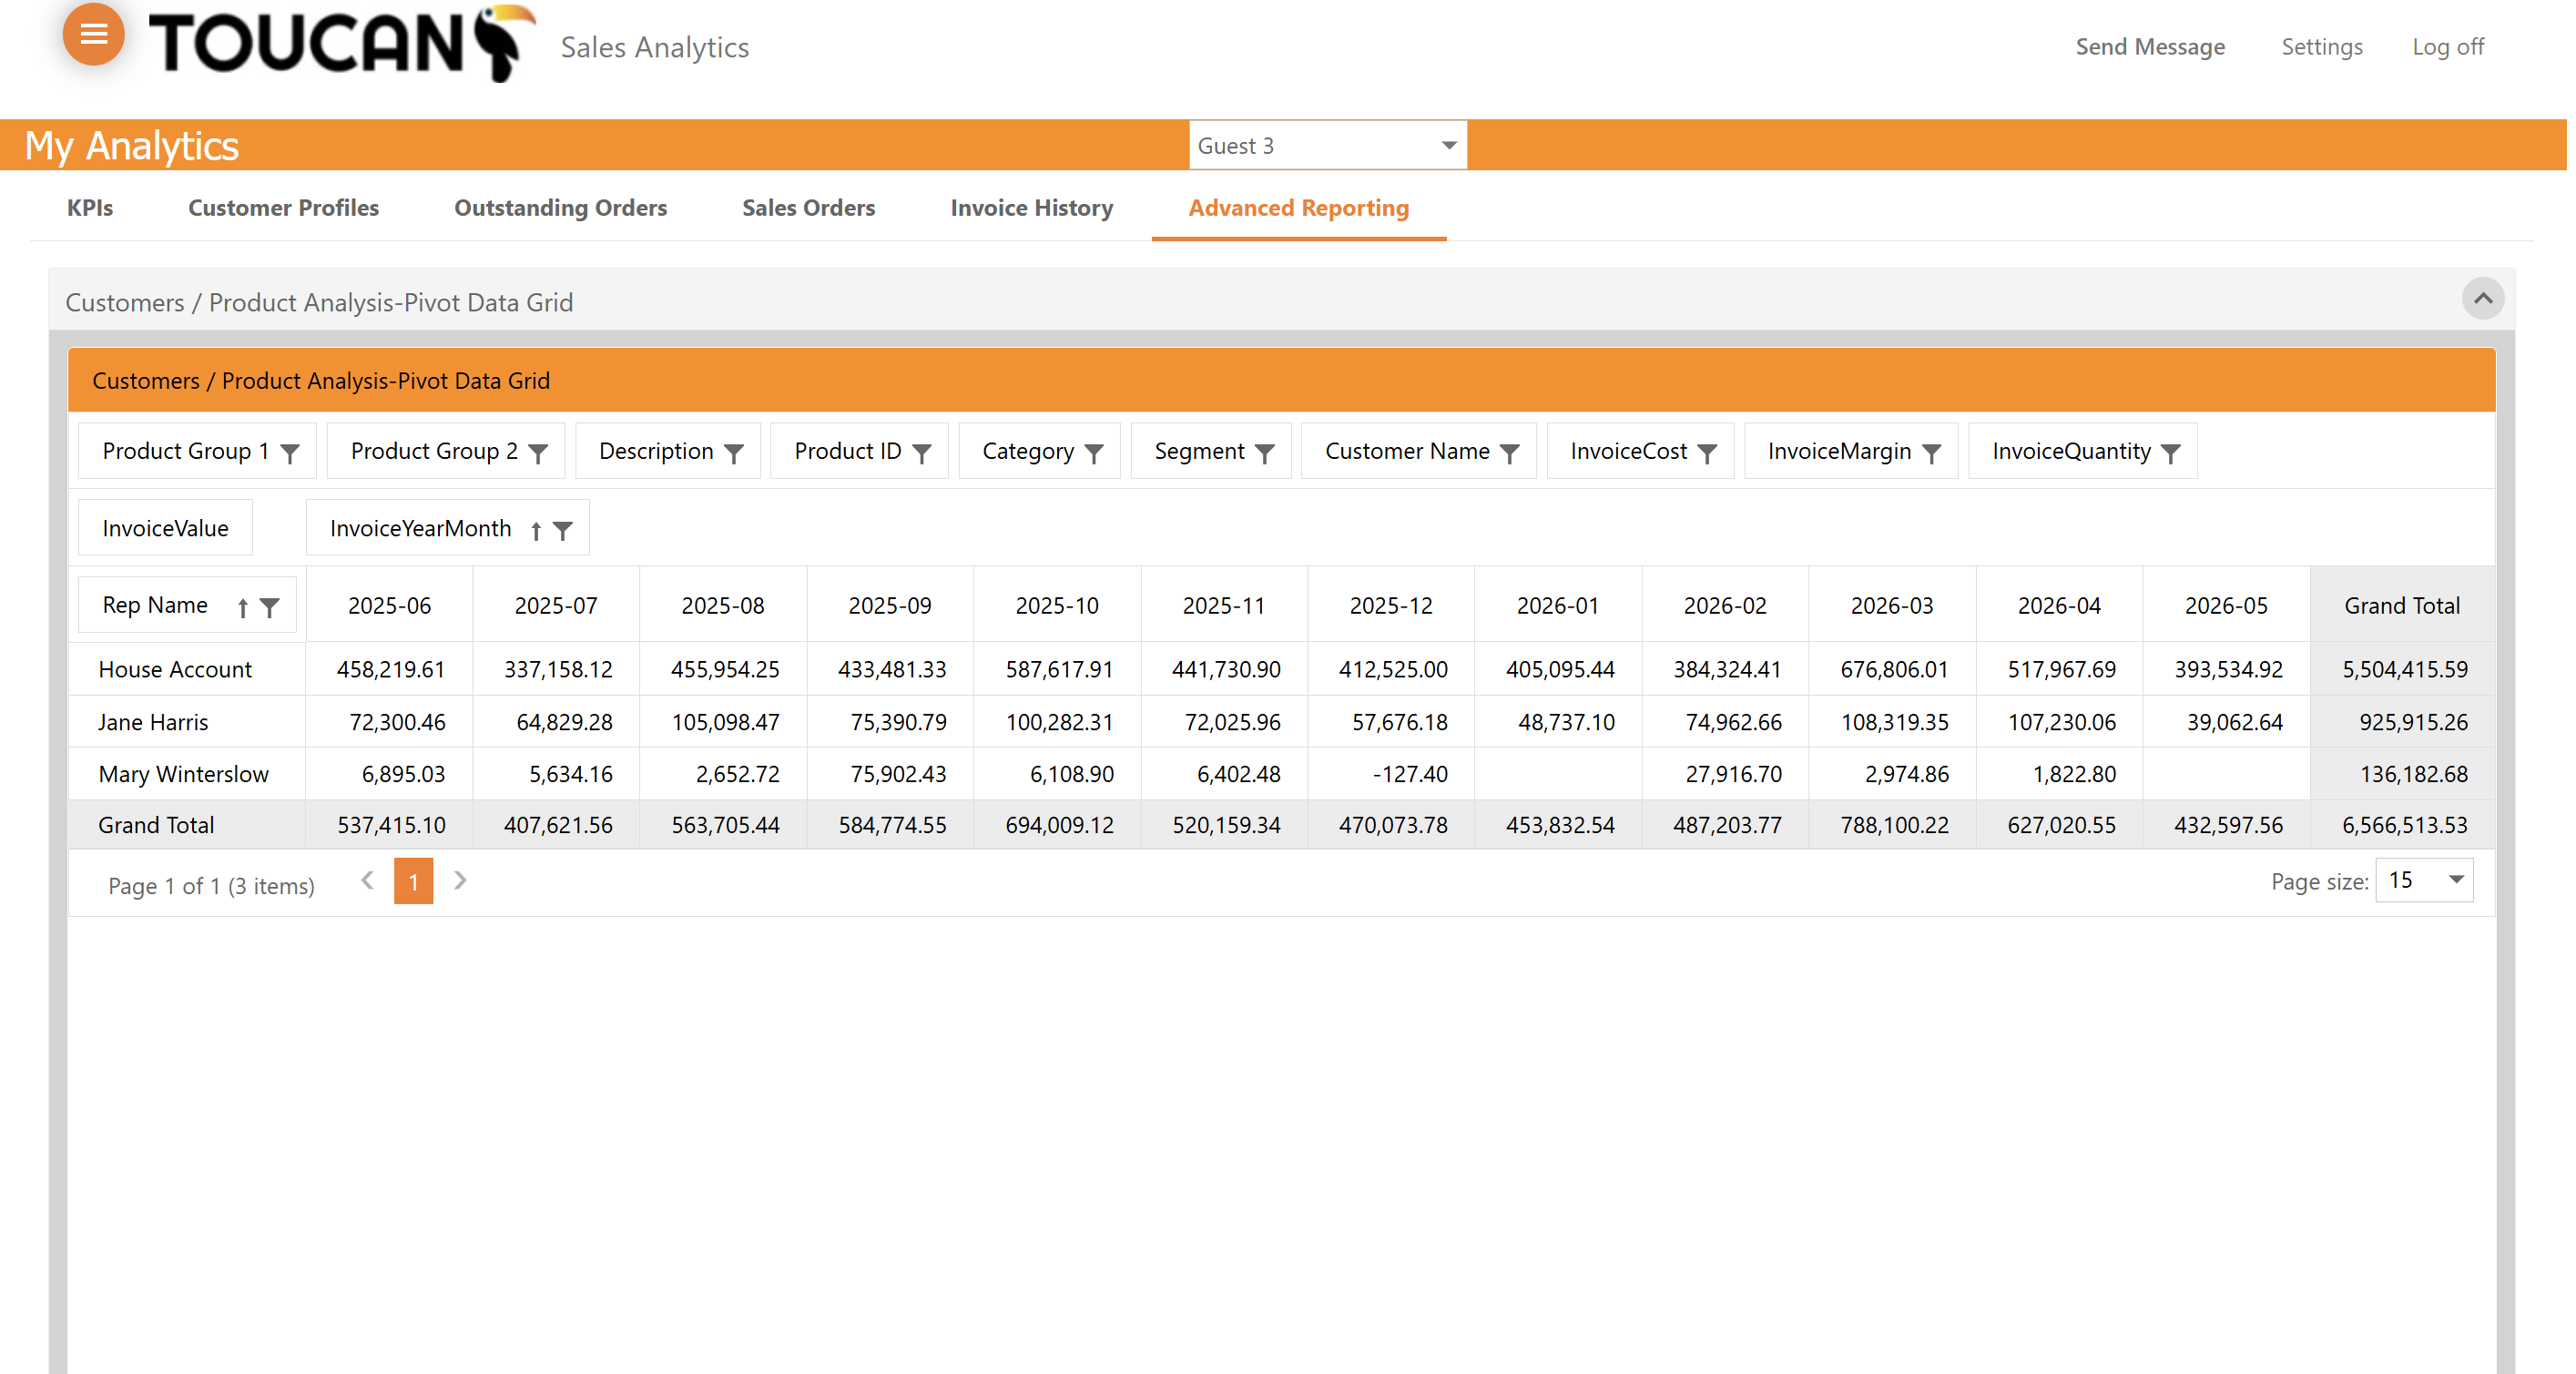
Advanced Reporting | Drill into more tailored reporting by constructing a personalised report. |
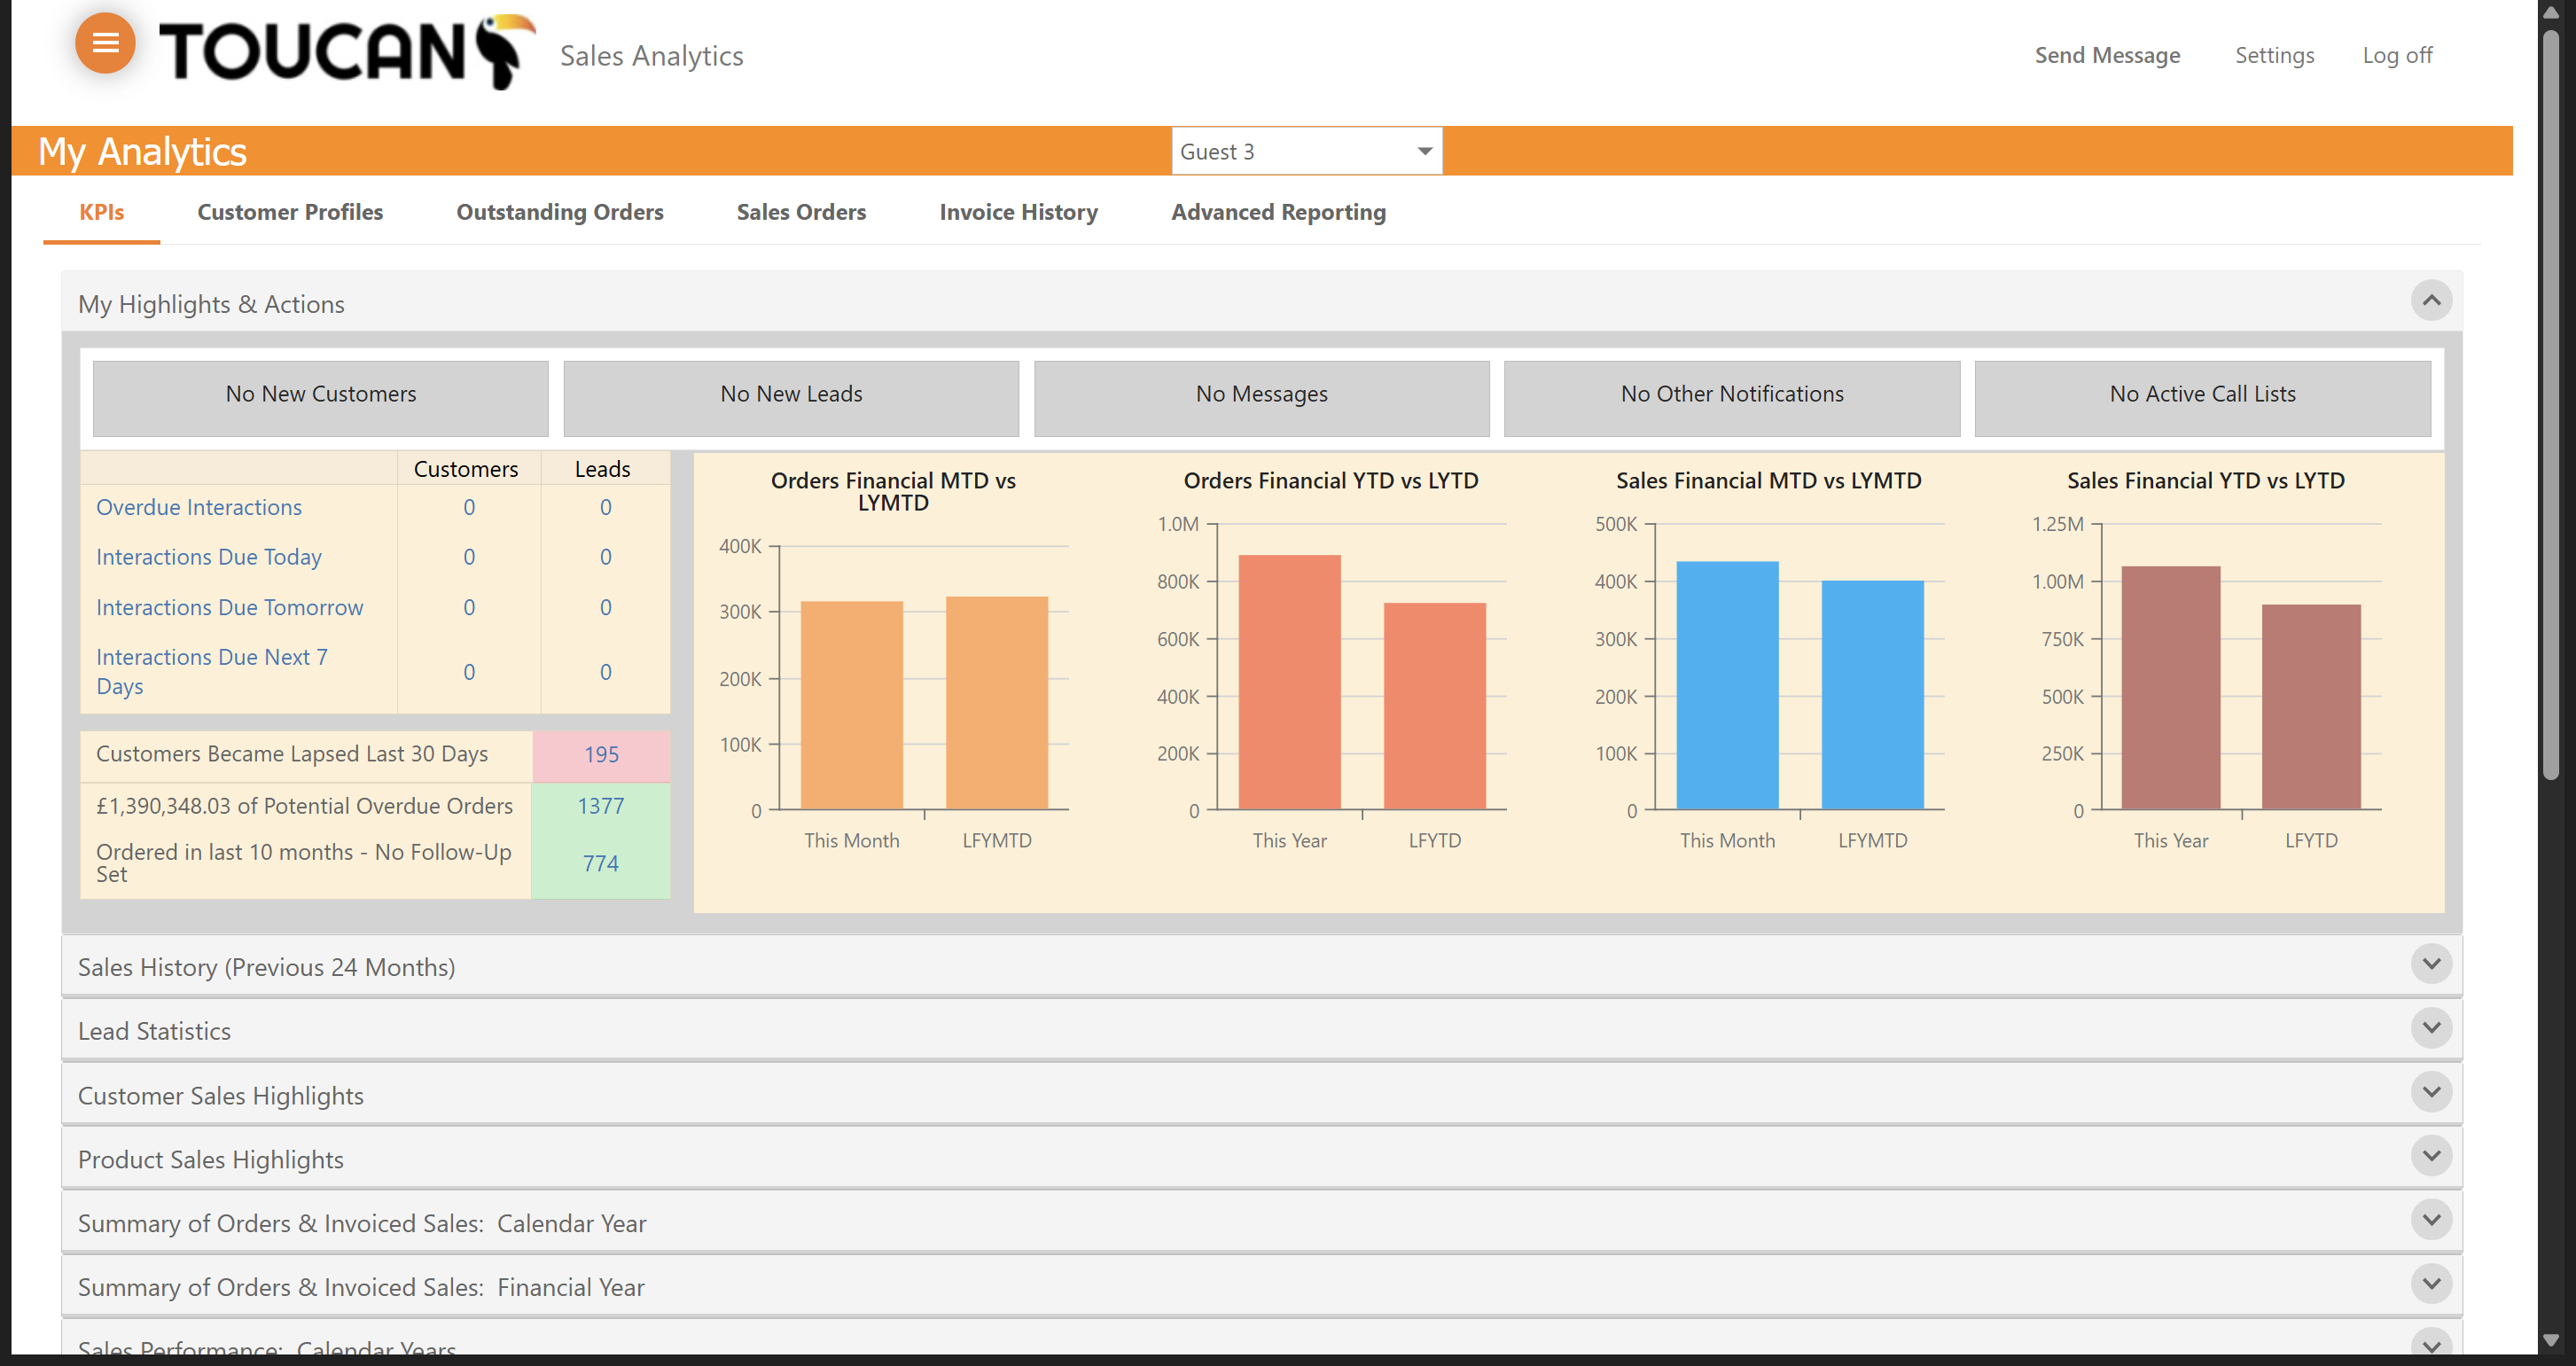
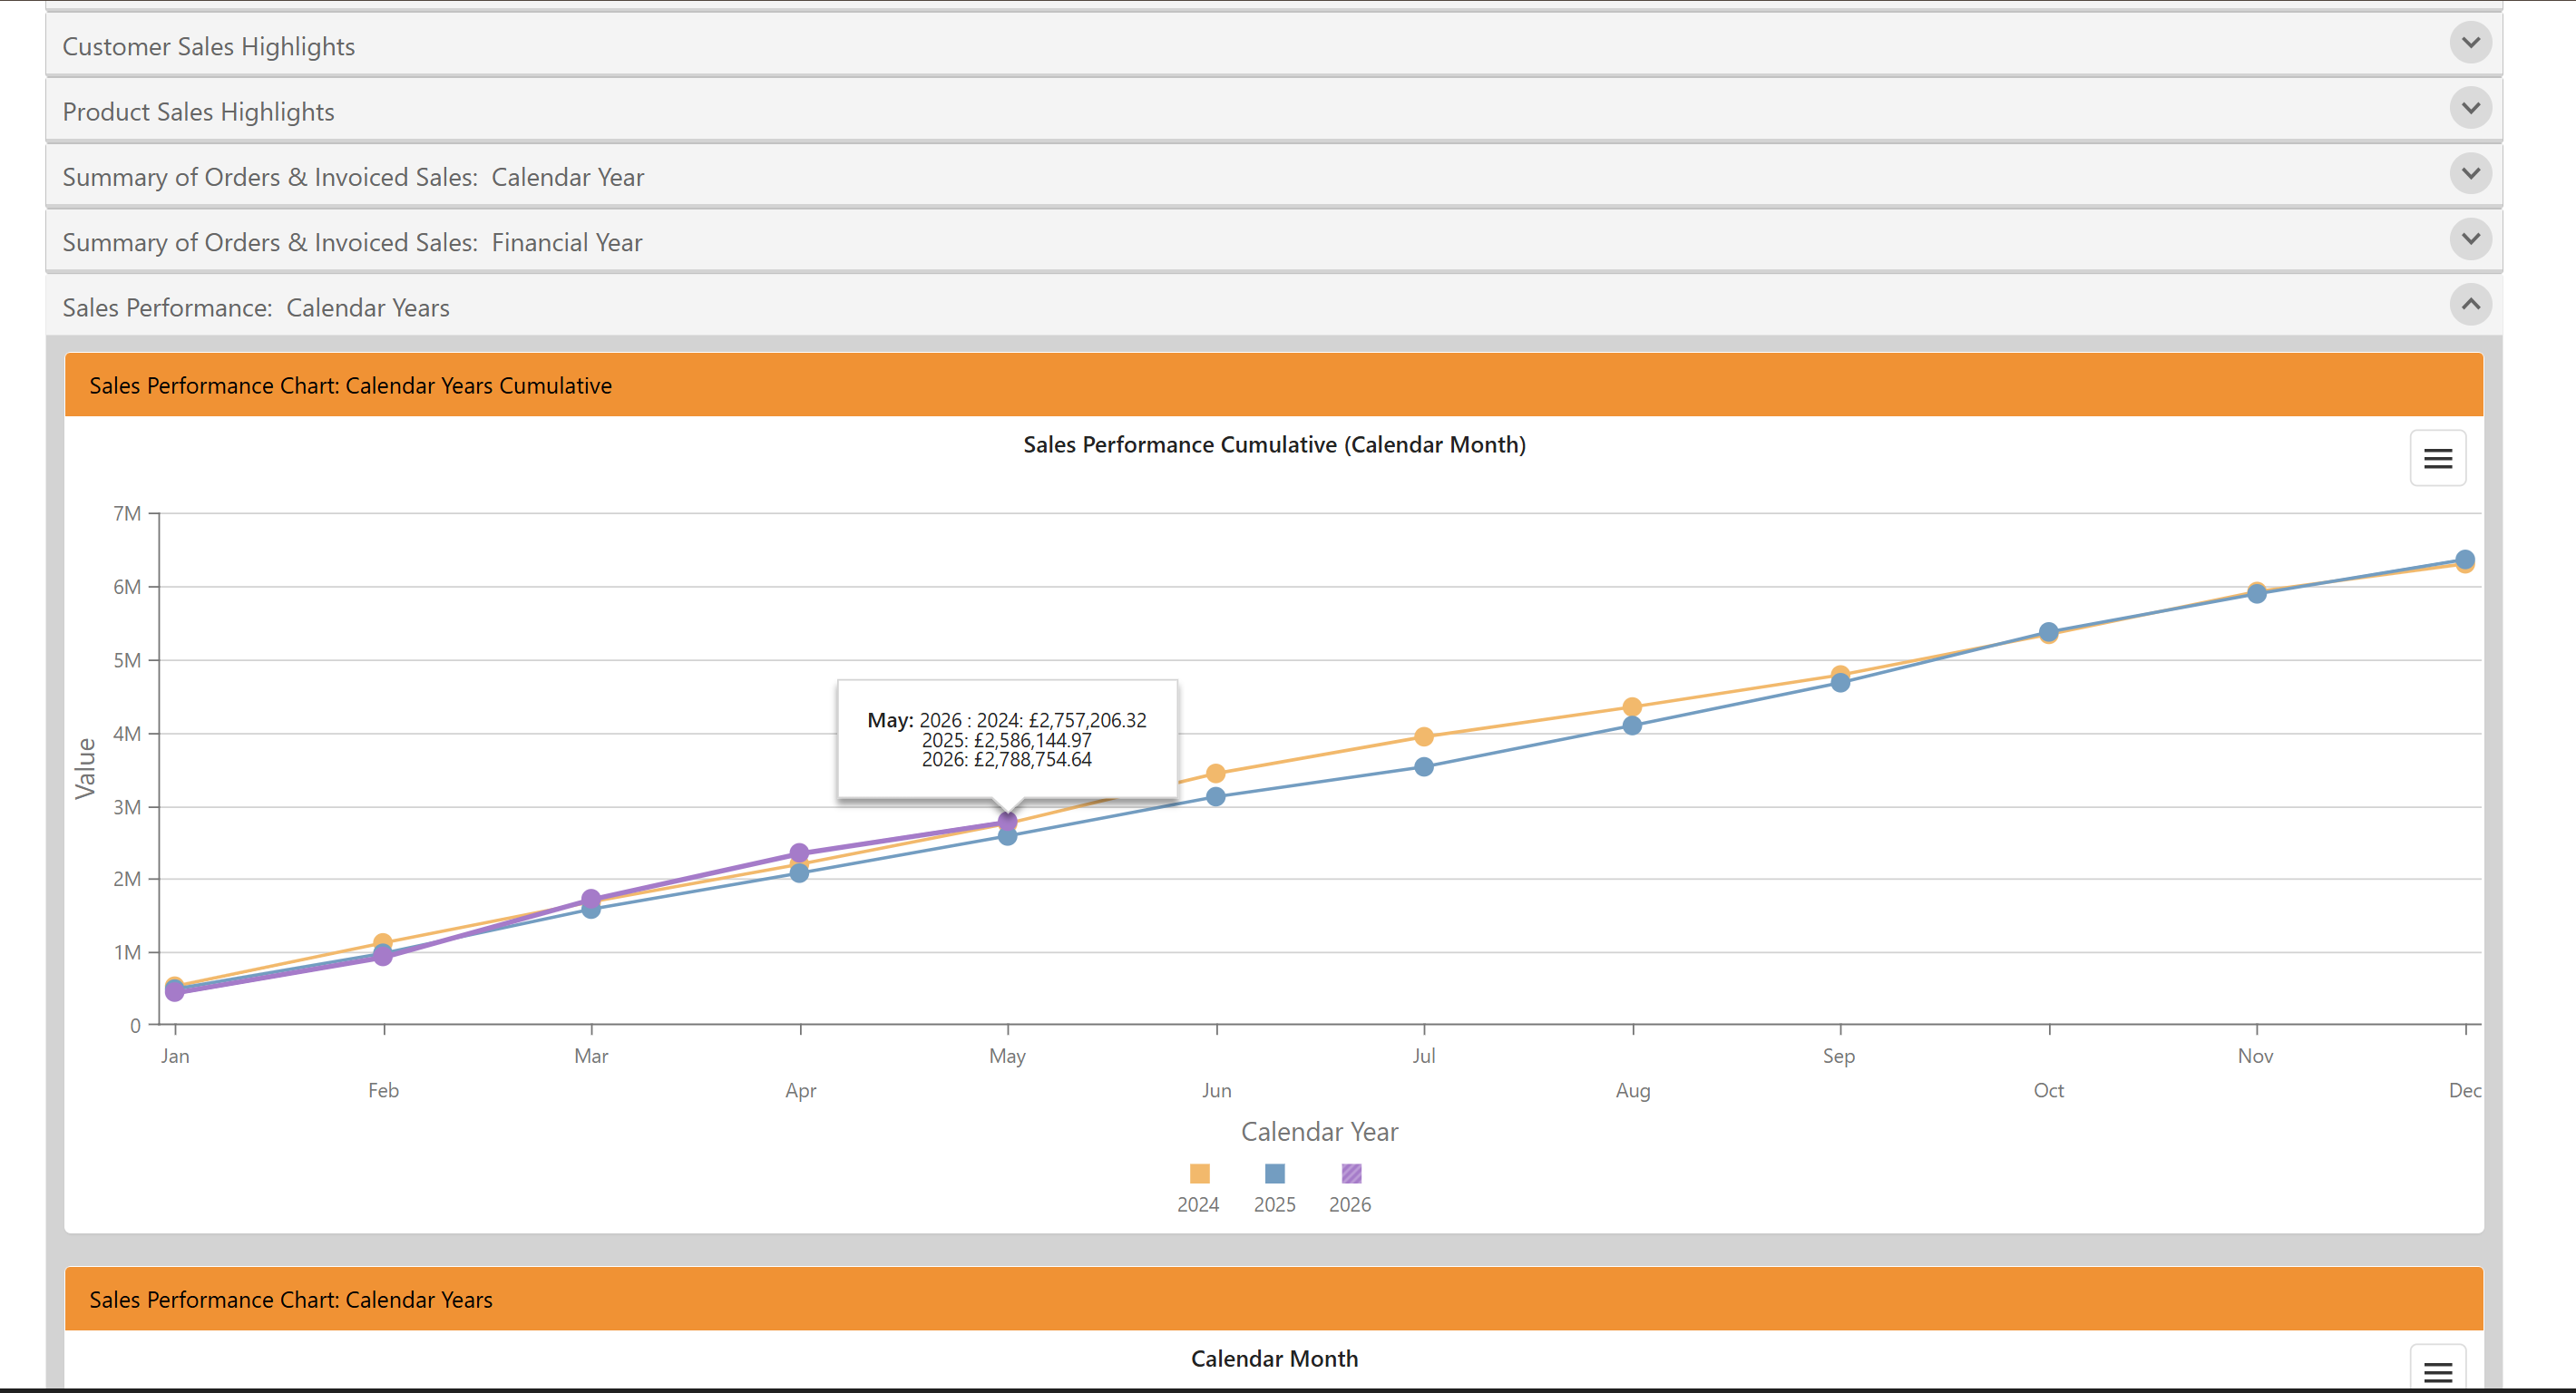
Reviewing Key Performance Indicators (KPIs)
Navigate to the KPIs section to get a high-level view of your cumulative sales performance and historical trends.
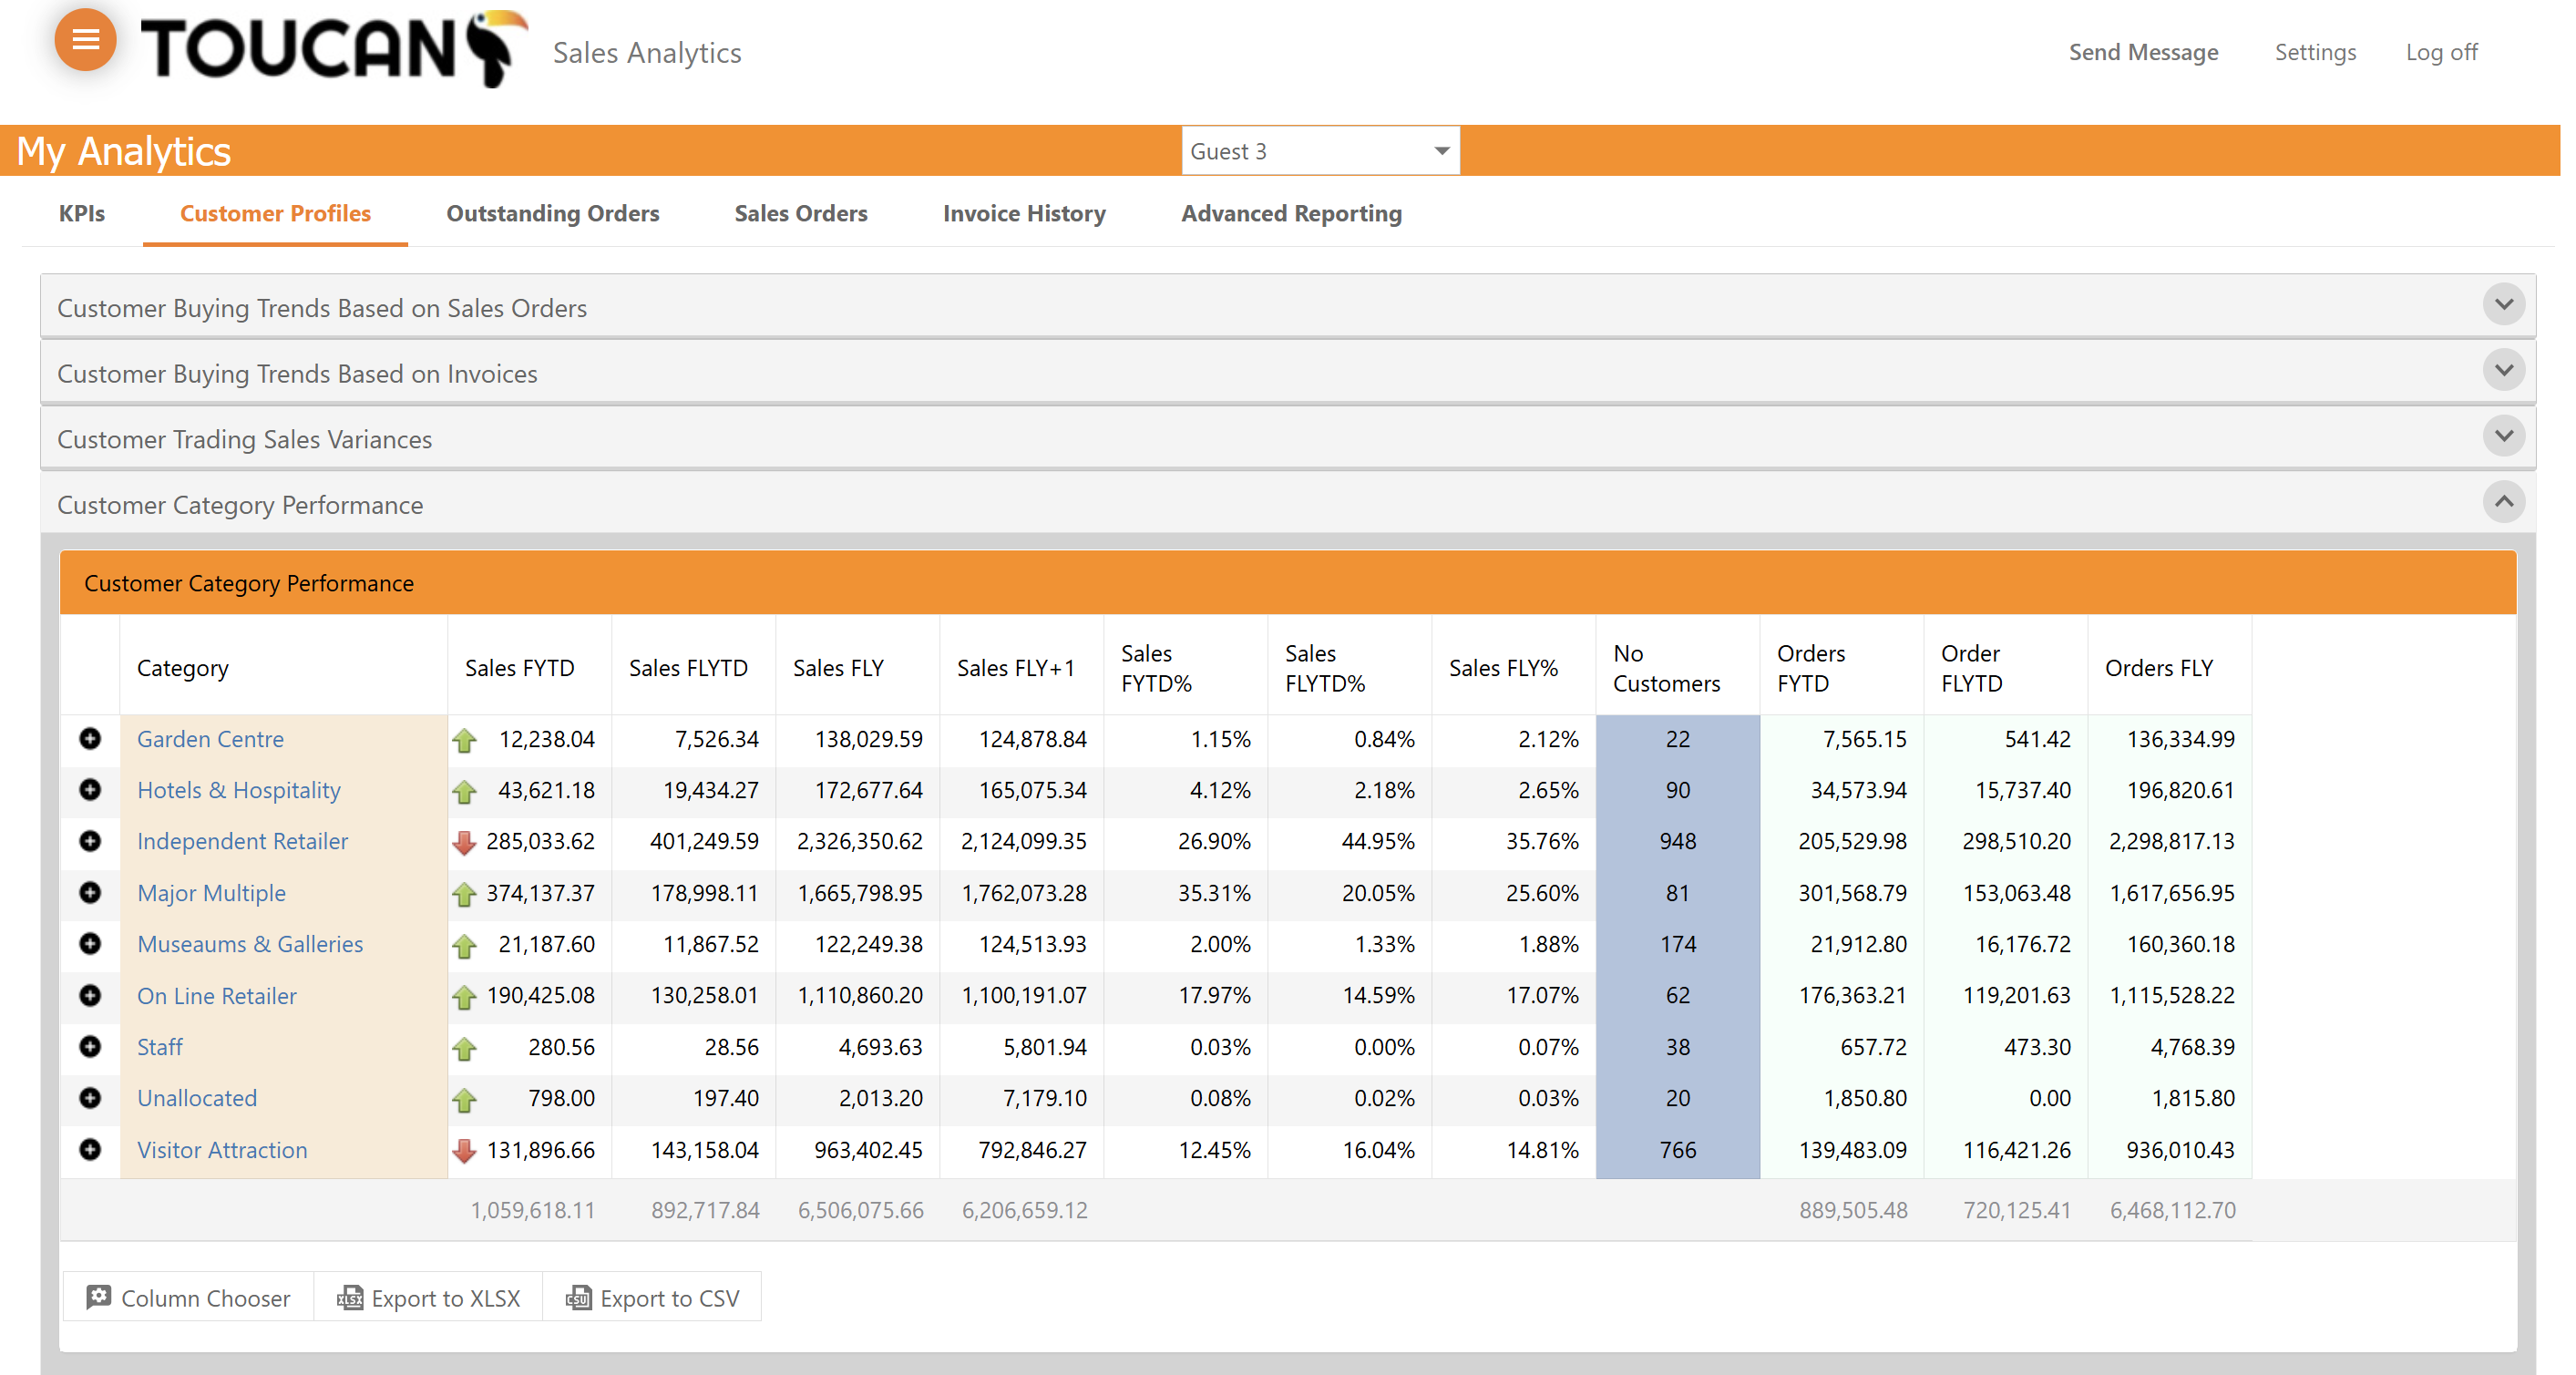
Analying Customer Profiles
Use the Customer Profiles section to drill down into specific customer segments and assess their financial impact.
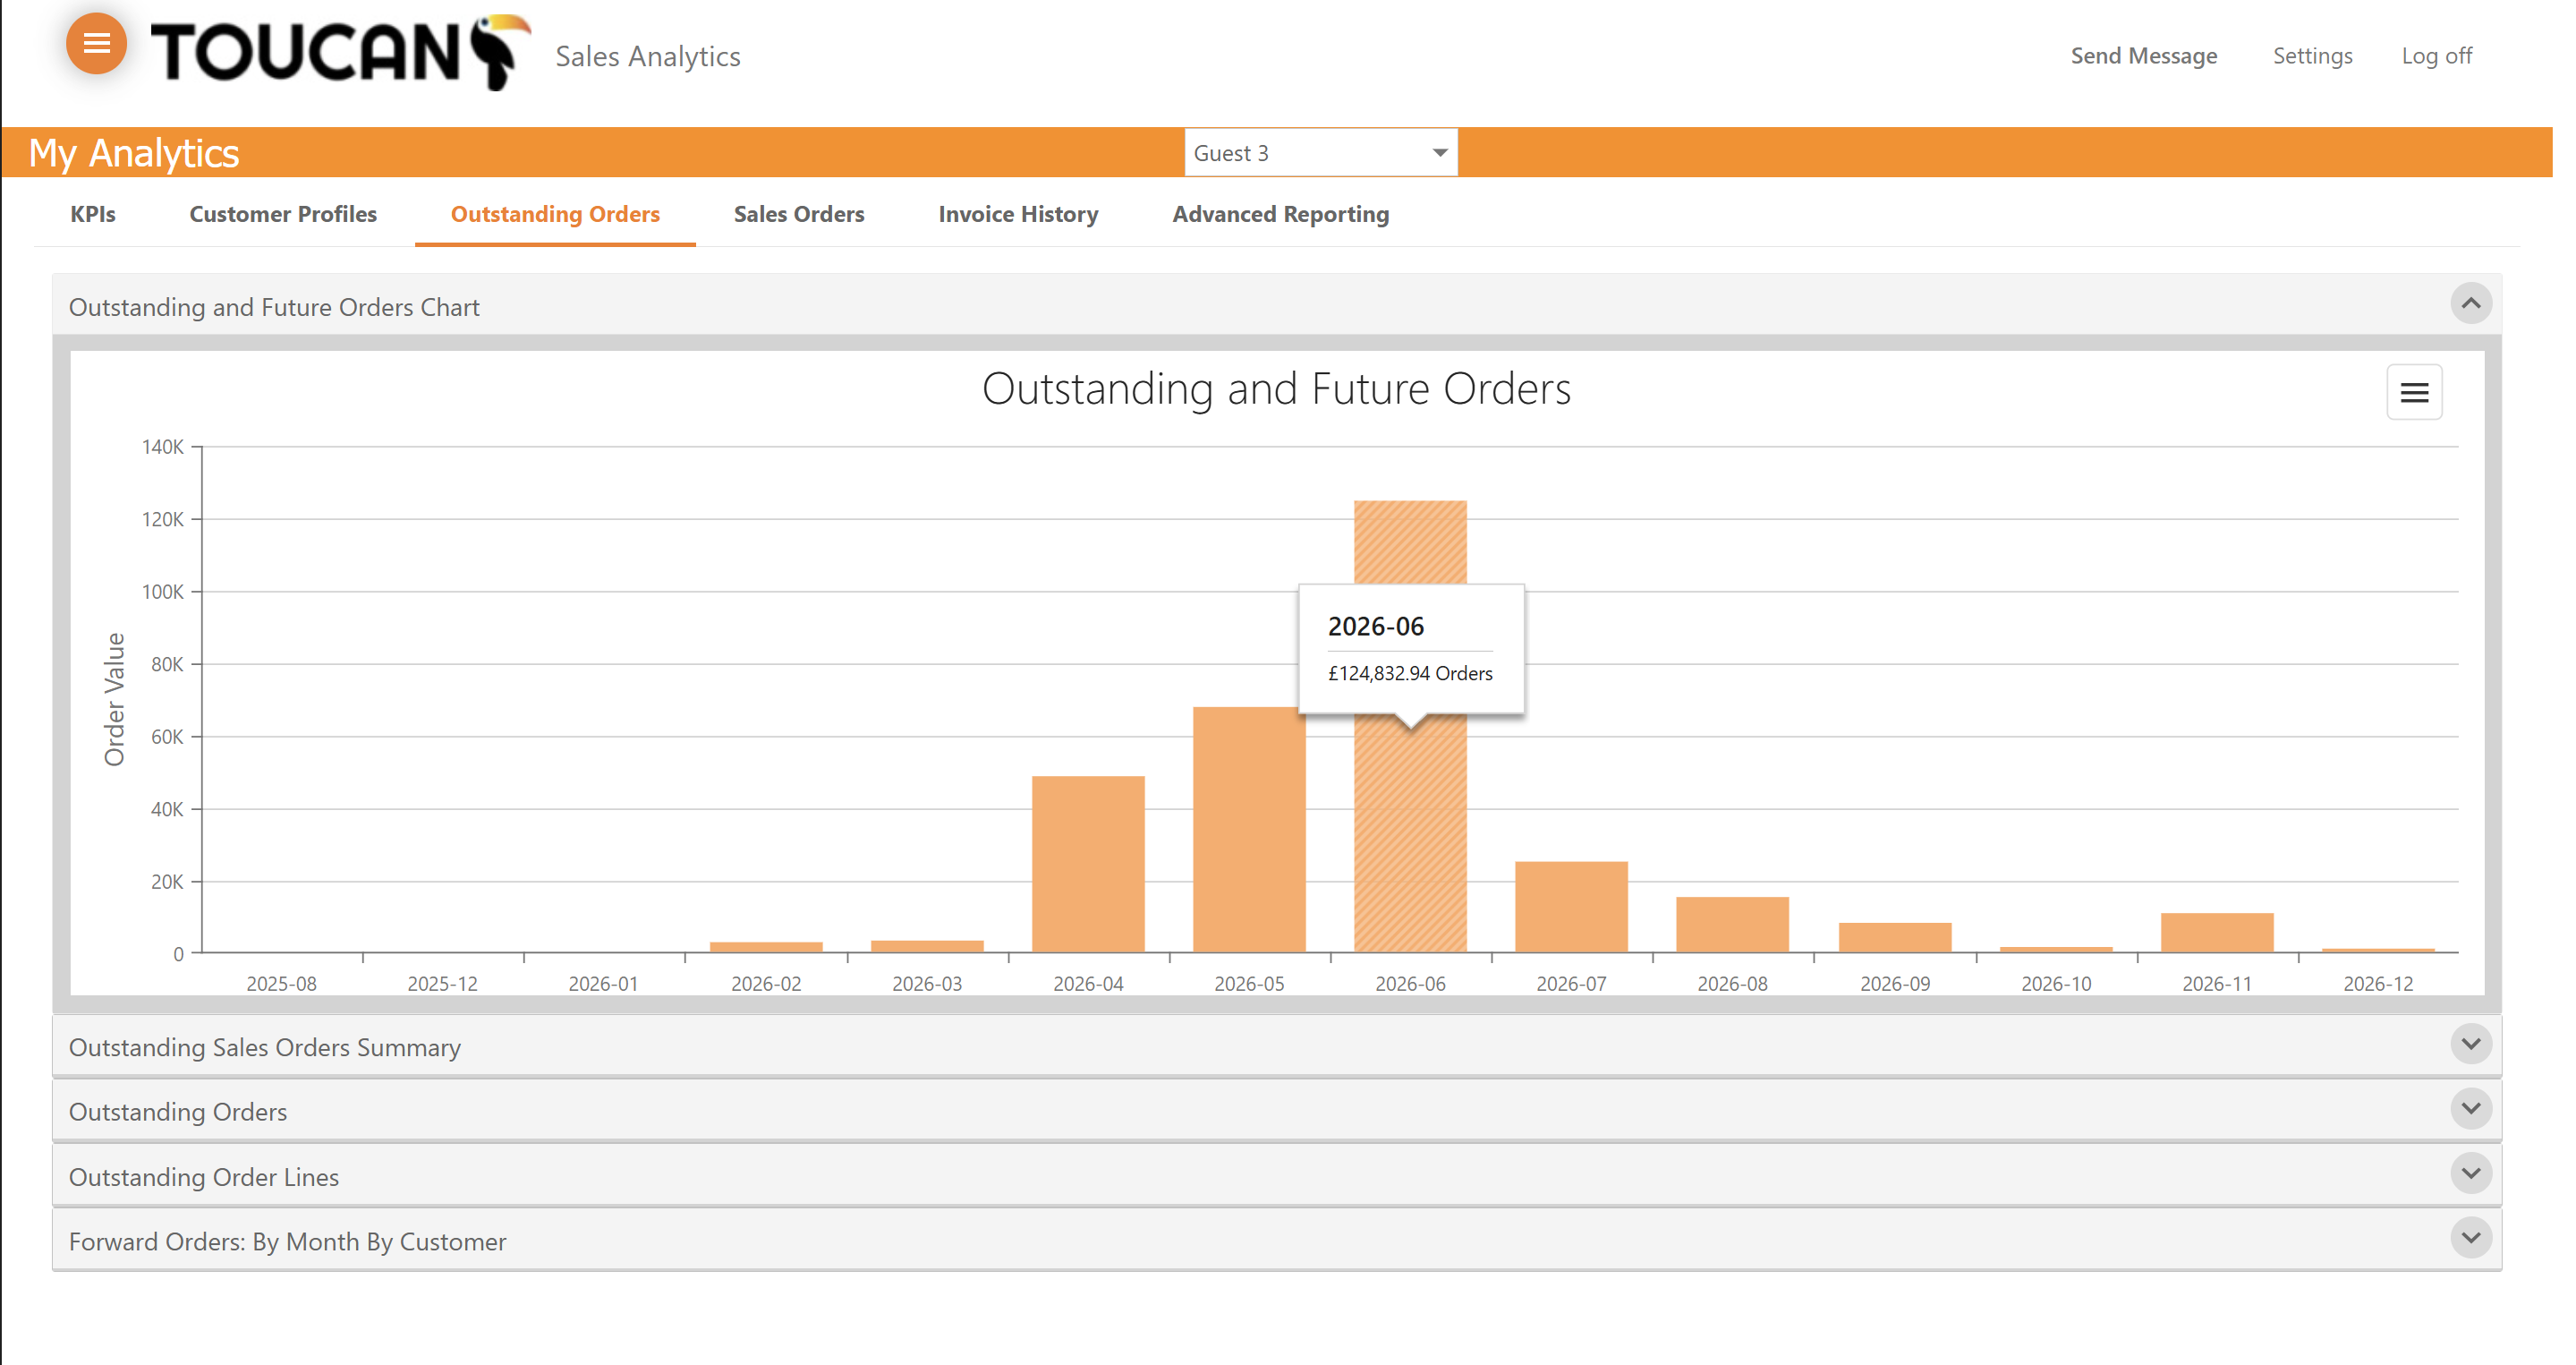
Tracking Outstanding and Future Orders
Monitor your pipeline by reviewing orders that have not yet been fulfilled to identify who you need to speak with and which customer requires an order update.
Managing Sales Orders and Invoices
Locate specific transactions, filter by customer, and sort through your historical invoice data.

Sourcing Historical Customer Invoices
If a customer or colleague has requested data on a specific recent sales invoice, you can source it within the Invoice History tab.
Advanced Reporting and Pivot Grids
For complex, multi-dimensional analysis, navigate to the Advanced Reporting tools.
Questions and Answers
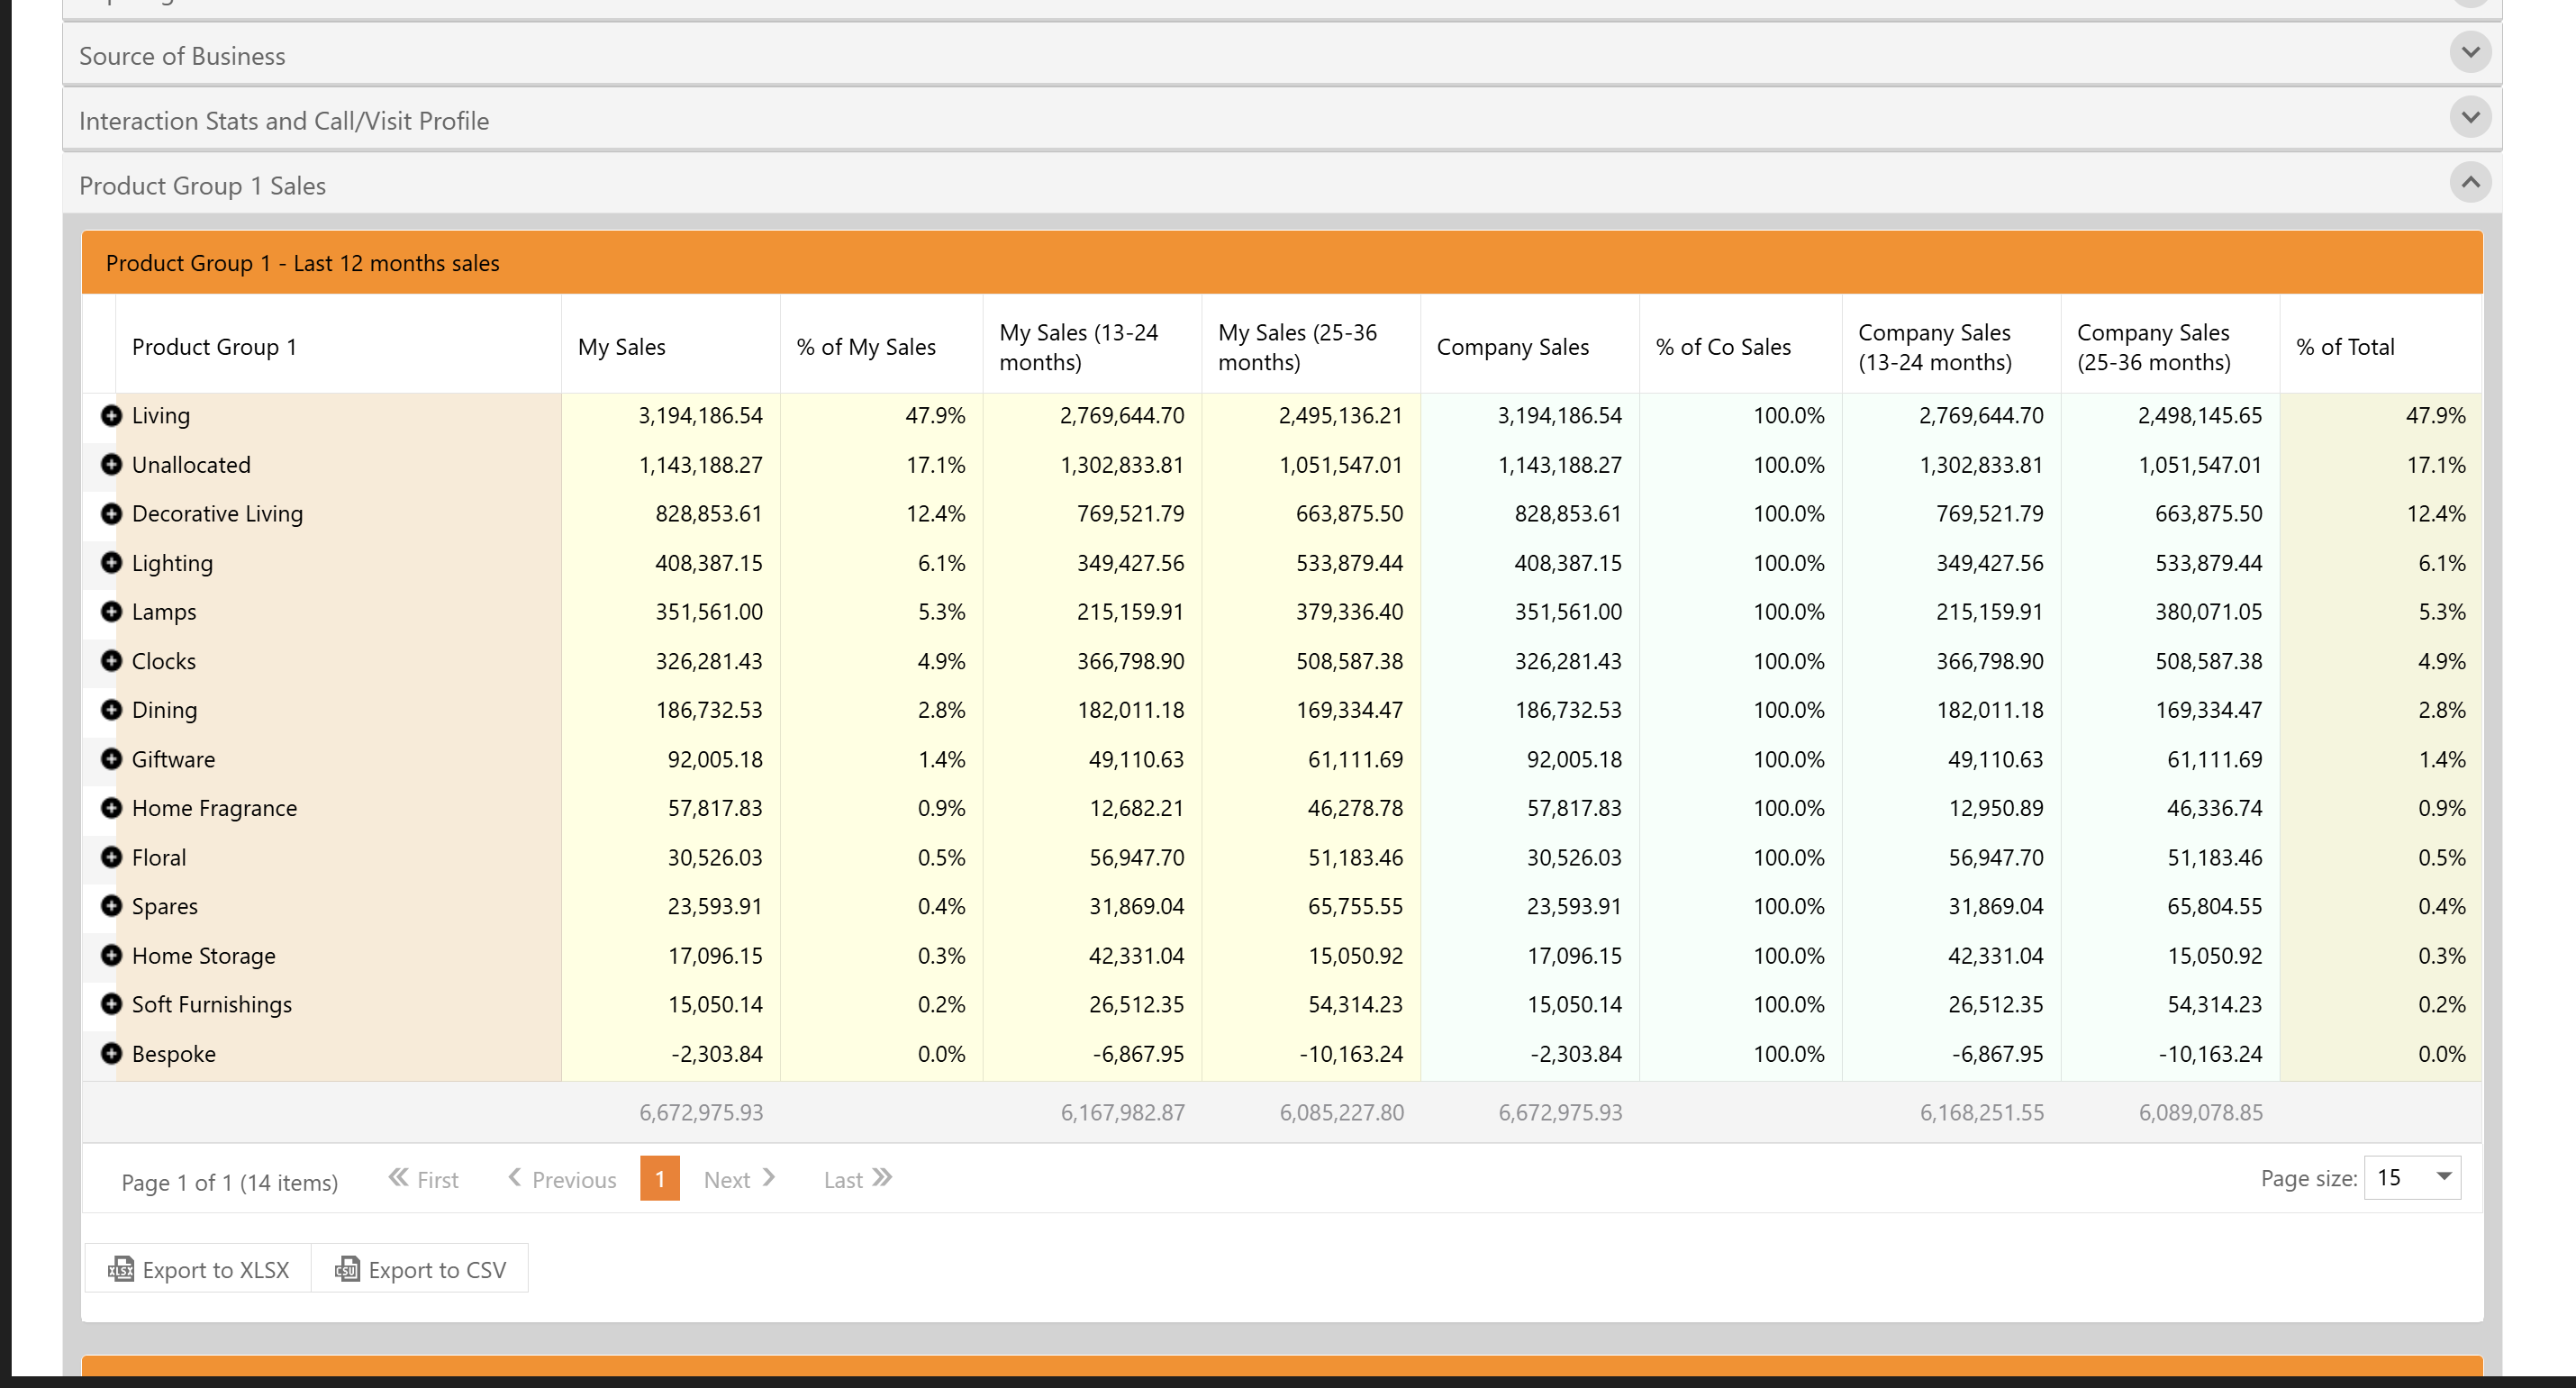
Q: How do I export tabular data from the dashboard?
A: You can export data tables by clicking either the Export to XLSX or Export to CSV buttons located at the bottom left of the respective data grids.
Term | Definition |
|---|---|
KPI | Key Performance Indicator, a quantifiable measure used to evaluate the success of an organisation or activity. |
CSV | Comma-Separated Values, a common plain-text file format used for exporting and storing tabular data. |
XLSX | The default file format for Microsoft Excel spreadsheets, used to export and analyse tabular data. |
Pivot Grid | An interactive data table that allows users to reorganise, group, and summarise complex datasets. |