How to View and Export Detailed Reports in Your Rental Dashboard

Learn how to access, filter, and export detailed reports including sales, orders, refunds, customer performance, stock levels, and more from your dashboard. Step-by-step instructions for generating and exporting reports to CSV or Excel.

By Reservety

In this guide, we'll learn how to view and analyze different types of reports in your system.

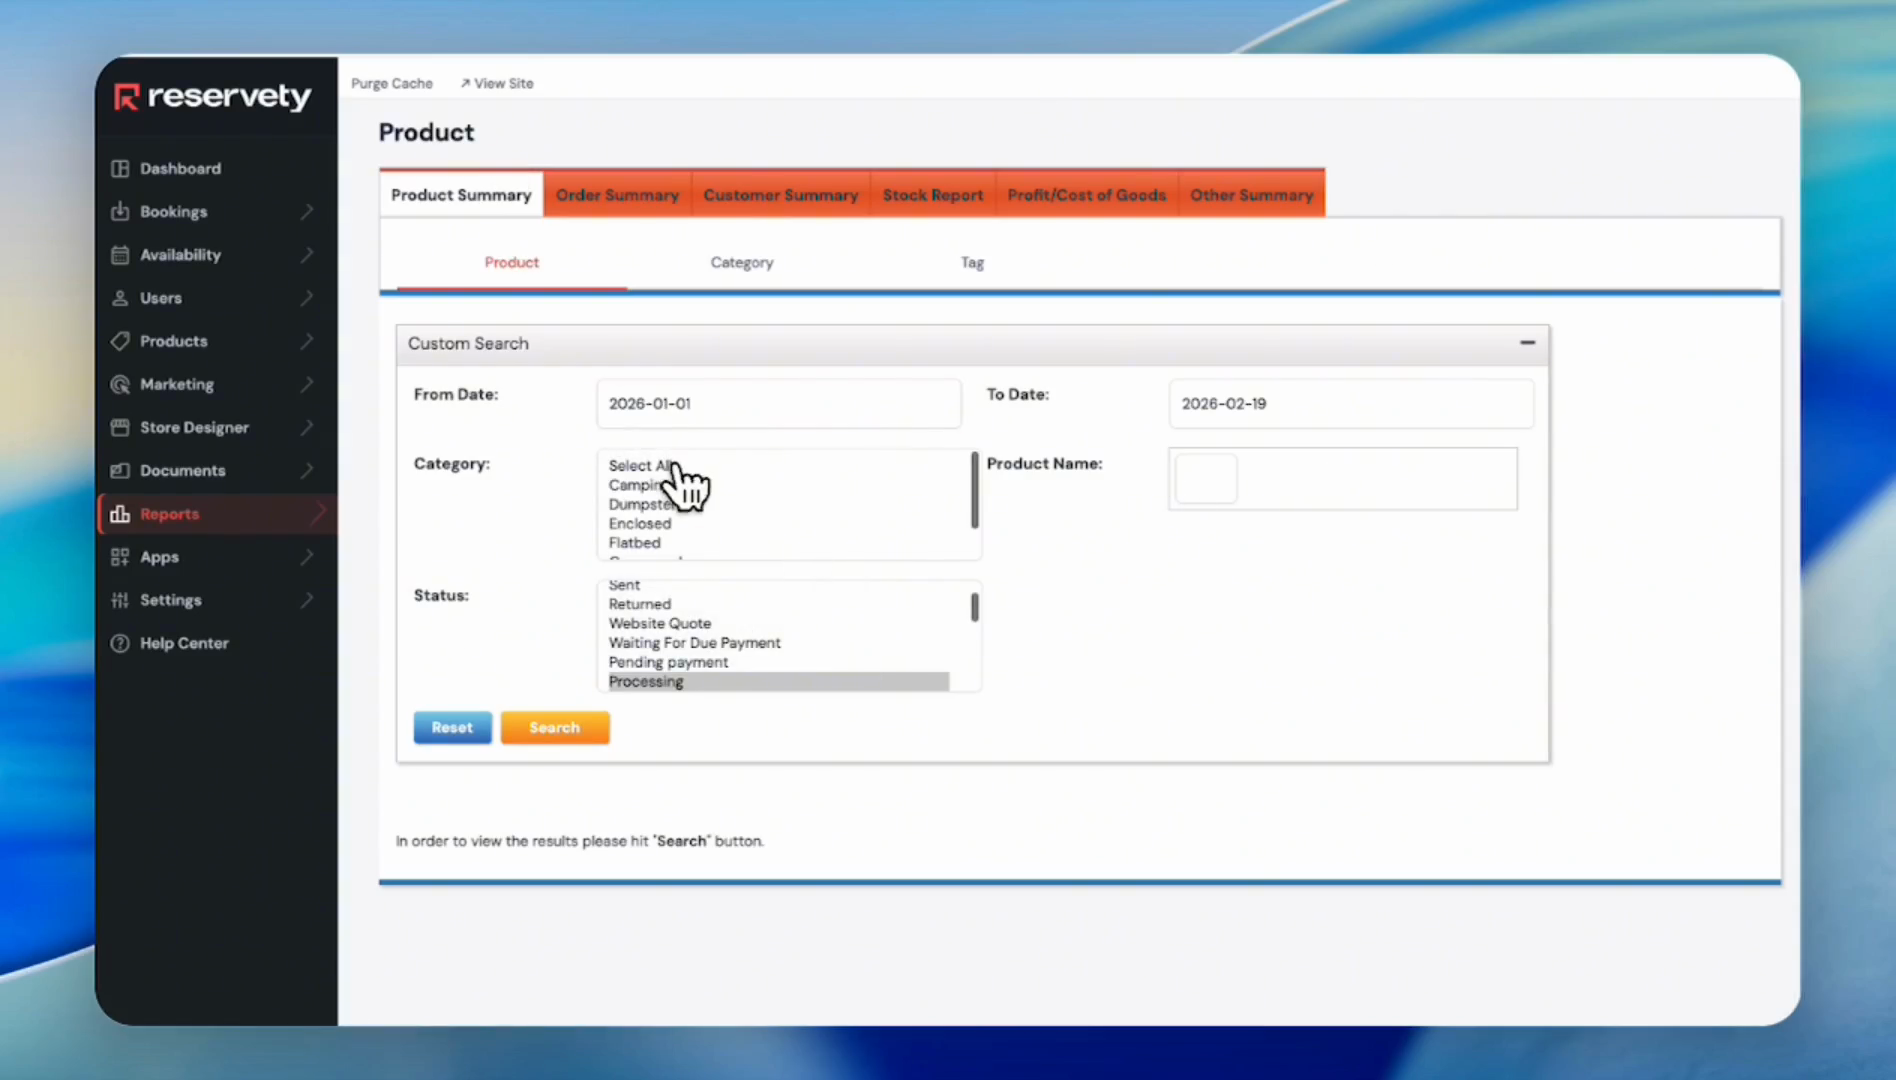
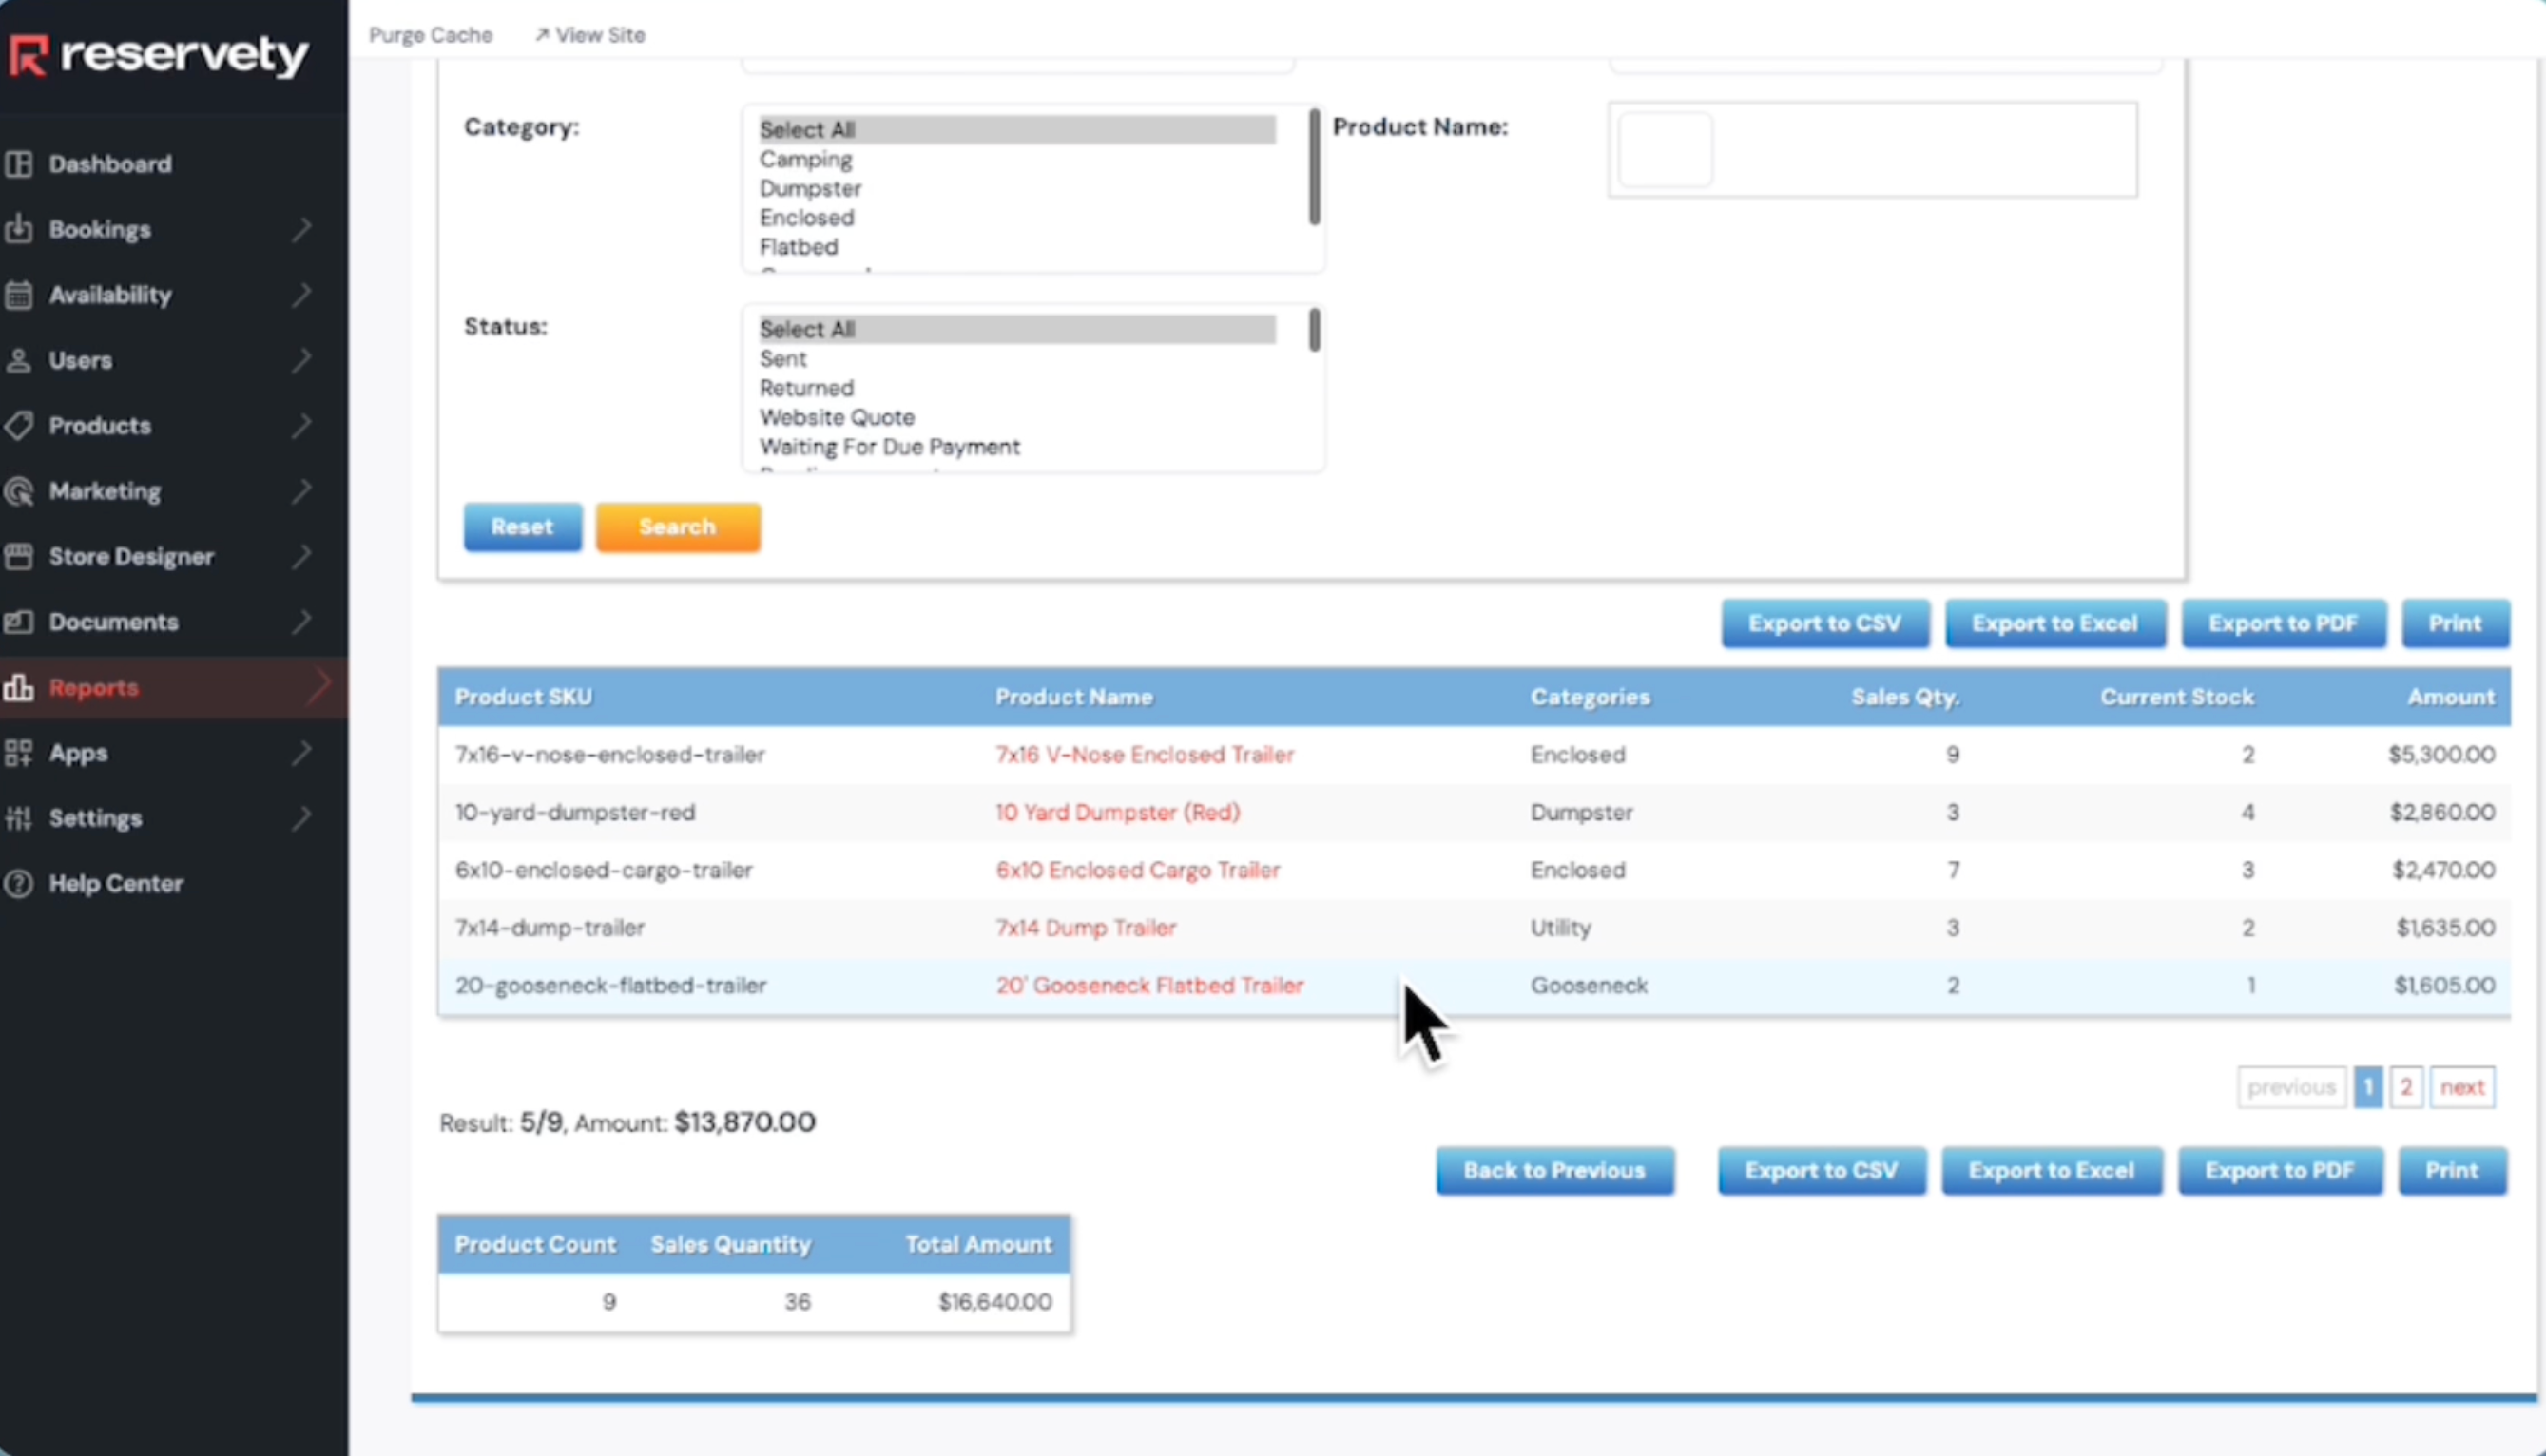
You will see how to access detailed product, order, sales, refund, customer, and stock reports, as well as how to filter data by date, category, and status.

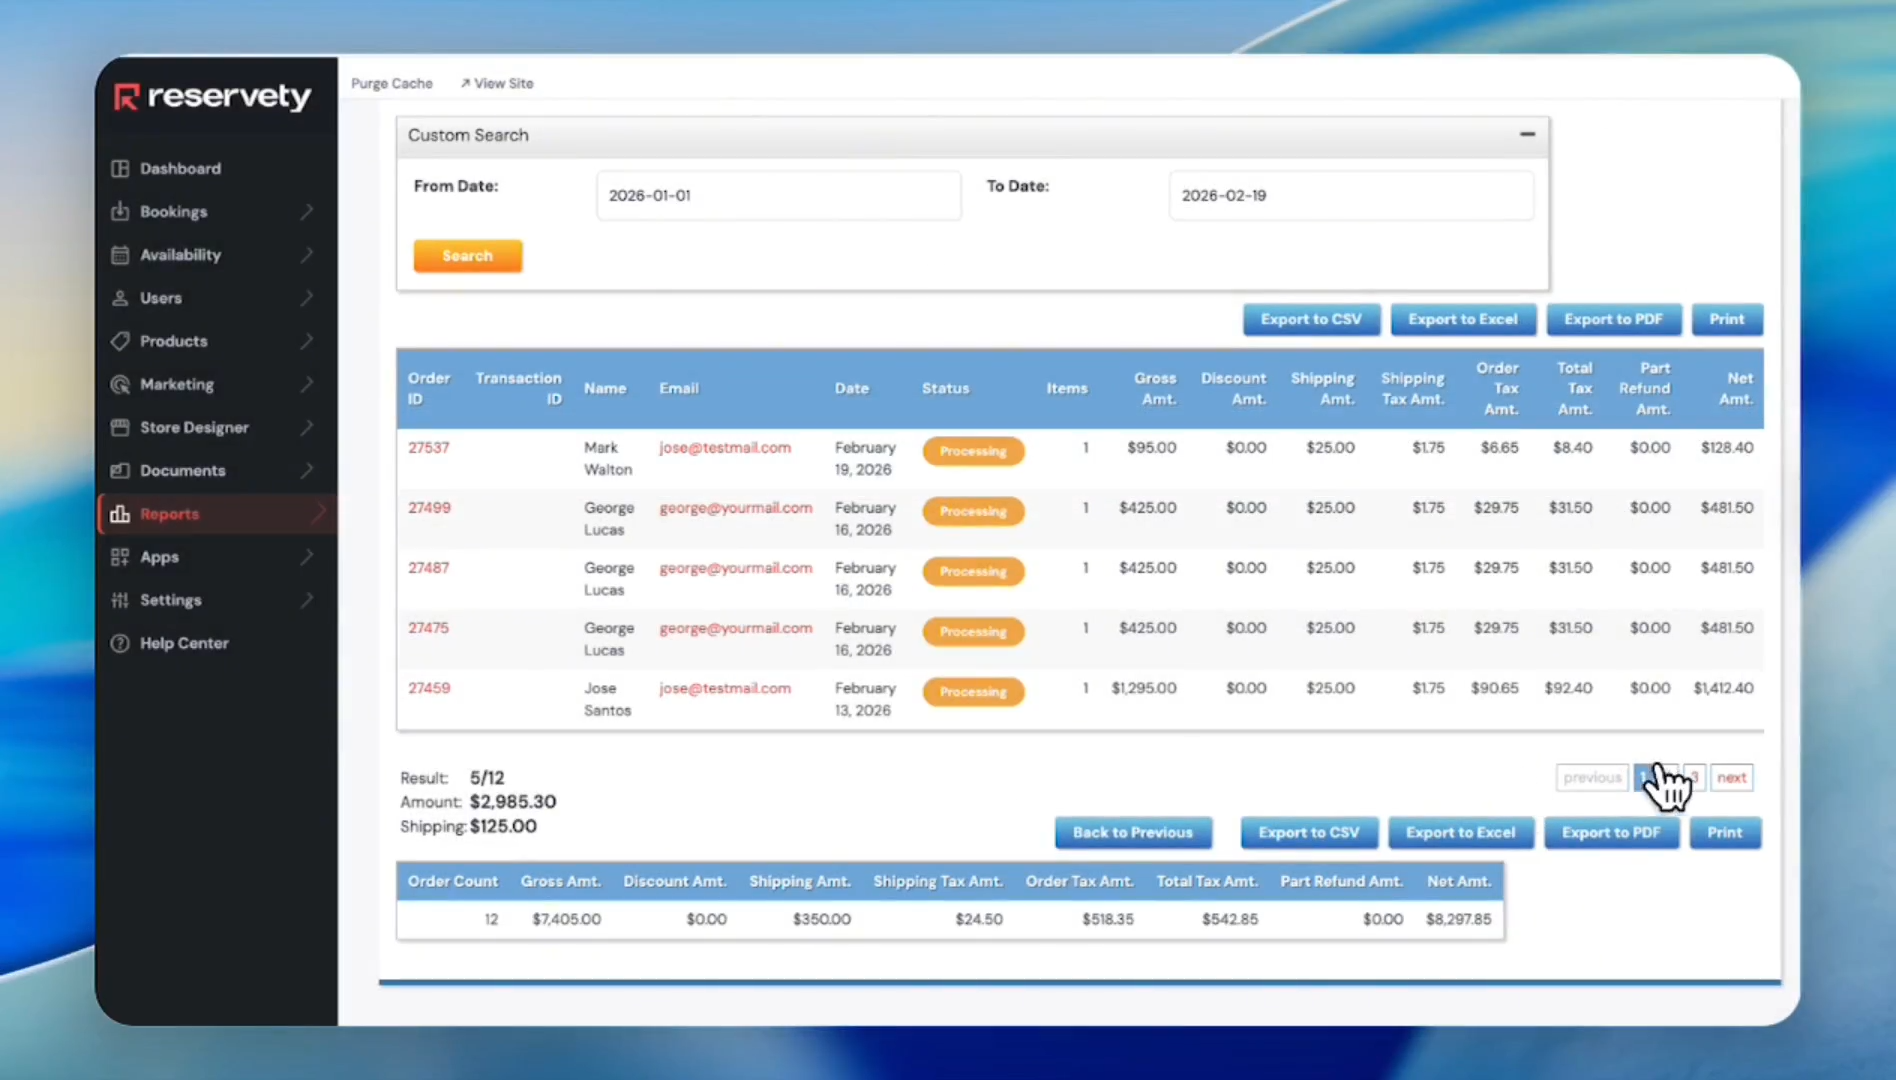
We will also cover how to export reports and find specific information, such as refunds or low stock items.

Let's get started

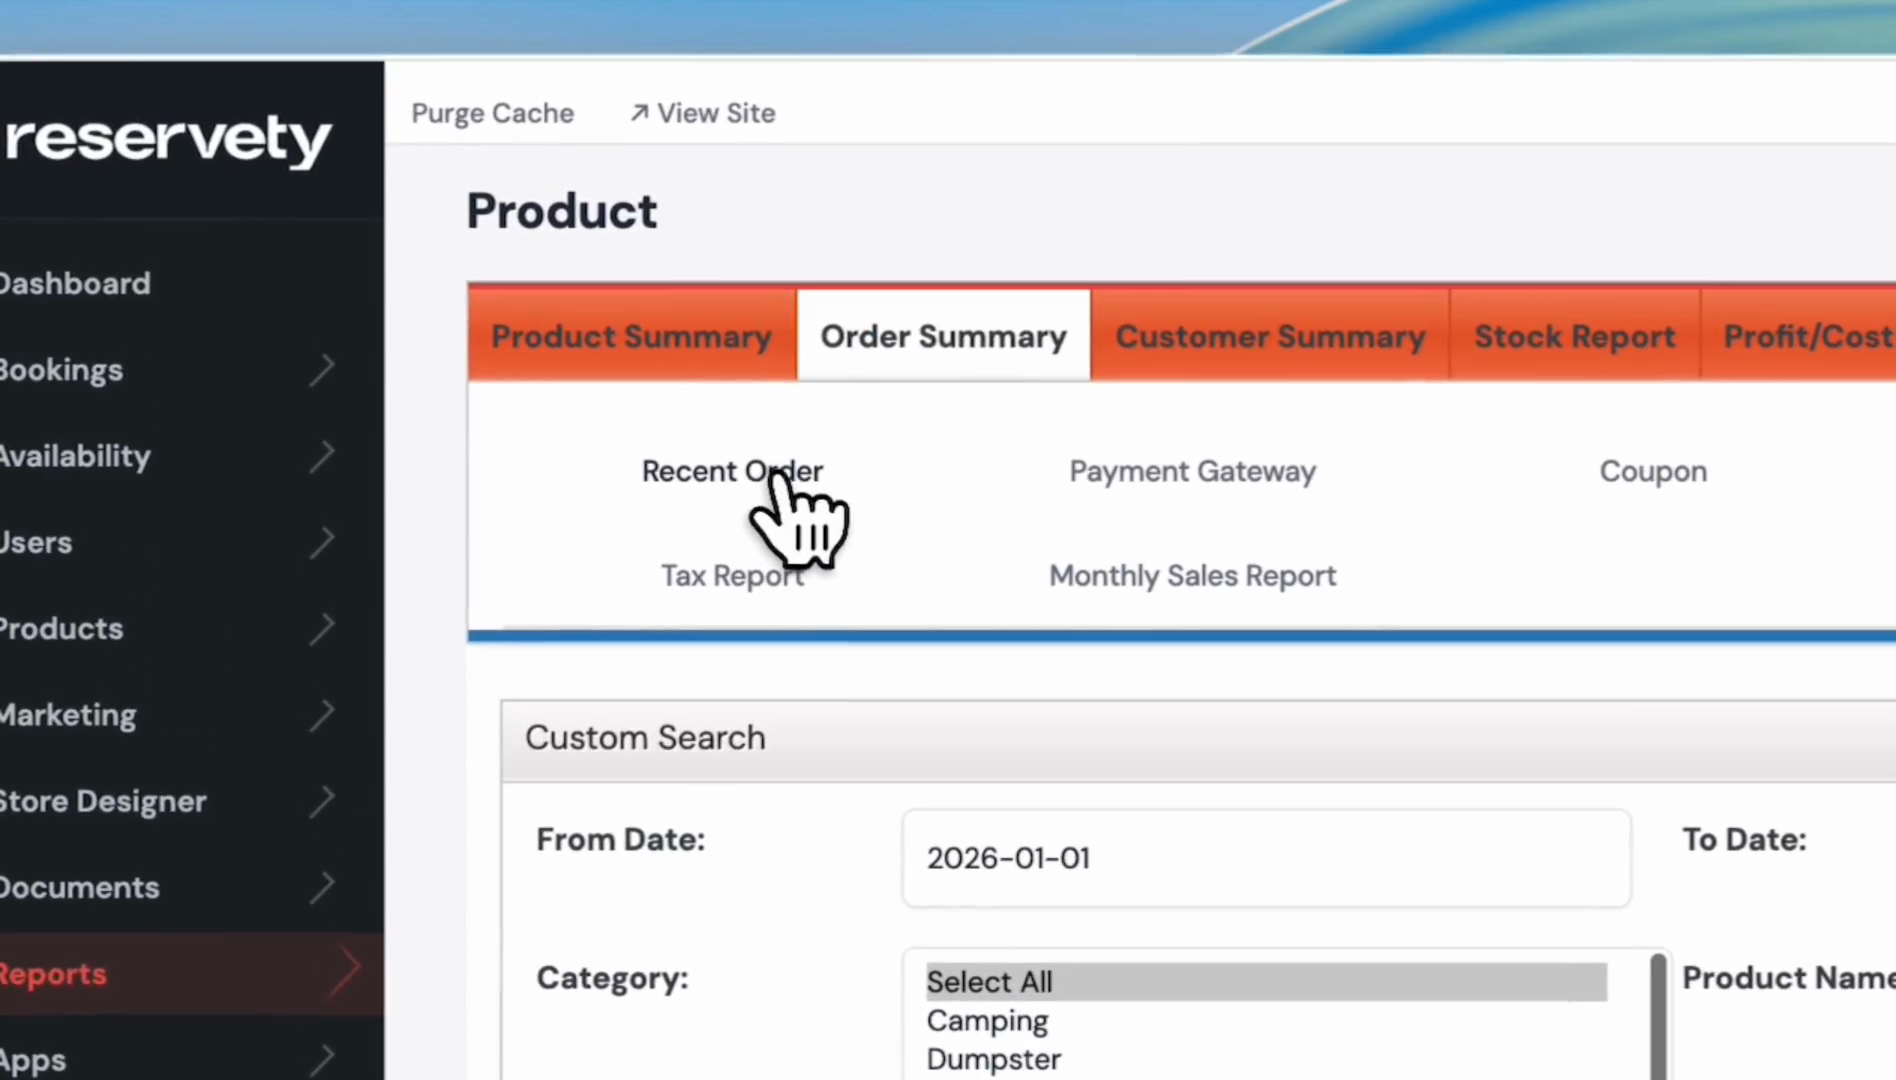
To view the reports with complete details, click Reports and select All Details.

1
Click Reports on the left sidebar.
Step #1: Click Reports on the left sidebar.
2
Click All Details.
Step #2: Click All Details.
3
If you want to generate a general report on rental products, click on the Product Summary tab, then click the From Date field.
Step #3: If you want to generate a general report on rental products, click on the Product Summary tab, then click the From Date field.
4
Click Select All in the Category dropdown. You can also select a specific category.
Step #4: Click Select All in the Category dropdown. You can also select a specific category.
5
Click Select All in the Status dropdown. You can also select a specific status.
Step #5: Click Select All in the Status dropdown. You can also select a specific status.
6
Click the Search button.
Step #6: Click the Search button.
7
This report displays a product summary and the amounts generated.
Step #7: This report displays a product summary and the amounts generated.

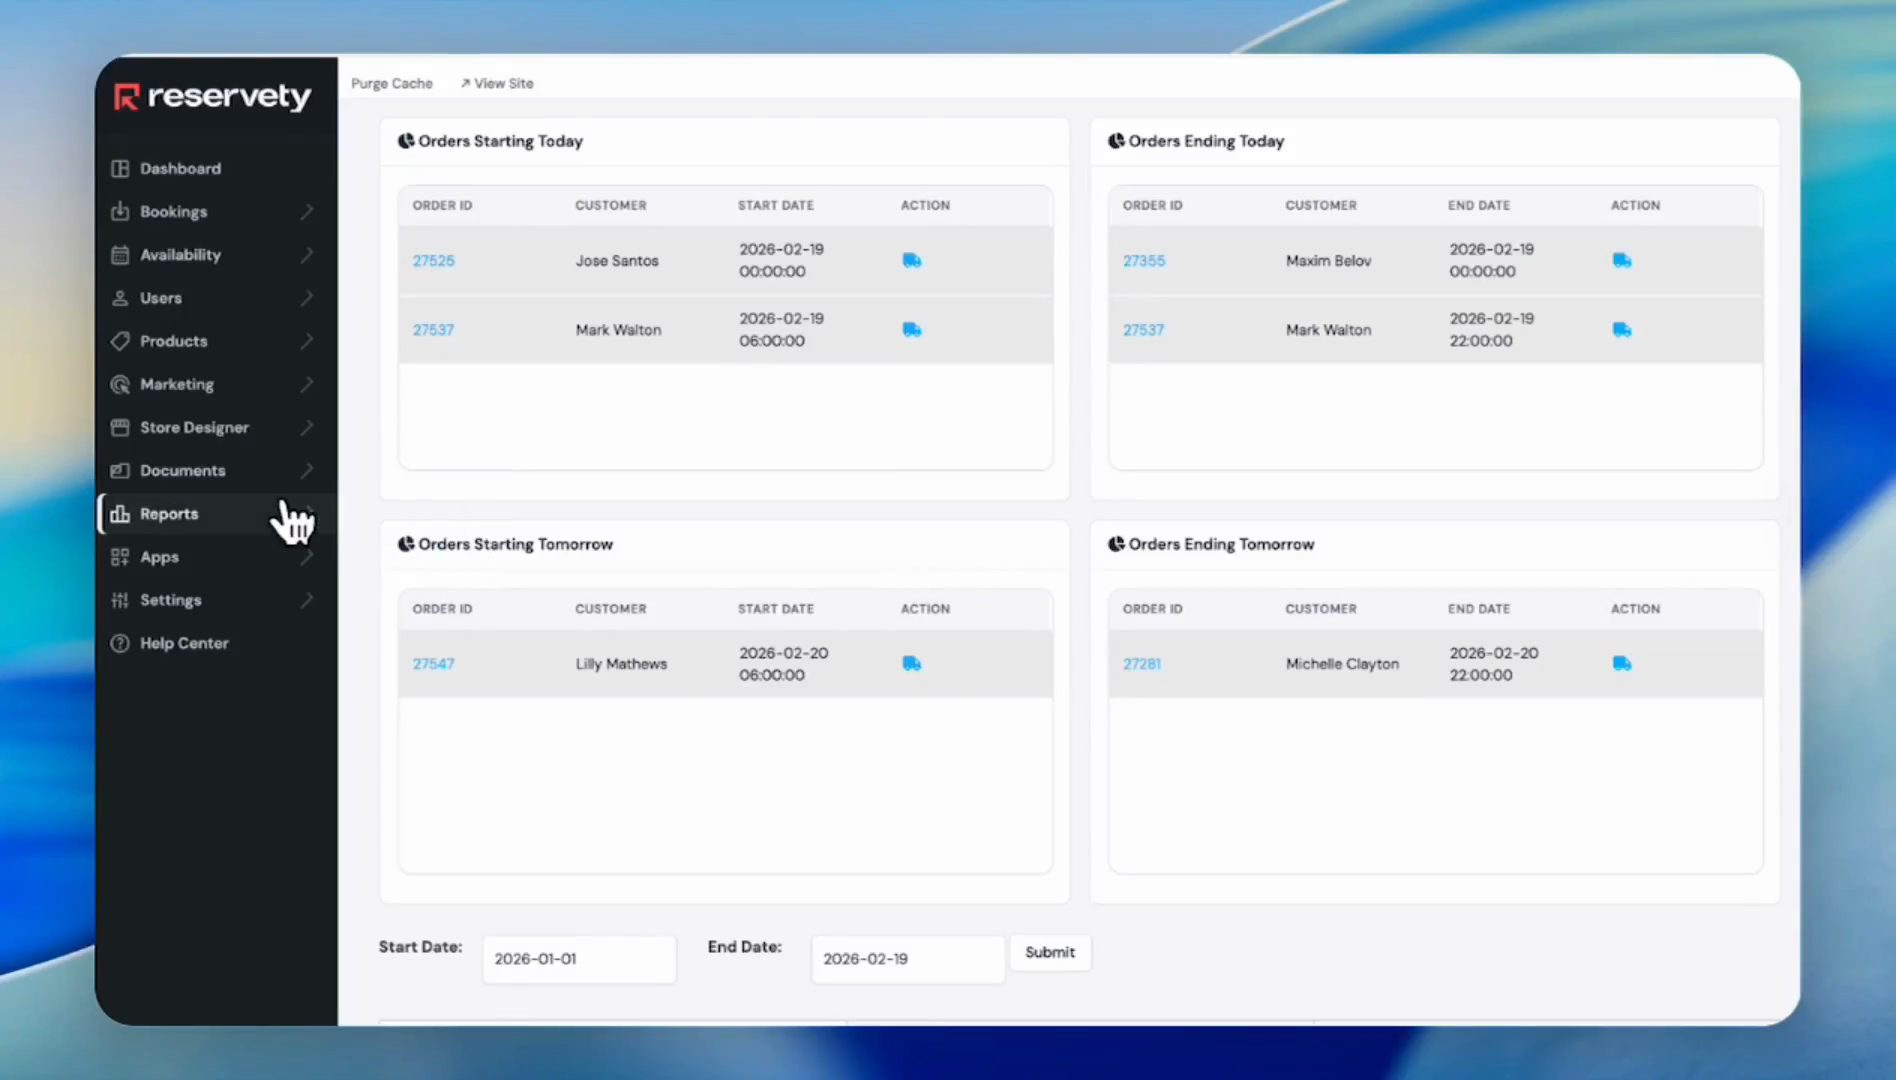
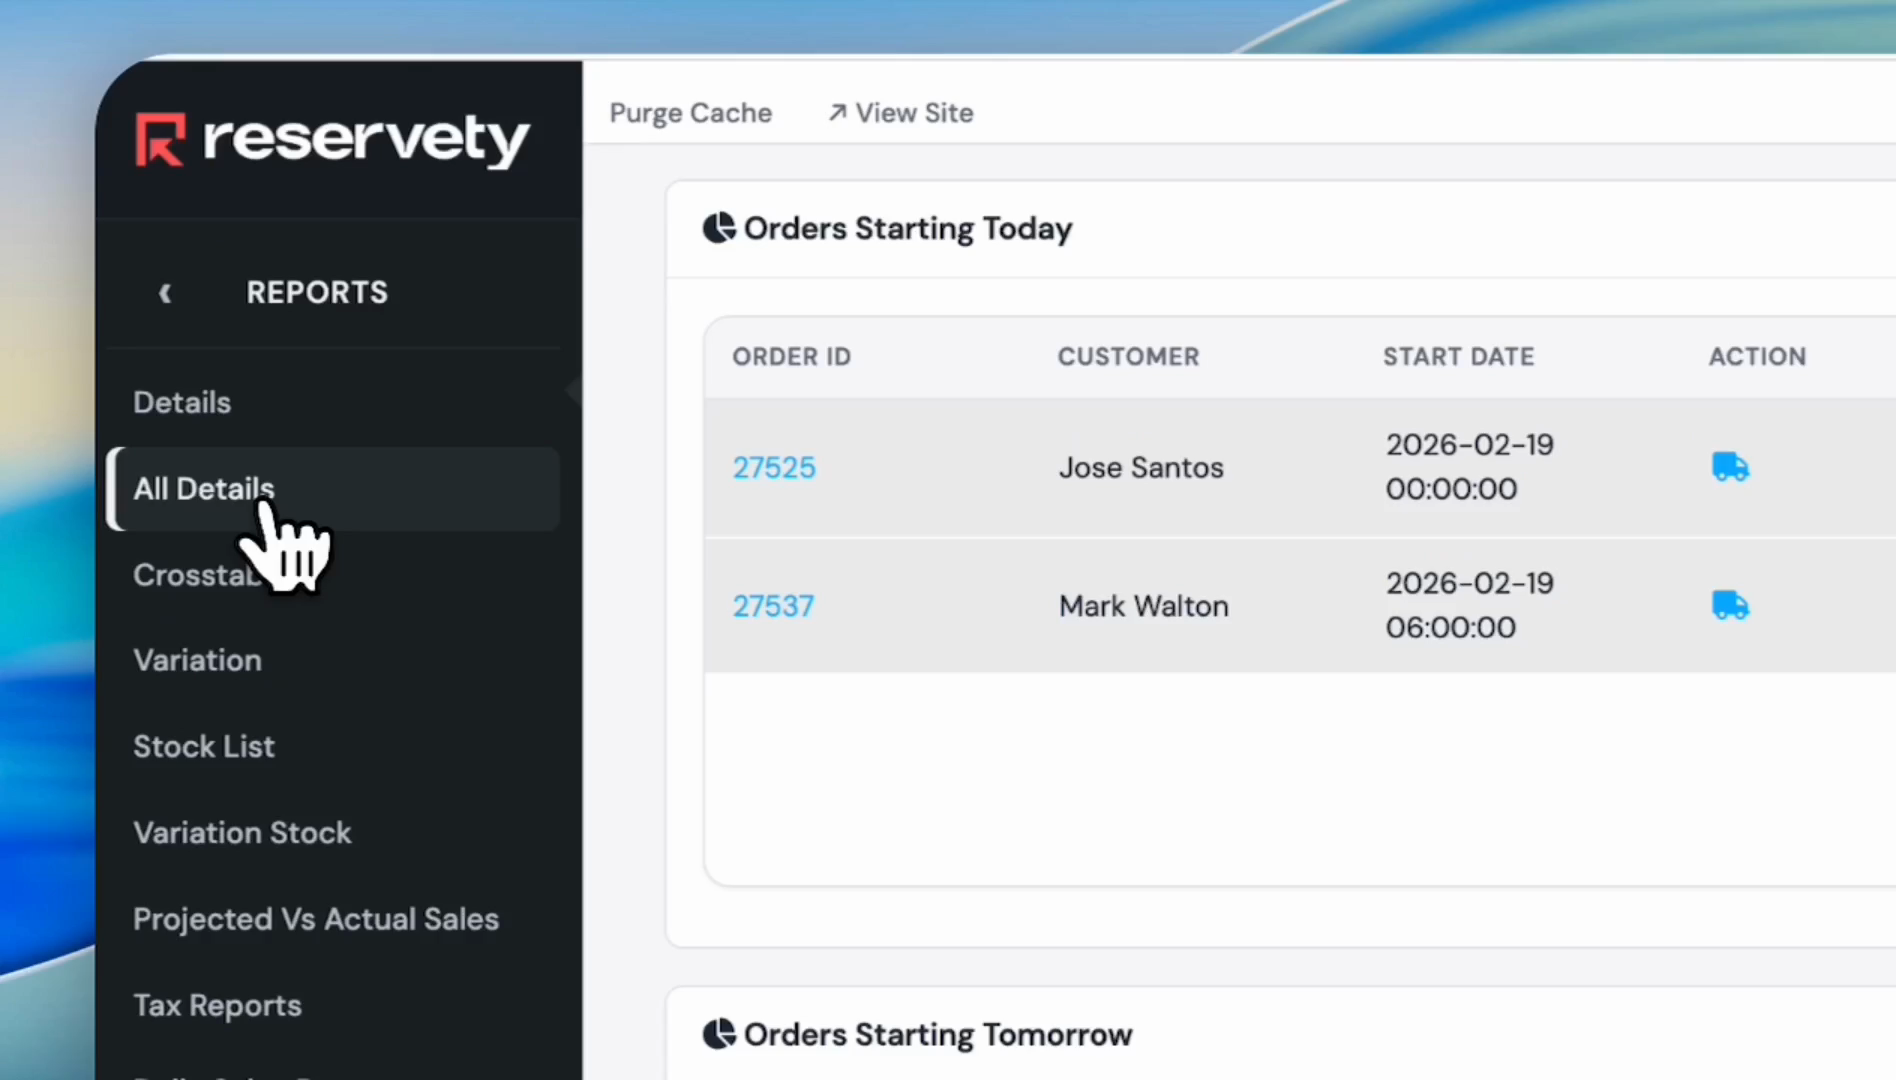
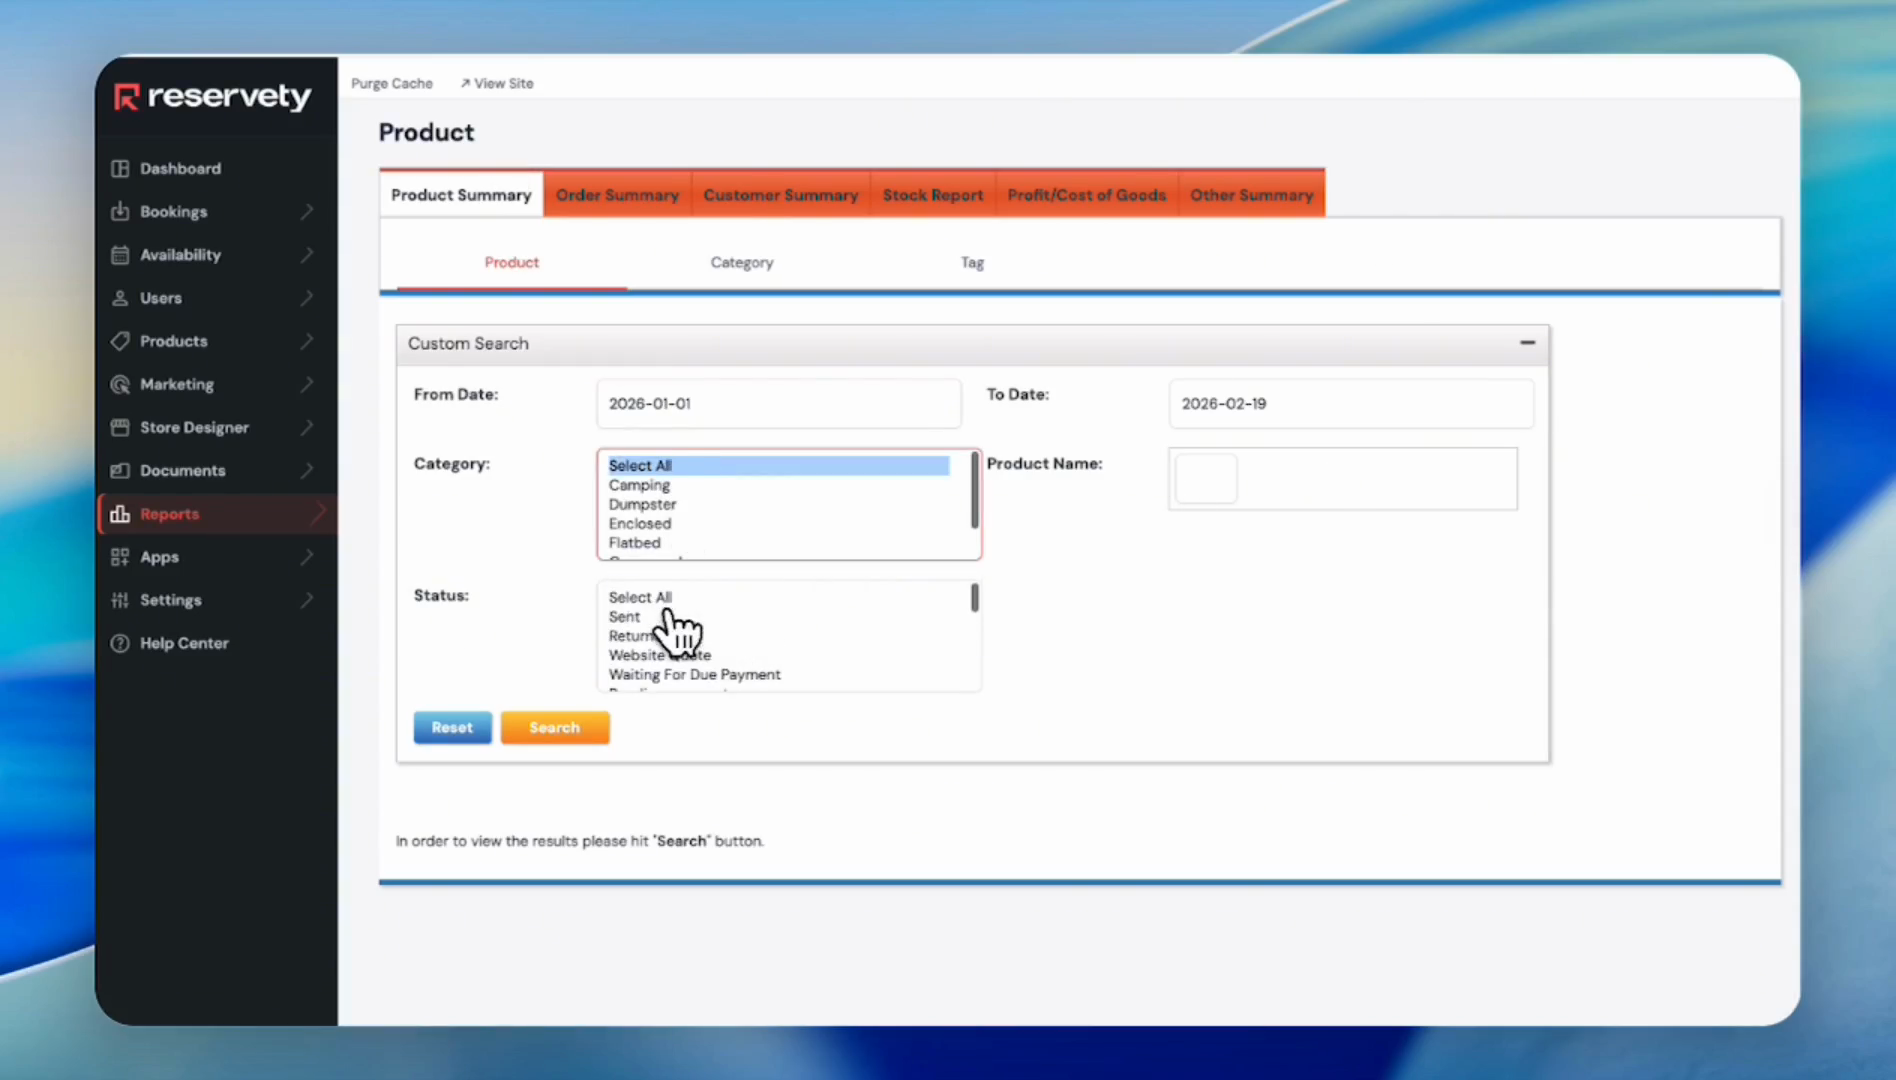
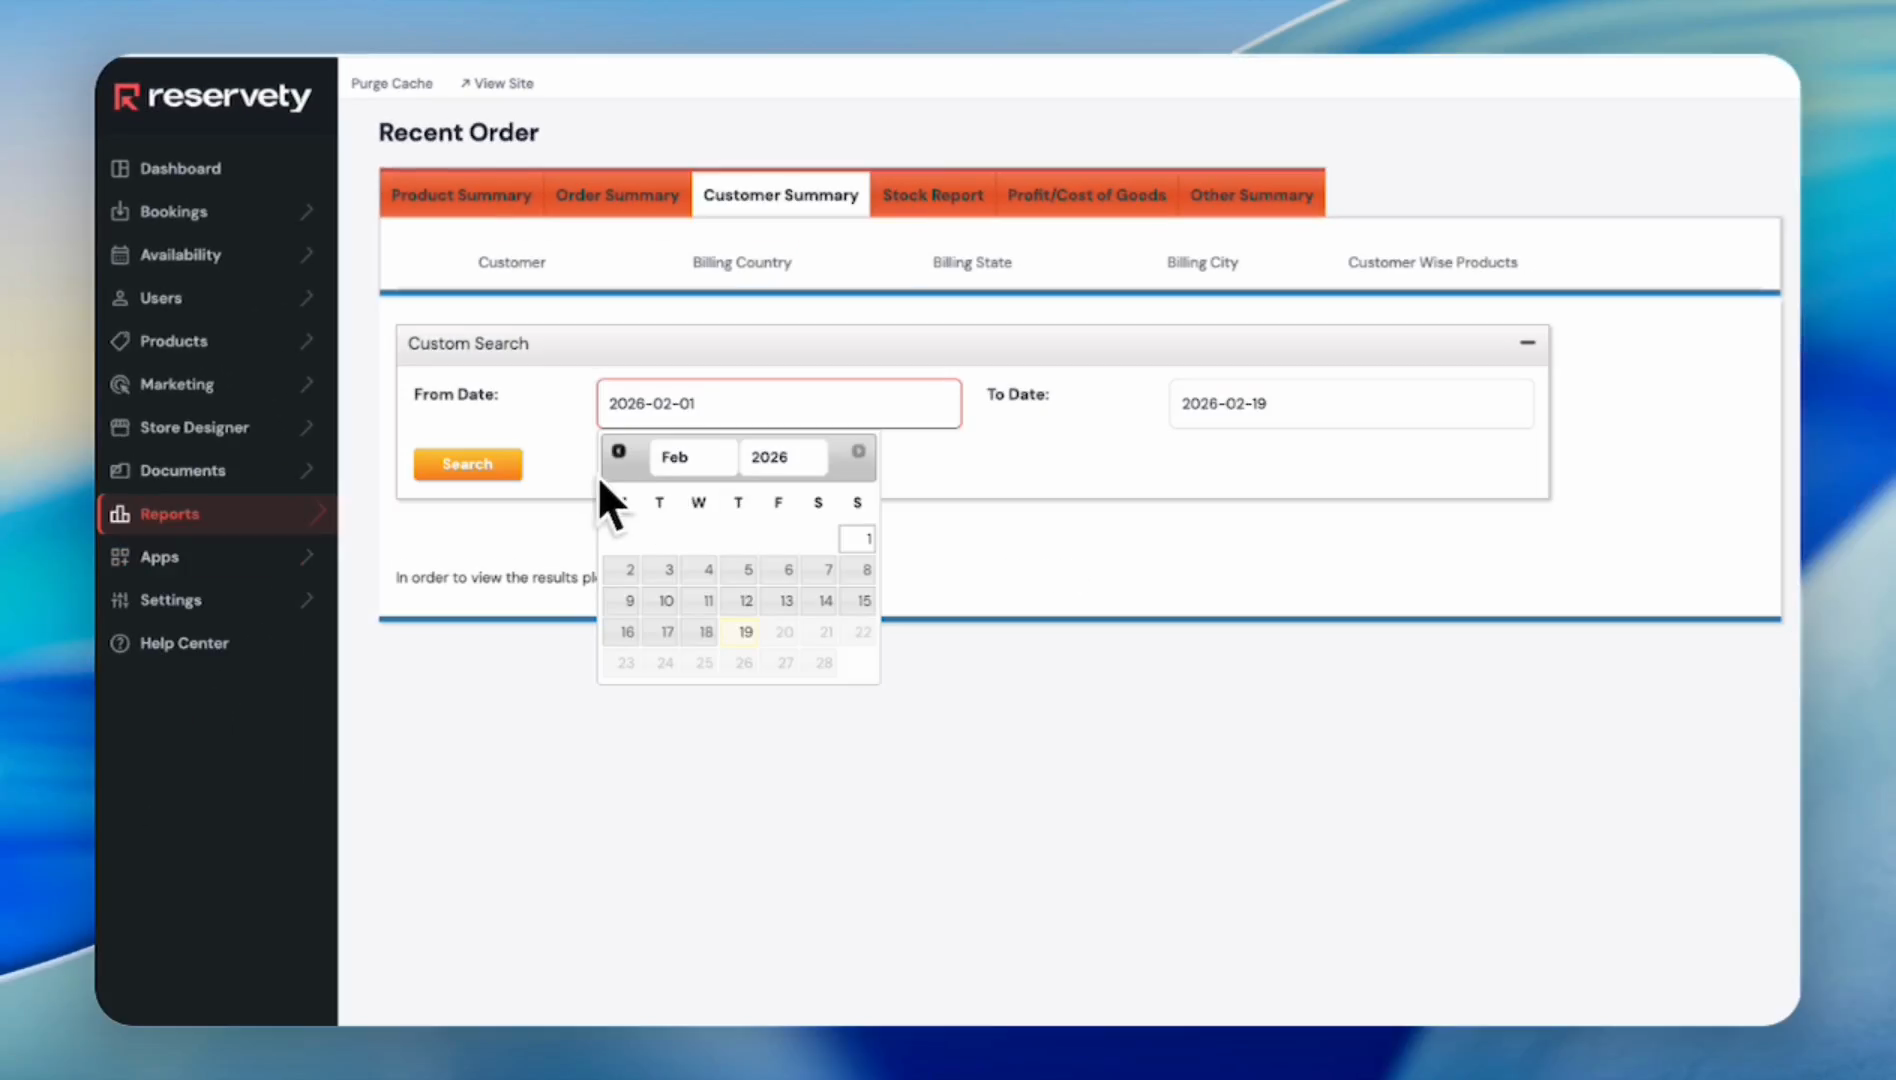
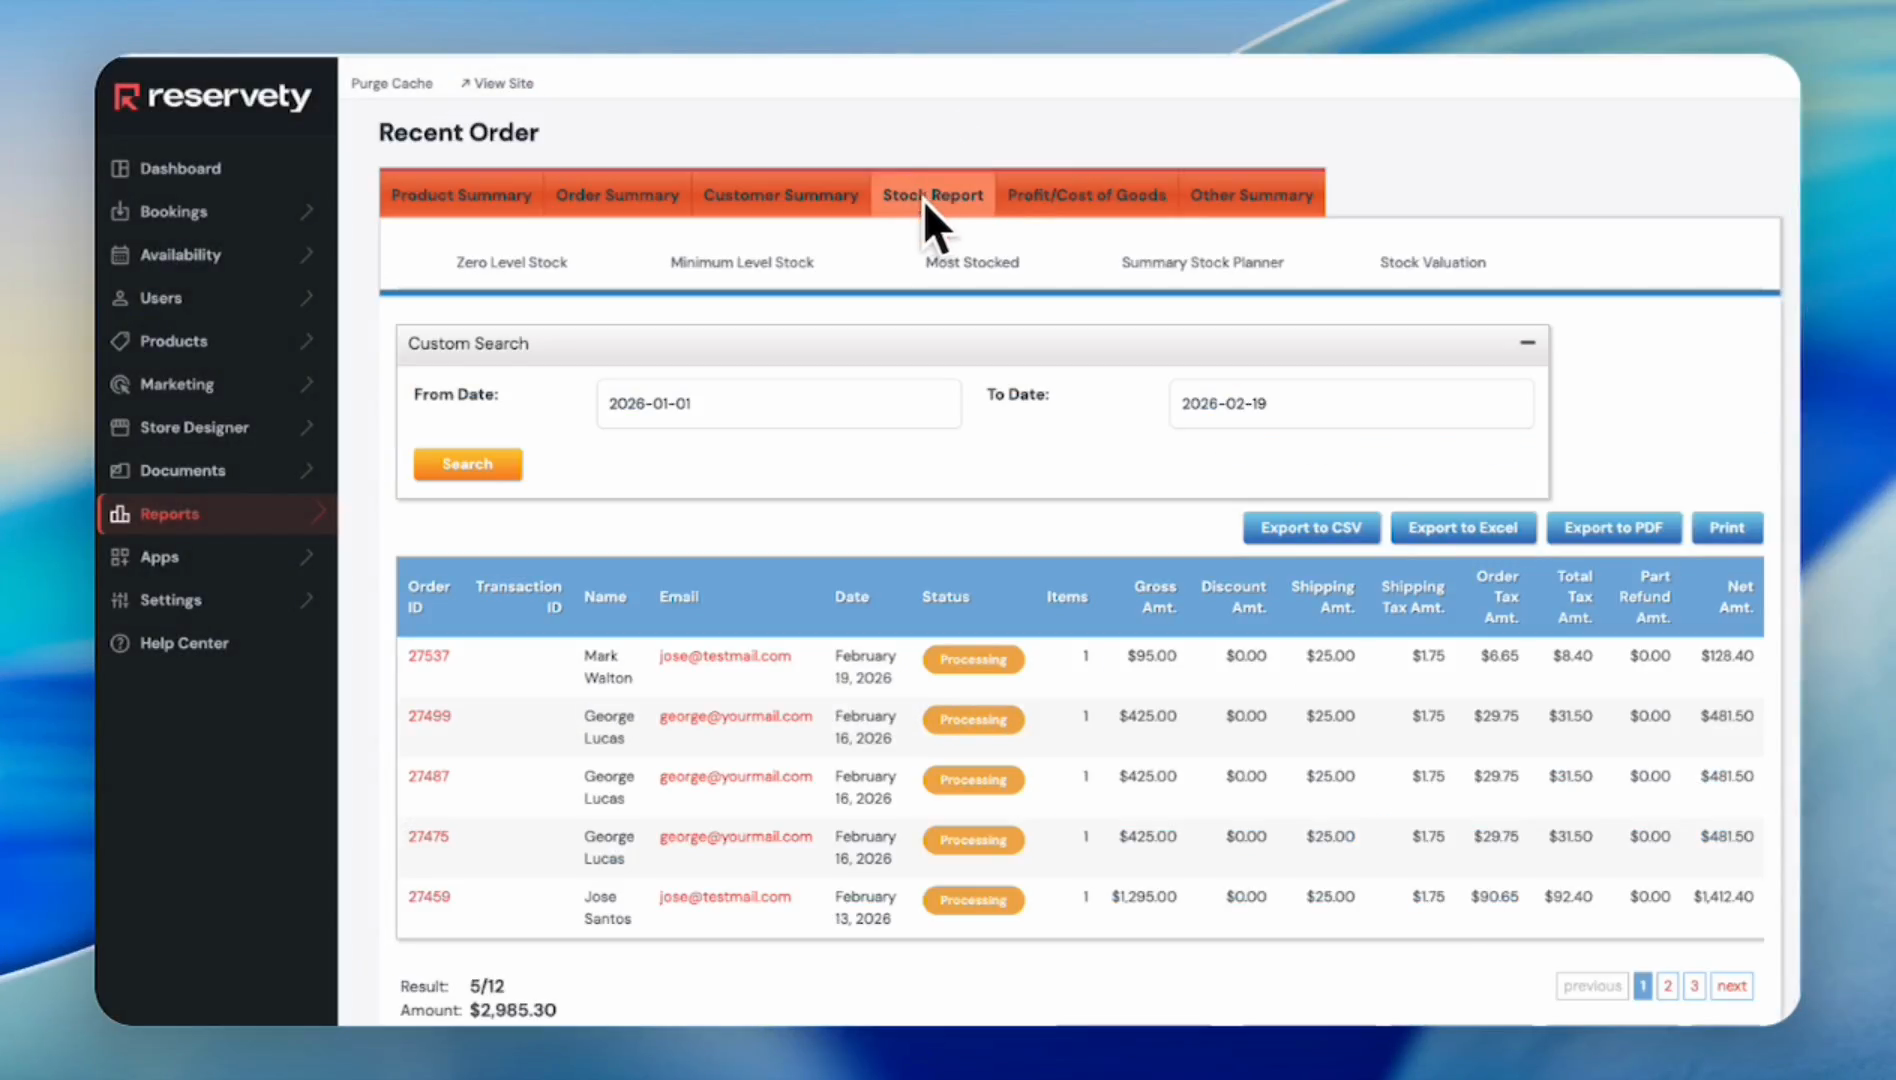
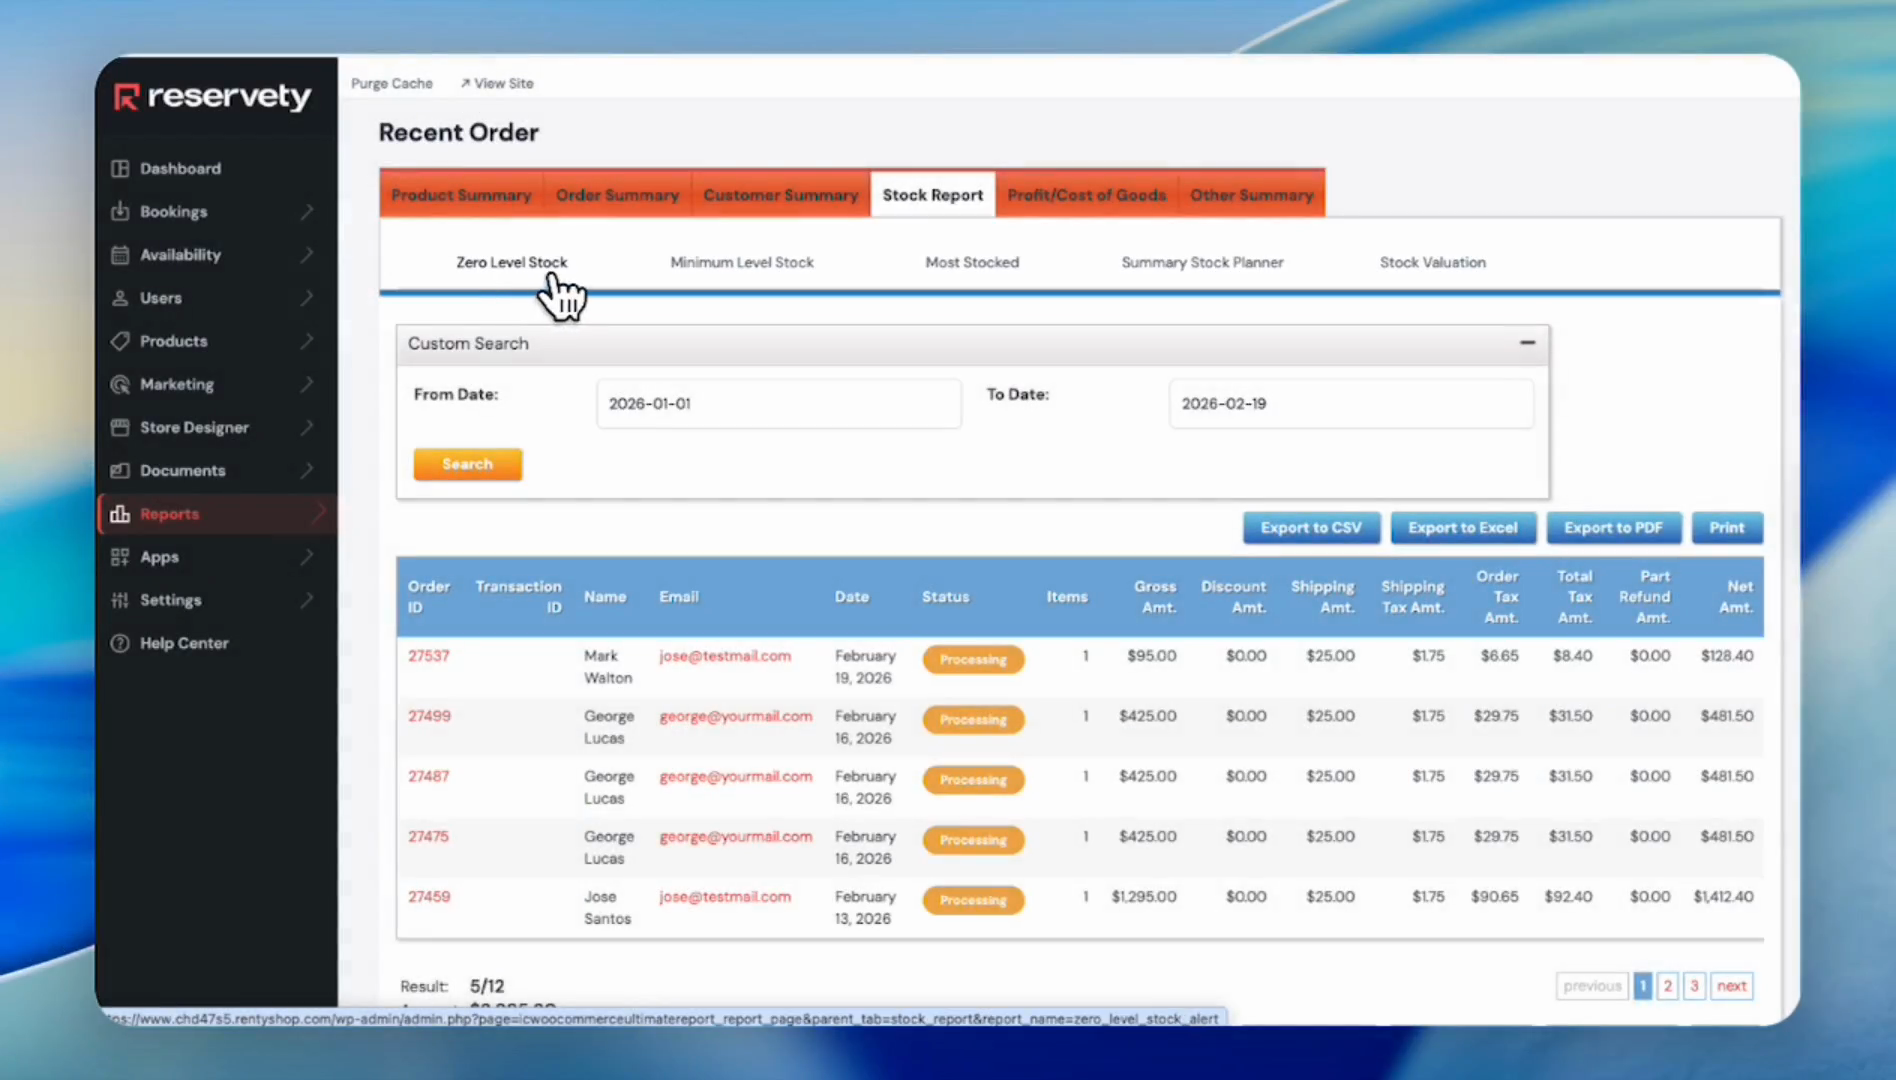
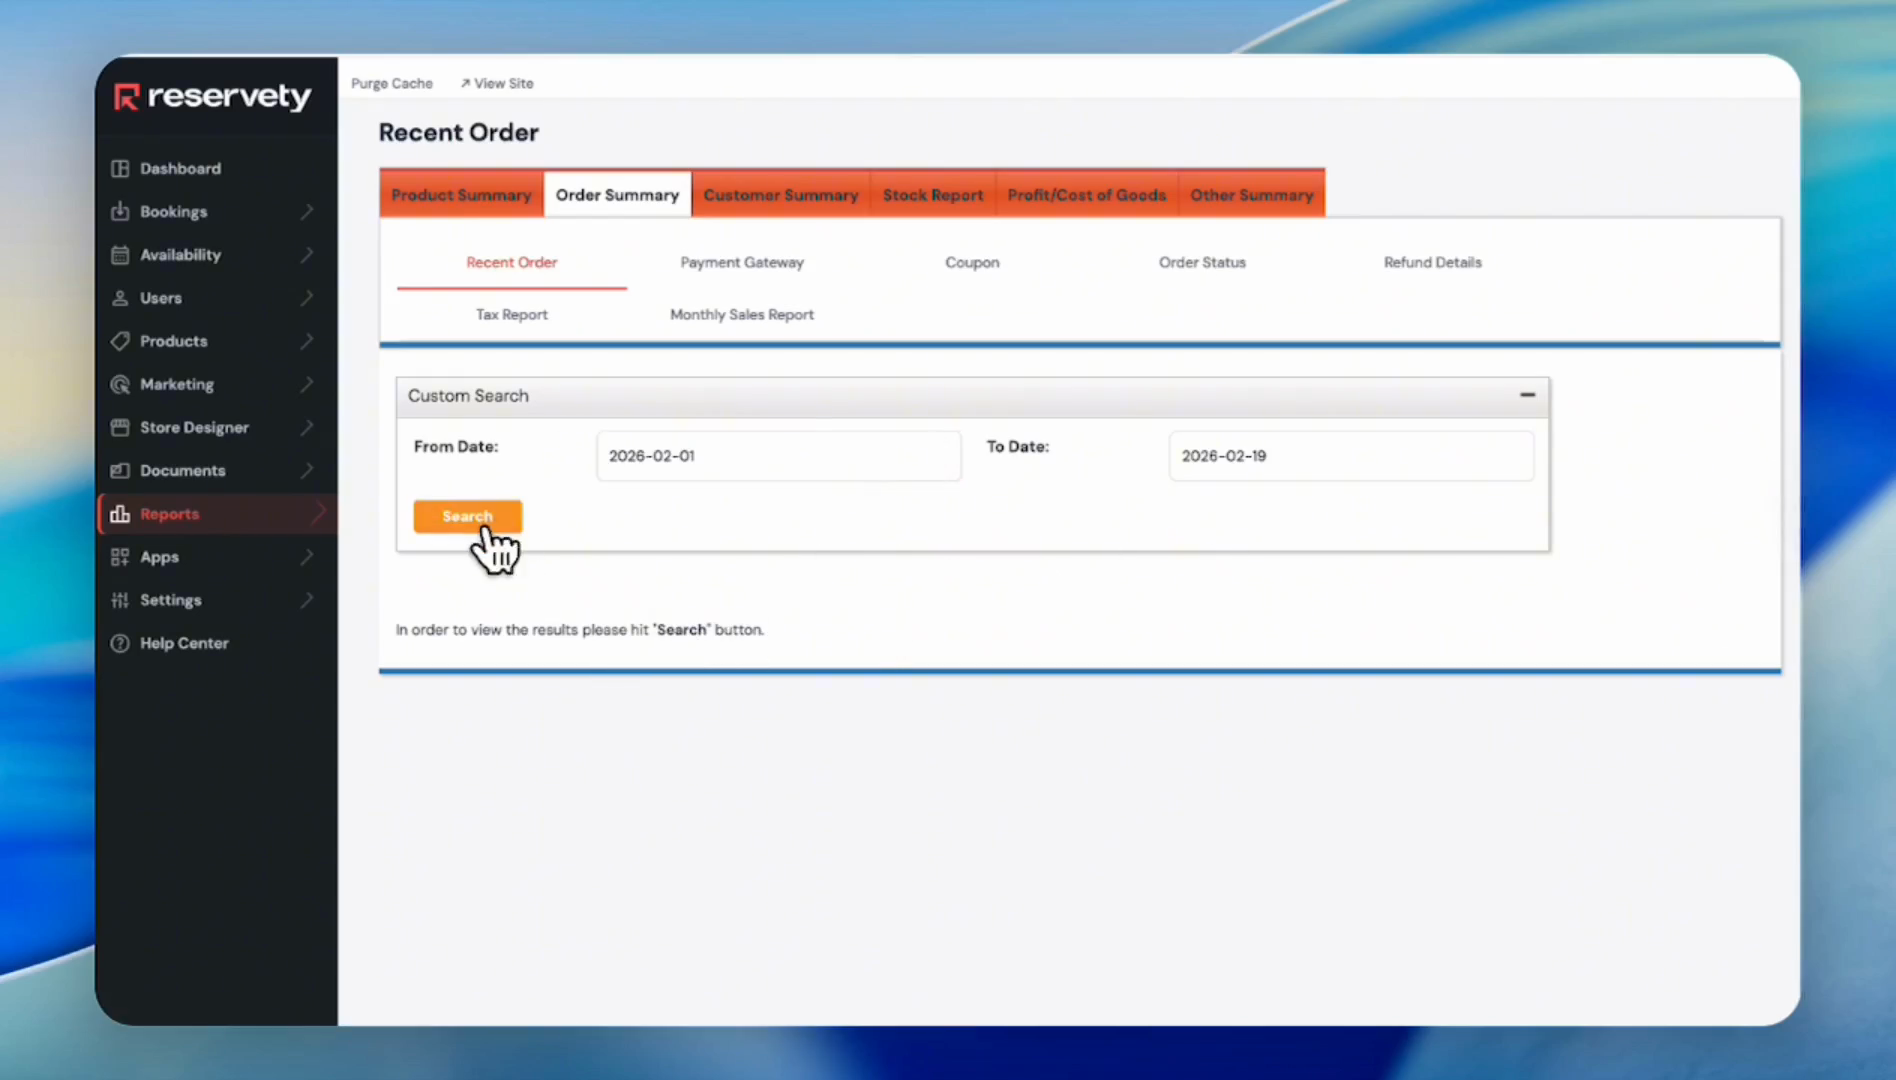
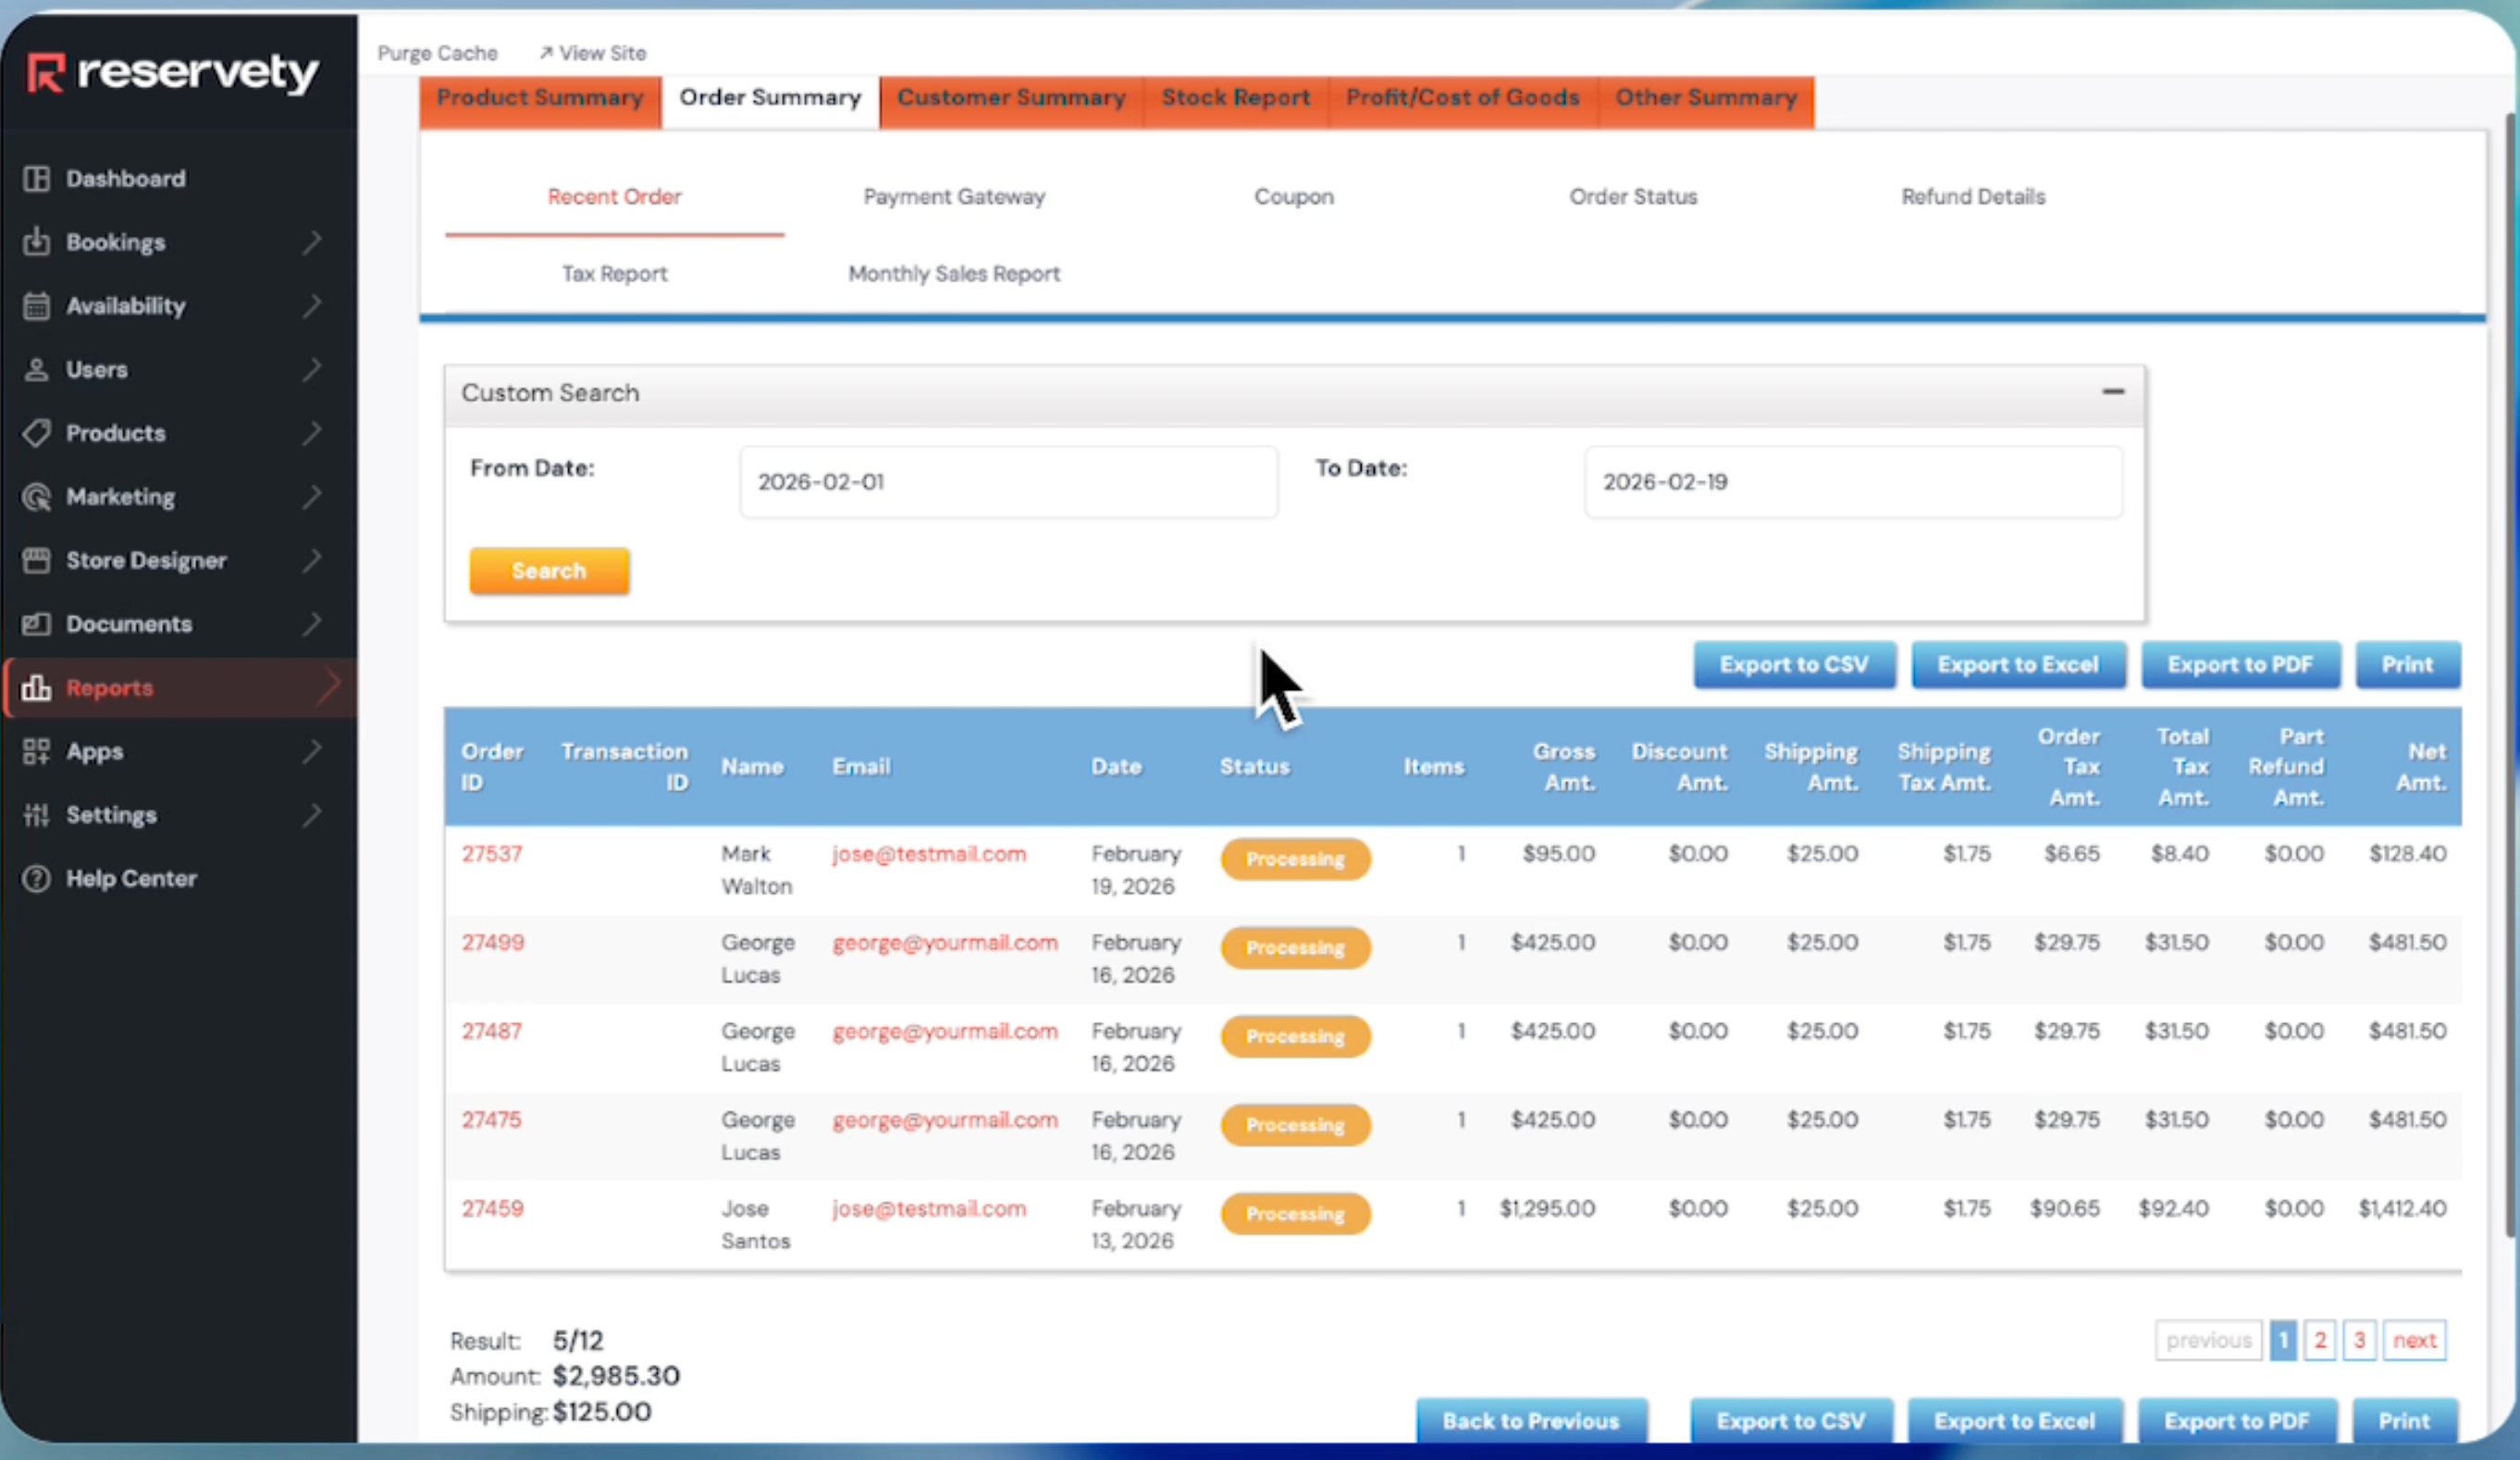
Suppose you want to view the report on recent orders.

8
Click the Order Summary tab.
Step #8: Click the Order Summary tab.
9
Click the Recent Order button.
Step #9: Click the Recent Order button.

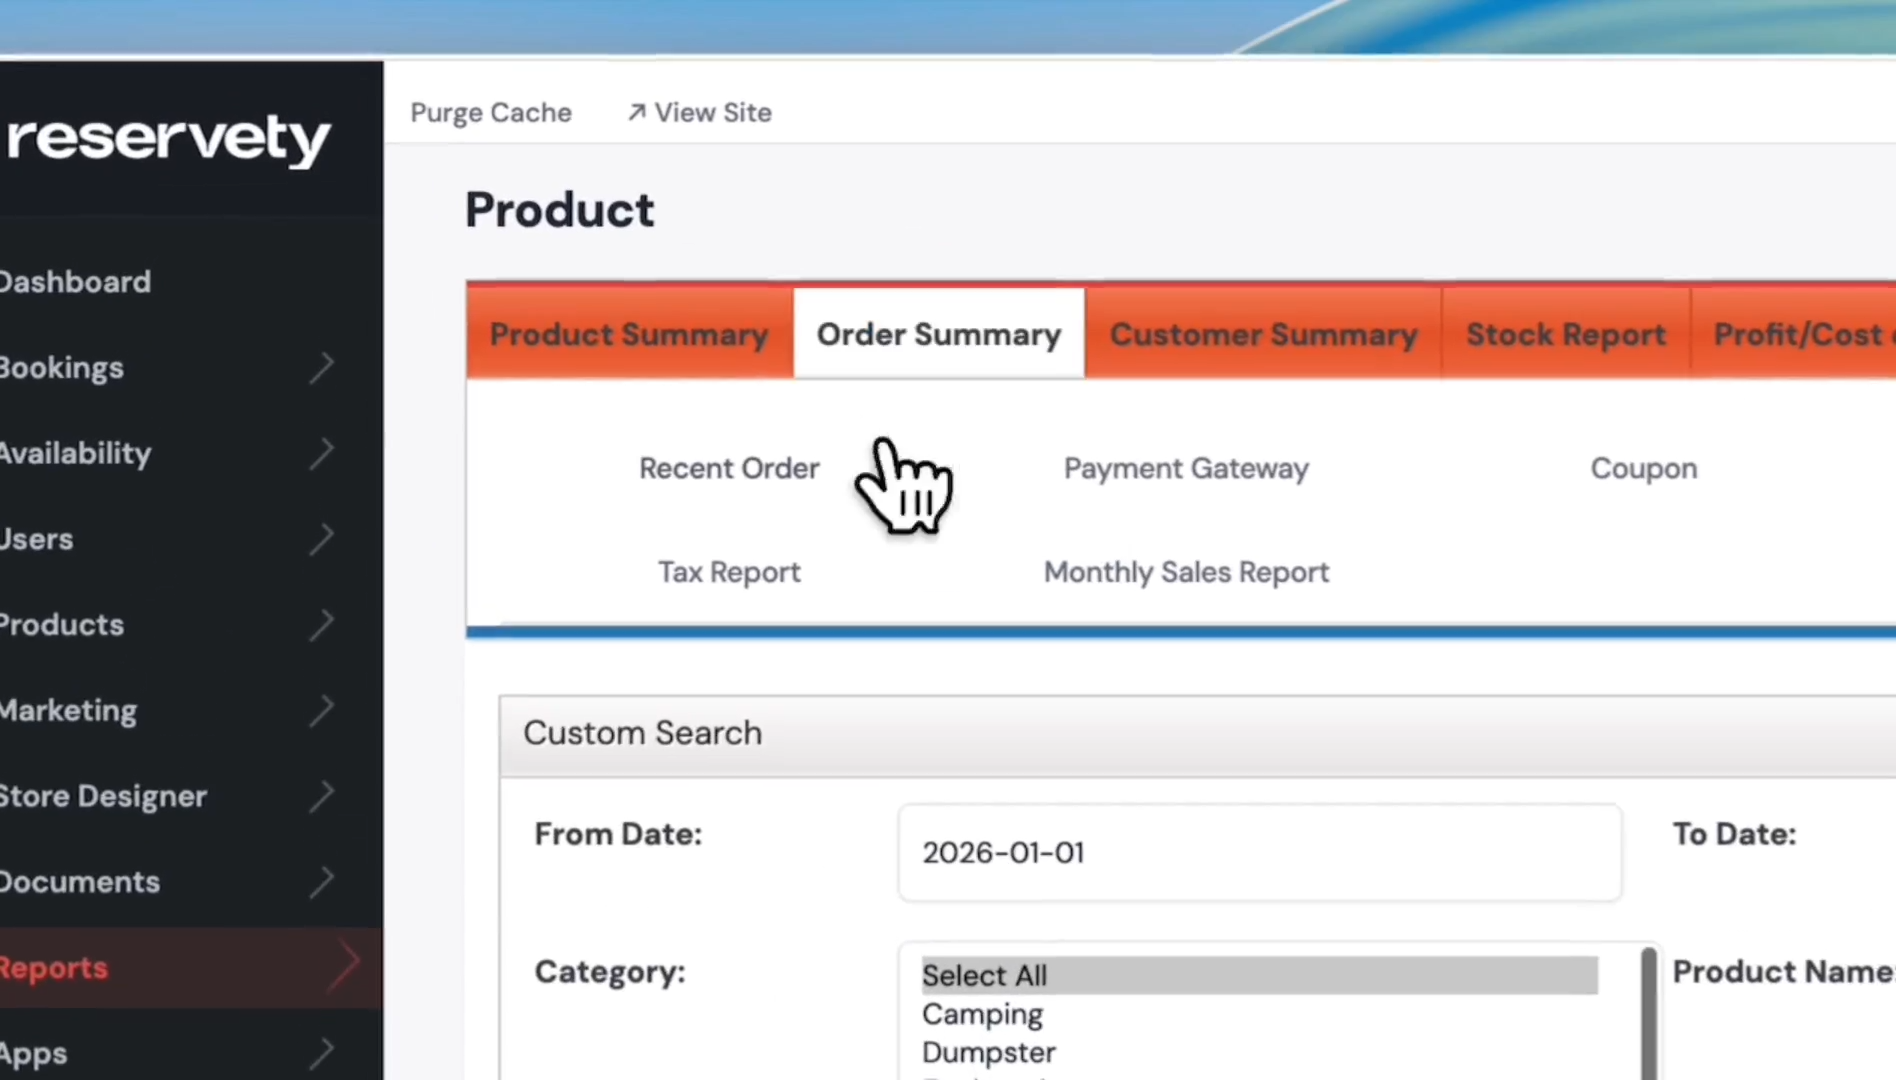
For example, we want to view orders from February 1st to today.

10
Set the dates and click the Search button.
Step #10: Set the dates and click the Search button.
11
This section displays all orders received in February.
Step #11: This section displays all orders received in February.

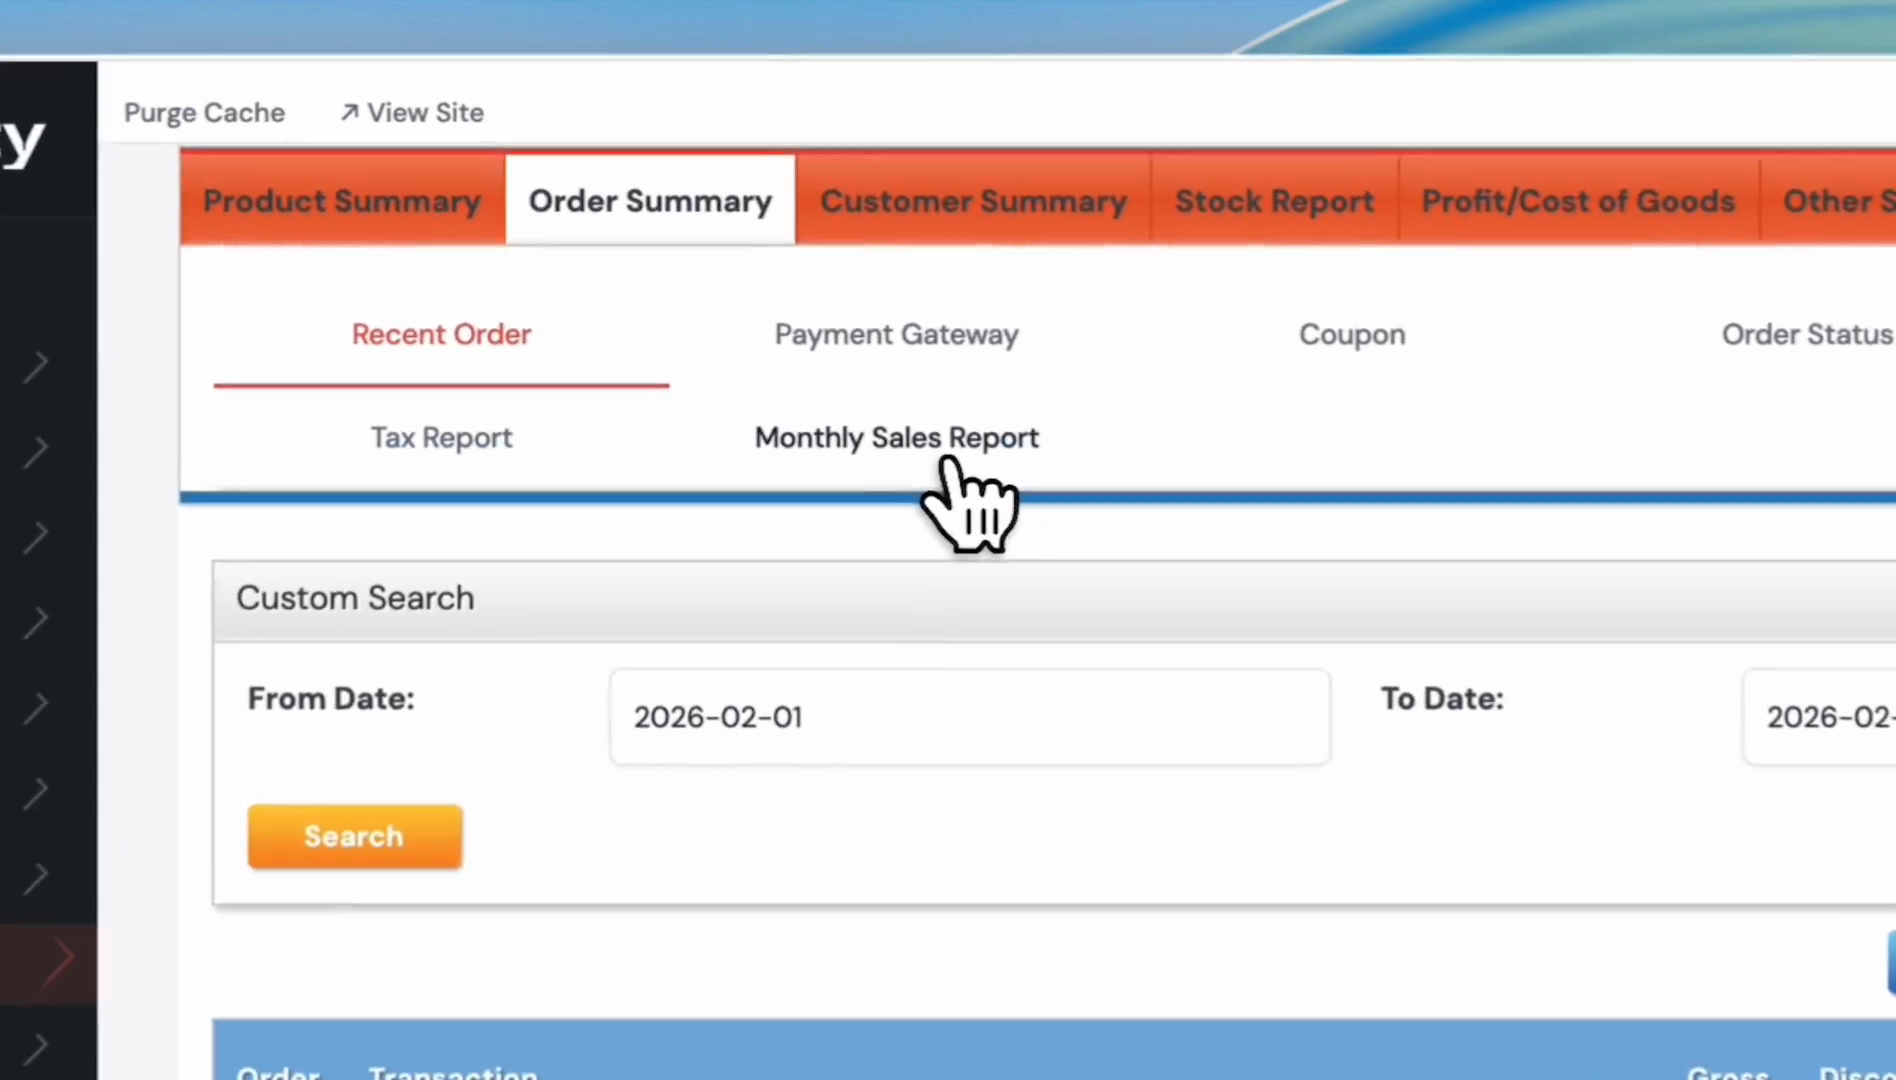
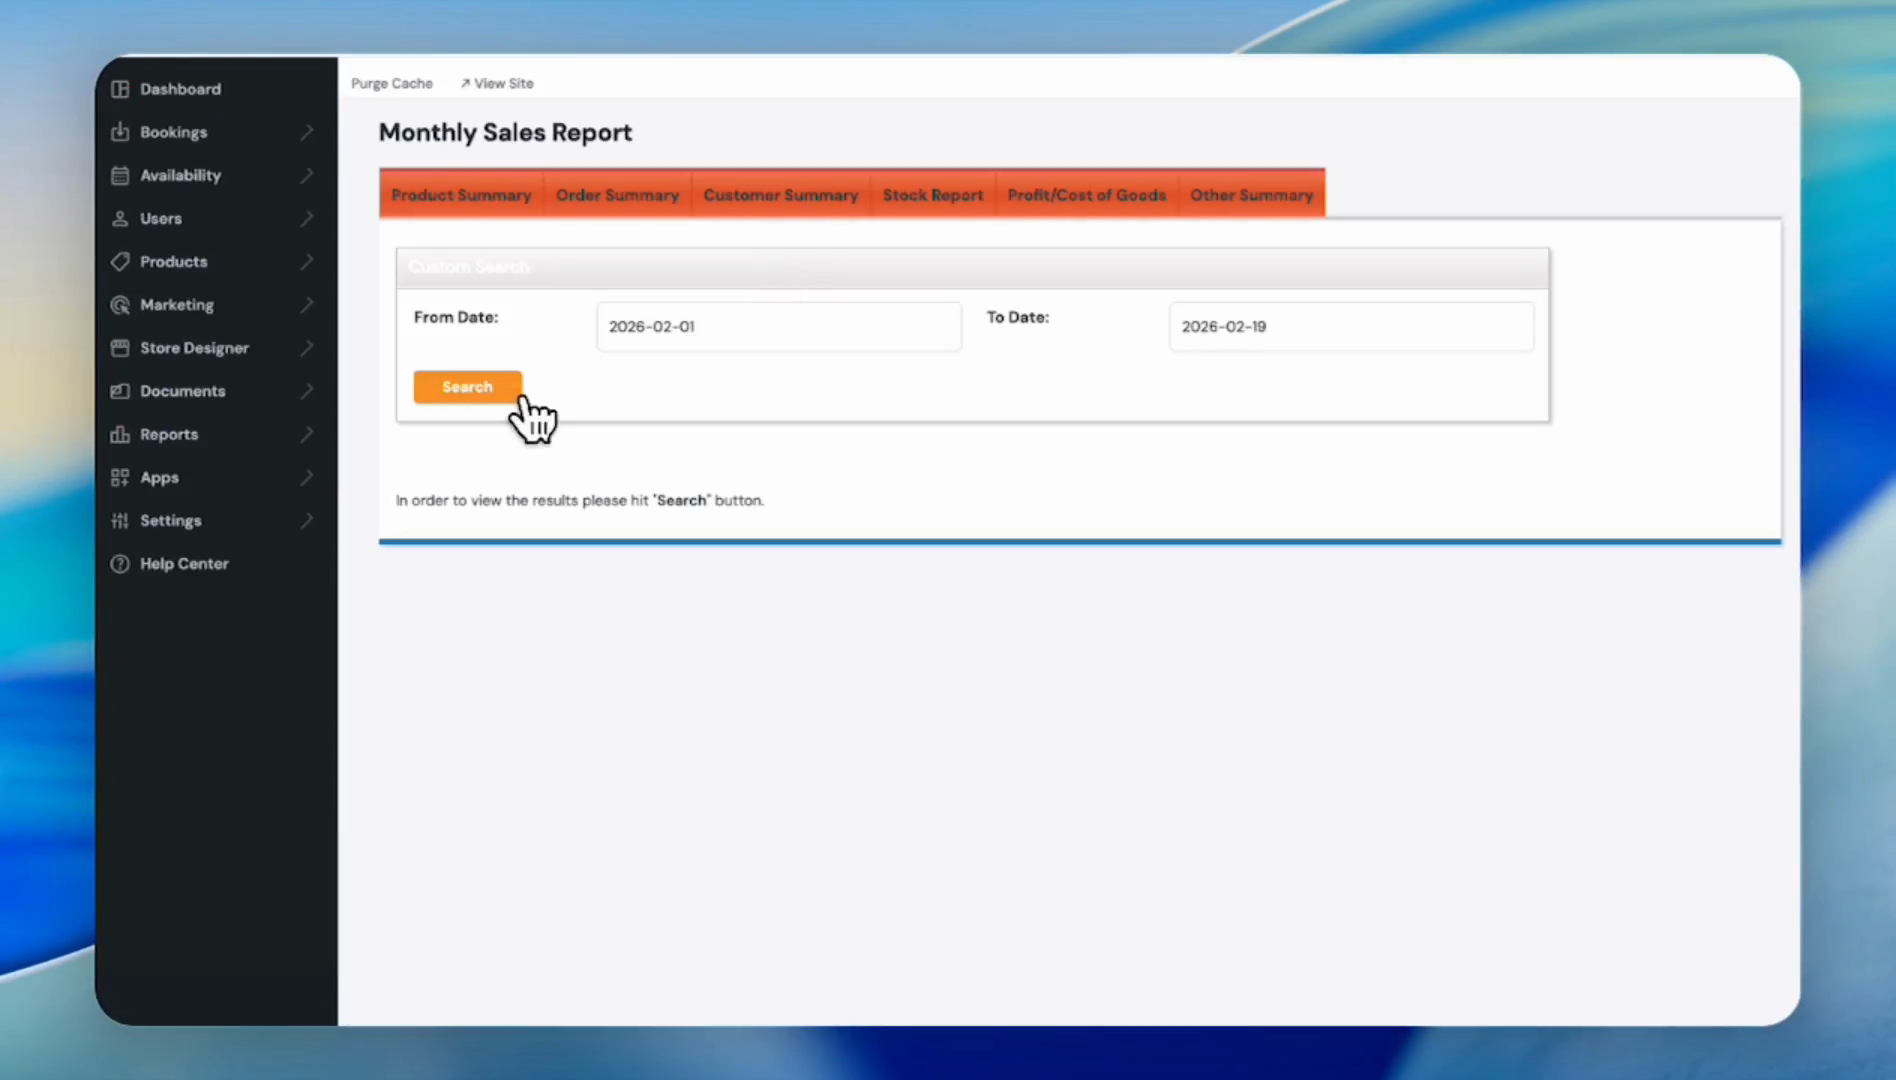
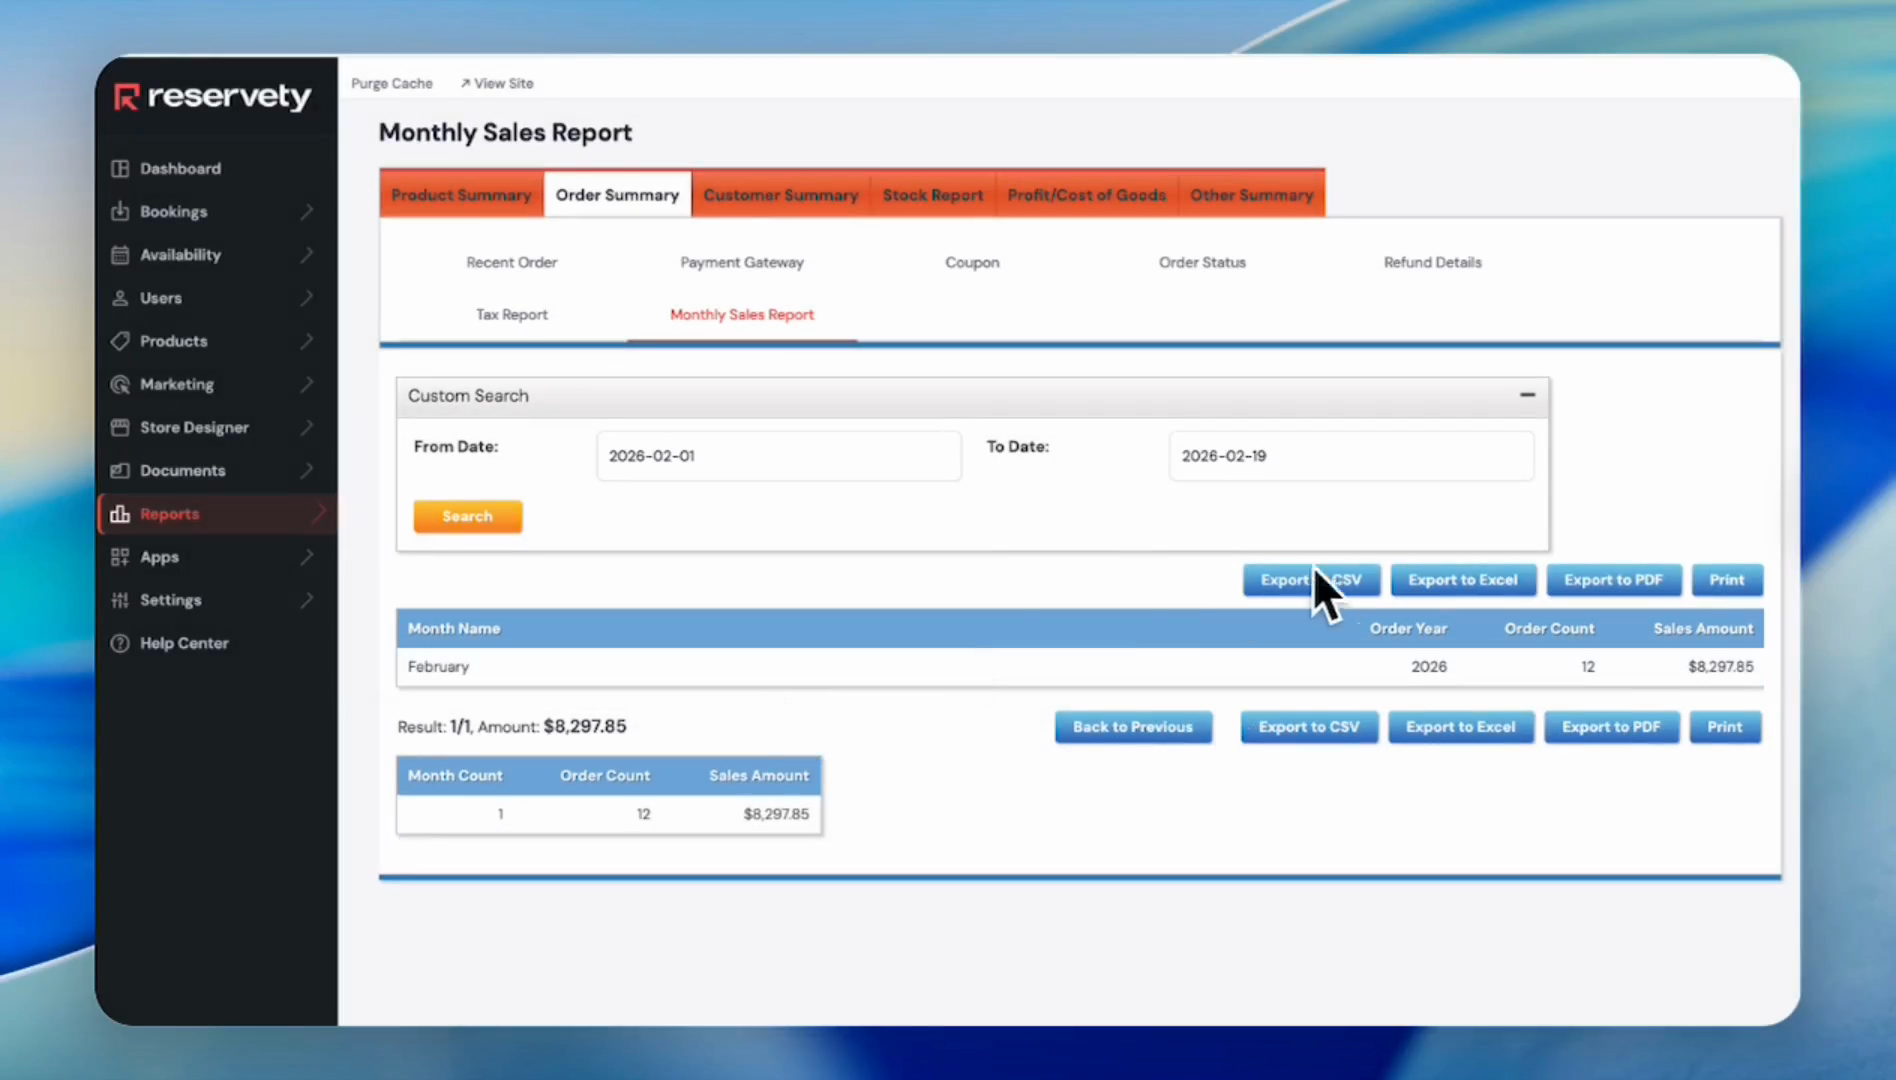
You can also view the monthly sales report. For example, this month is February, so when we click the Monthly Sales Report, it automatically generates the February reports. But you can still update the dates.

12
Click the Monthly Sales Report tab.
Step #12: Click the Monthly Sales Report tab.
13
Click the Search button.
Step #13: Click the Search button.
14
As you can see, there are 12 orders in February, with total sales of $8,297.85. To export this report to a CSV or Excel file, click on the buttons indicated in the screenshot.
Step #14: As you can see, there are 12 orders in February, with total sales of $8,297.85. To export this report to a CSV or Excel file, click on the buttons indicated in the screenshot.

You can also get reports on order status and refund details.

15
Click the Refund Details tab.
Step #15: Click the Refund Details tab.

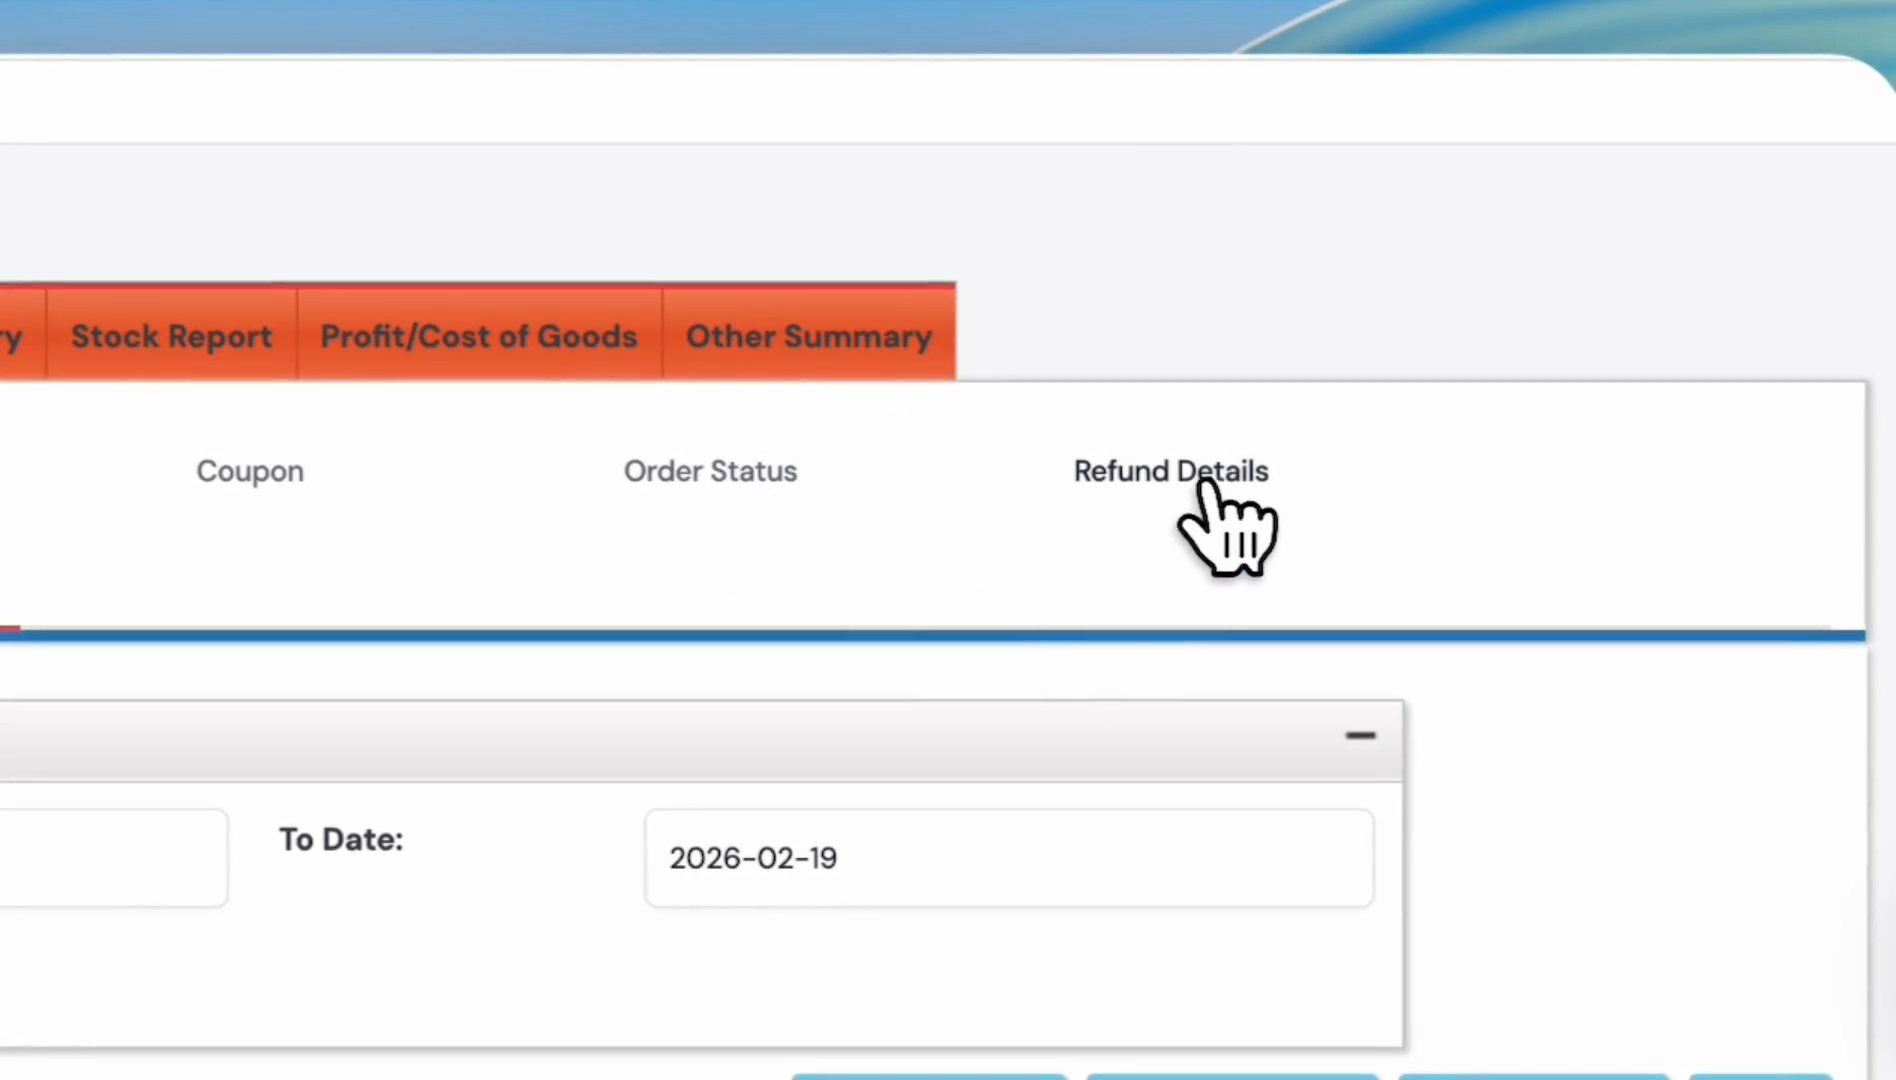
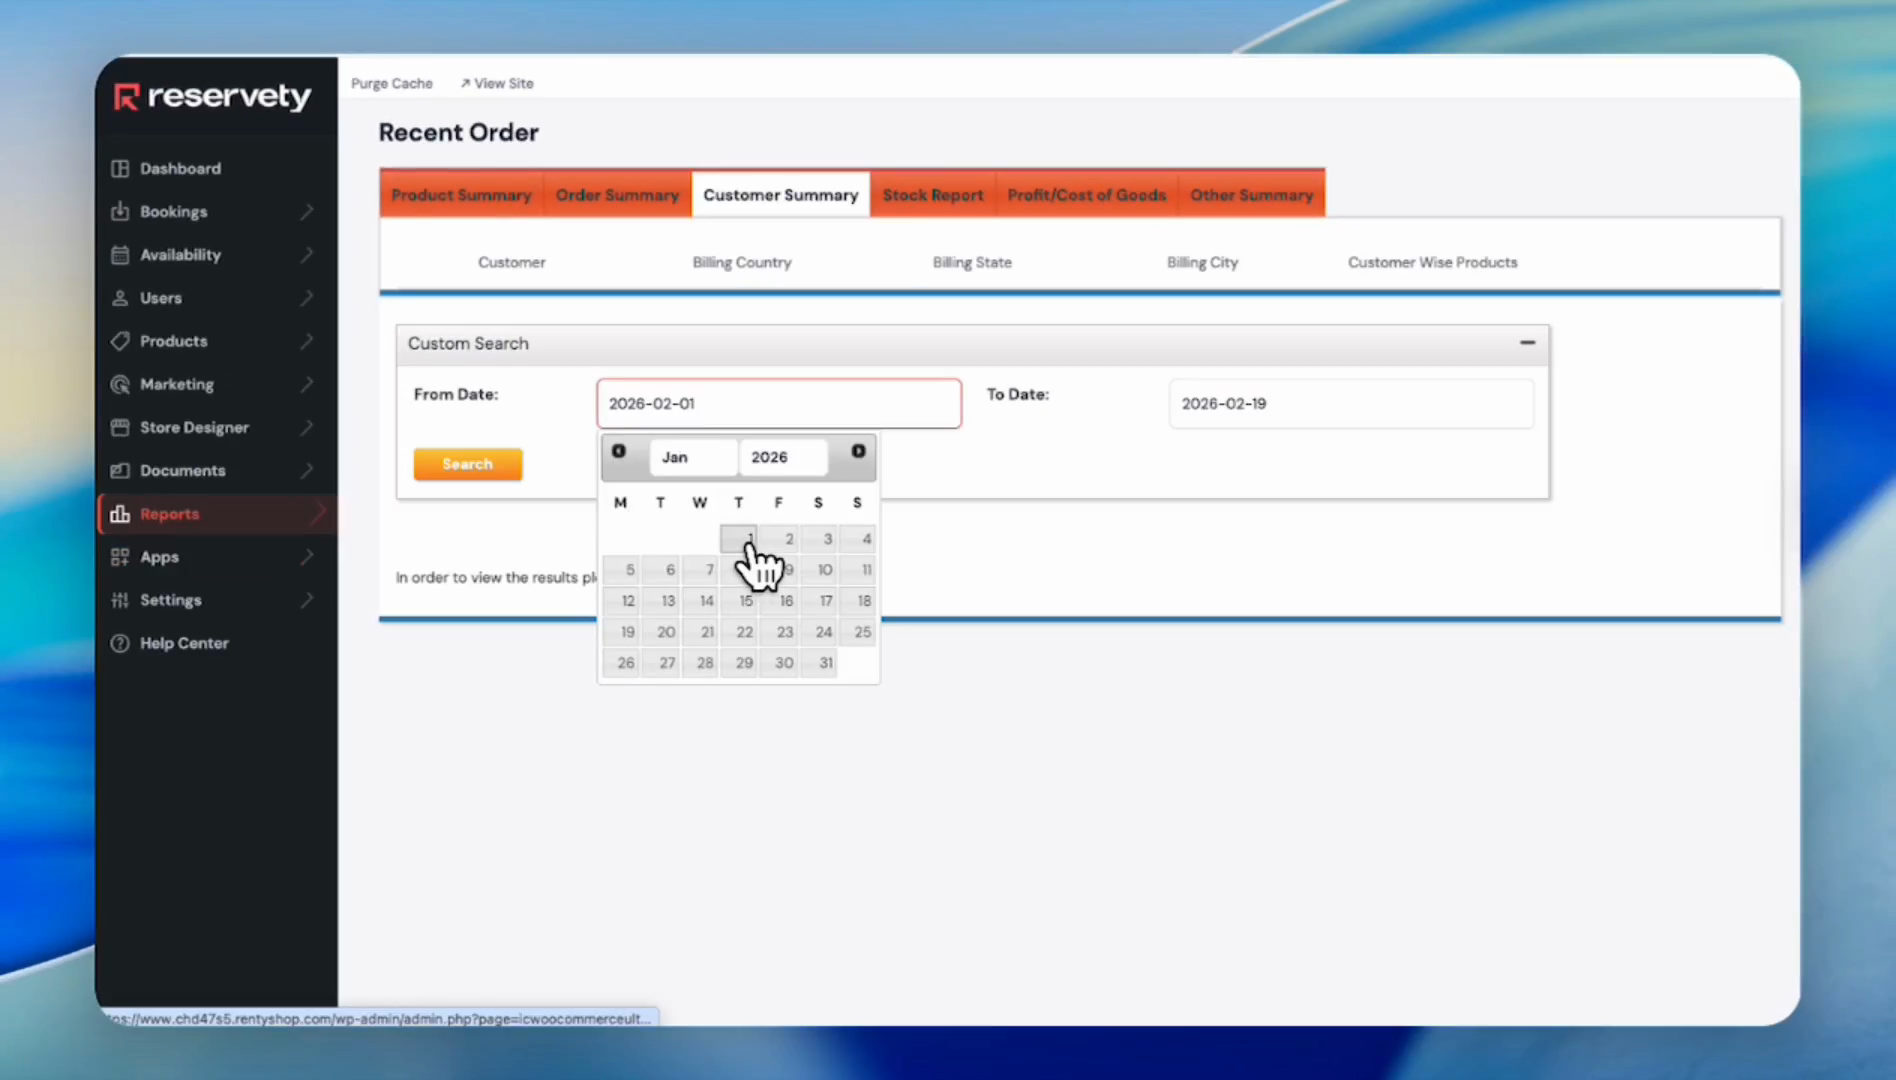
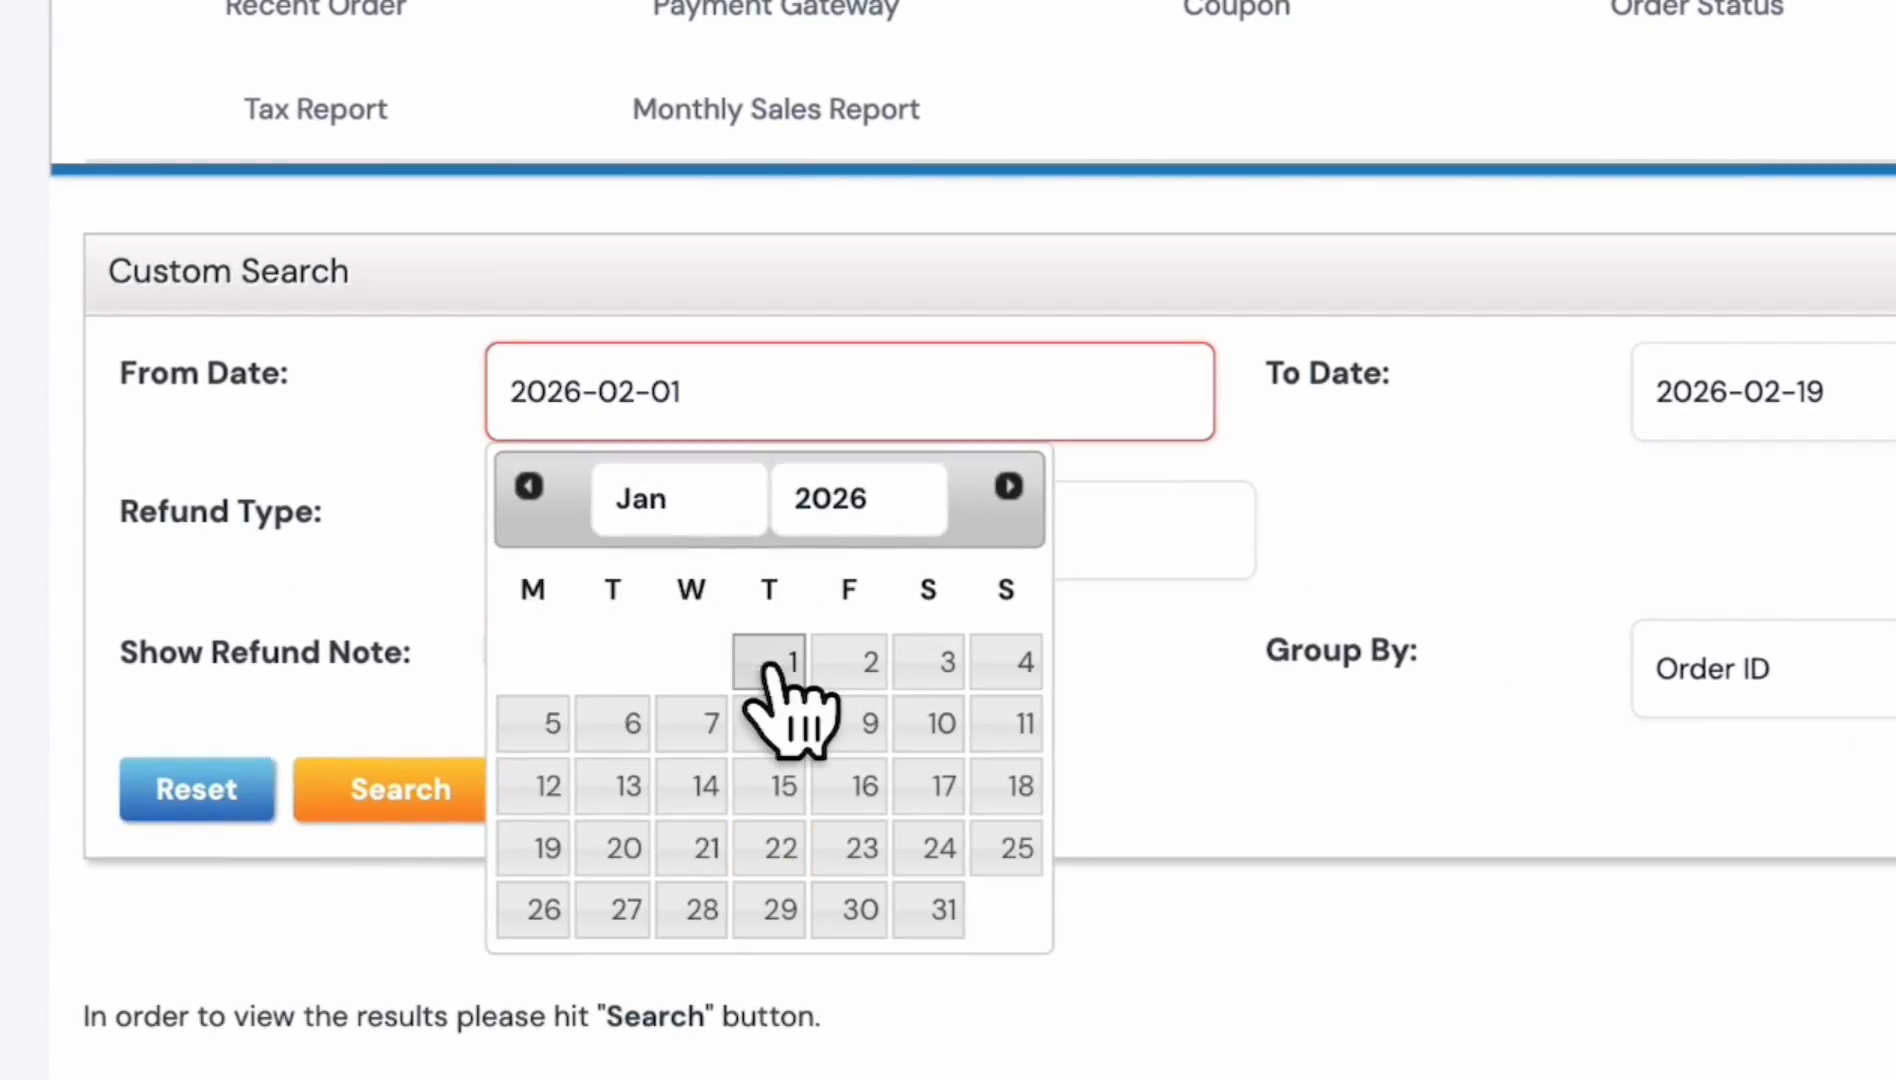
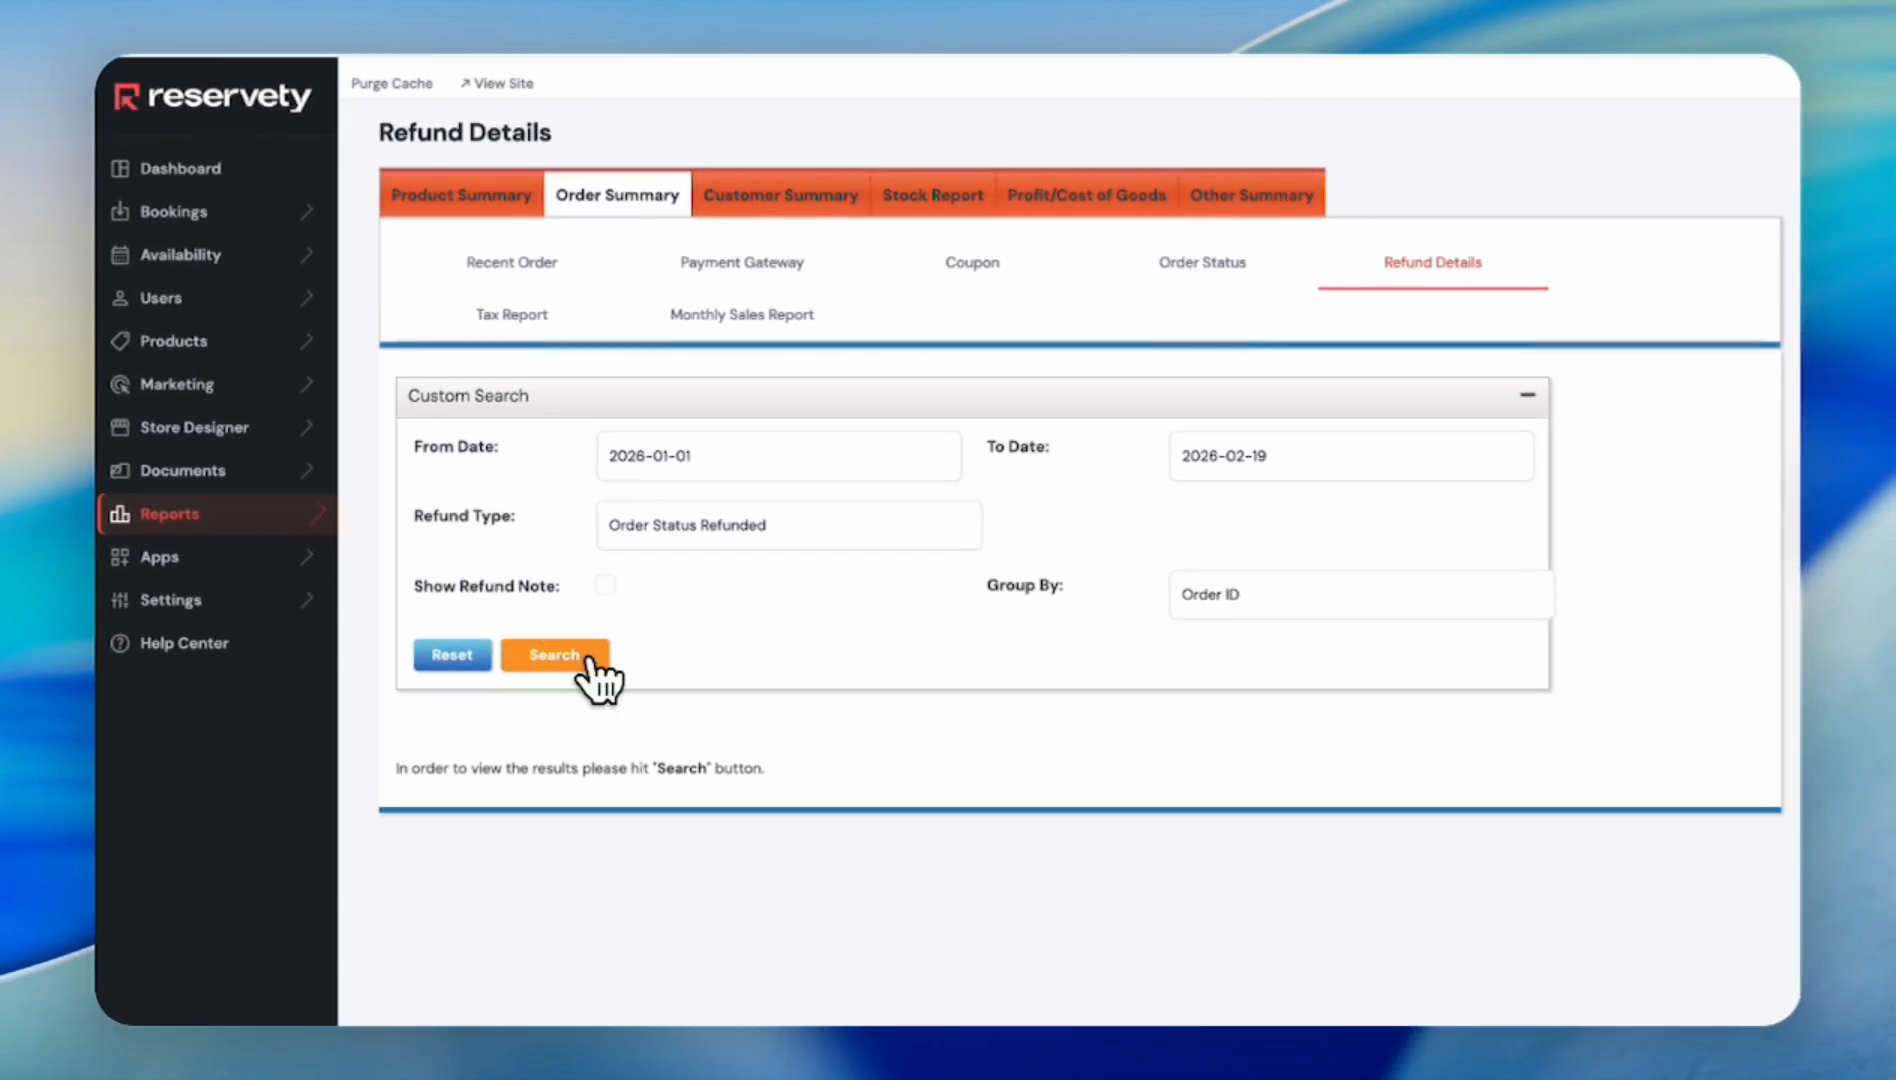
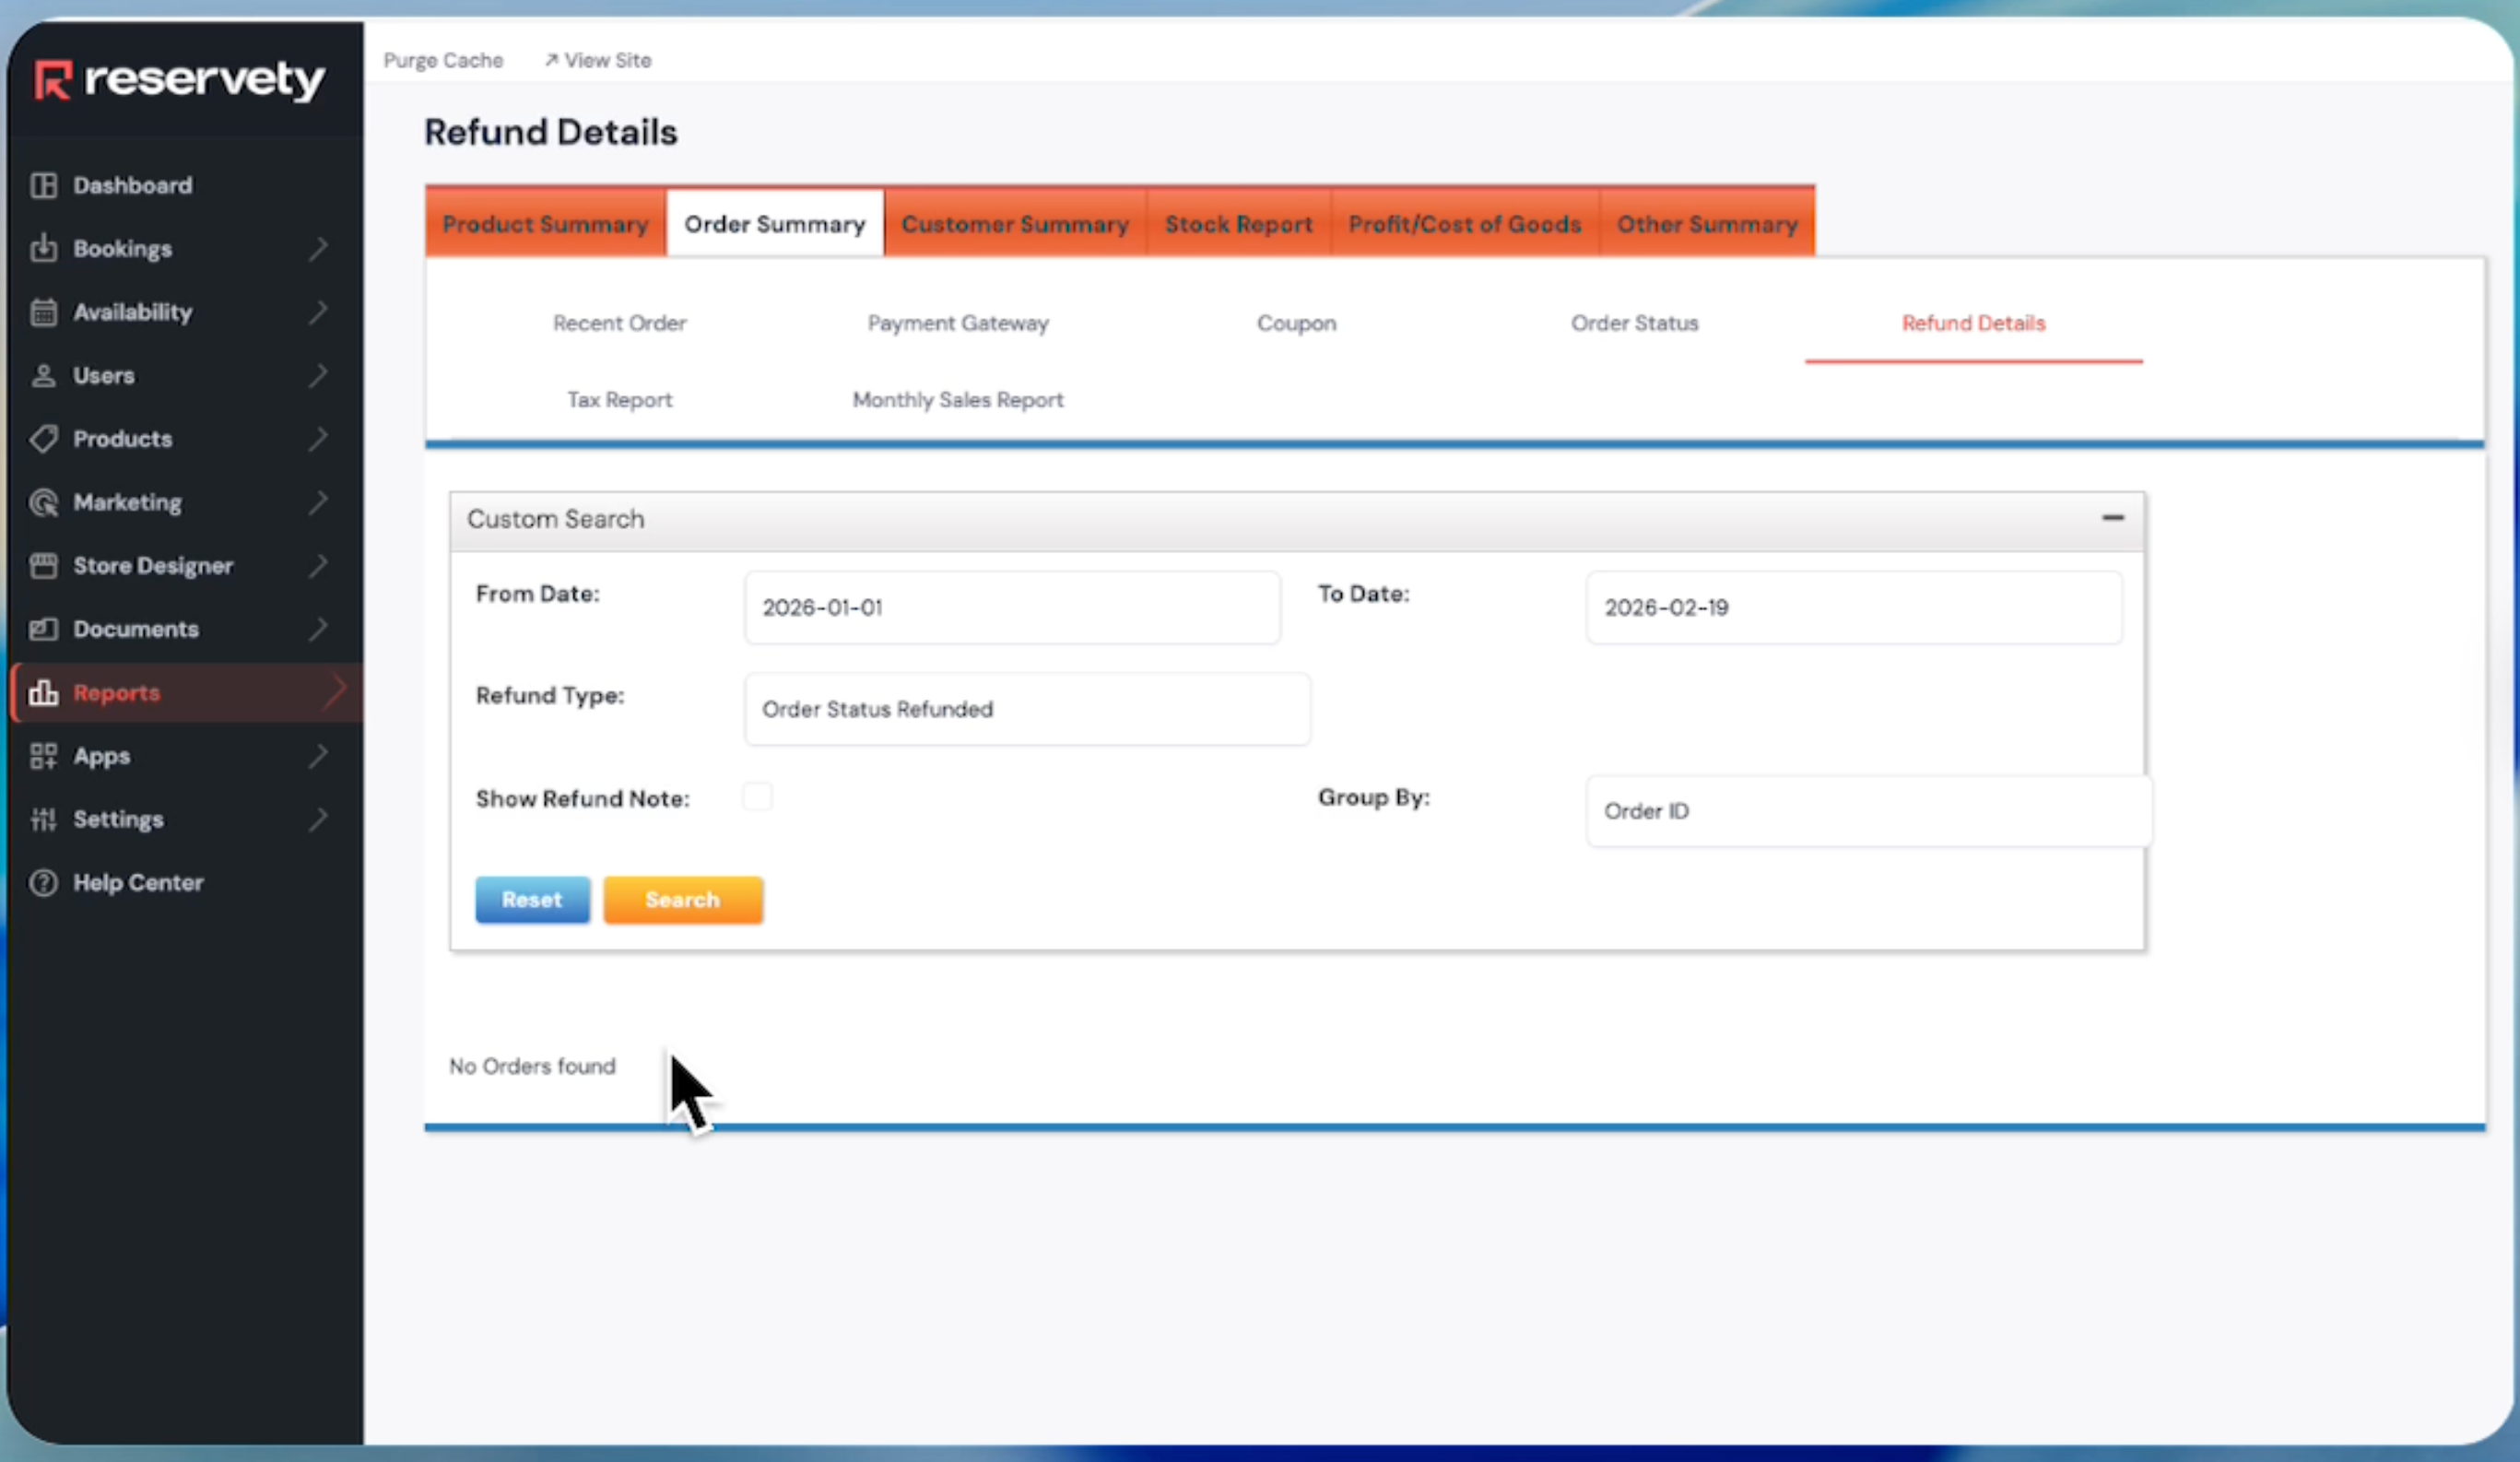
For example, to see how many orders received a refund, click the Refund Details button and select the dates.

16
Click in the From Date field.
Step #16: Click in the From Date field.

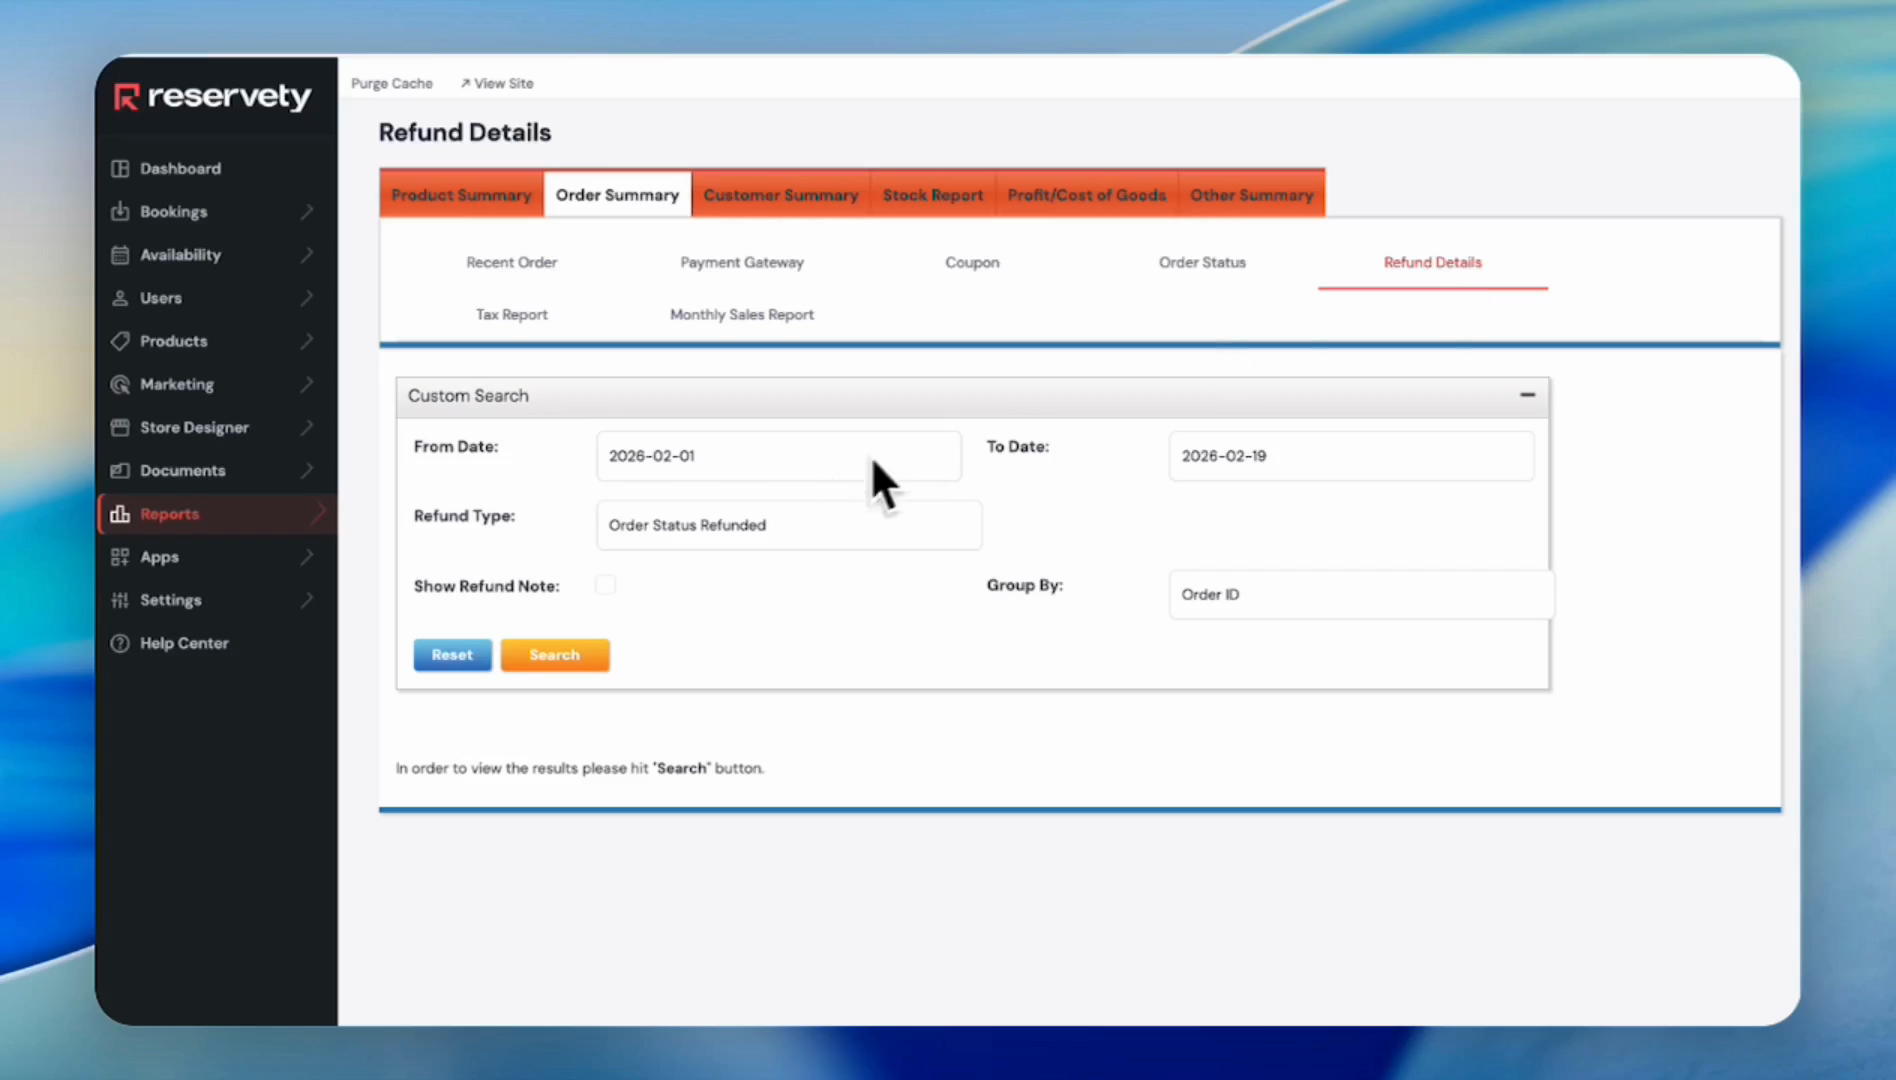
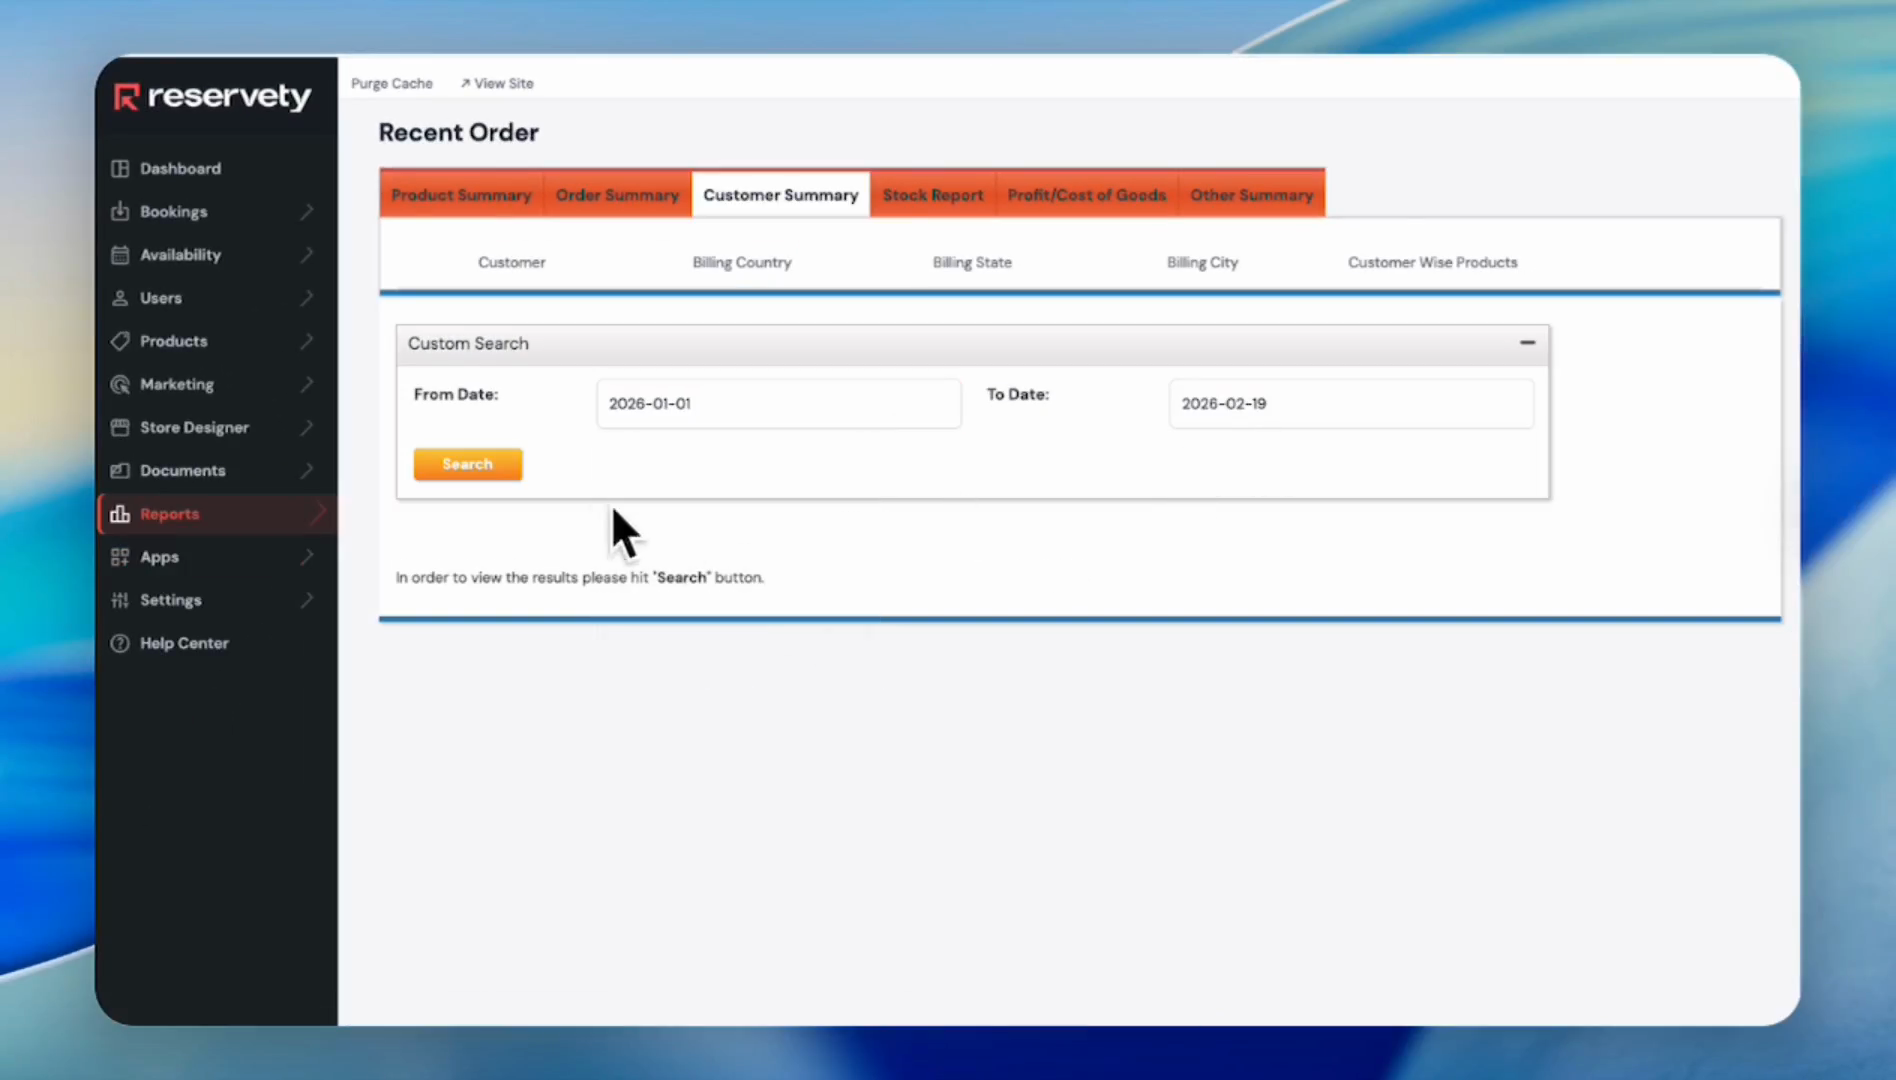
For example, we want to see refunds from January 1st to February 19th.

17
Pick From Date and To Date.
Step #17: Pick From Date and To Date.
18
Click the Search button.
Step #18: Click the Search button.
19
As you can see, there are no orders with refunds in the selected period.
Step #19: As you can see, there are no orders with refunds in the selected period.

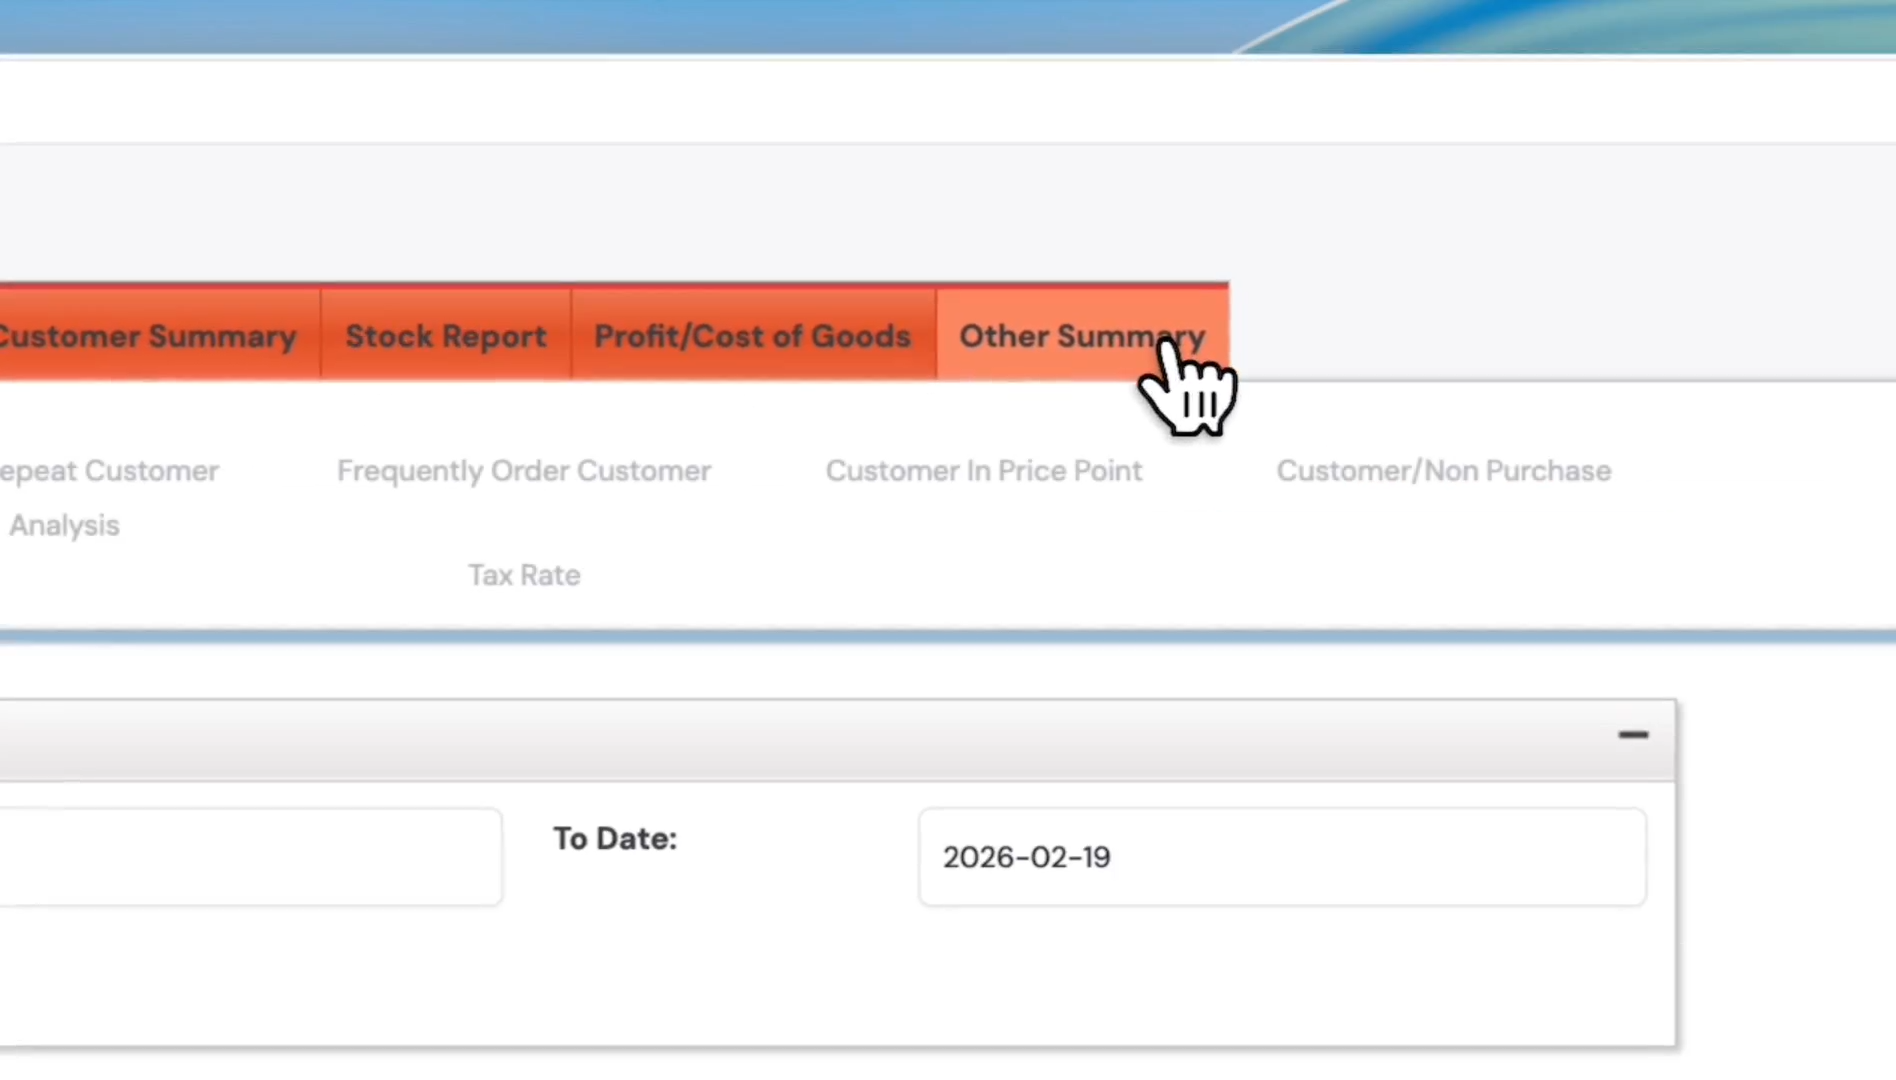
You can also access reports on coupons, payment gateways, and taxes.

20
To view each customer's performance, click the Customer Summary tab
Step #20: To view each customer's performance, click the Customer Summary tab

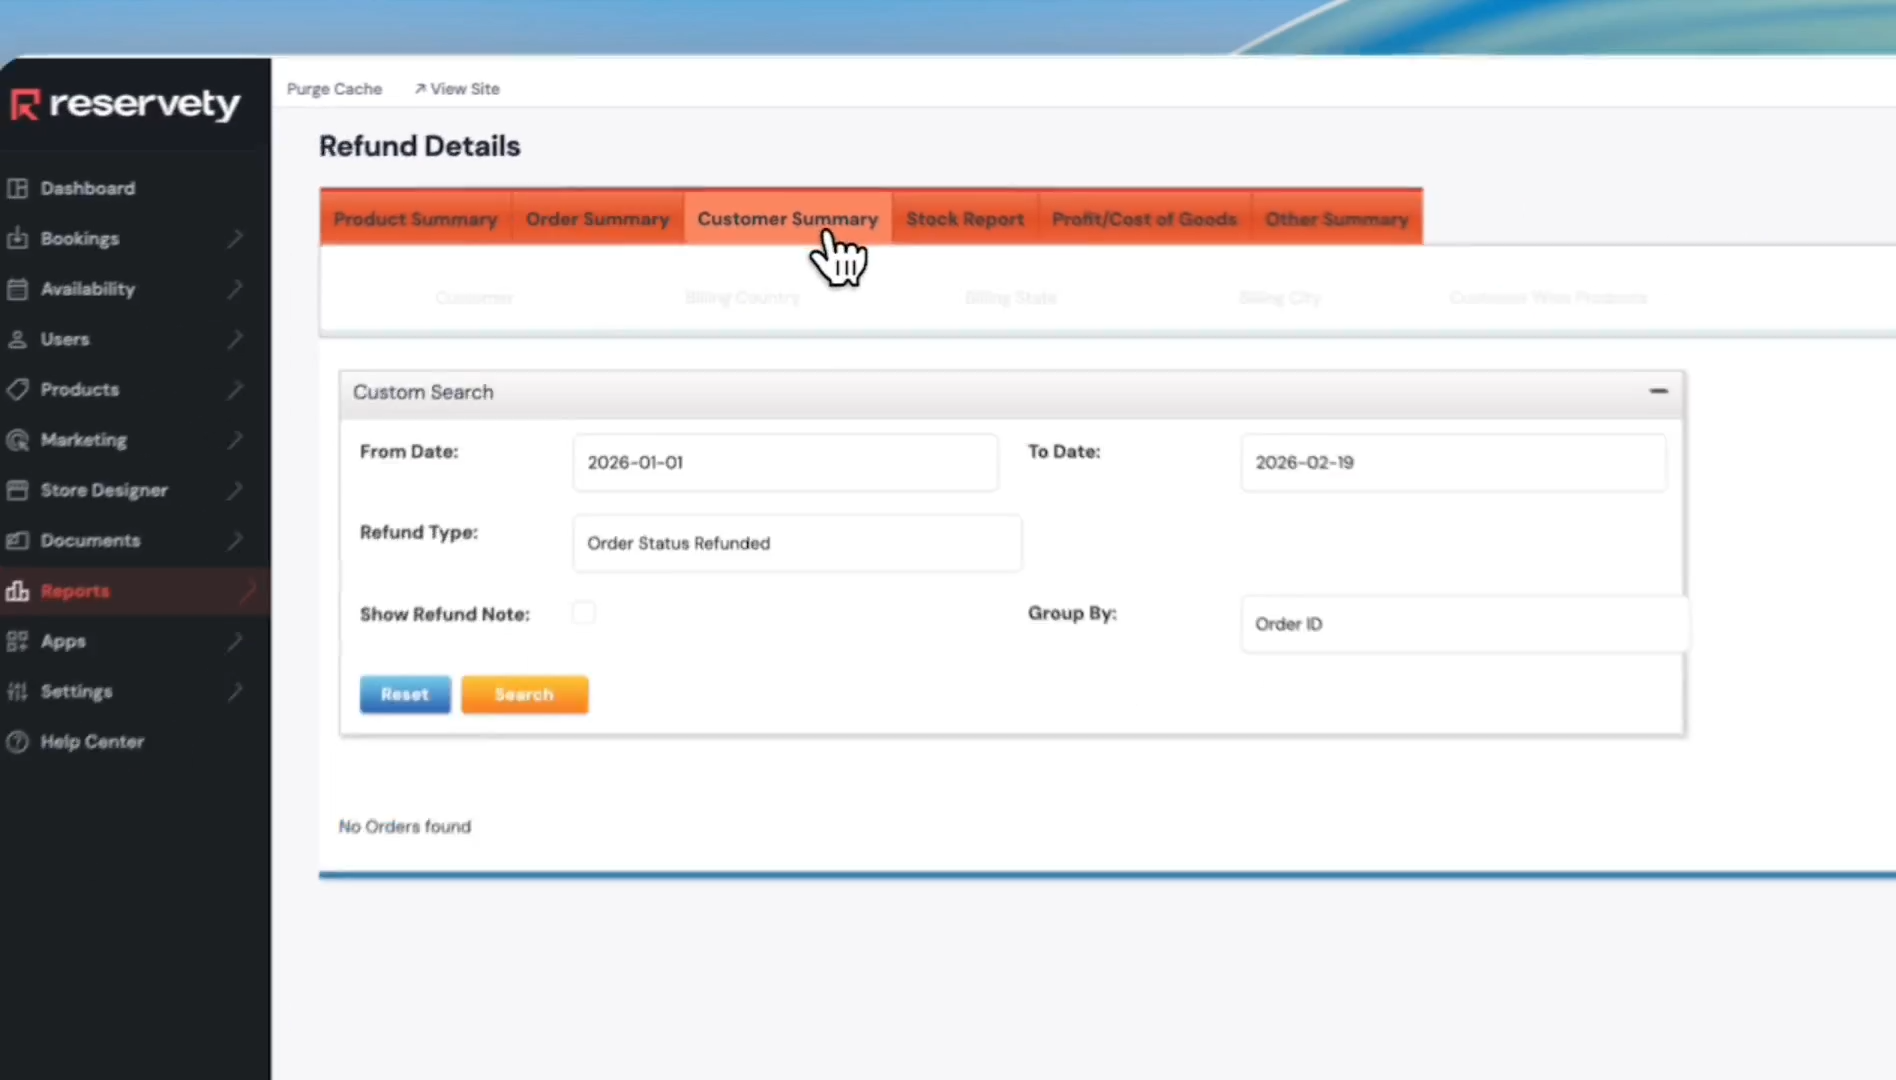
For example, we want to see the customer performance from January 1st to February 19th.

21
Click in the From Date field.
Step #21: Click in the From Date field.
22
Select January 1st as the start date.
Step #22: Select January 1st as the start date.
23
Click the Search button.
Step #23: Click the Search button.
24
There is a list of customers.
Step #24: There is a list of customers.
25
To view the stock report, click on the Stock Report tab.
Step #25: To view the stock report, click on the Stock Report tab.
26
Click on Zero Level Stock. It will show the stocks with zero items.
Step #26: Click on Zero Level Stock. It will show the stocks with zero items.
27
Click the Minimum Level Stock tab to view stocks with low quantities.
Step #27: Click the Minimum Level Stock tab to view stocks with low quantities.
28
Click the 'Most Stocked' tab to view products with the largest quantities.
Step #28: Click the 'Most Stocked' tab to view products with the largest quantities.
29
Click on the 'Other Summary' tab to get various other reports. As you can see, there are many other reports, such as Customer and Price Point, Customer Non-Purchase, Tax Rate, and more.
Step #29: Click on the 'Other Summary' tab to get various other reports. As you can see, there are many other reports, such as Customer and Price Point, Customer Non-Purchase, Tax Rate, and more.