How to View Your Bank Data on the Capstack Technologies Platform
In this guide you will learn how to navigate the CapStack Technologies platform to view your bank's profile . Once logged in, you can view Capstack Insights on your bank, review key metrics such your credit profile, capital position, profitability, and basic bank information. This data is helpful in assessing any bank's underwriting strength and overall financial health and is available to all of our registered clients. Any registered client has the capability to pull up similar data on any bank or credit union.
Let's get started
Today, we will use SmartBank as an example.
The first thing we generate are insights on your bank. In this case, the first insight is your commercial real estate exposure.
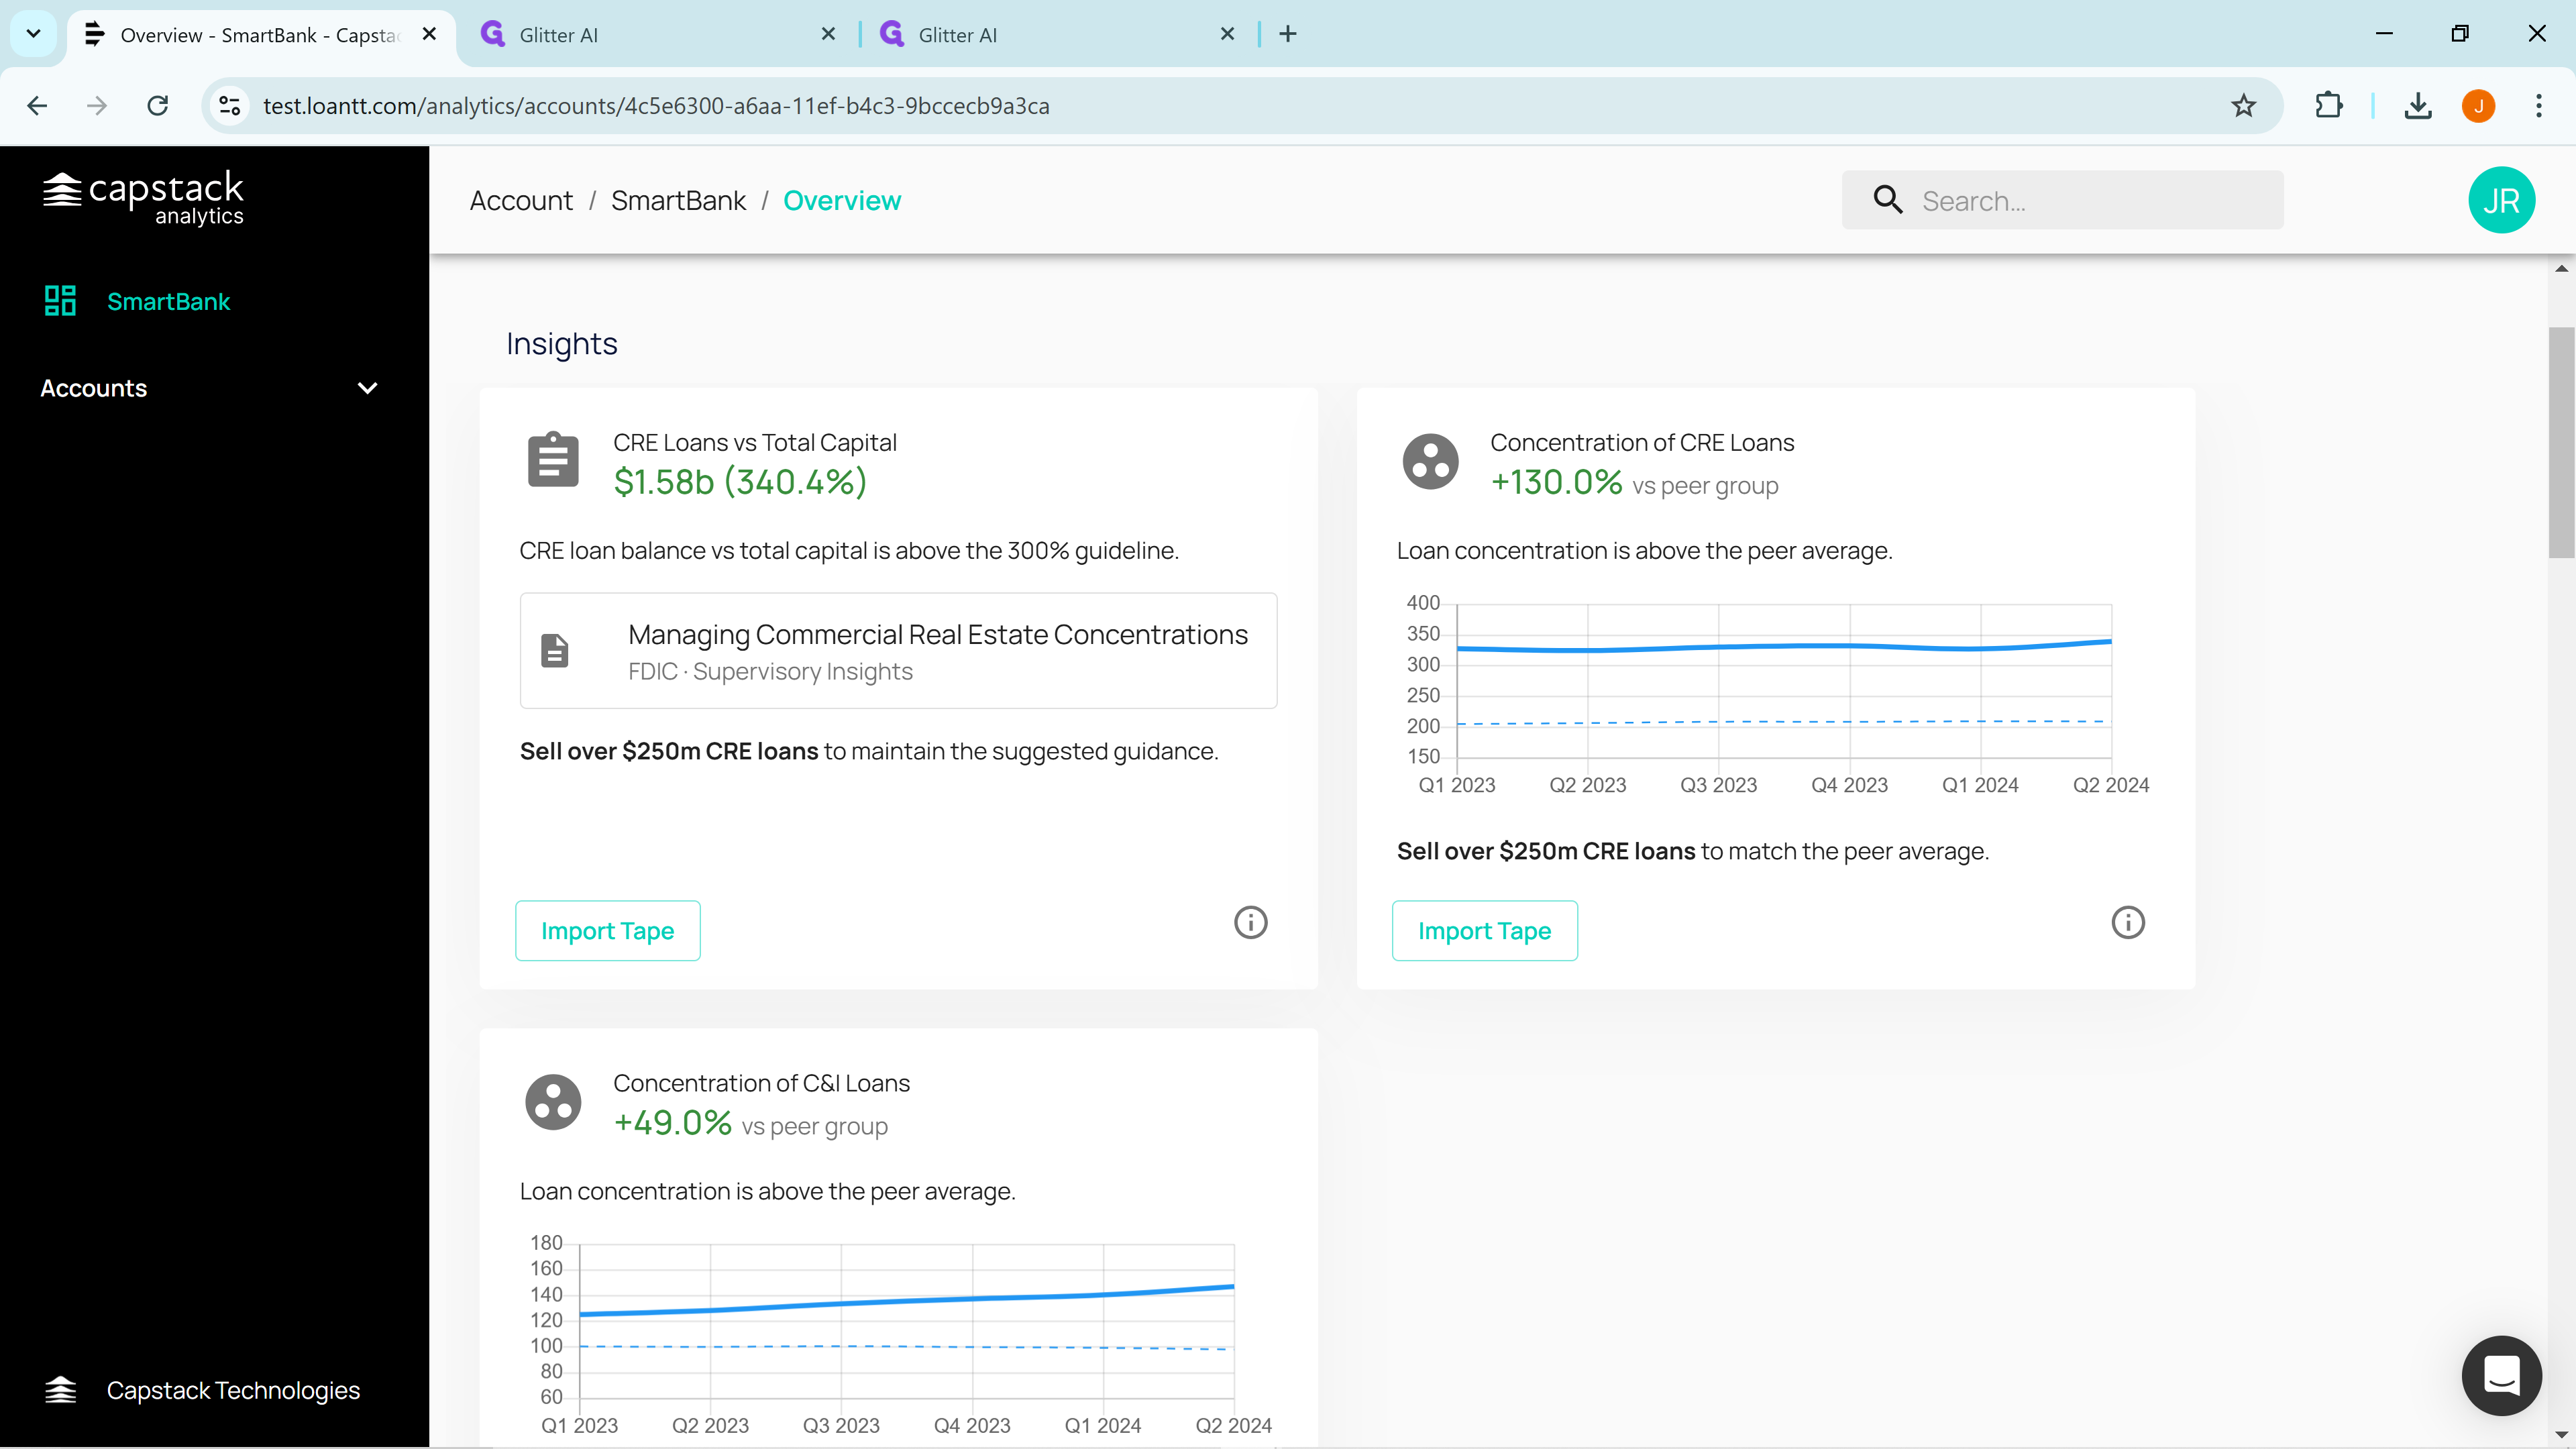
Here you are at 340% total capital in commercial real estate loans. That is above the FDIC upper guideline of 300% total capital in CRE. In this case, Capstack would identify you as a potential seller of commercial real estate loans. We generate many insights but only display the top three.
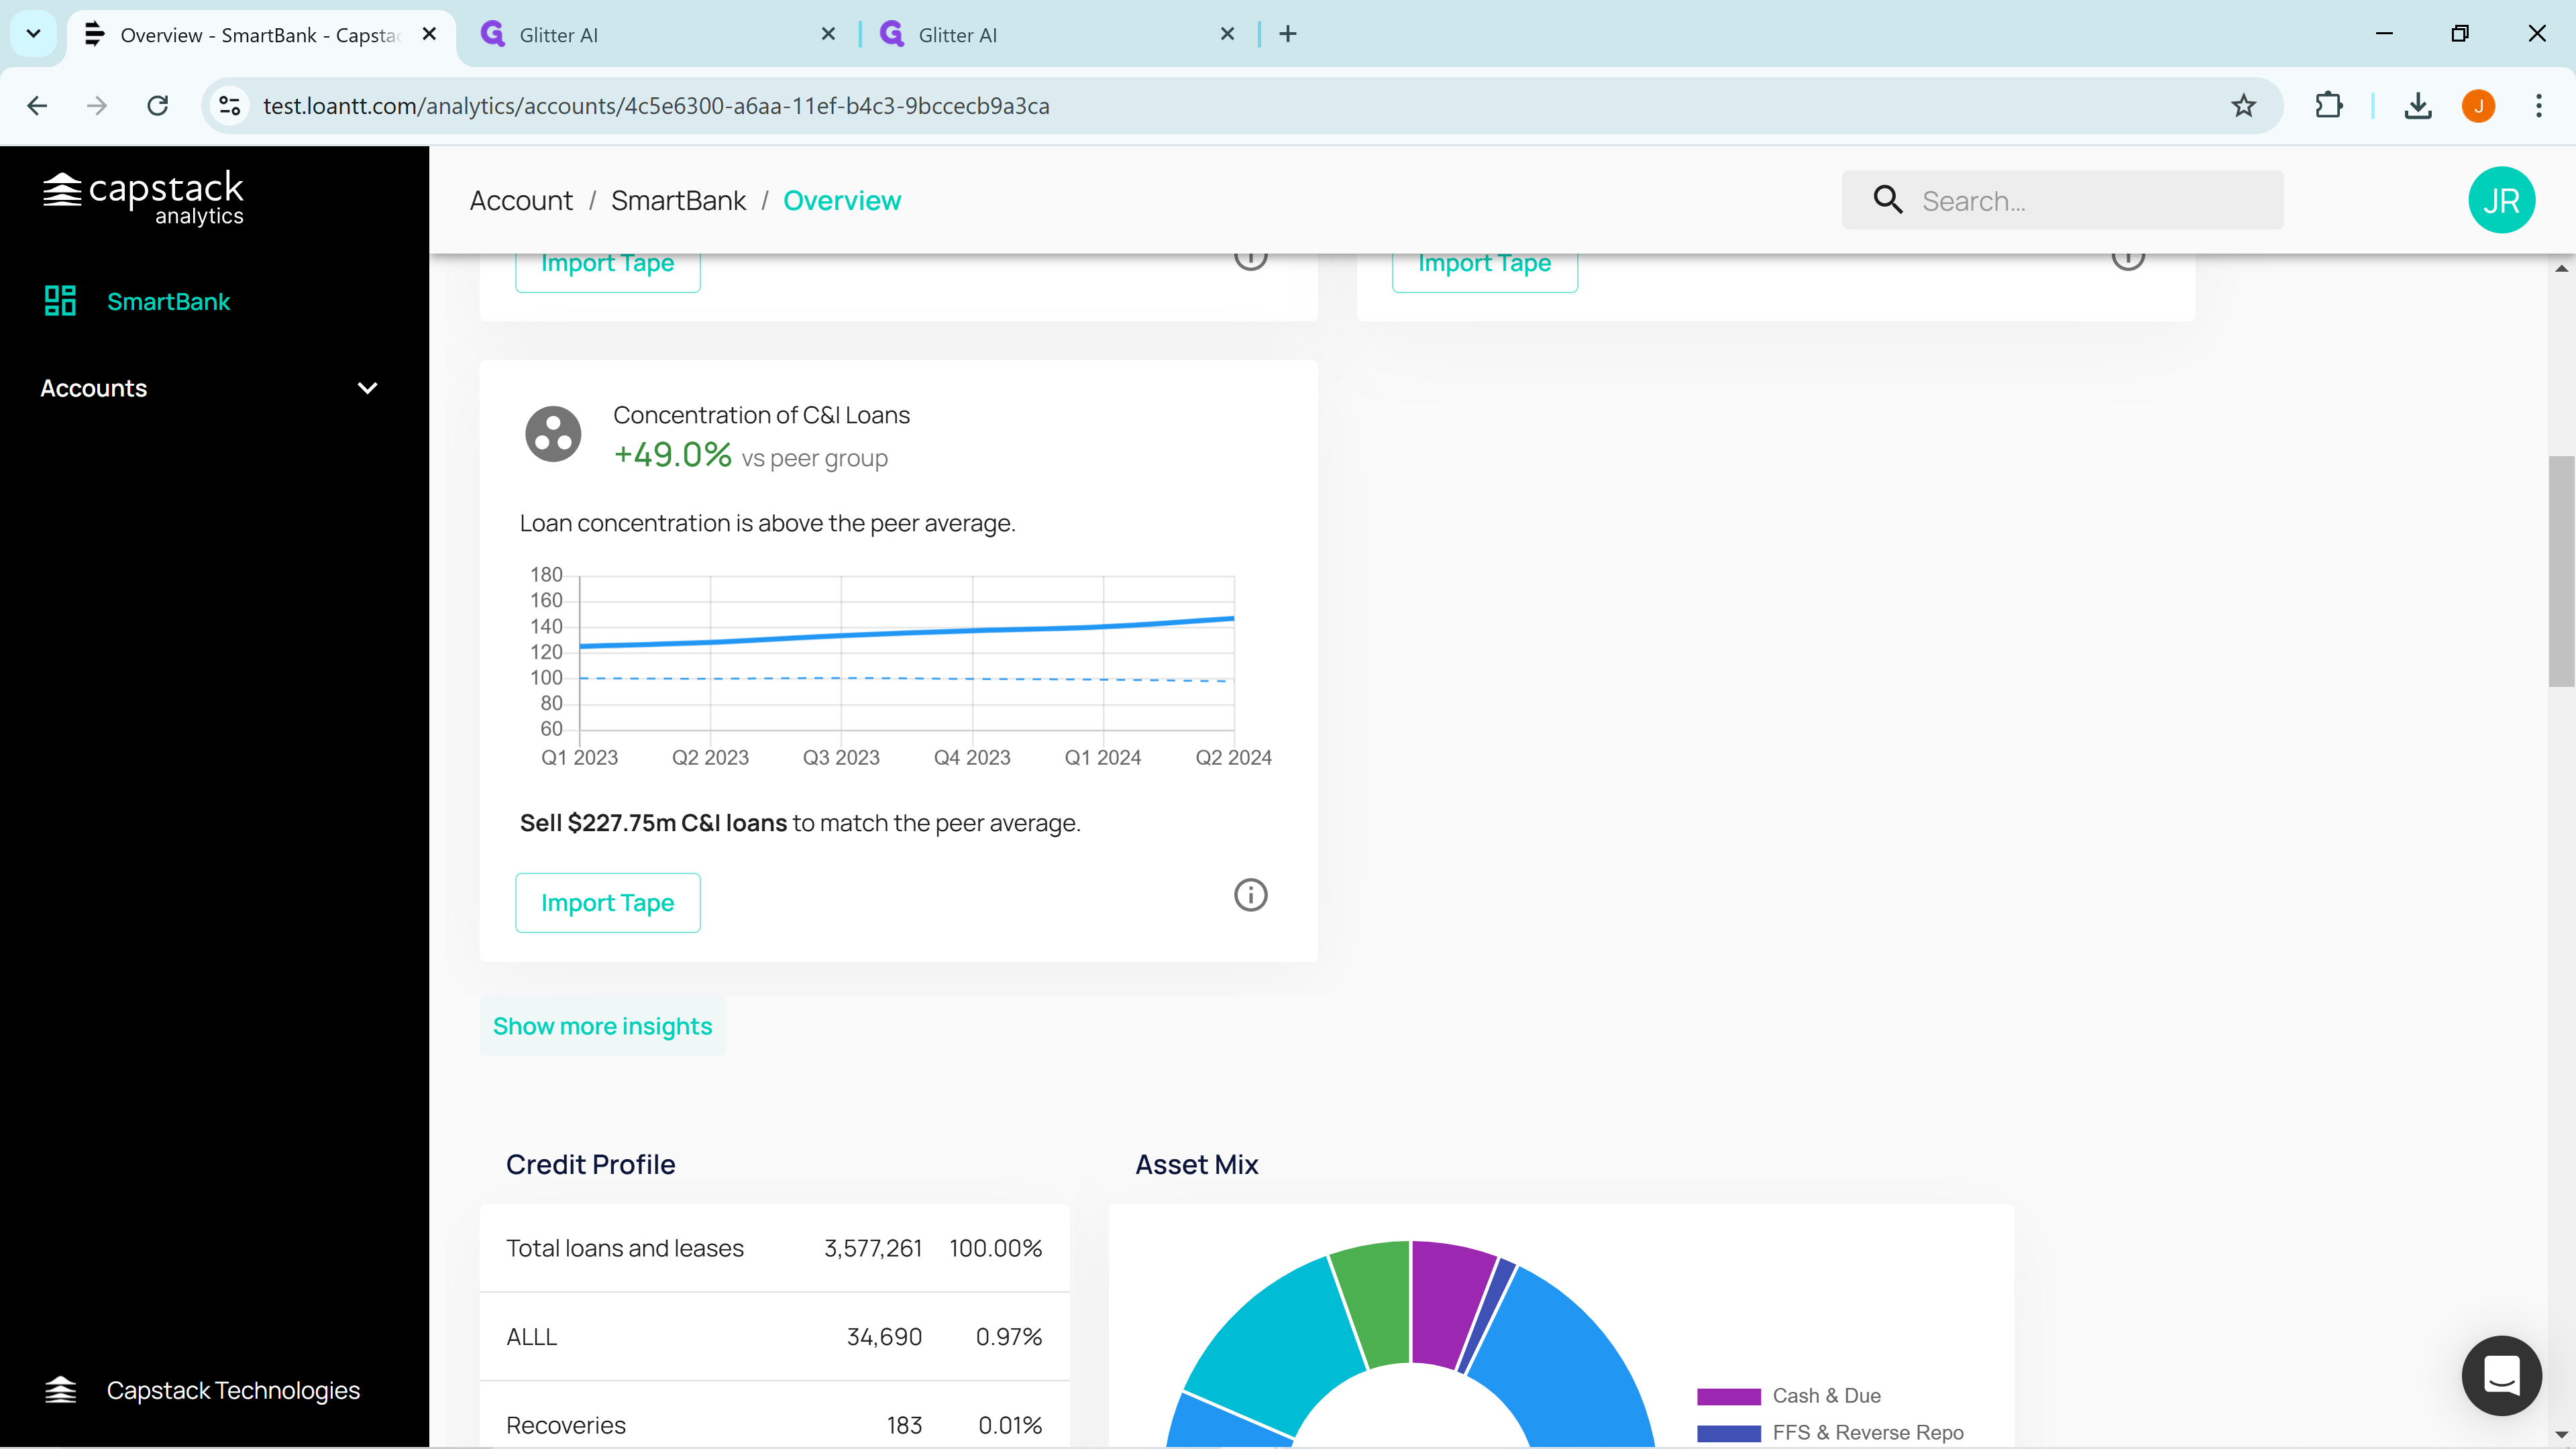
If you want to see more insights, simply click on "Show More Insights" to view the many additional insights below.
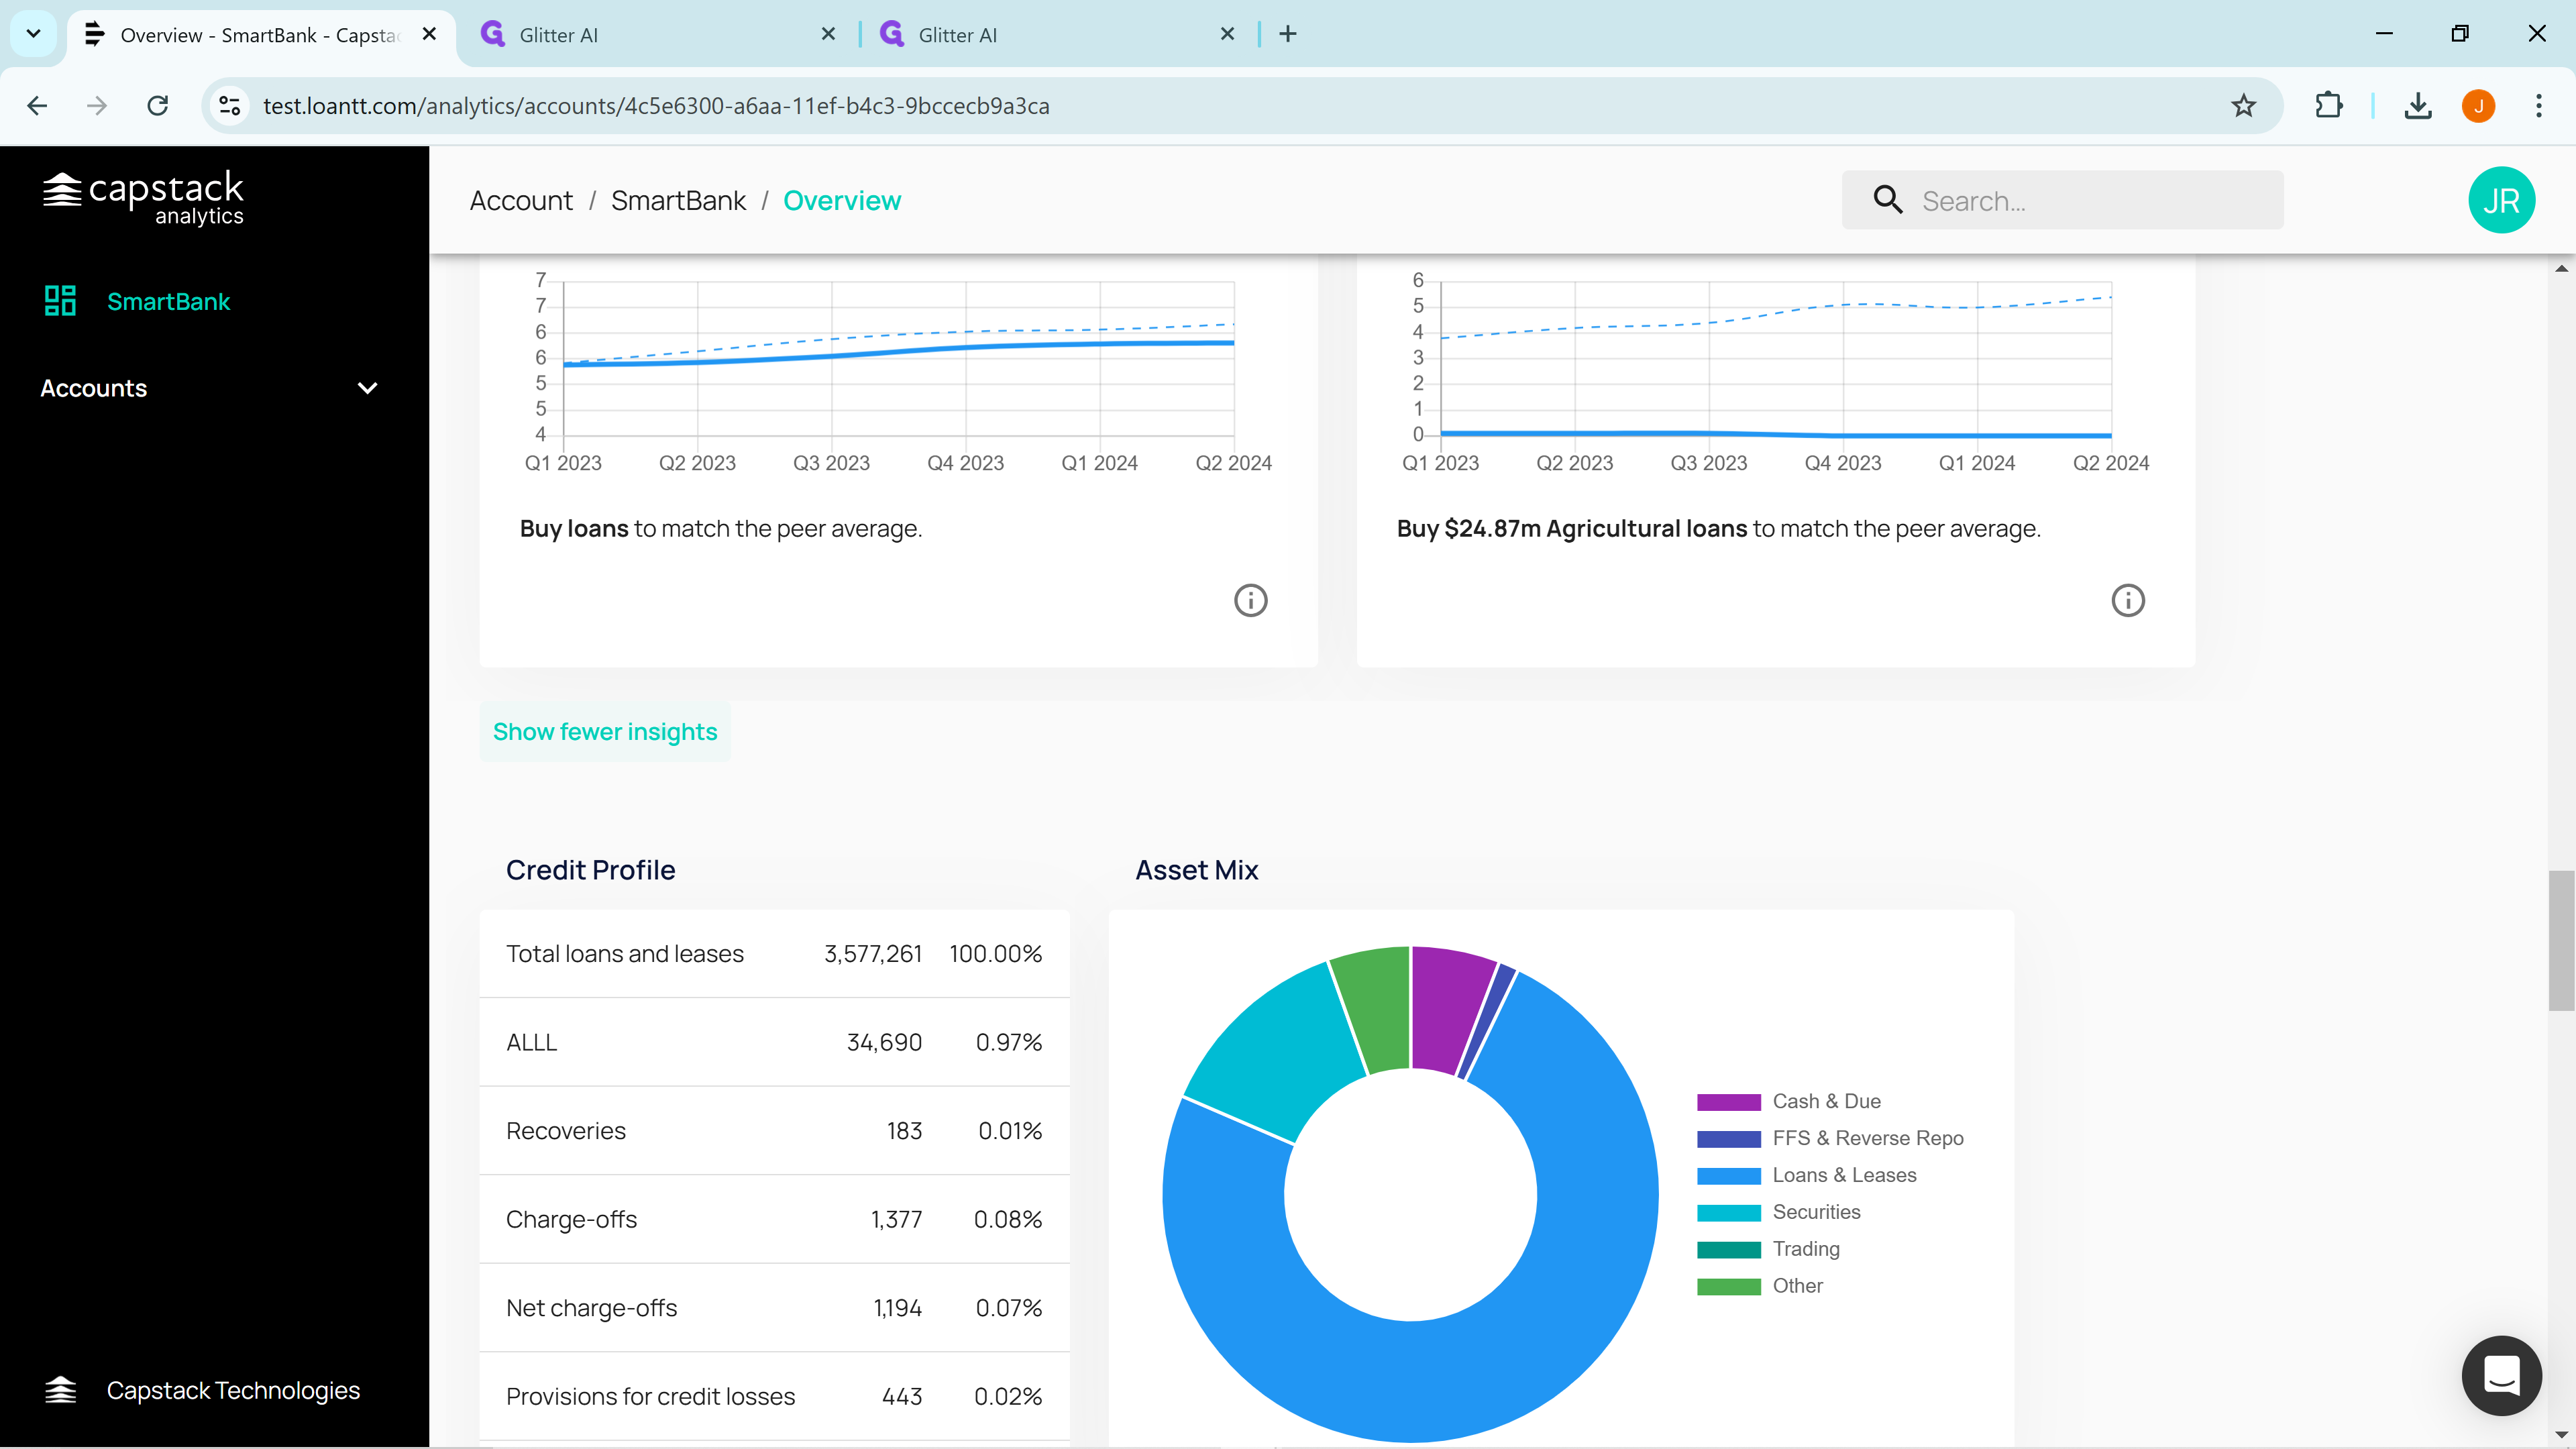
To reduce the number of insights displayed, click on "Show Fewer Insights," at the very bottom of insights and all but the top three will be hidden.
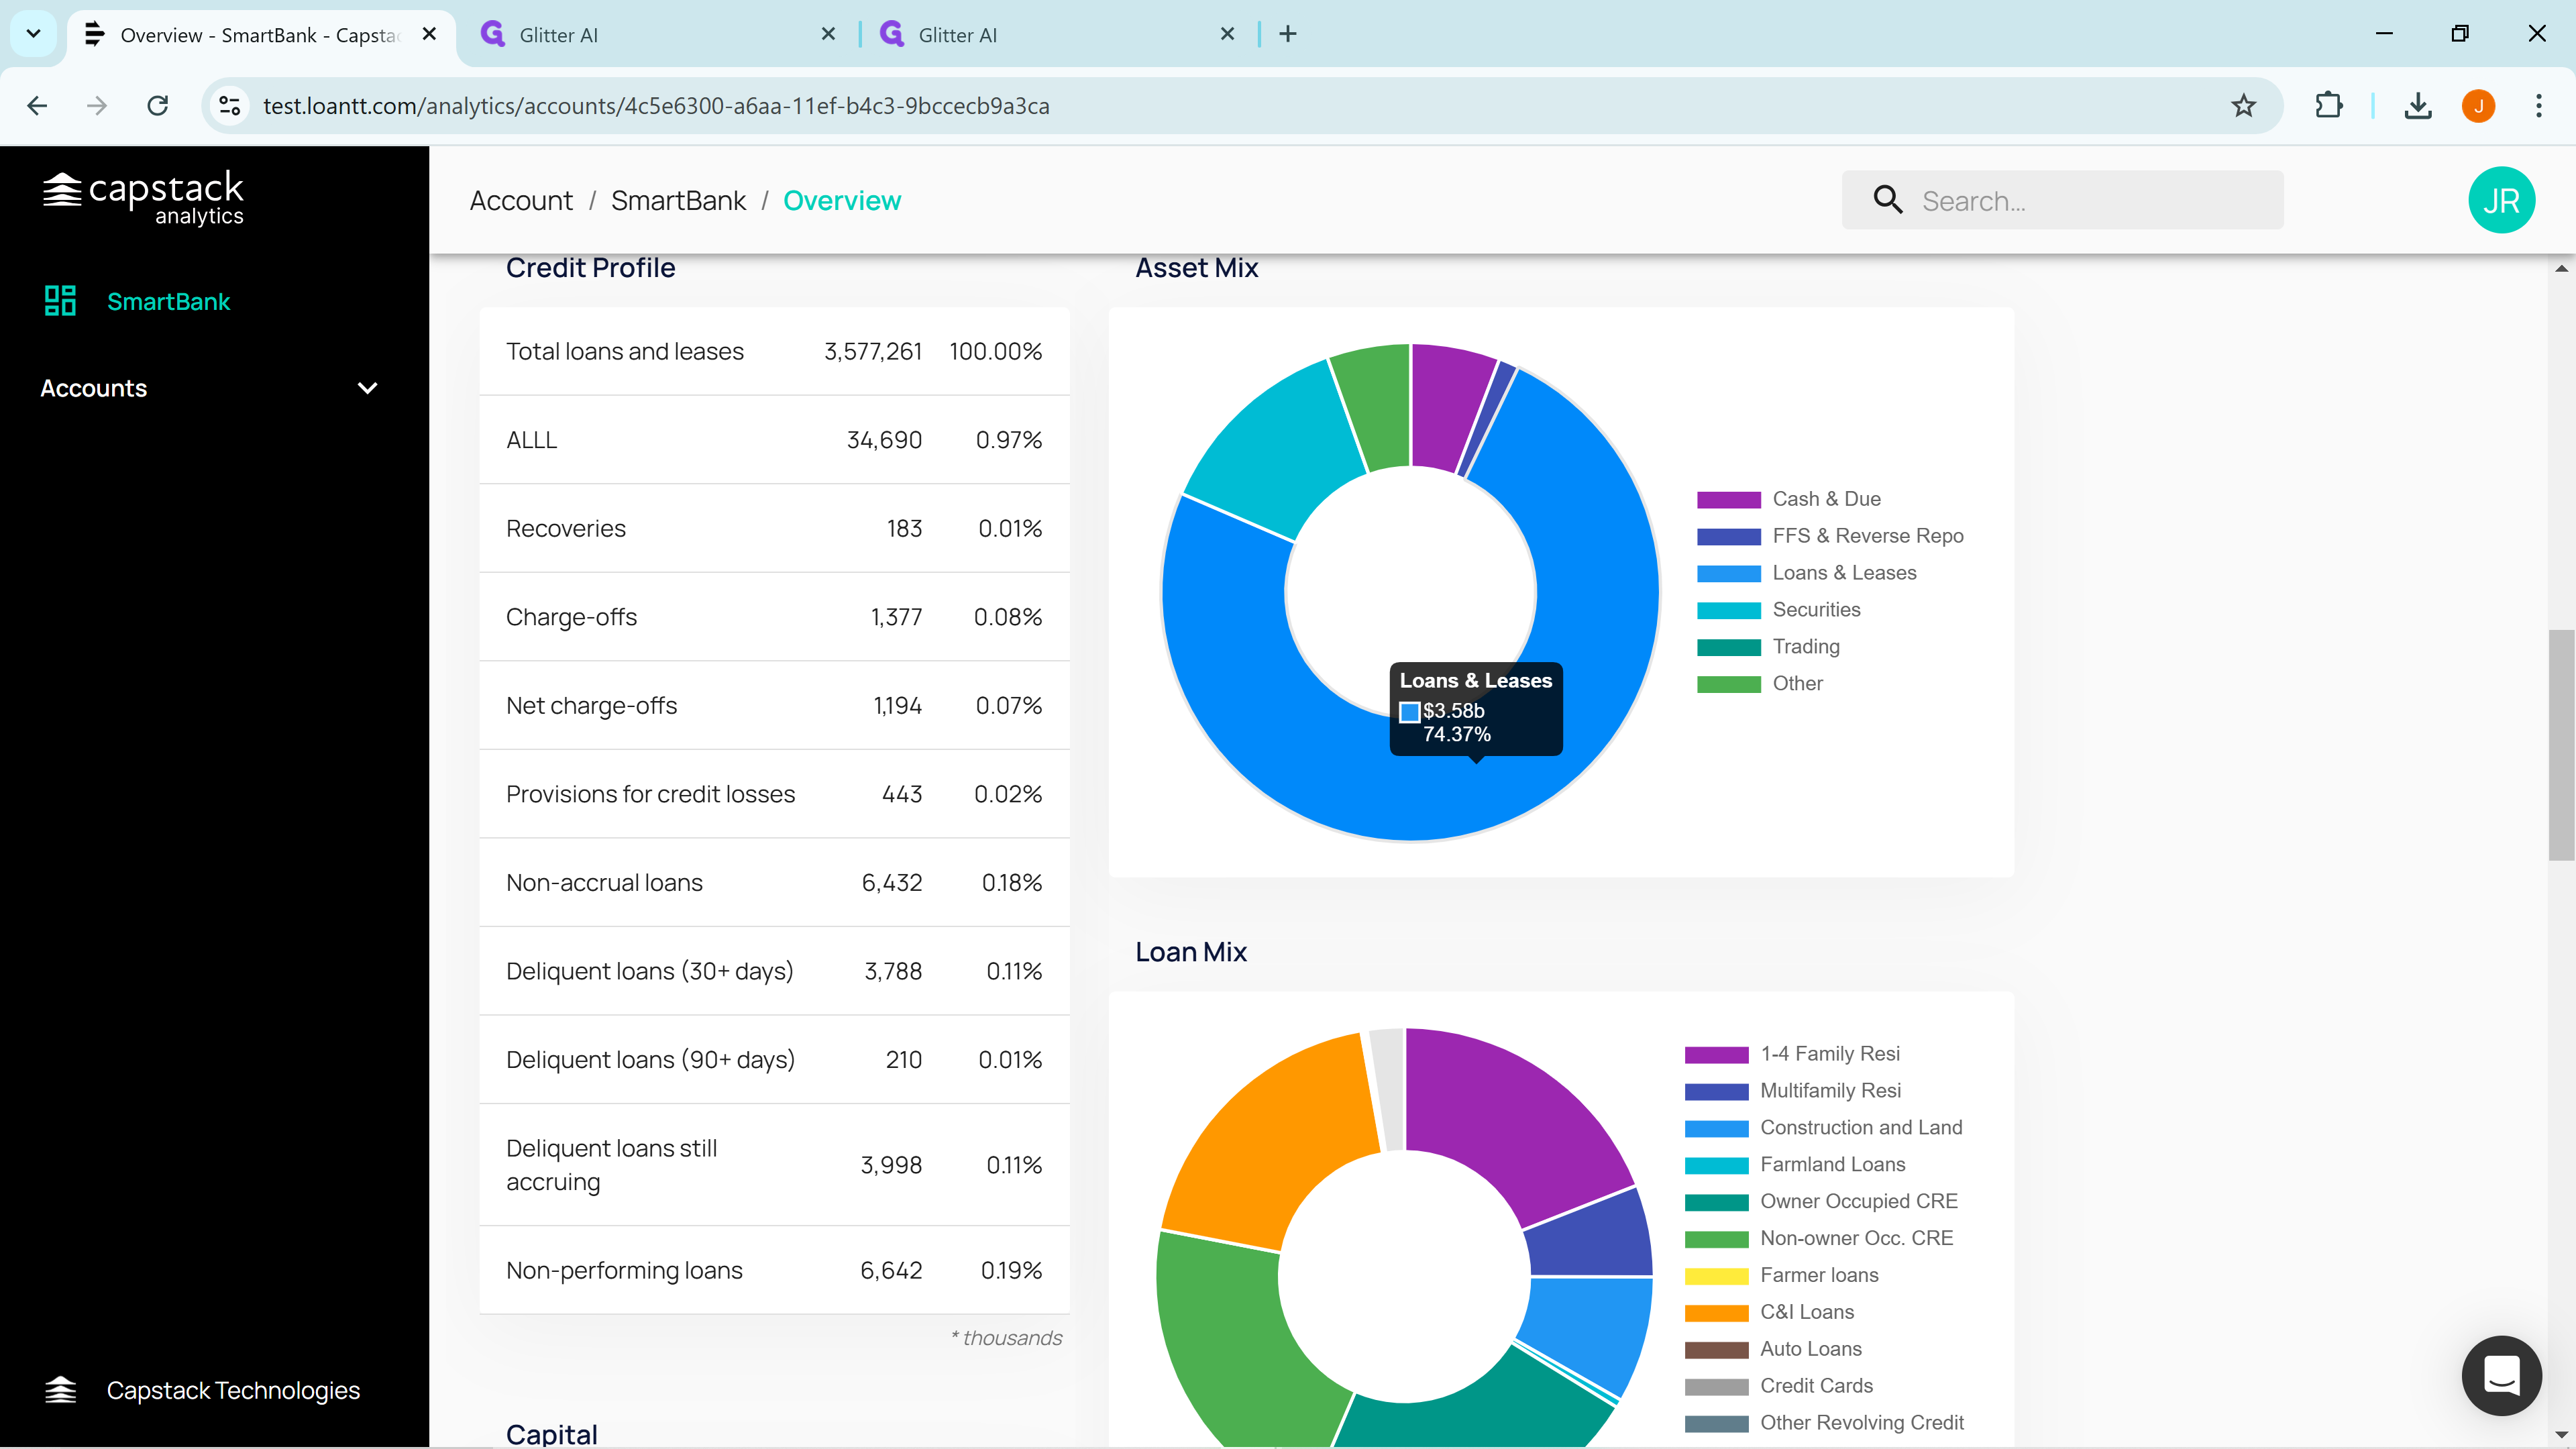
Scroll down below the insights to see your bank's credit profile.
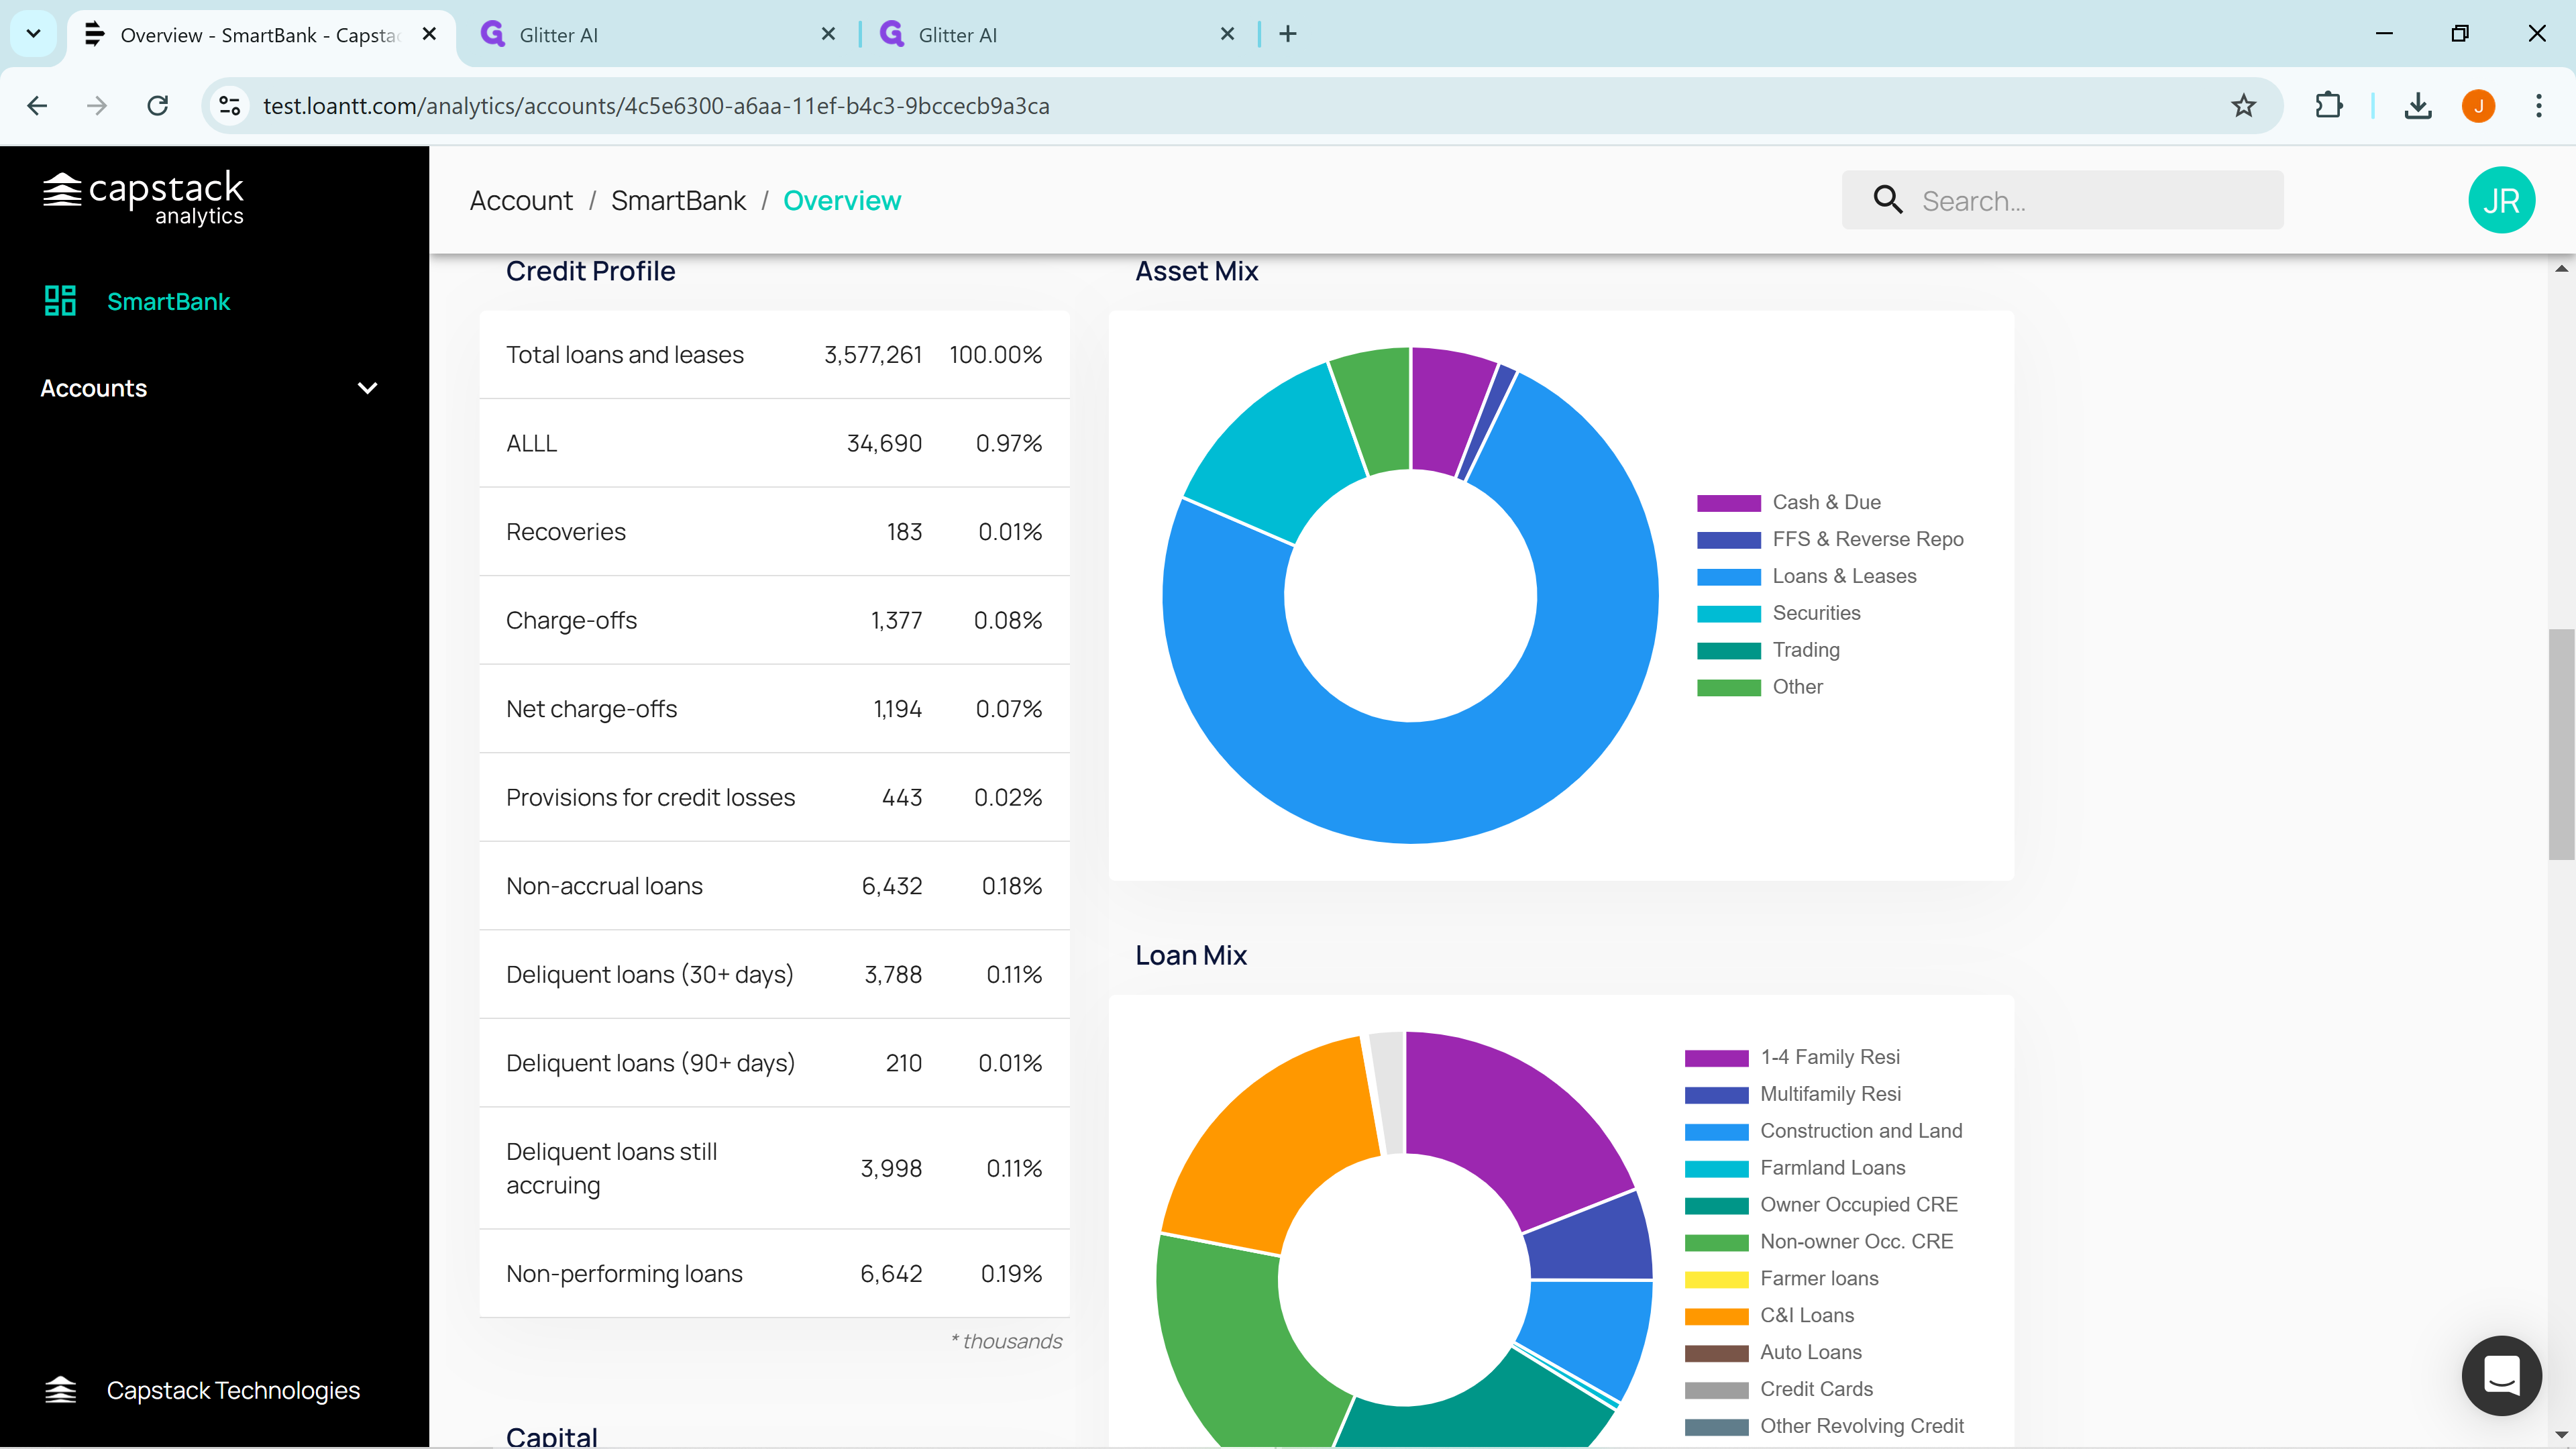
A bank considering purchasing loans from another bank might be interested in the selling bank's underwriting quality. In this case, non-performing loans are only 0.19%, indicating that SmartBank is a strong underwriter with few problem loans.
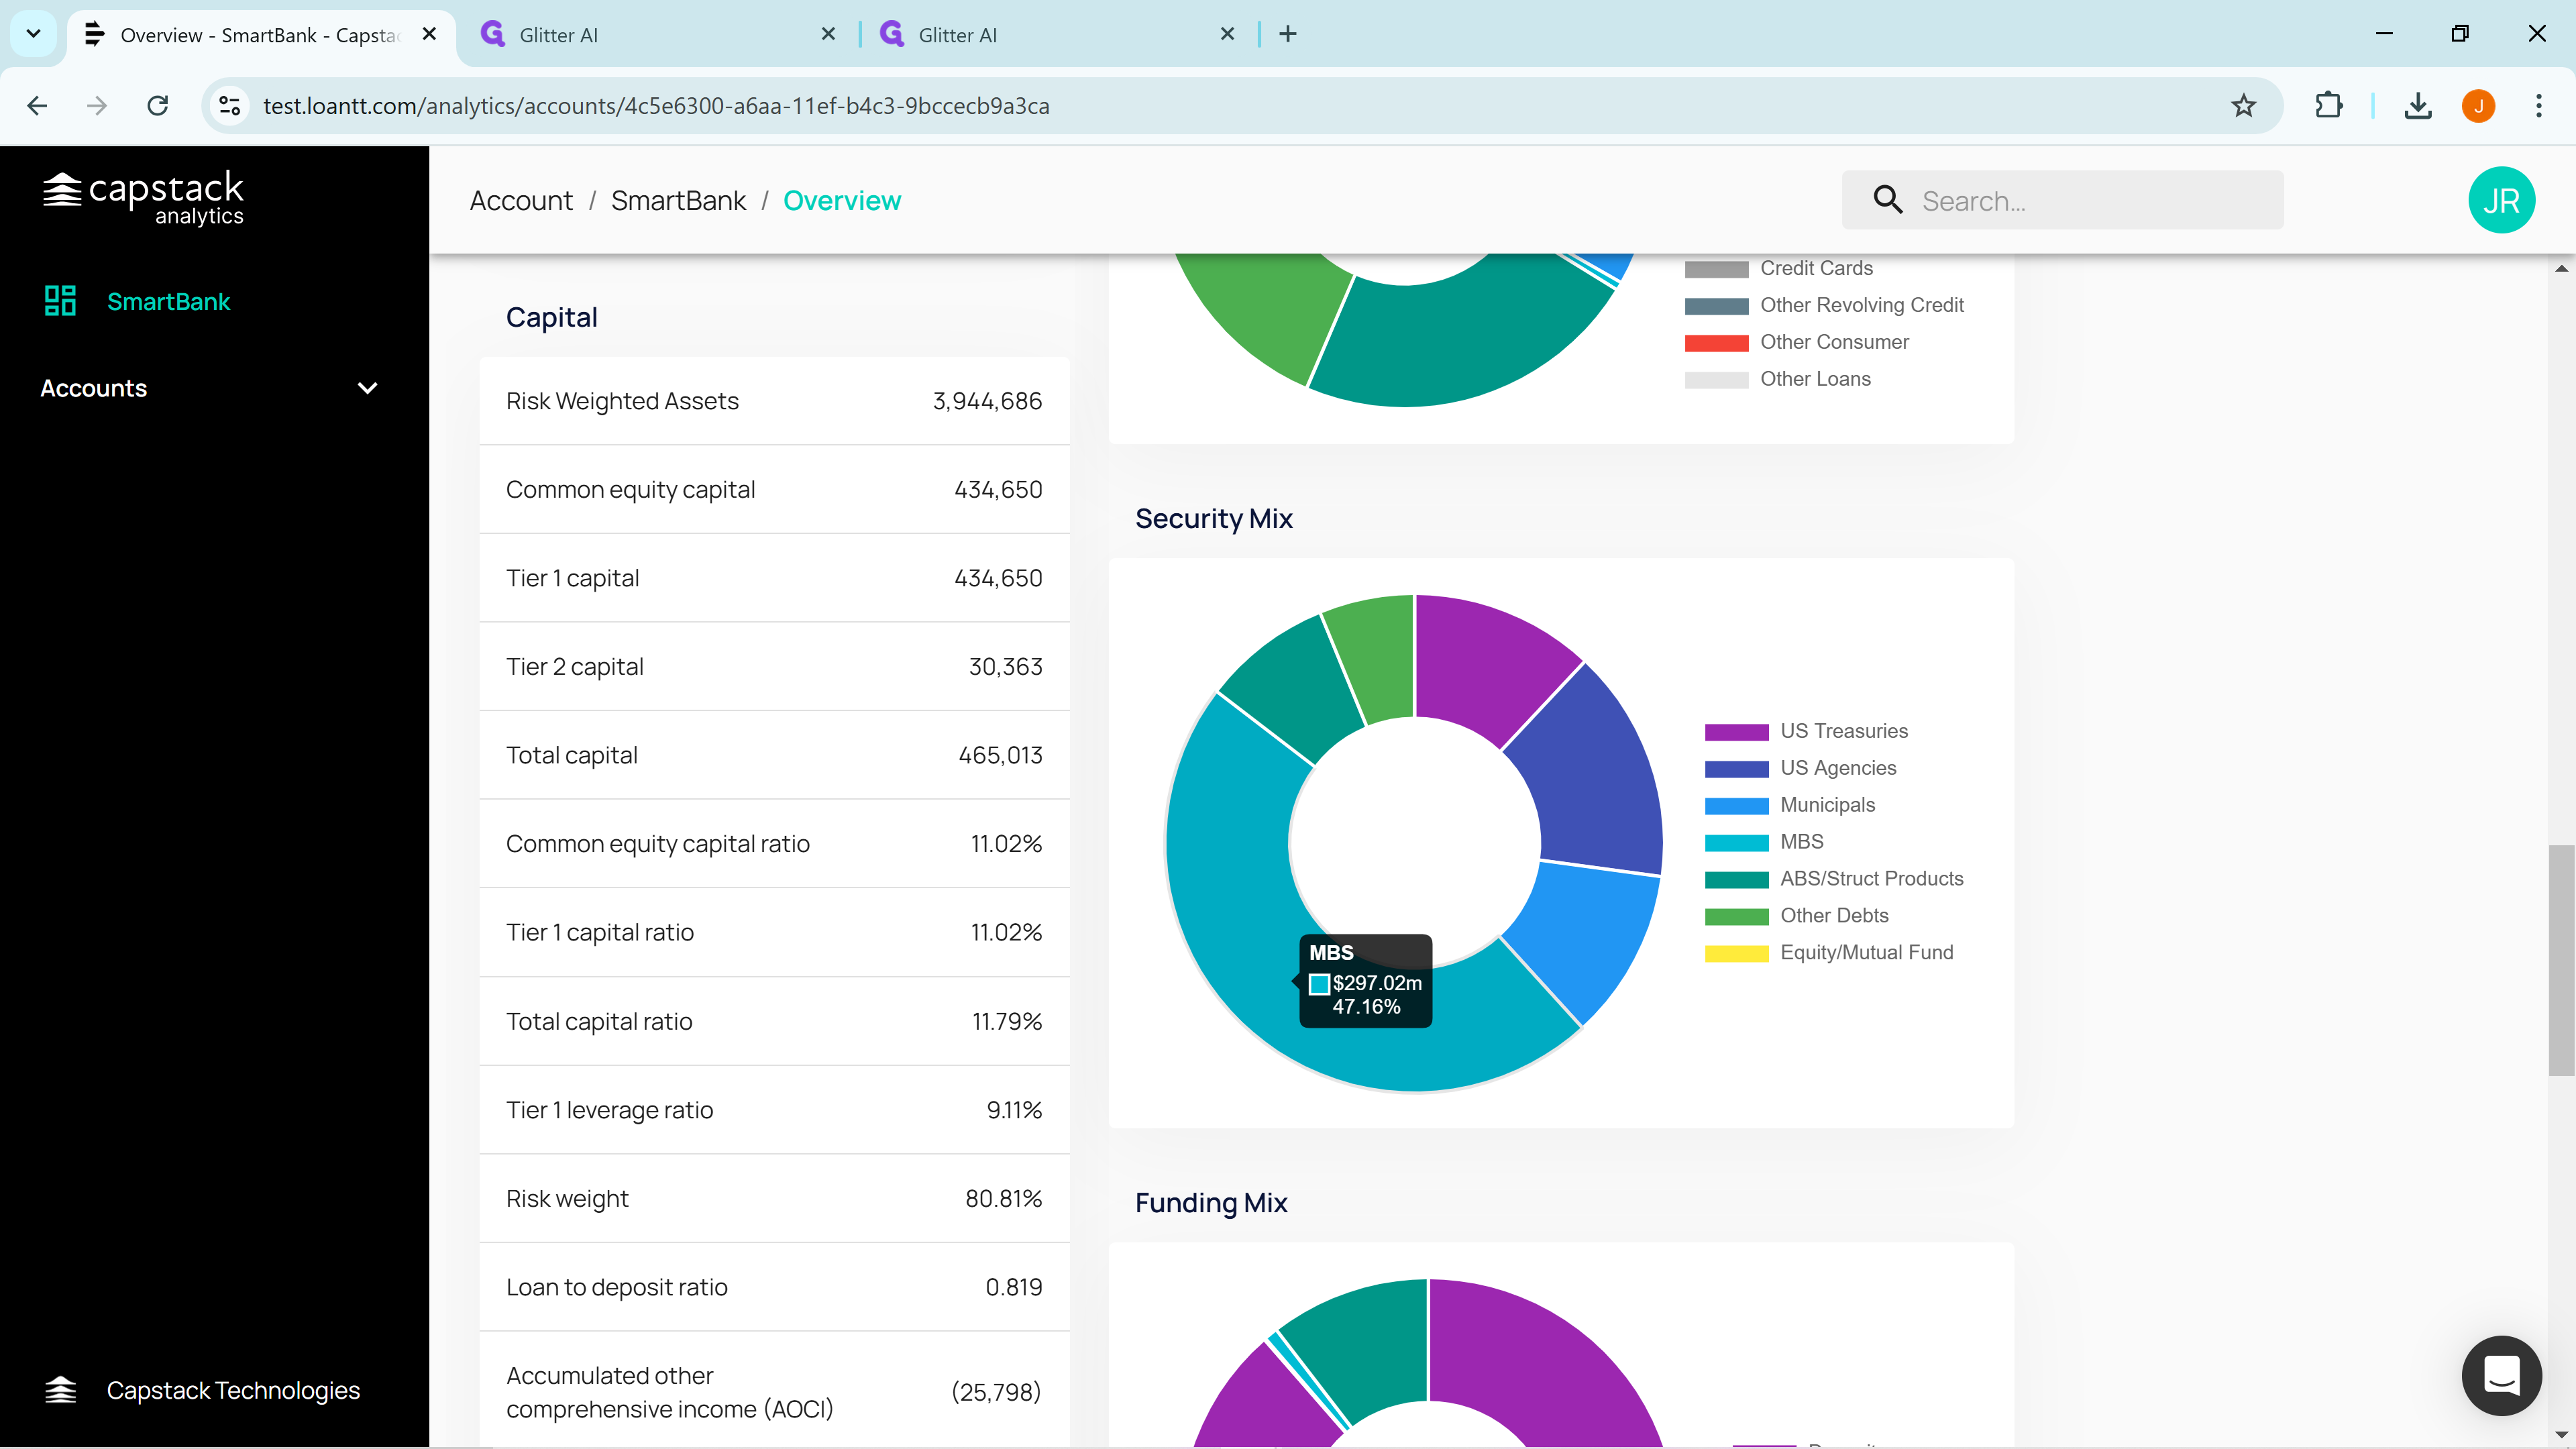
Continue scrolling down to the display of your bank's capital data, ratios, risk weight, and loan to deposit ratio.
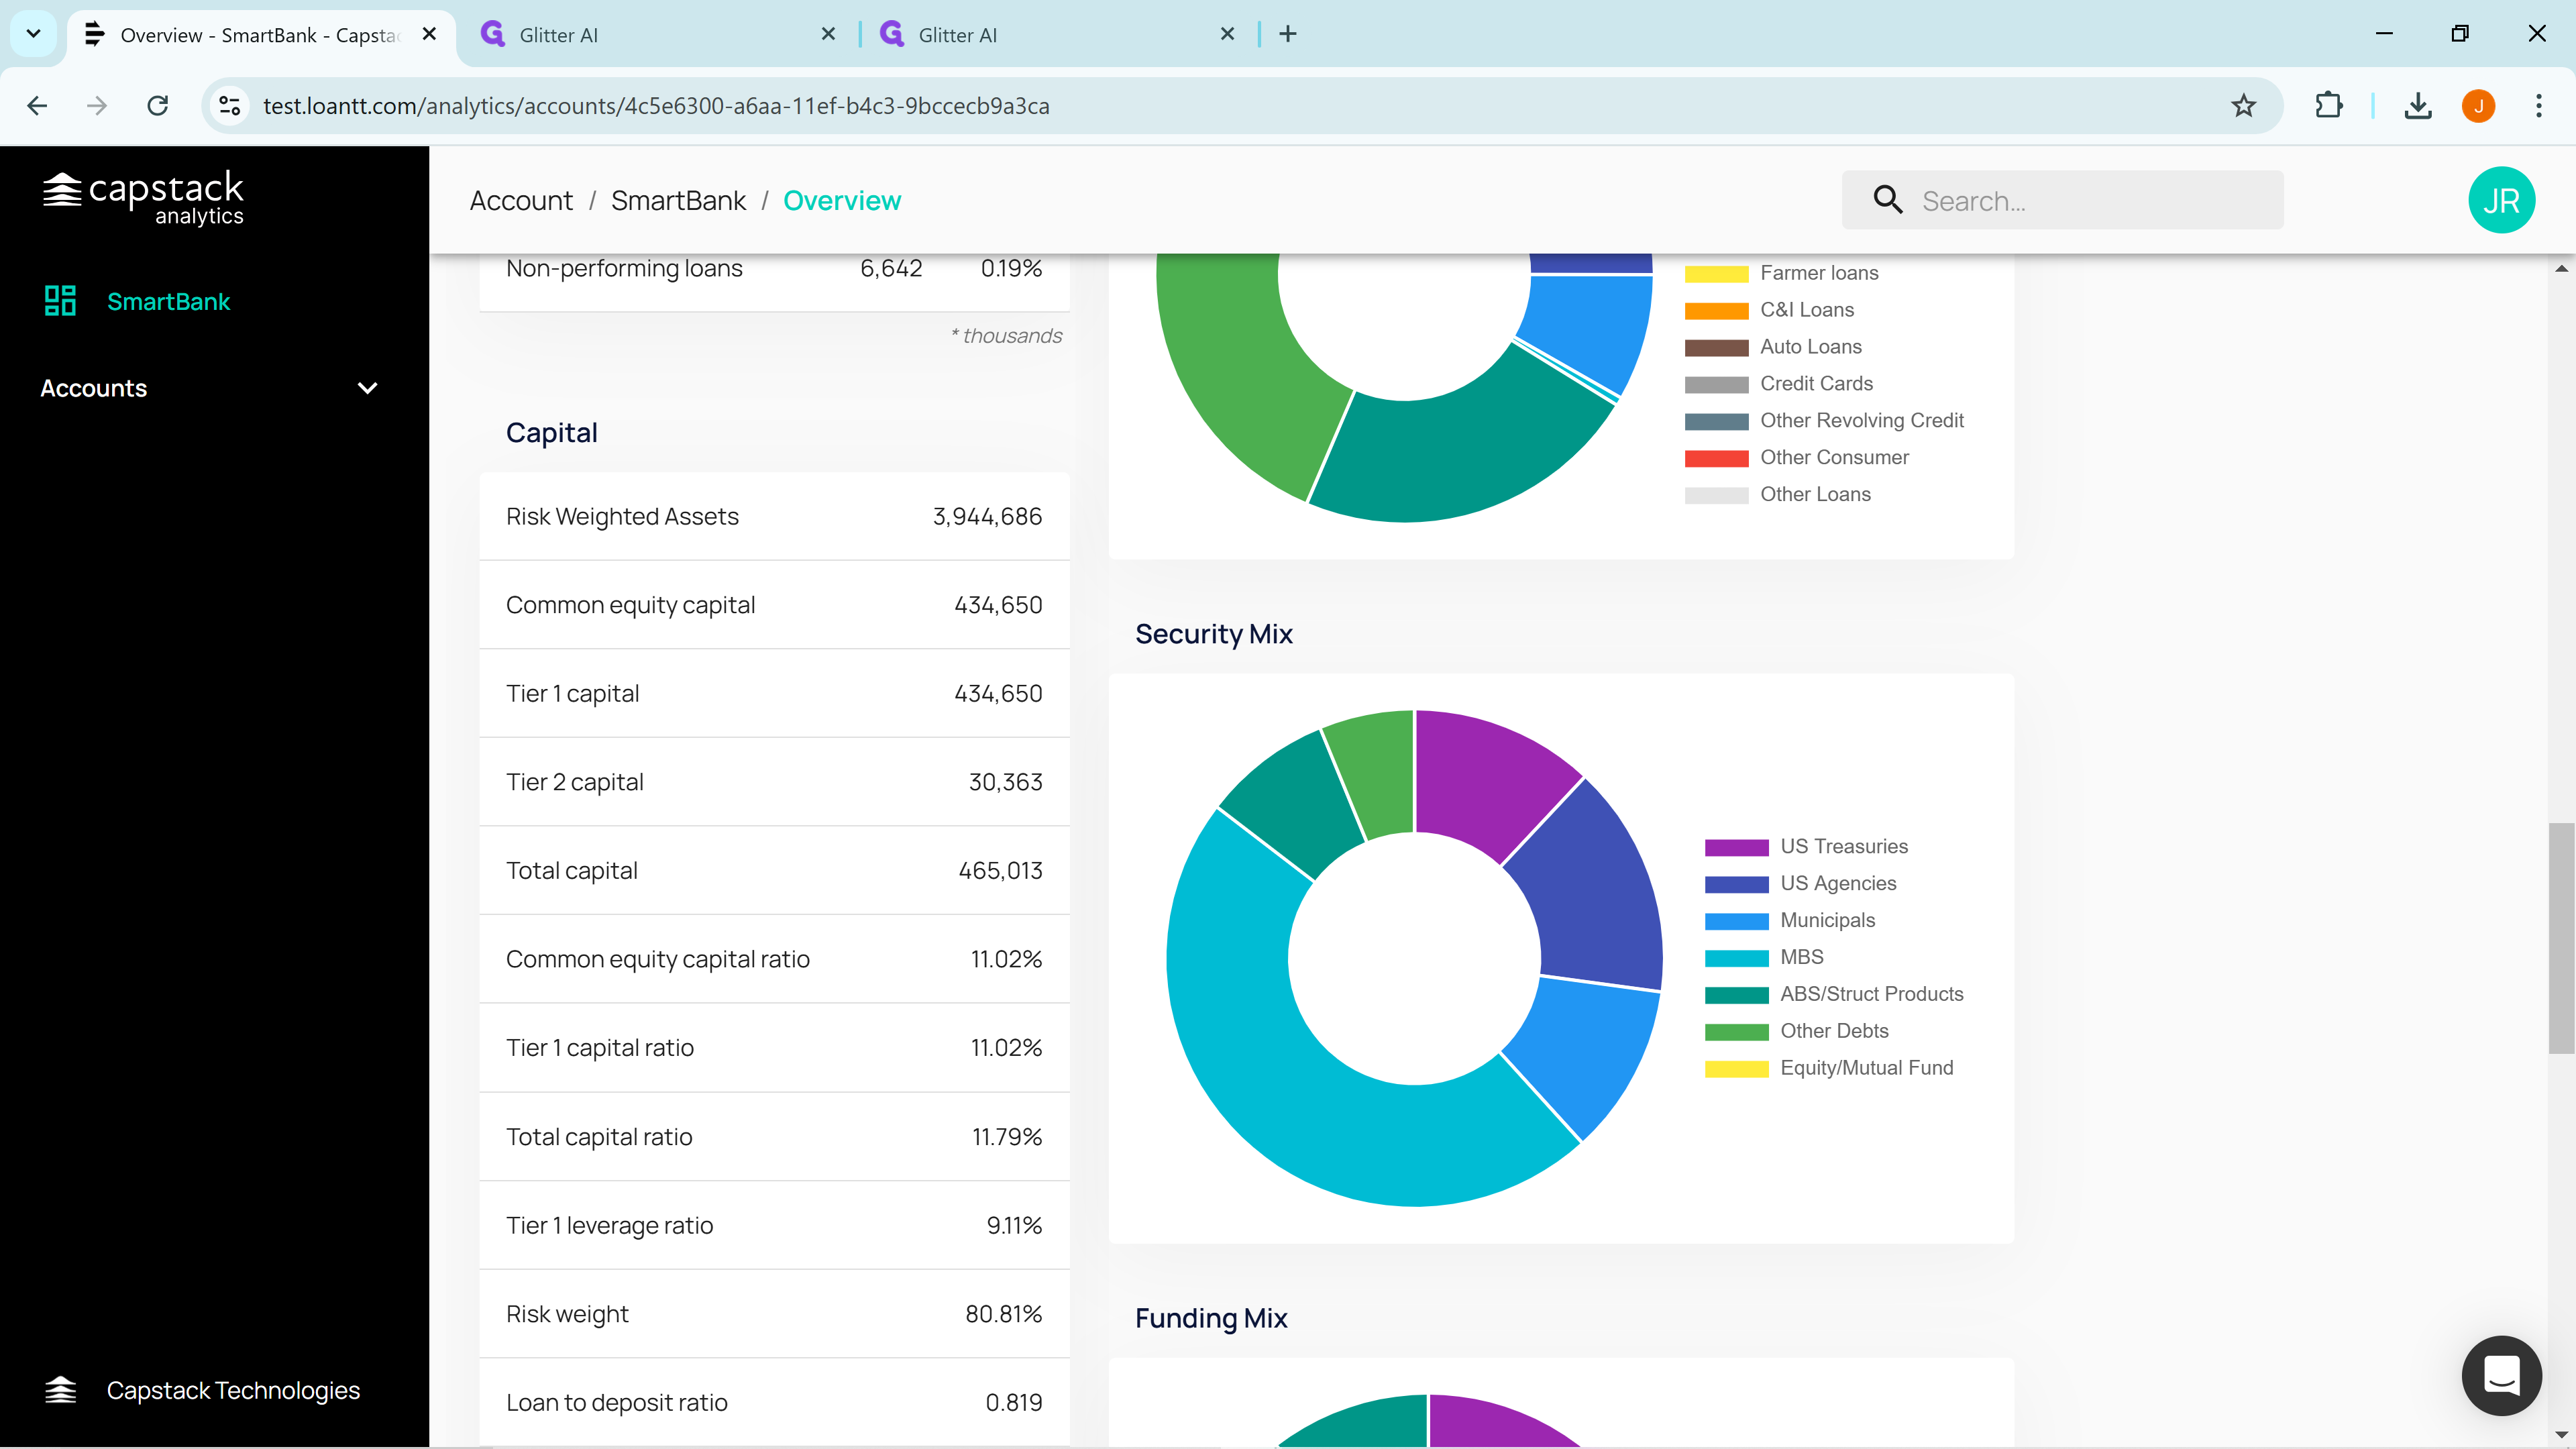
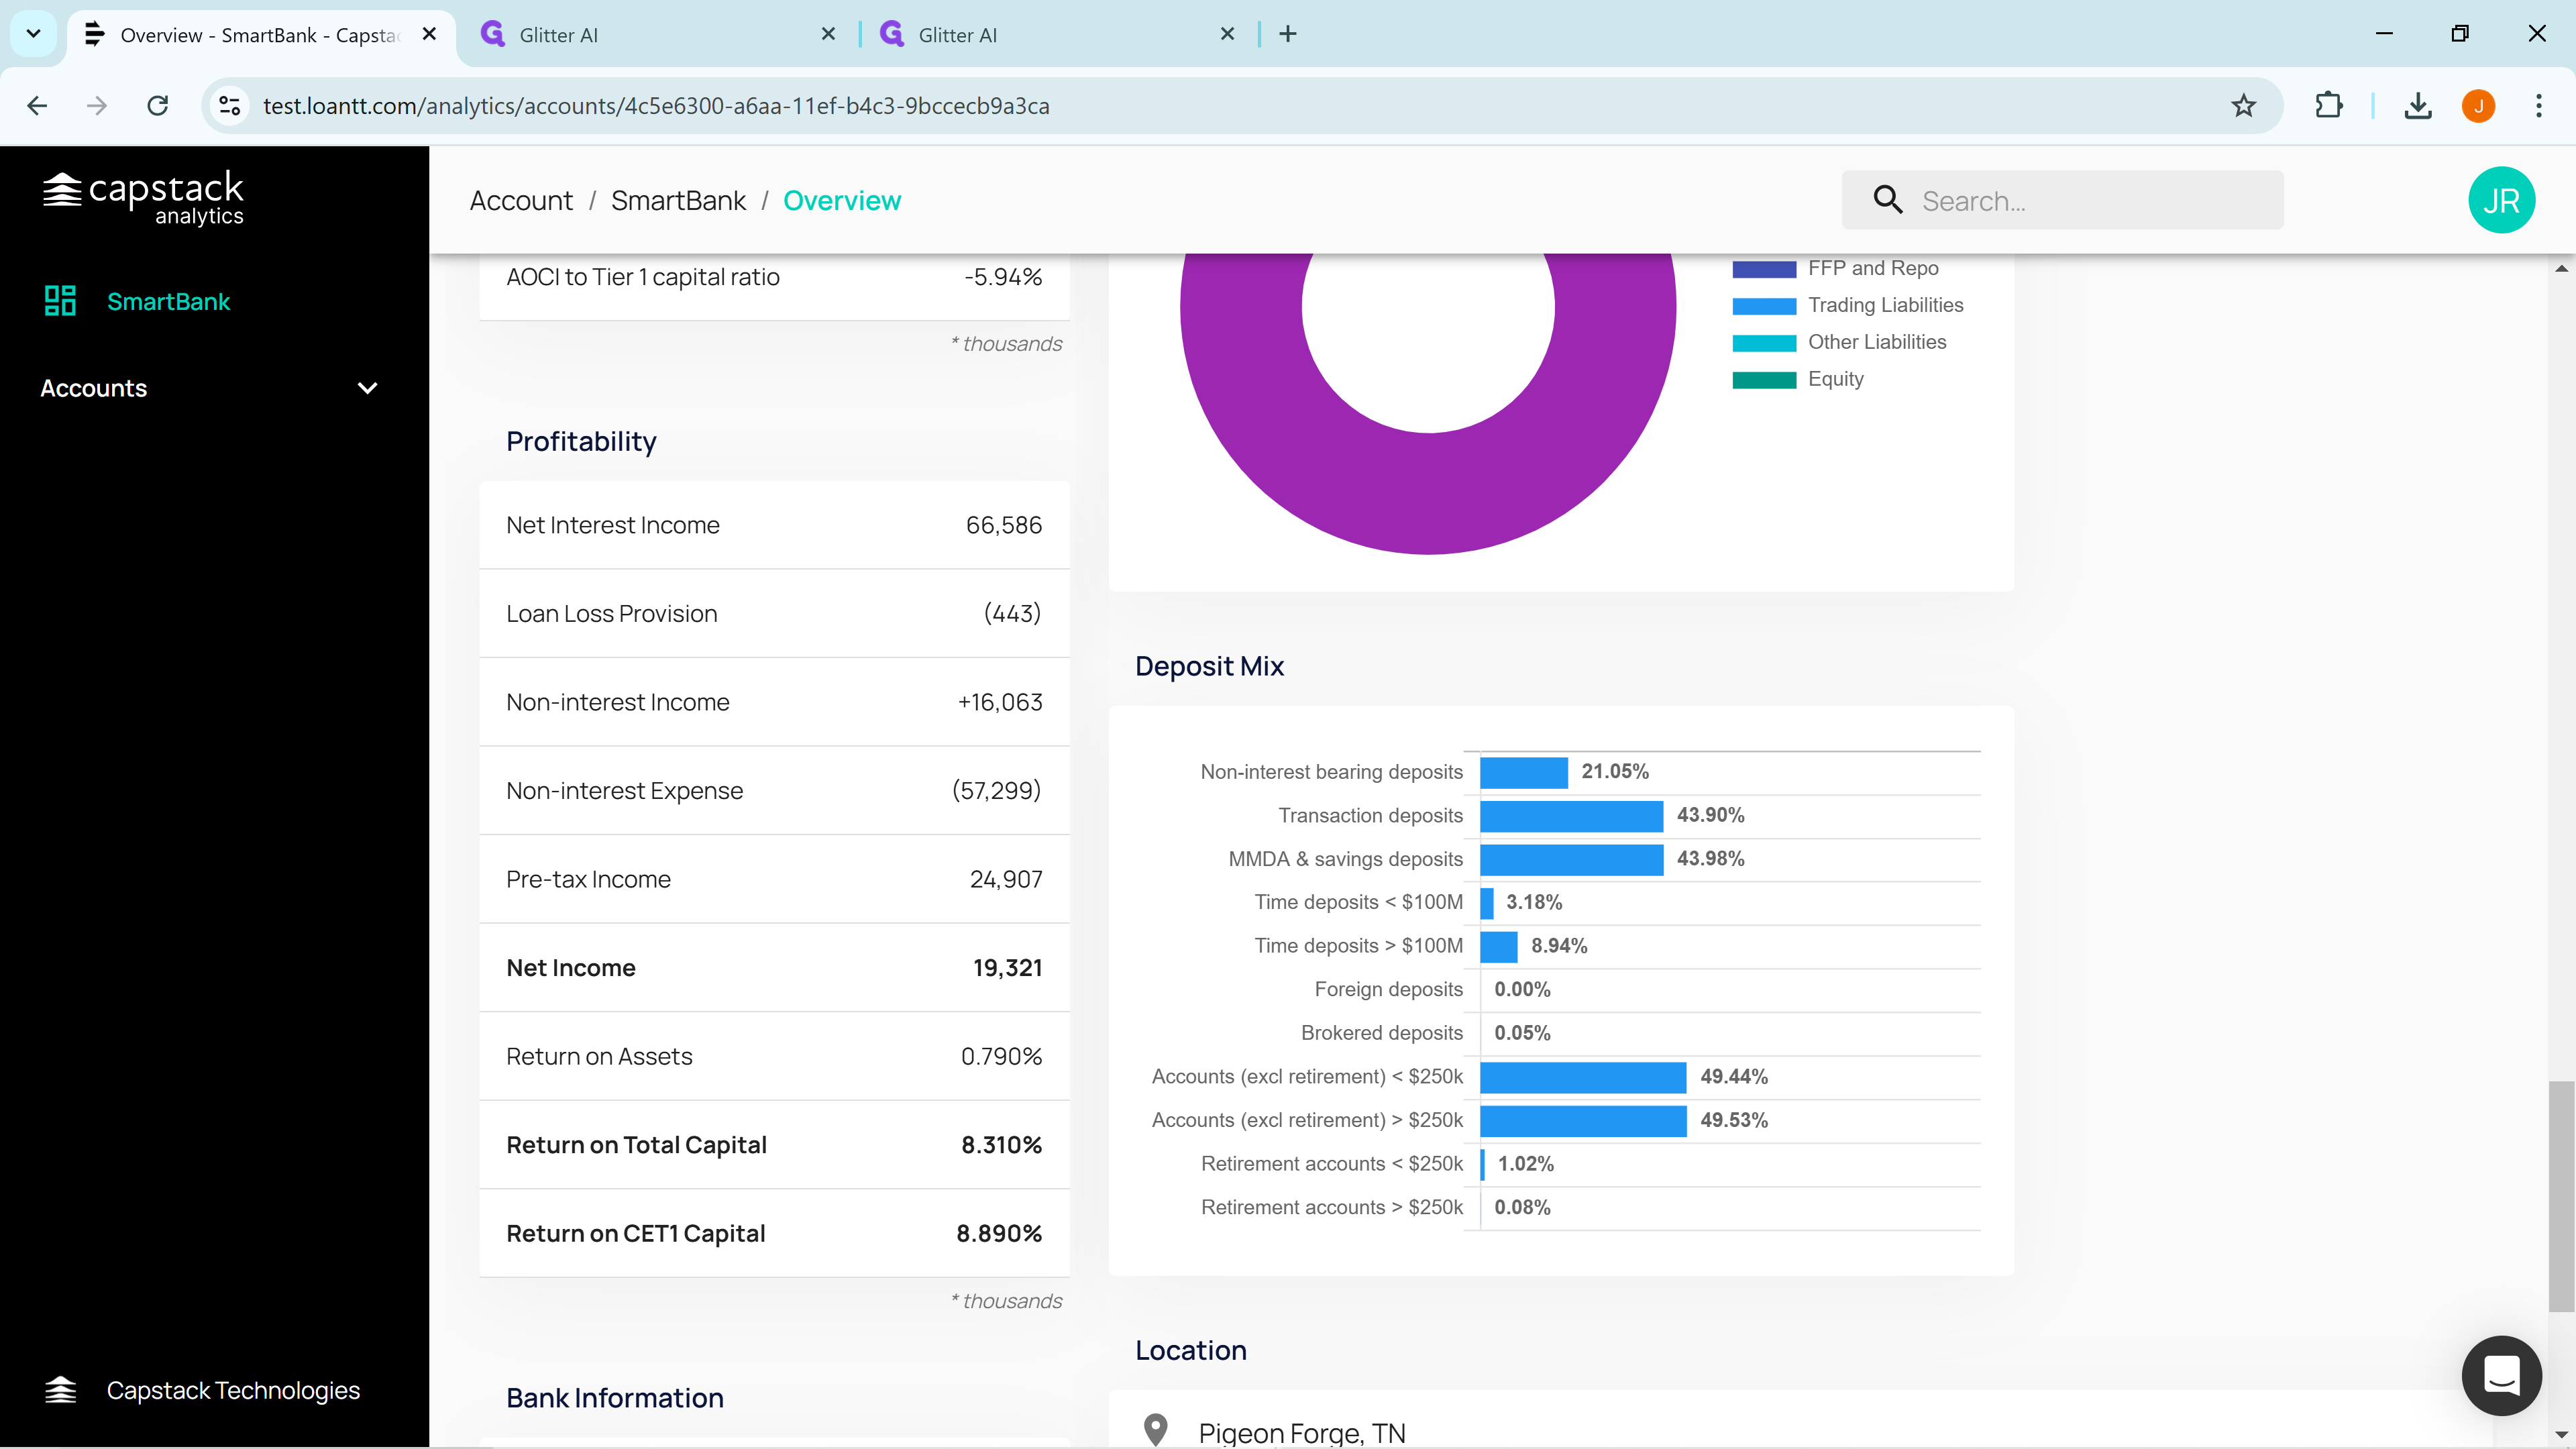
As you continue to scroll down we display profitability and return on capital metrics.
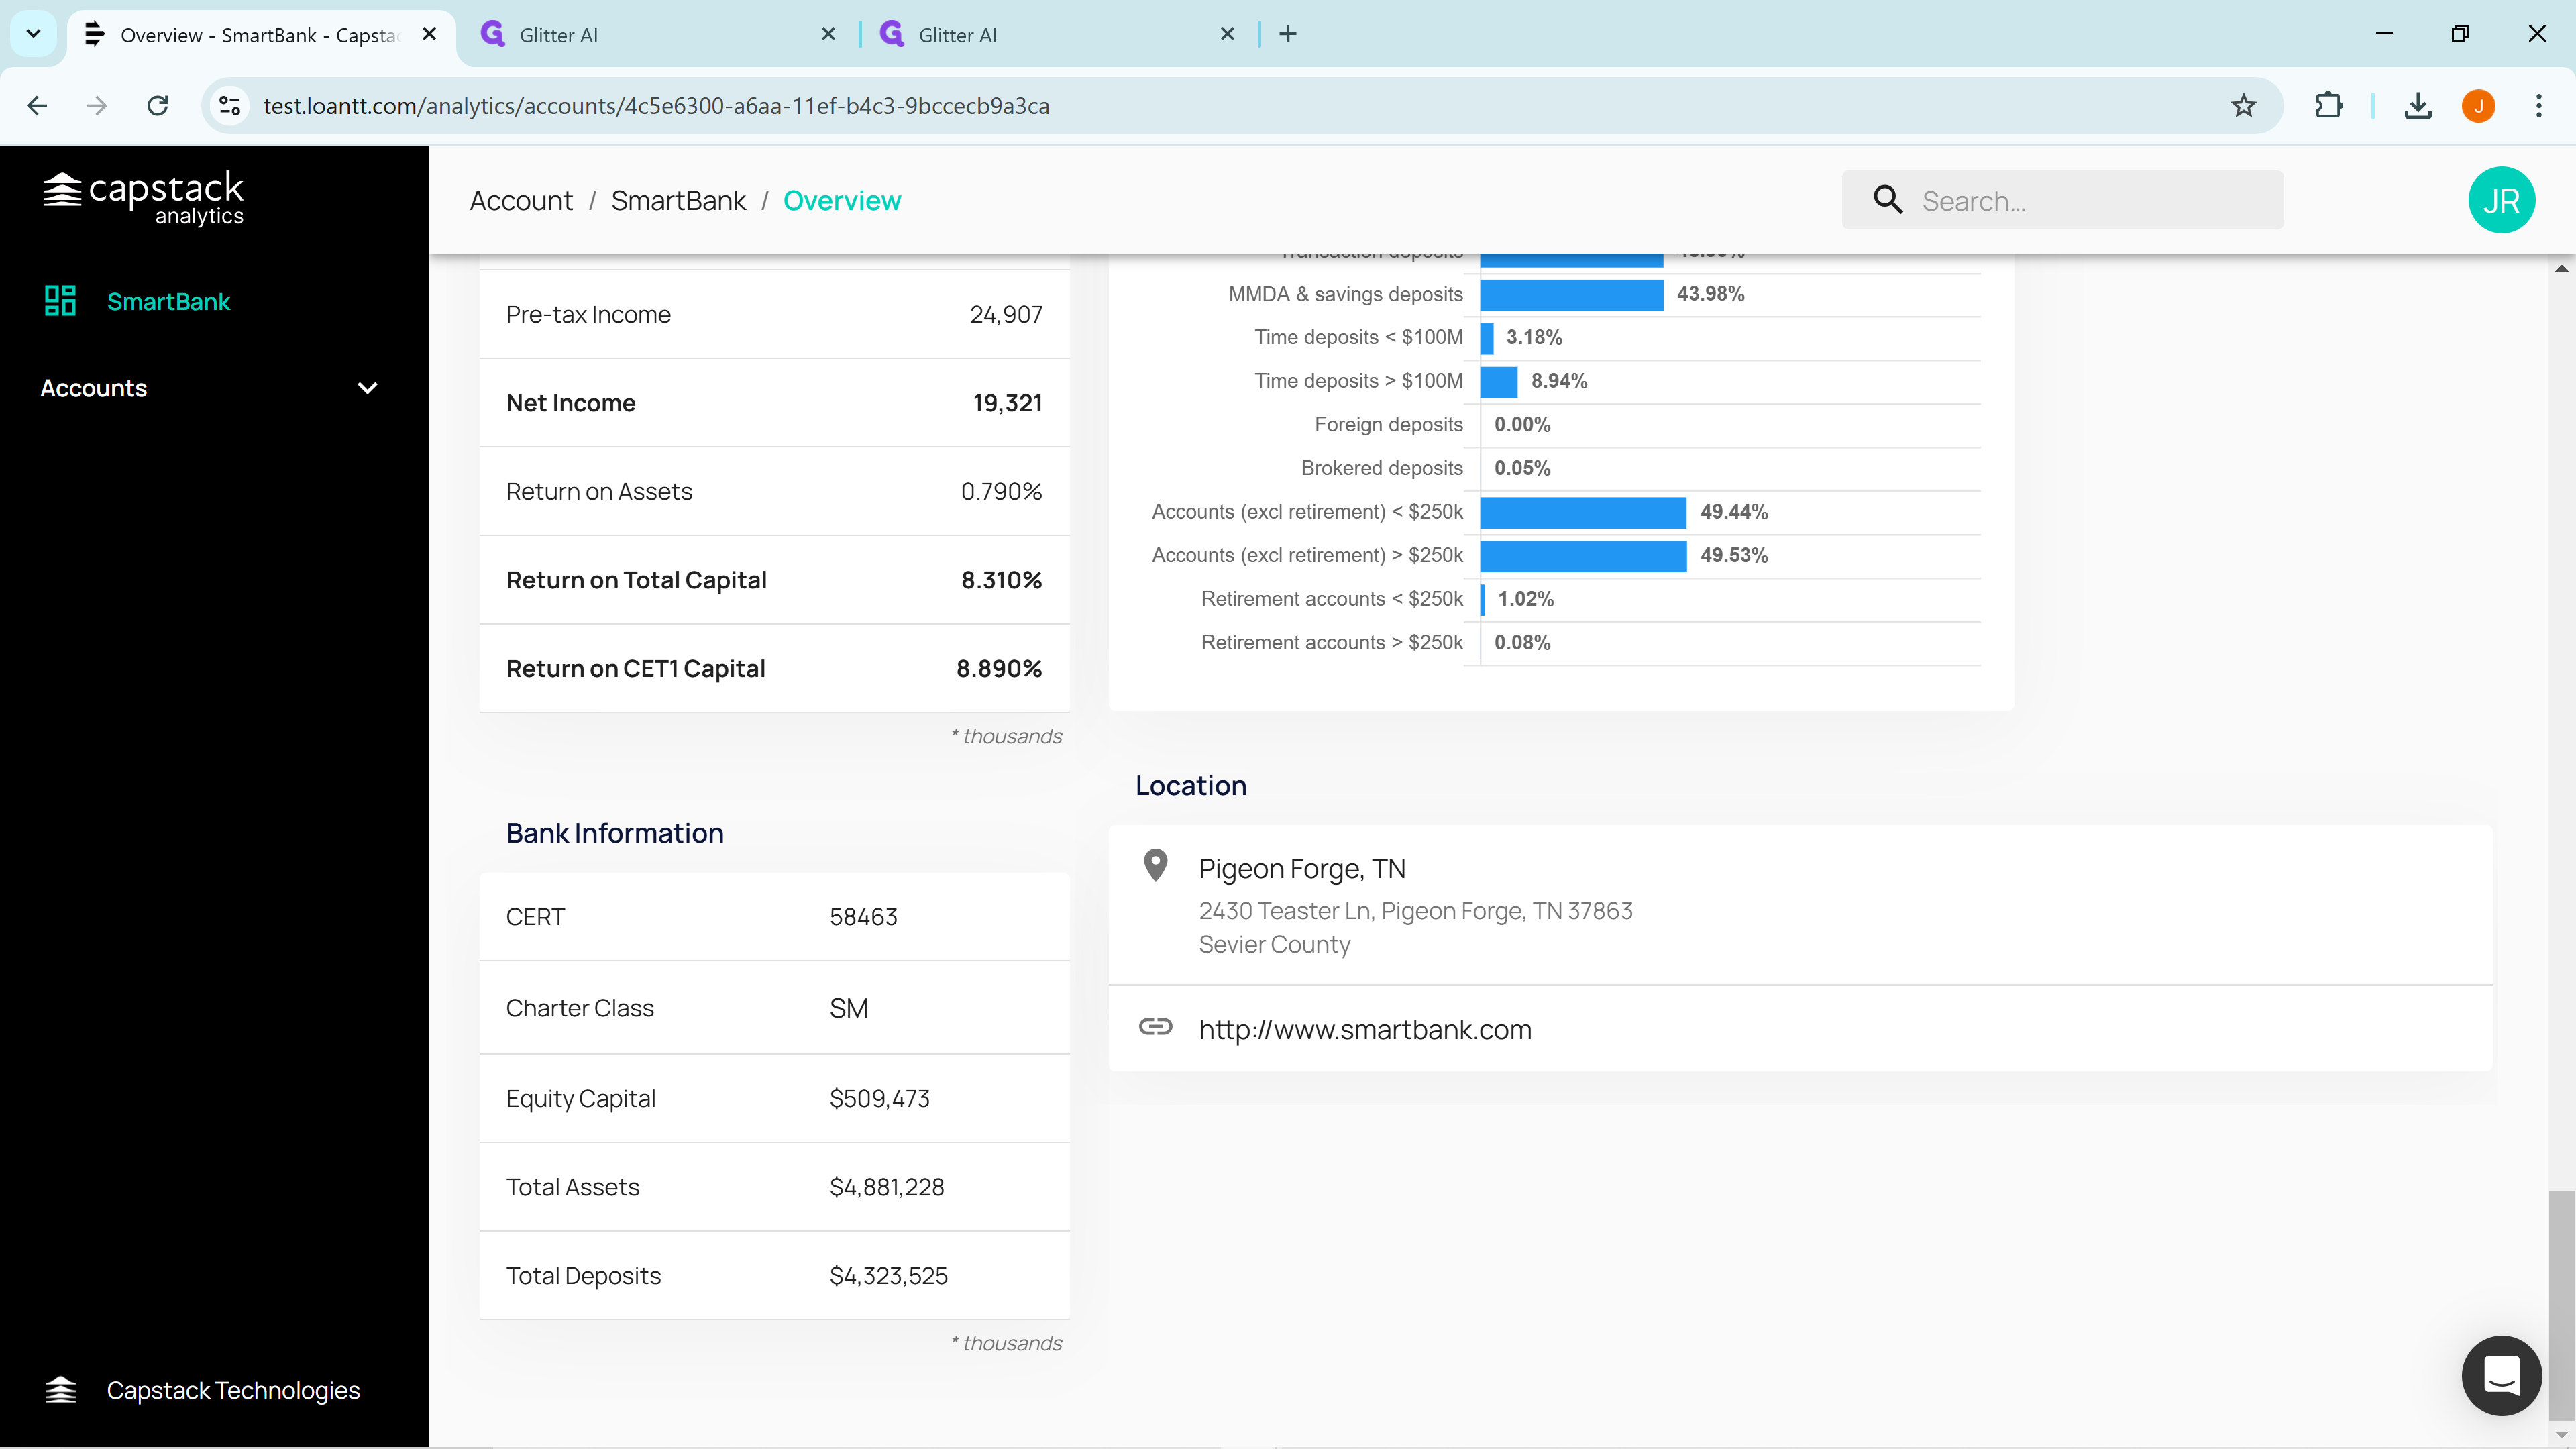
And finally on the bottom left side we show basic bank information such as FDIC Number, Charter Class, Total Assets and Total Deposits.
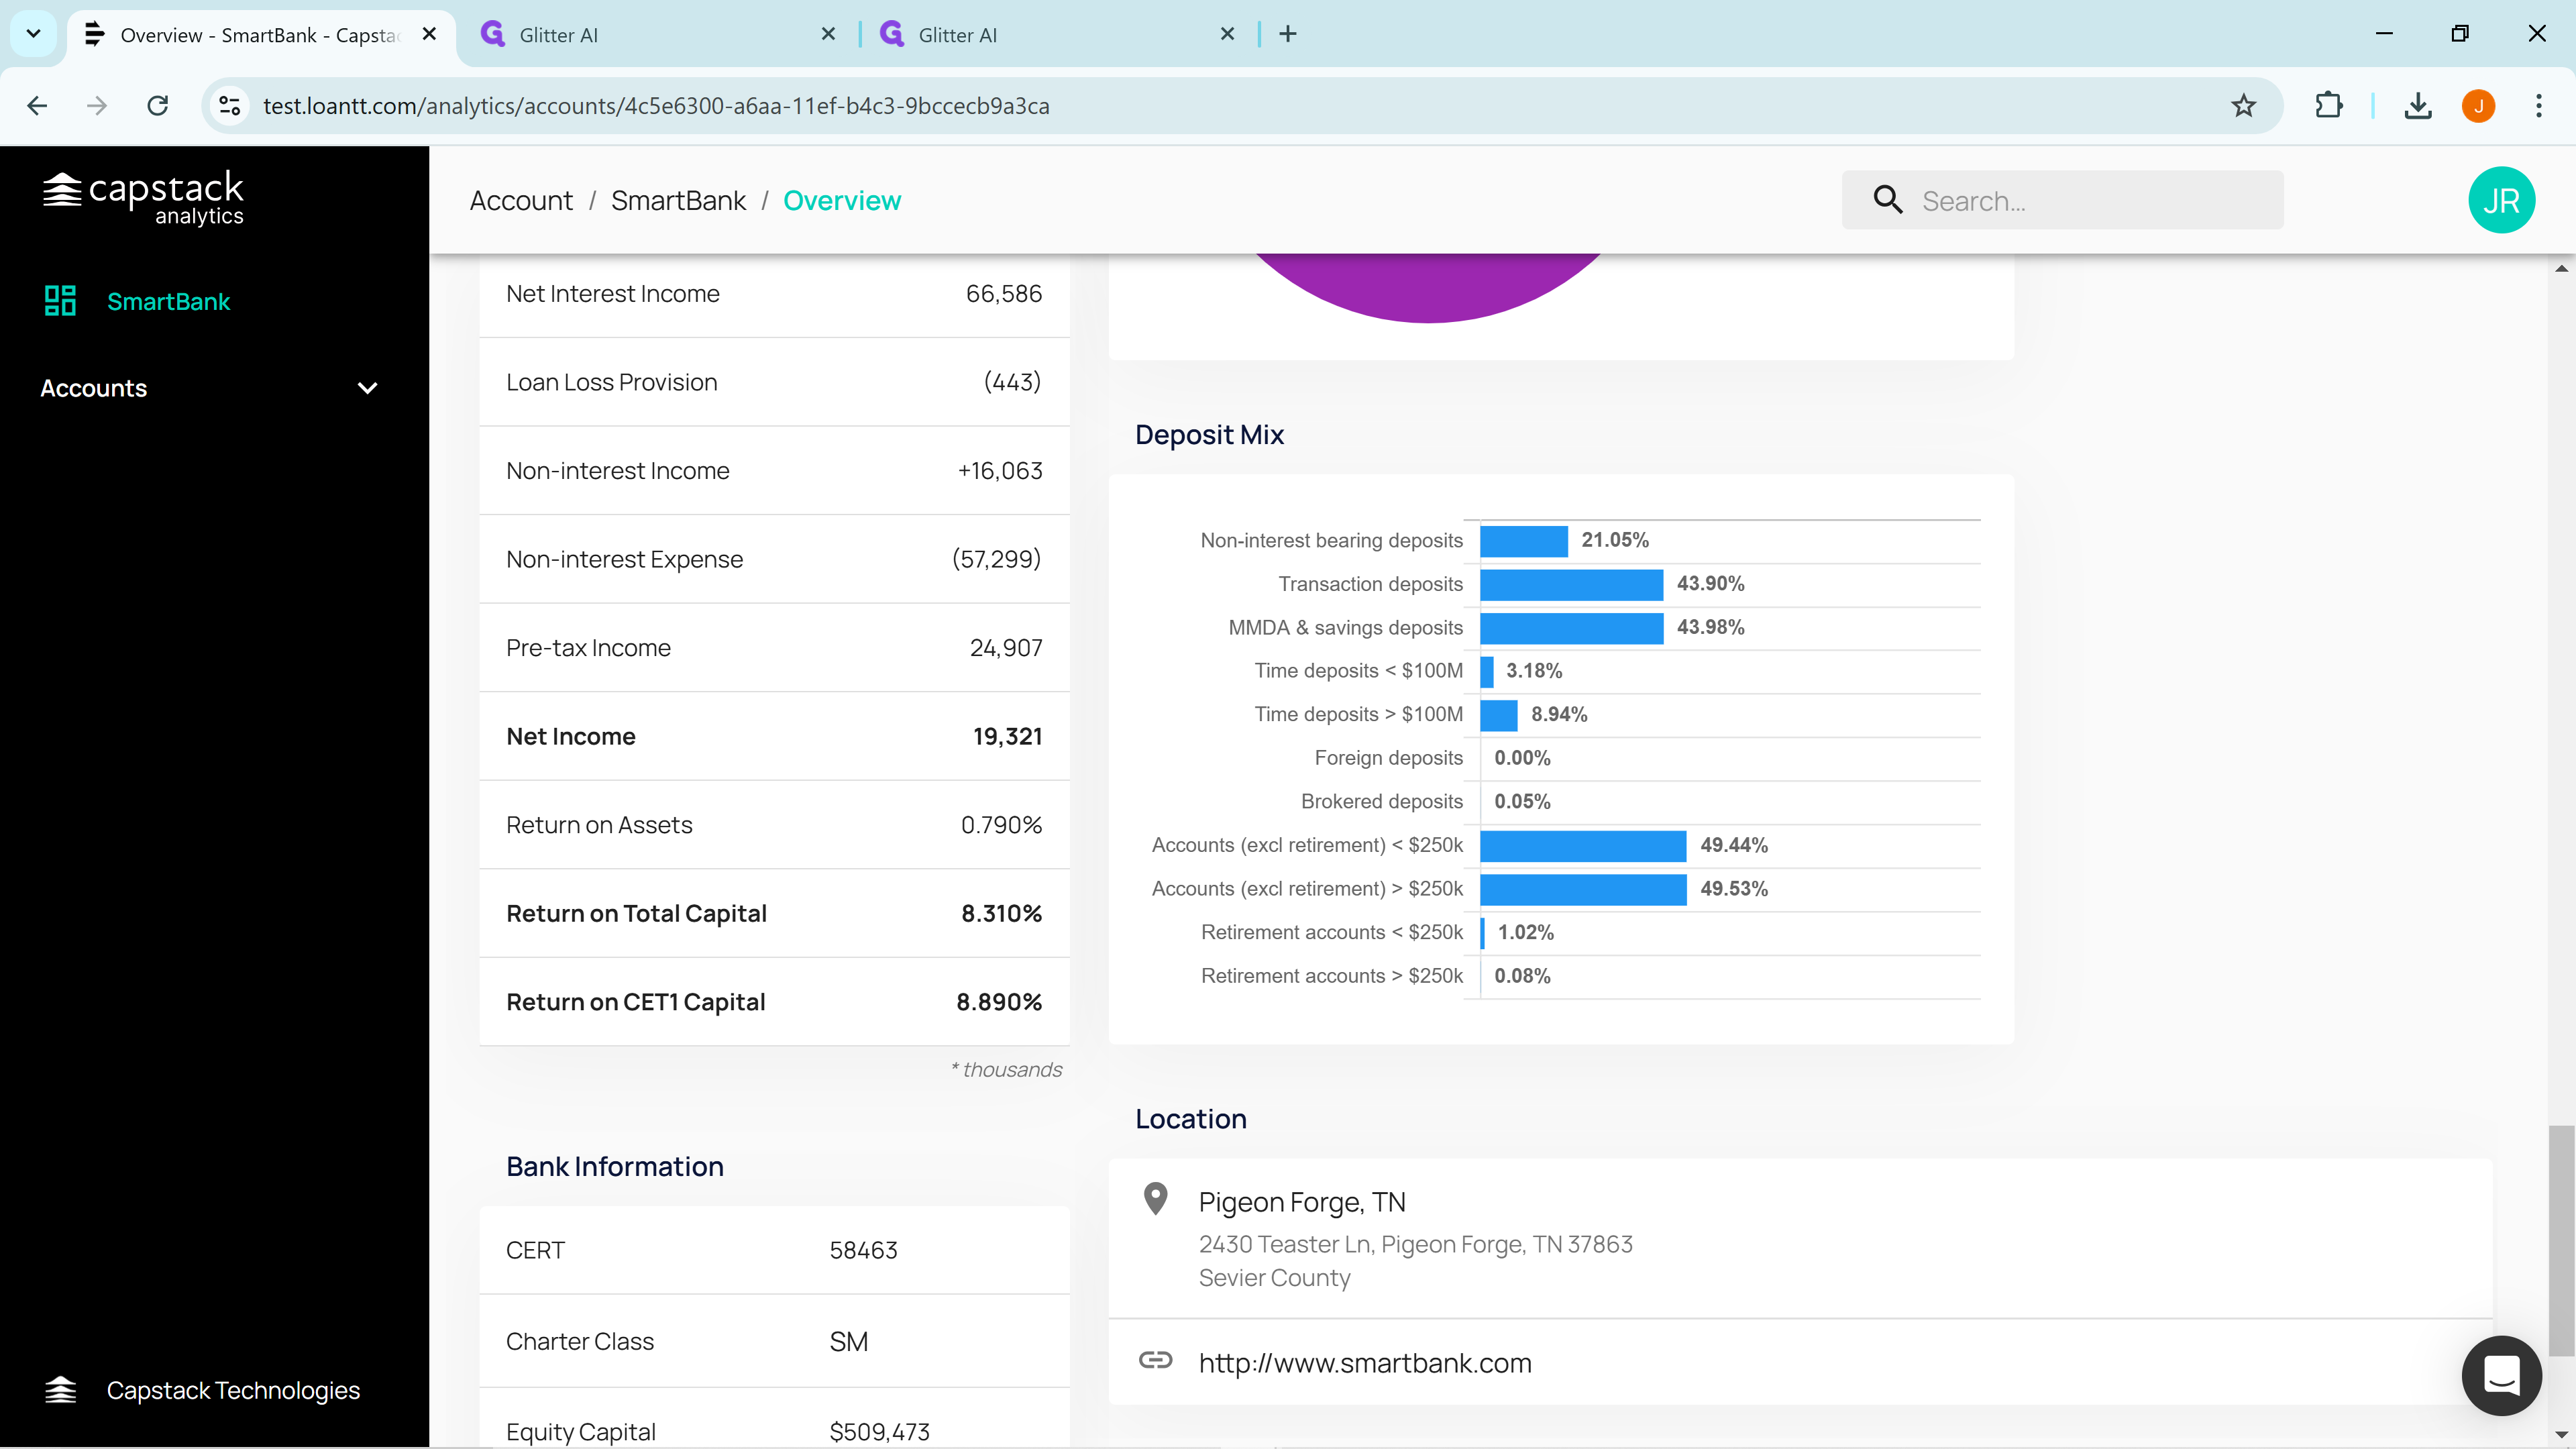
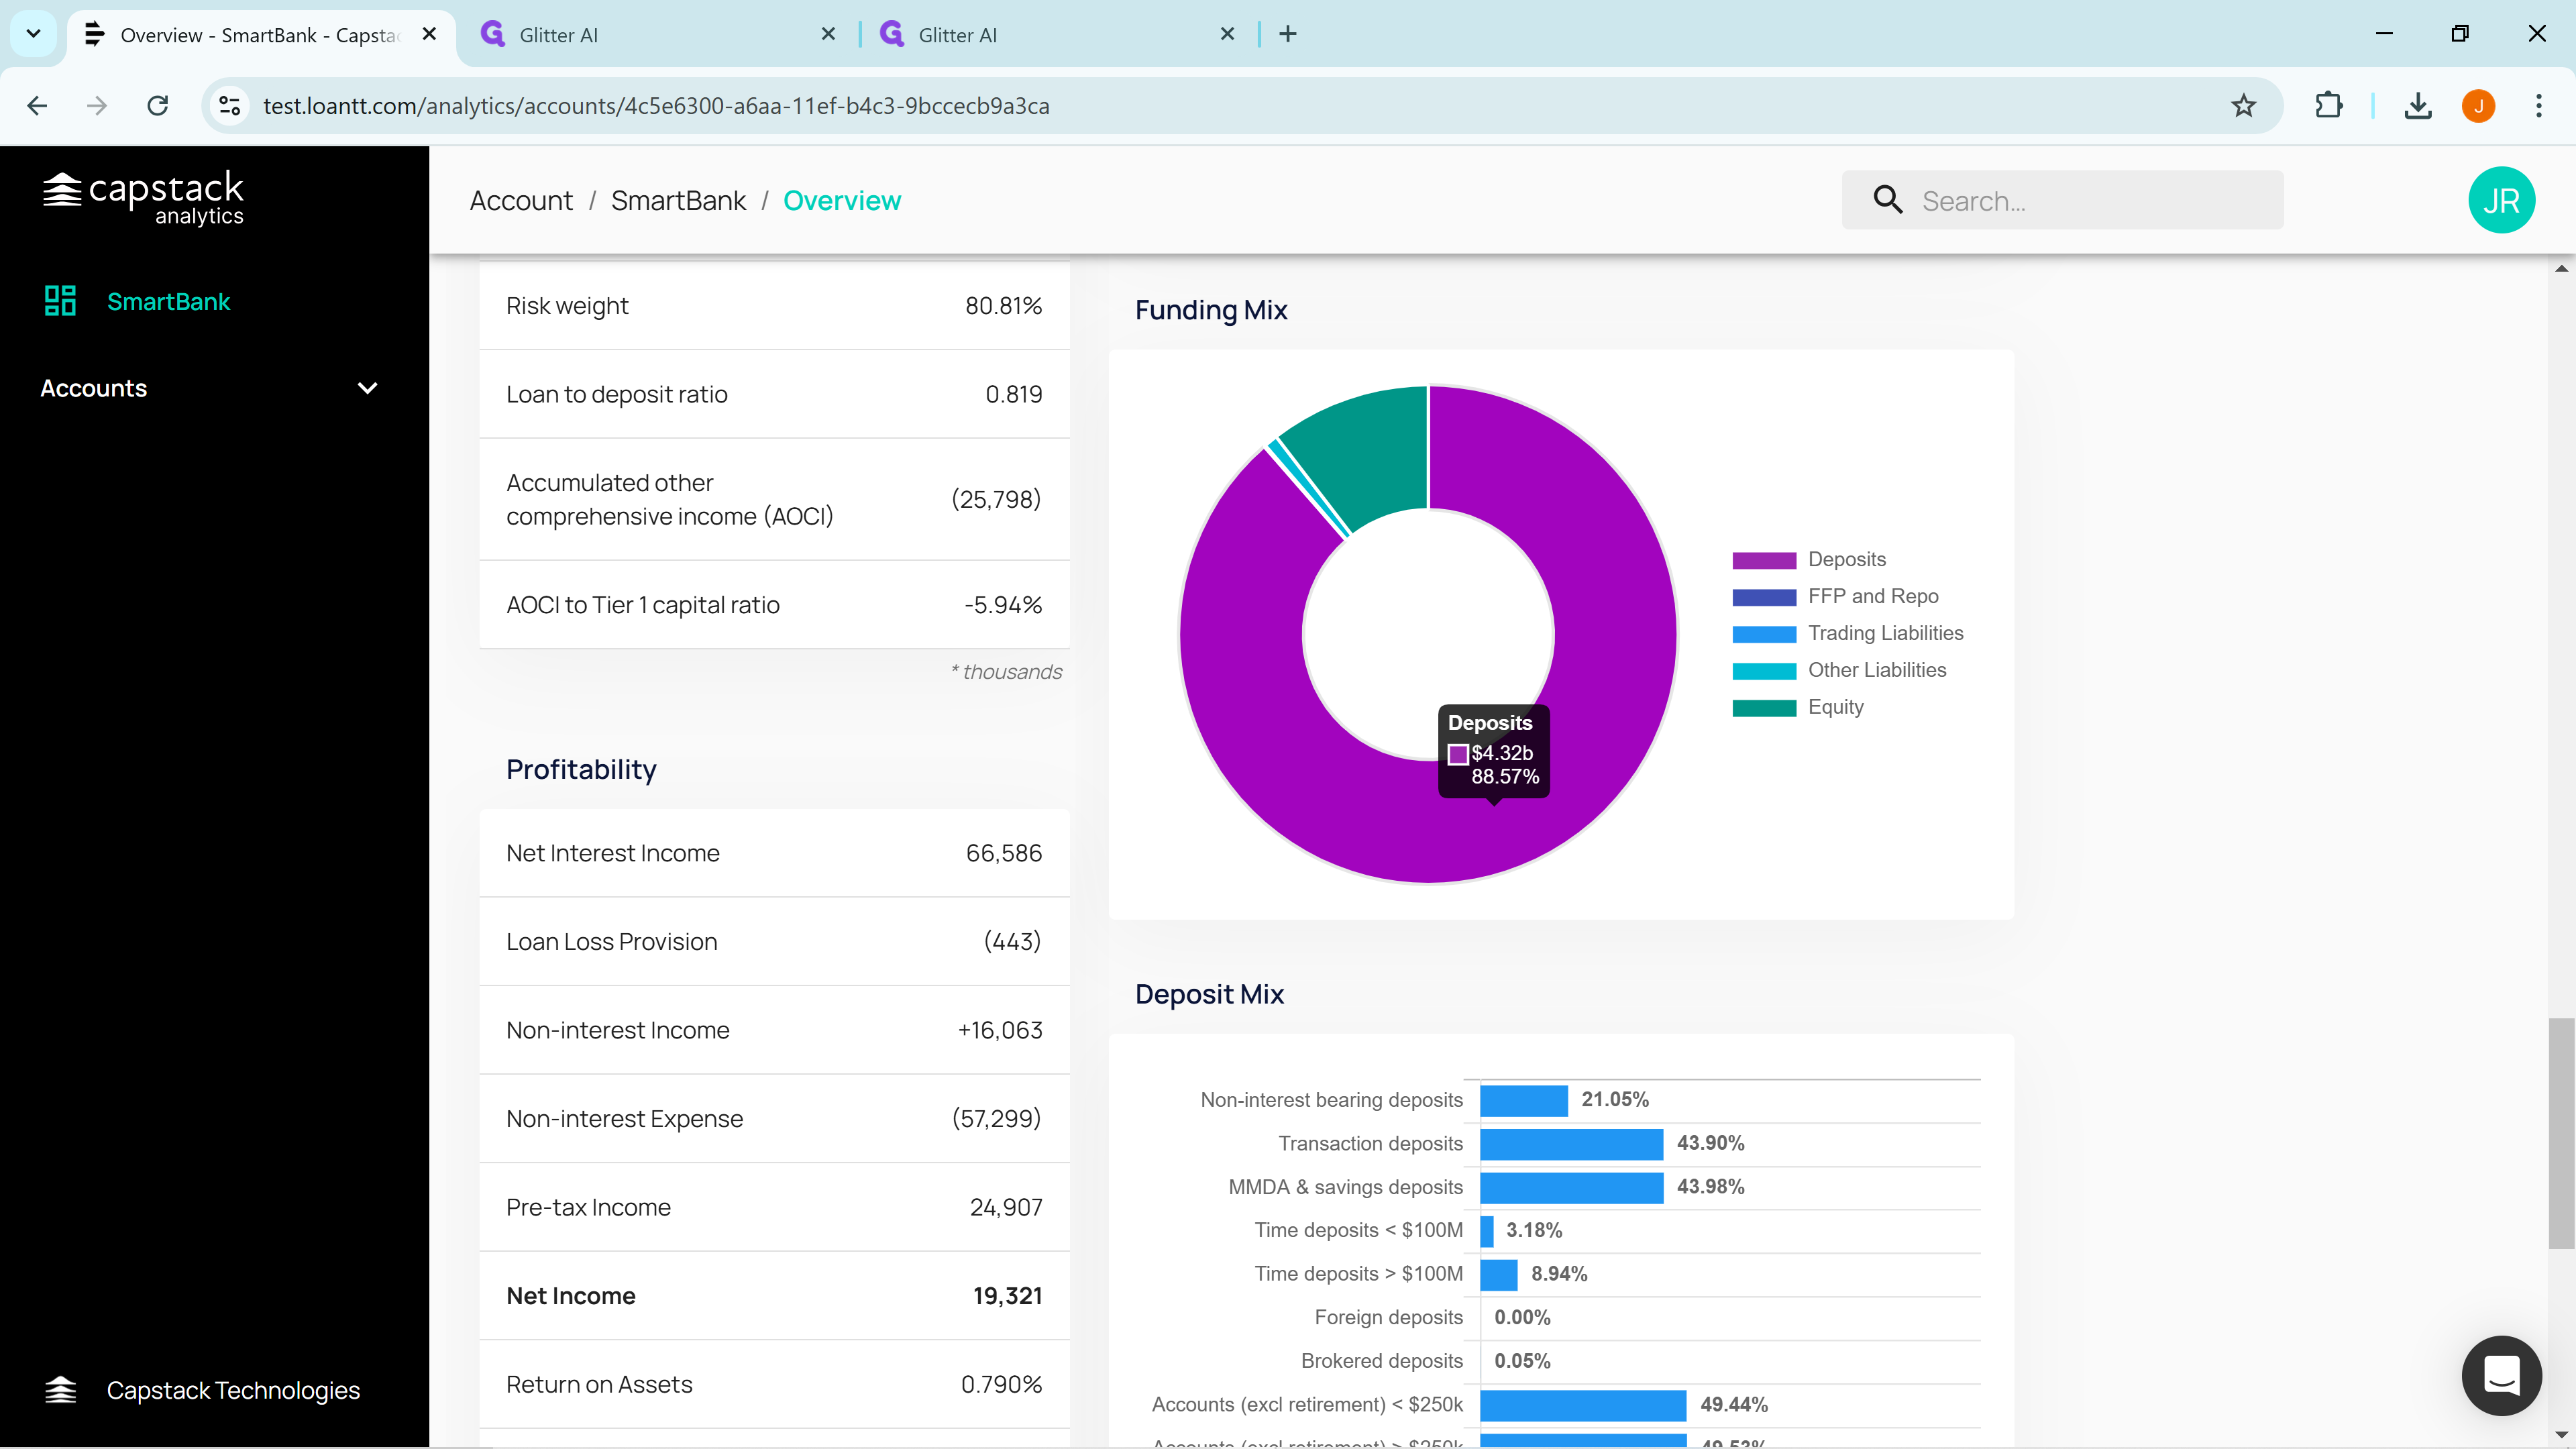
Now scrolling up from the bottom right side we can see the deposit mix,
the composition of the funding mix.
A breakdown of the liquidity portfolio,
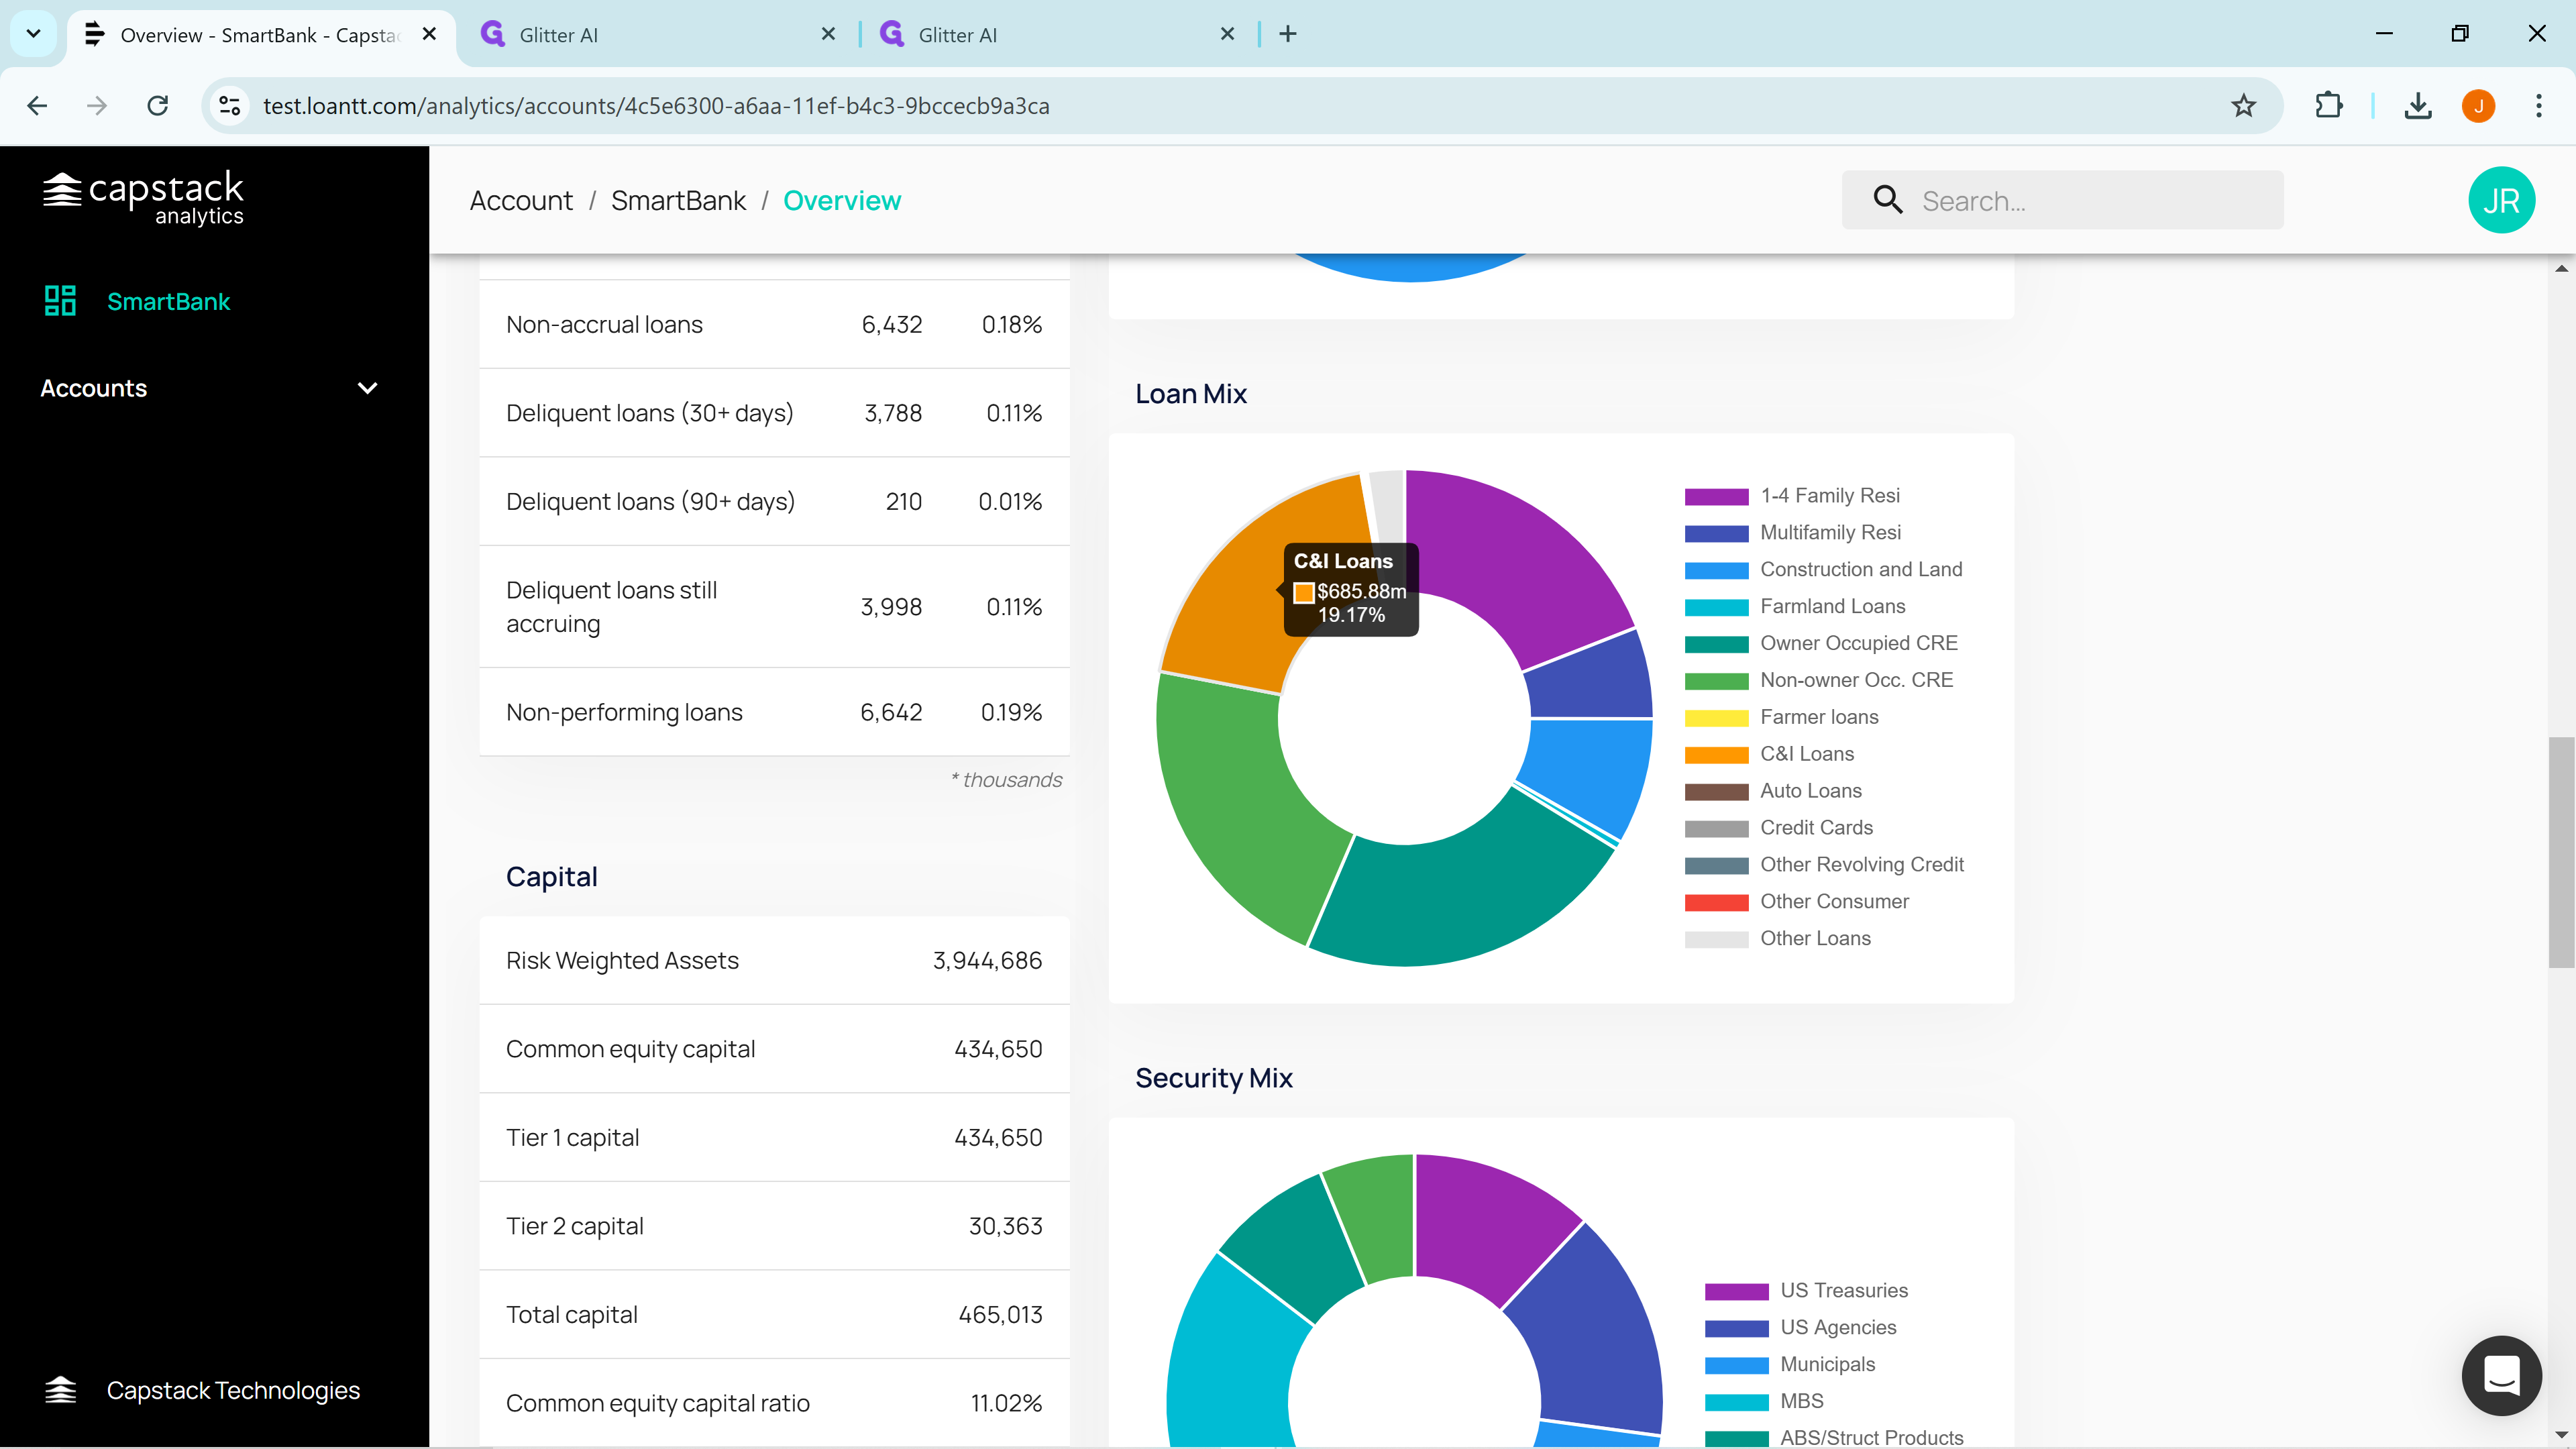
and most important, the loan portfolio
Finally we show the total balance sheet.
And that is a quick overview of what your bank will look like when you're logged into the system. Thank you.