
Adaptive Planning Introduction
This is an introduction to Adaptive Planning
In this guide, we'll learn how to use some of the basic features in Adaptive Planning. We will look at how to navigate the homepage, understand the main areas like sheets, reports, and dashboards, and explore key concepts such as versions and levels. You will also see how to use display options to adjust how data is shown.
Let's get started
Welcome to the introduction to Adaptive Planning. I will show you some basic features of Adaptive Planning that are crucial for using the product more effectively. Start with the homepage. The homepage is where you land when you open the product. From the homepage or any page, you'll see the global navigation toolbar.
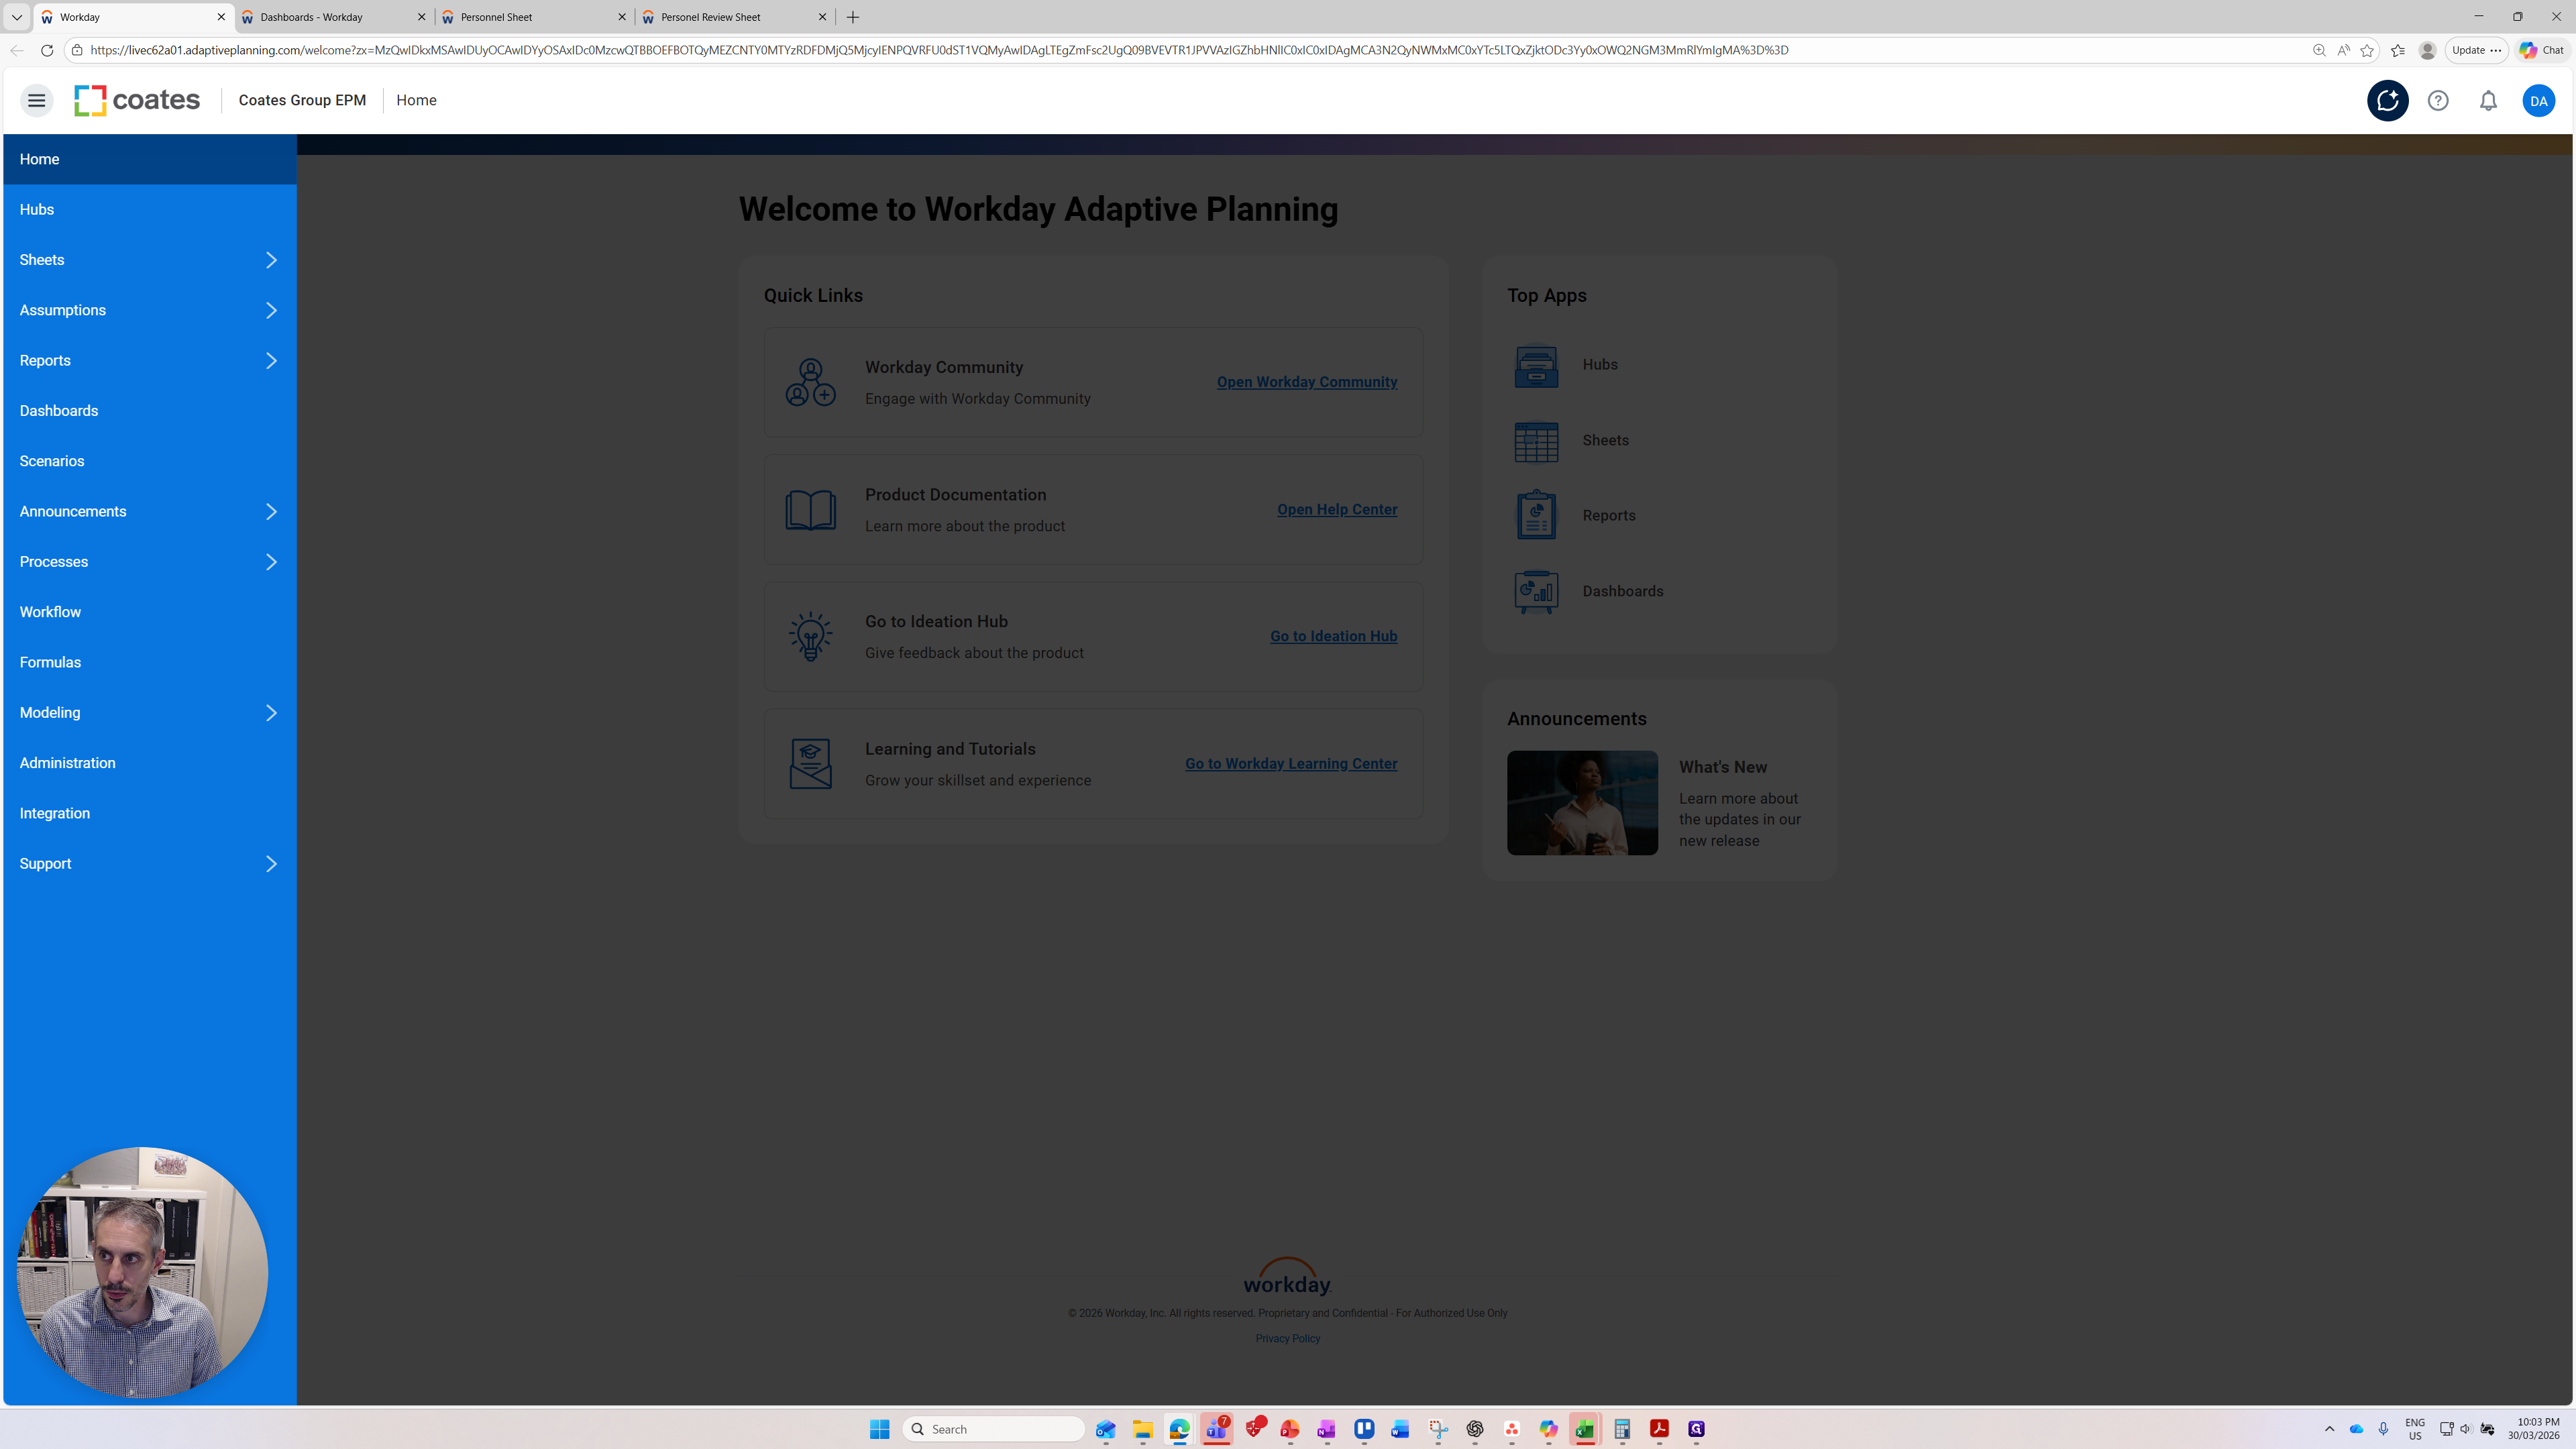
On it, you'll see some critical parts. When you sign in, you might not see as many options as I do because this is an administrator account. You might only have a contributor account. The first things you should see are the sheets. Here, you can see a variety of sheets available to help with modeling.
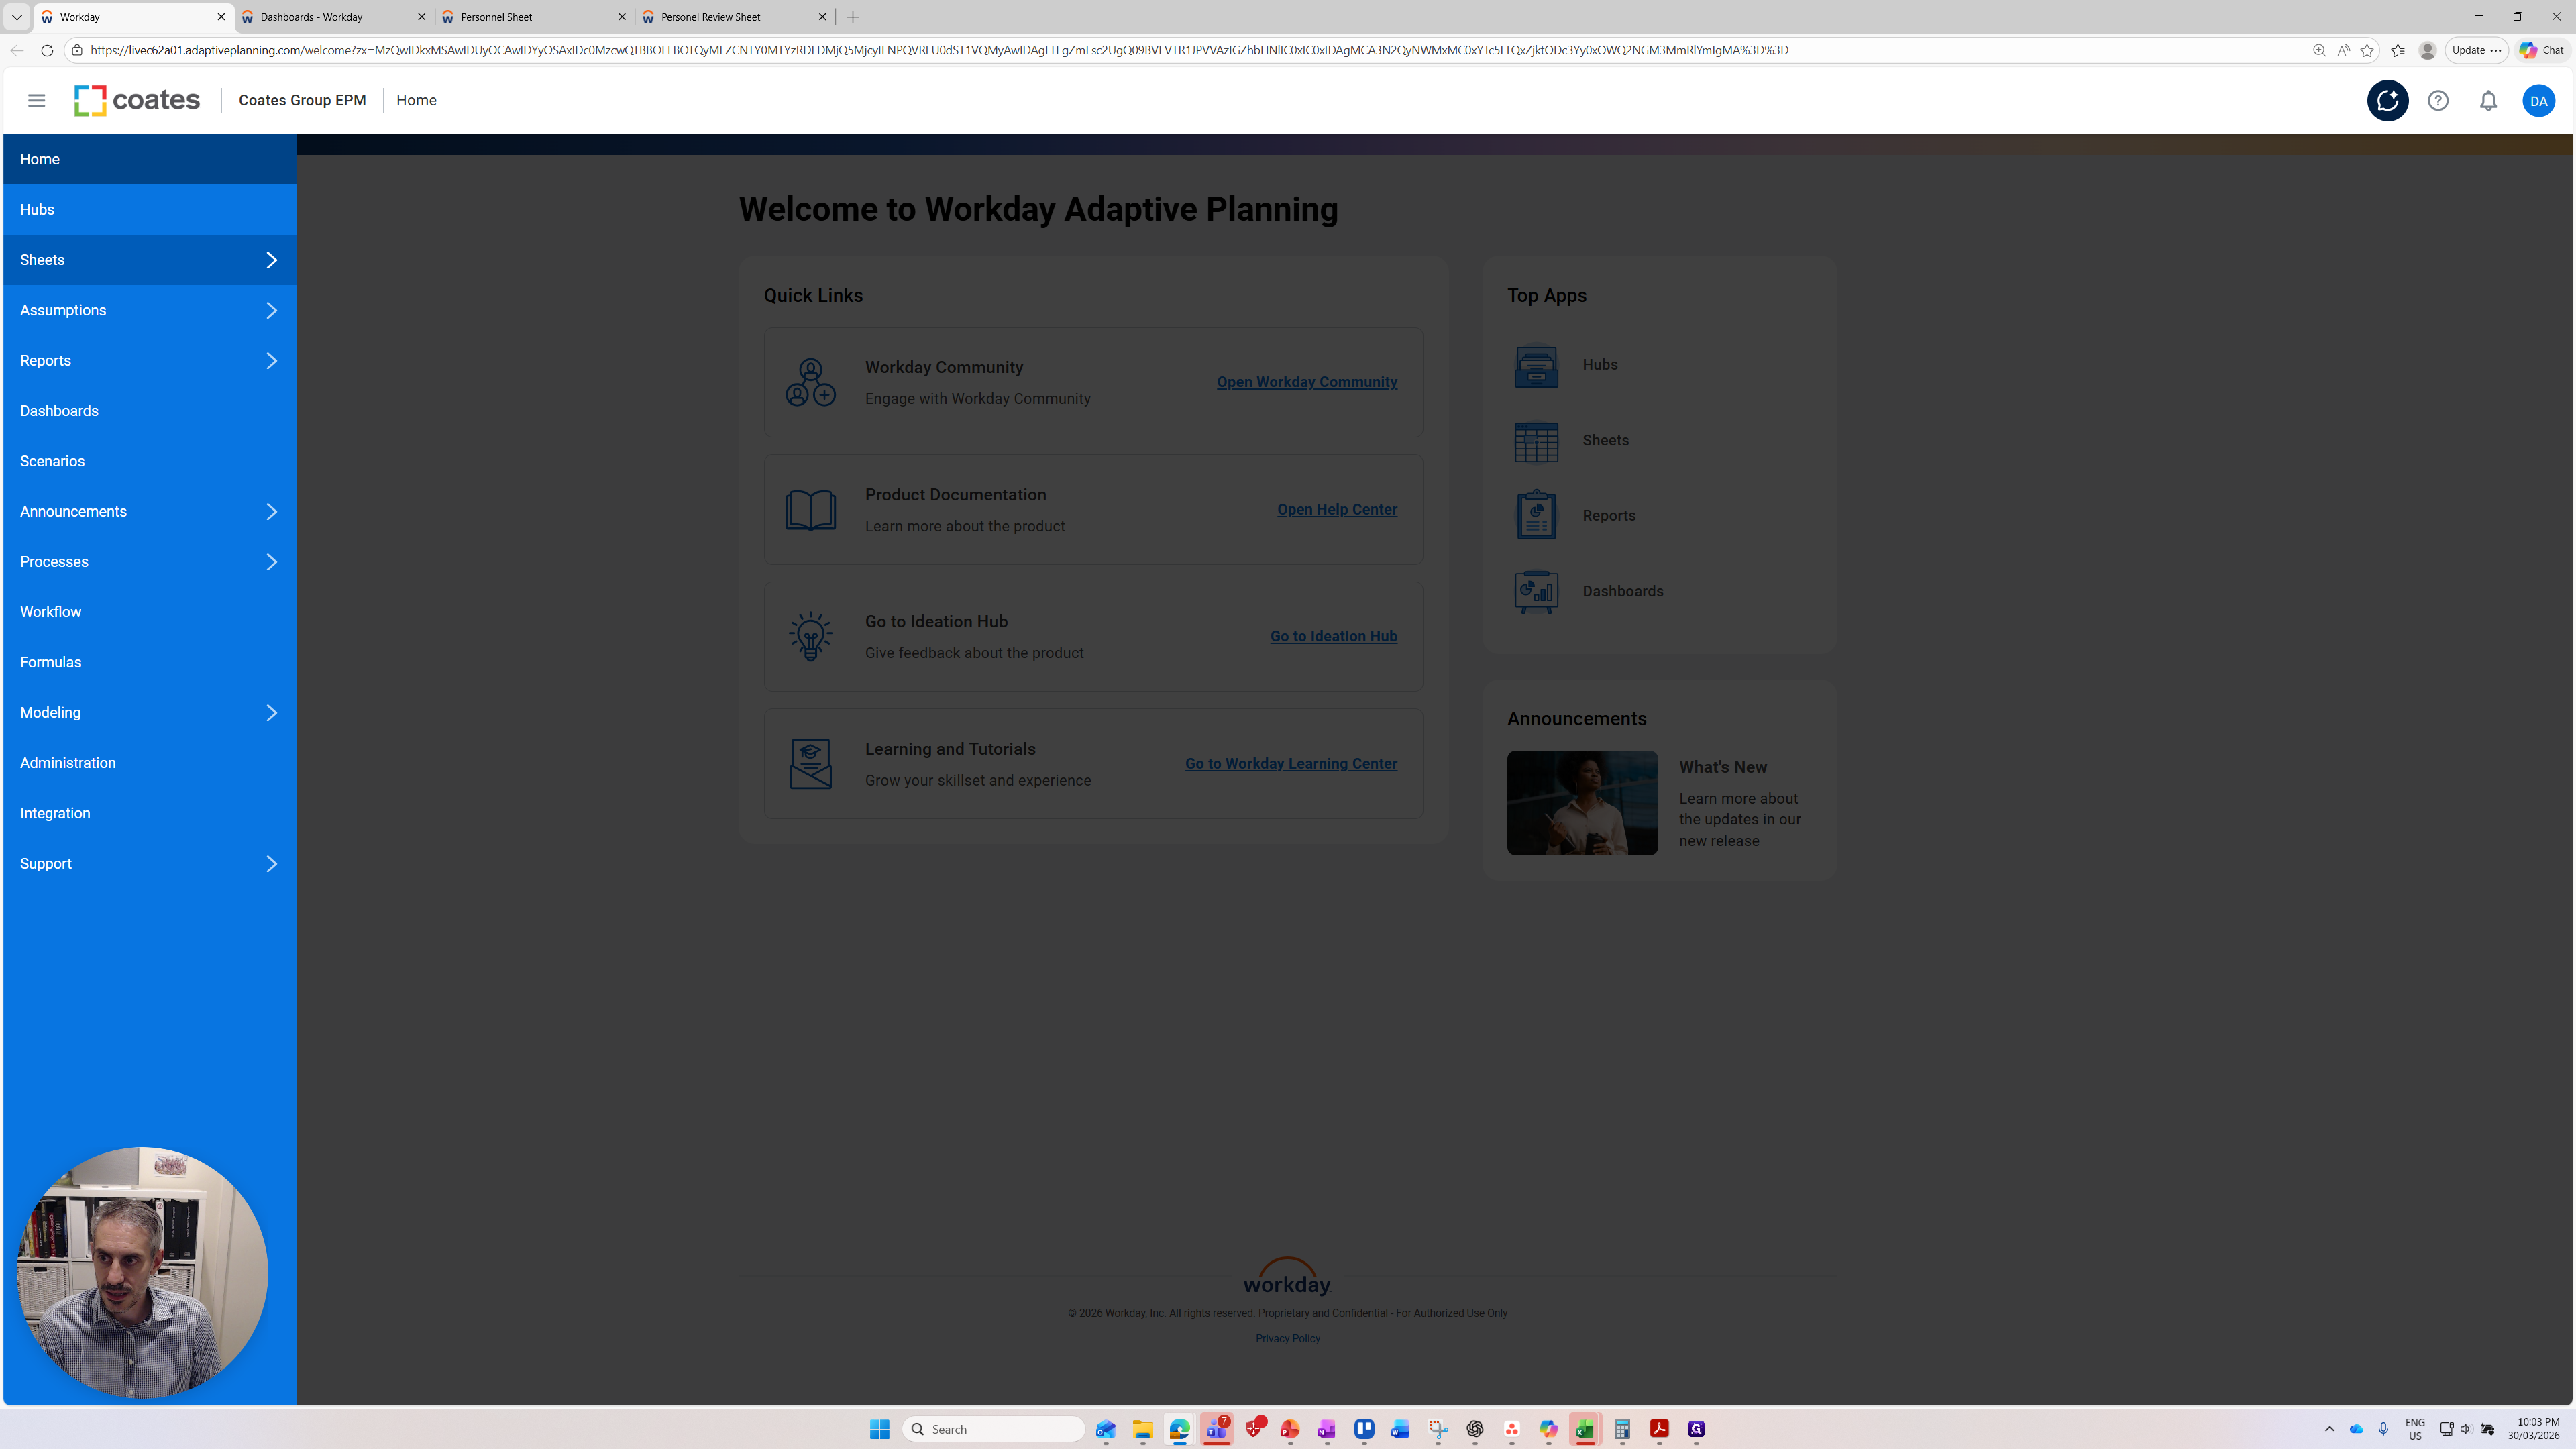
There are assumptions, which are essentially another type of sheet. I will show you when we will use them.
There are reports.

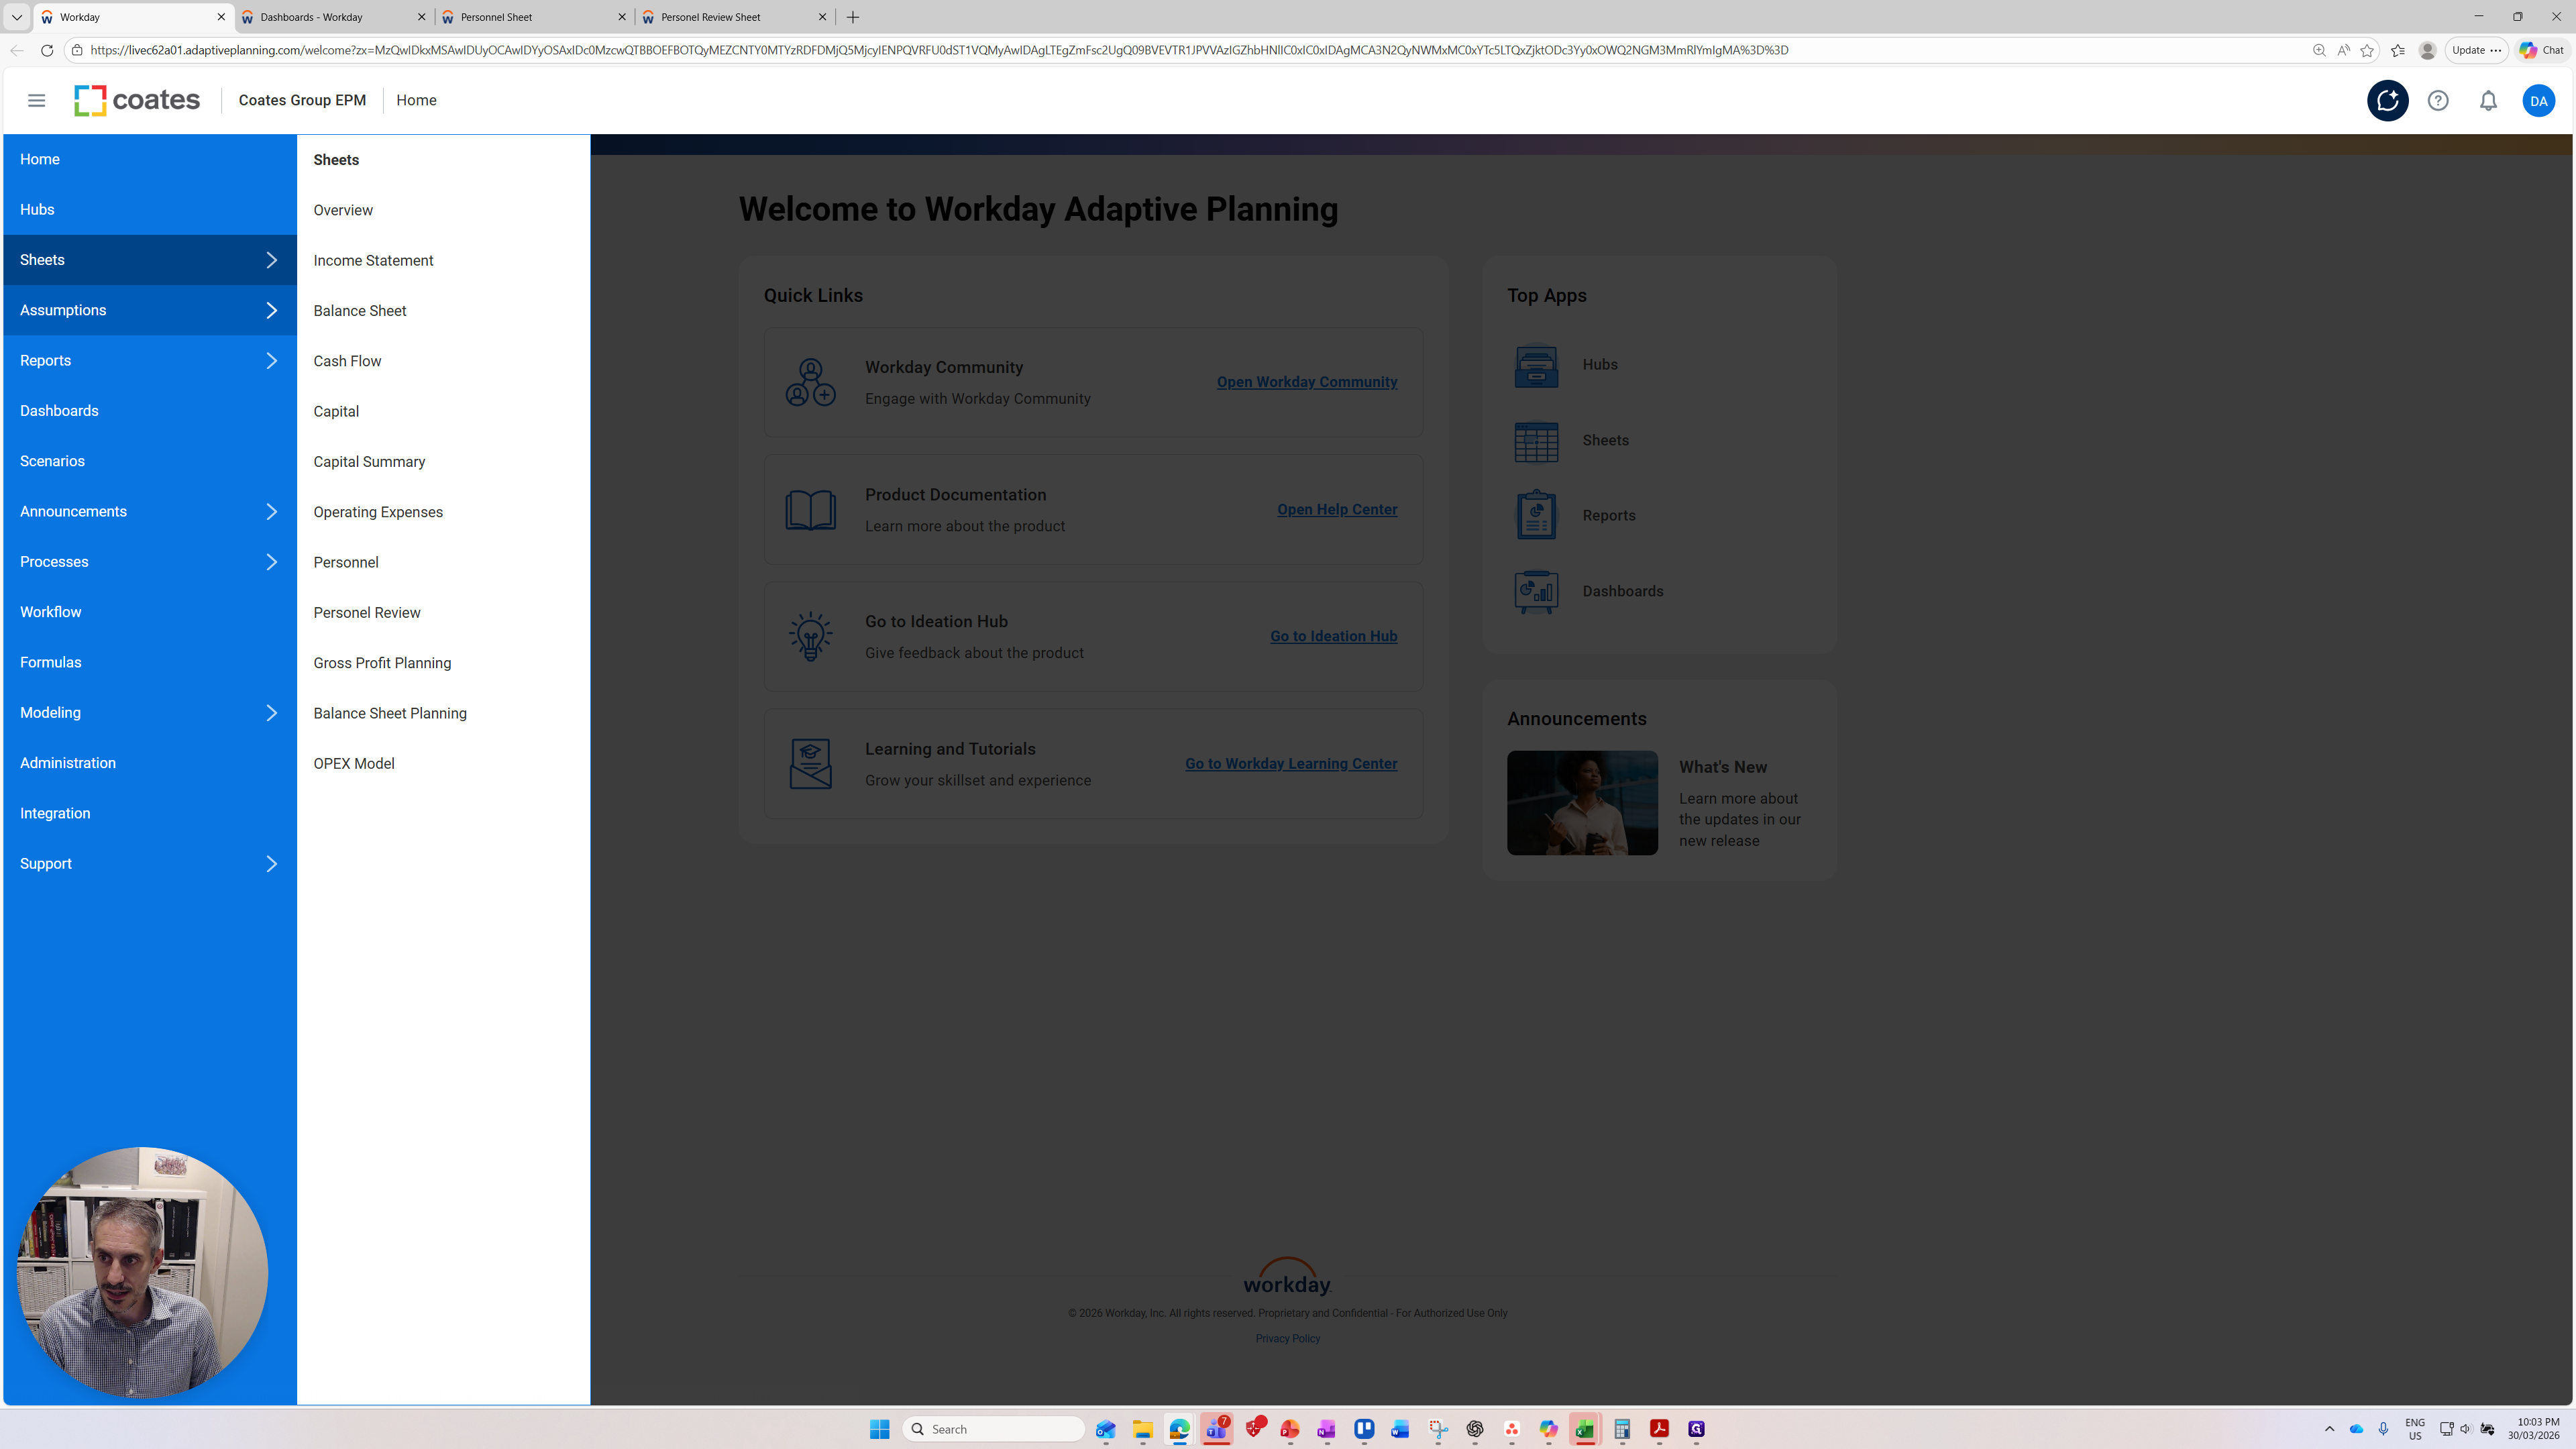
These are the four key areas. I will jump into Sheets to explain some of the concepts in more detail.

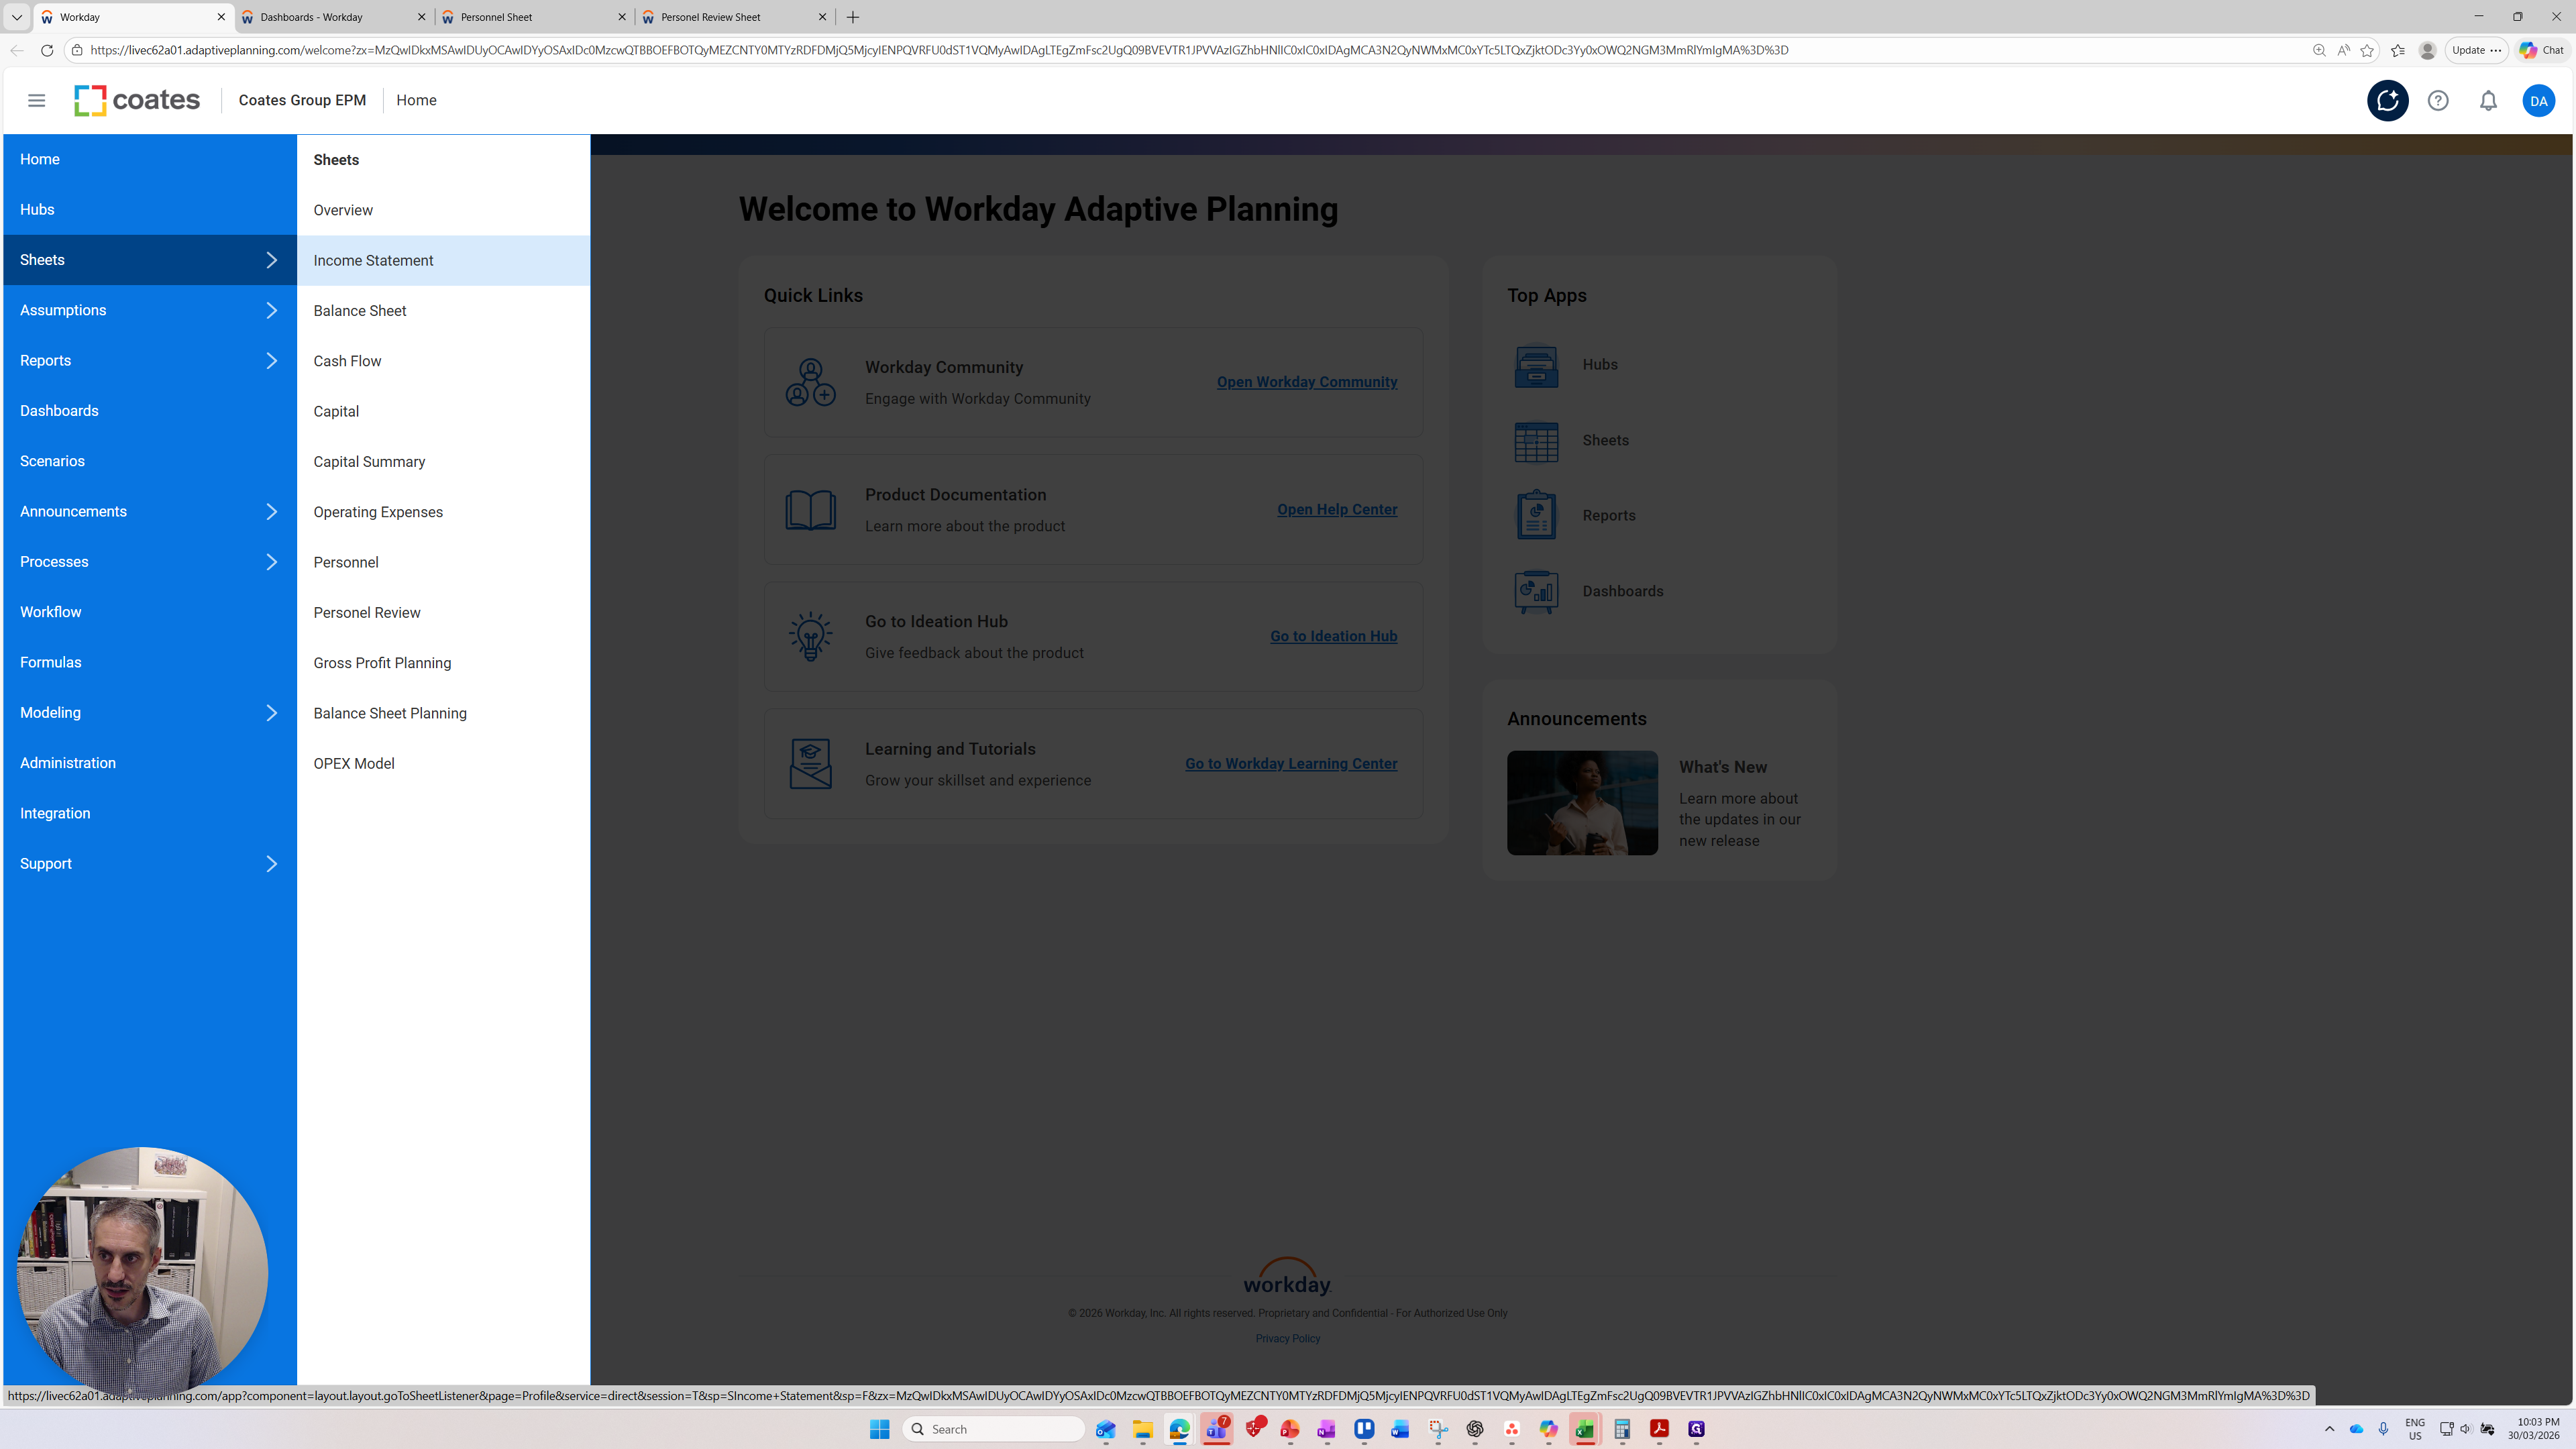
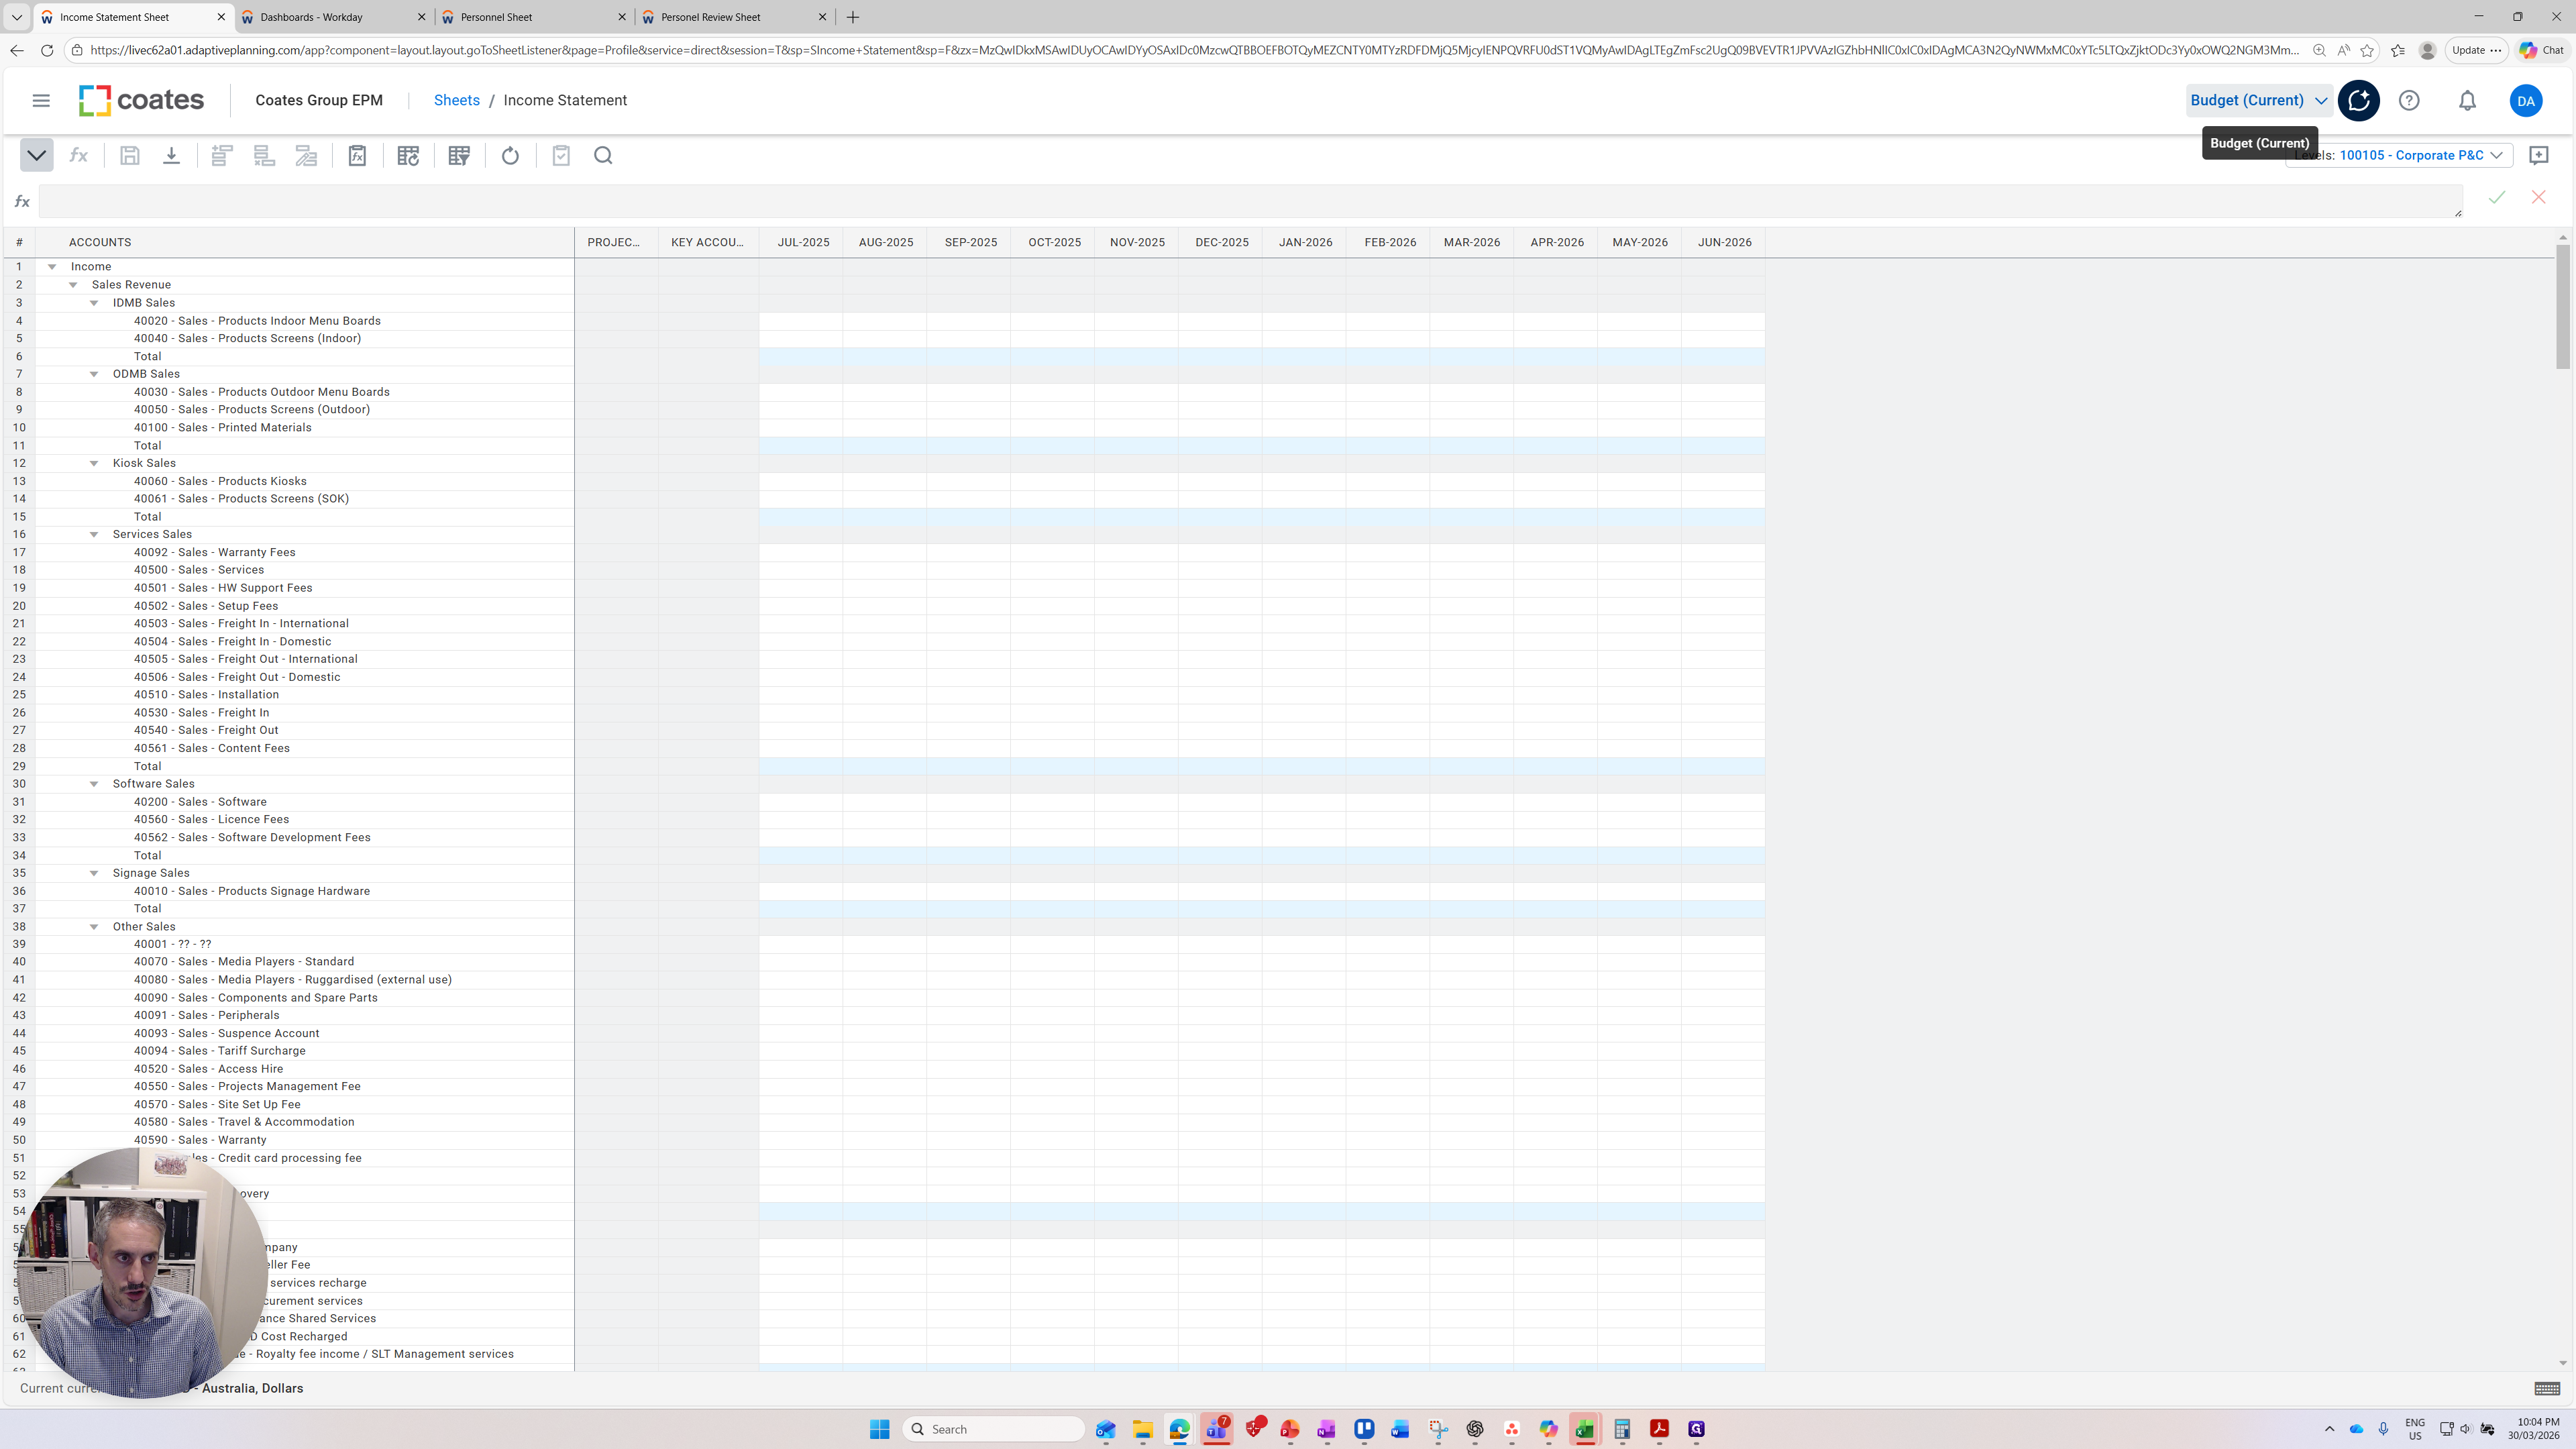
Our income statement sheet has loaded. There is no data here because it is currently at a very granular level. What I want to show you is a feature common to almost all the sheets. You will likely see it in the reports and other sheets as well. First, consider the versions. Versions can be found in the top right corner.
Here, you can see versions for actuals, budget FY26, the current budget, and a test version. The critical thing is you can change the versions, and it will change the data being presented on the screen. I might change it to the actual versions.
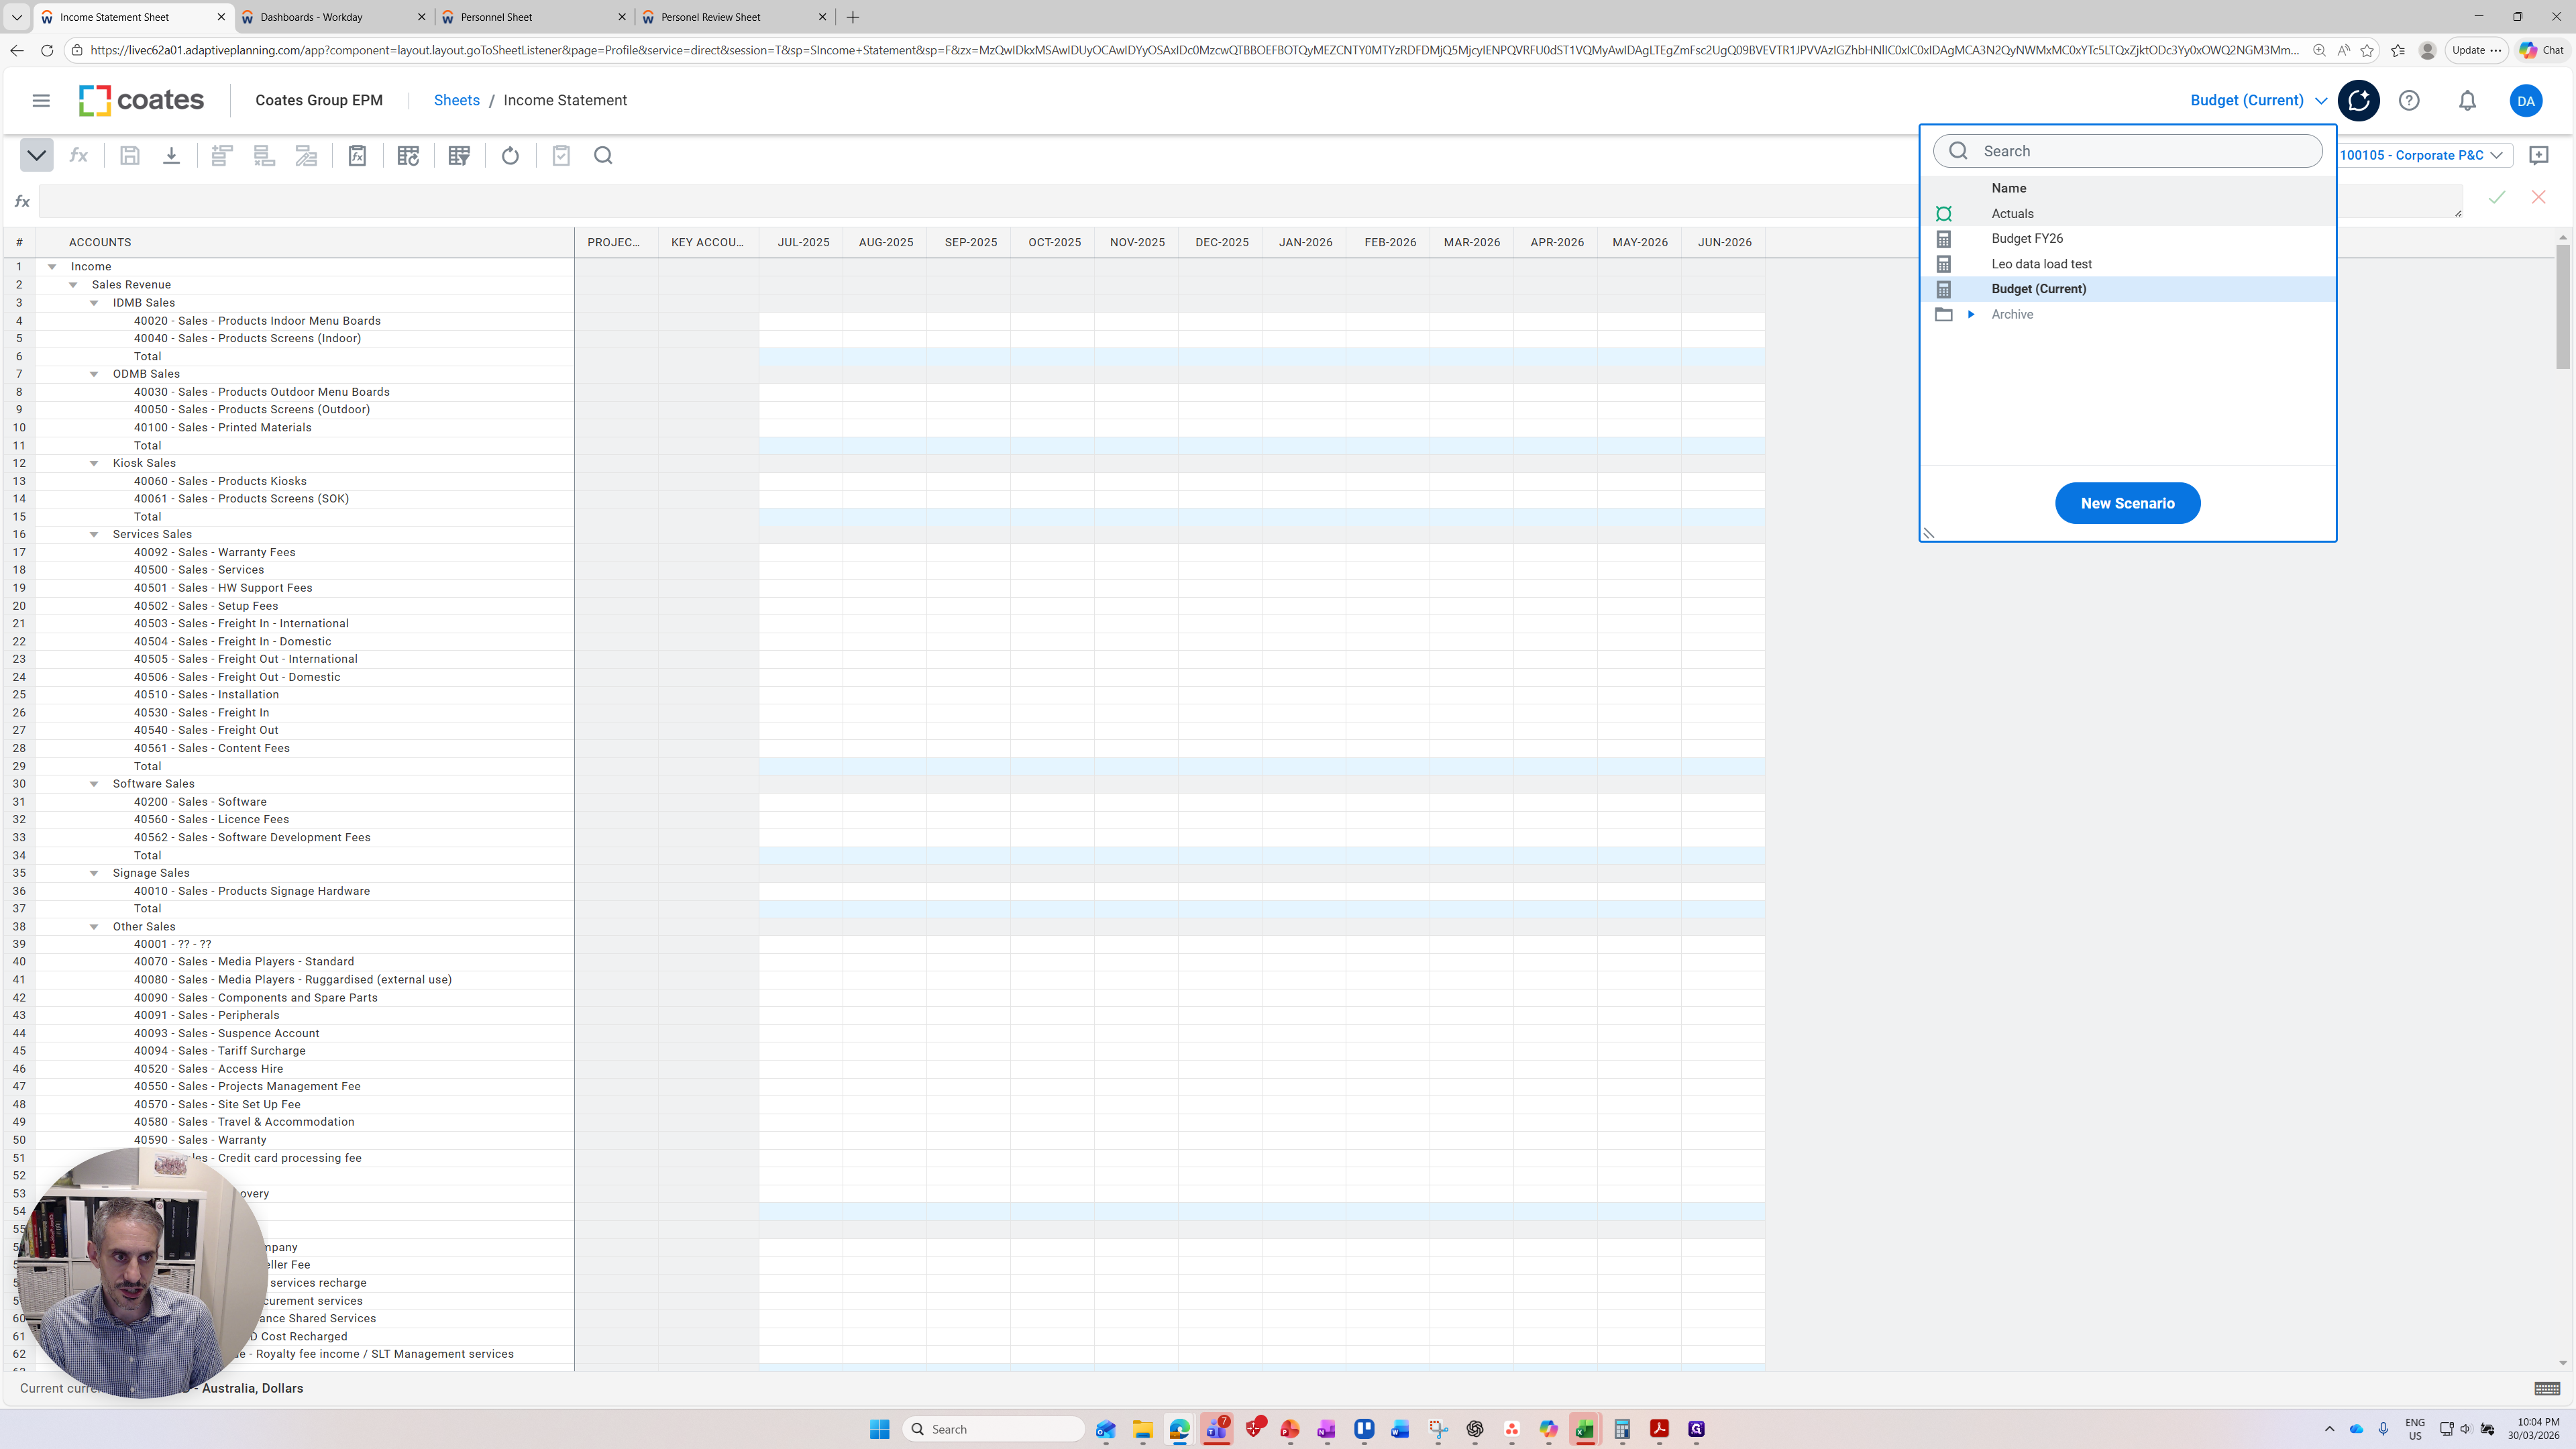
It's easiest to think of versions as its own separate Excel file. Each version has no connection to the other version. Typically, we use a version to model different scenarios or budgets. Maybe create one version for the FY26 budget and another for the FY27 budget. A version for forecasts, a version for forecast two, and so on.
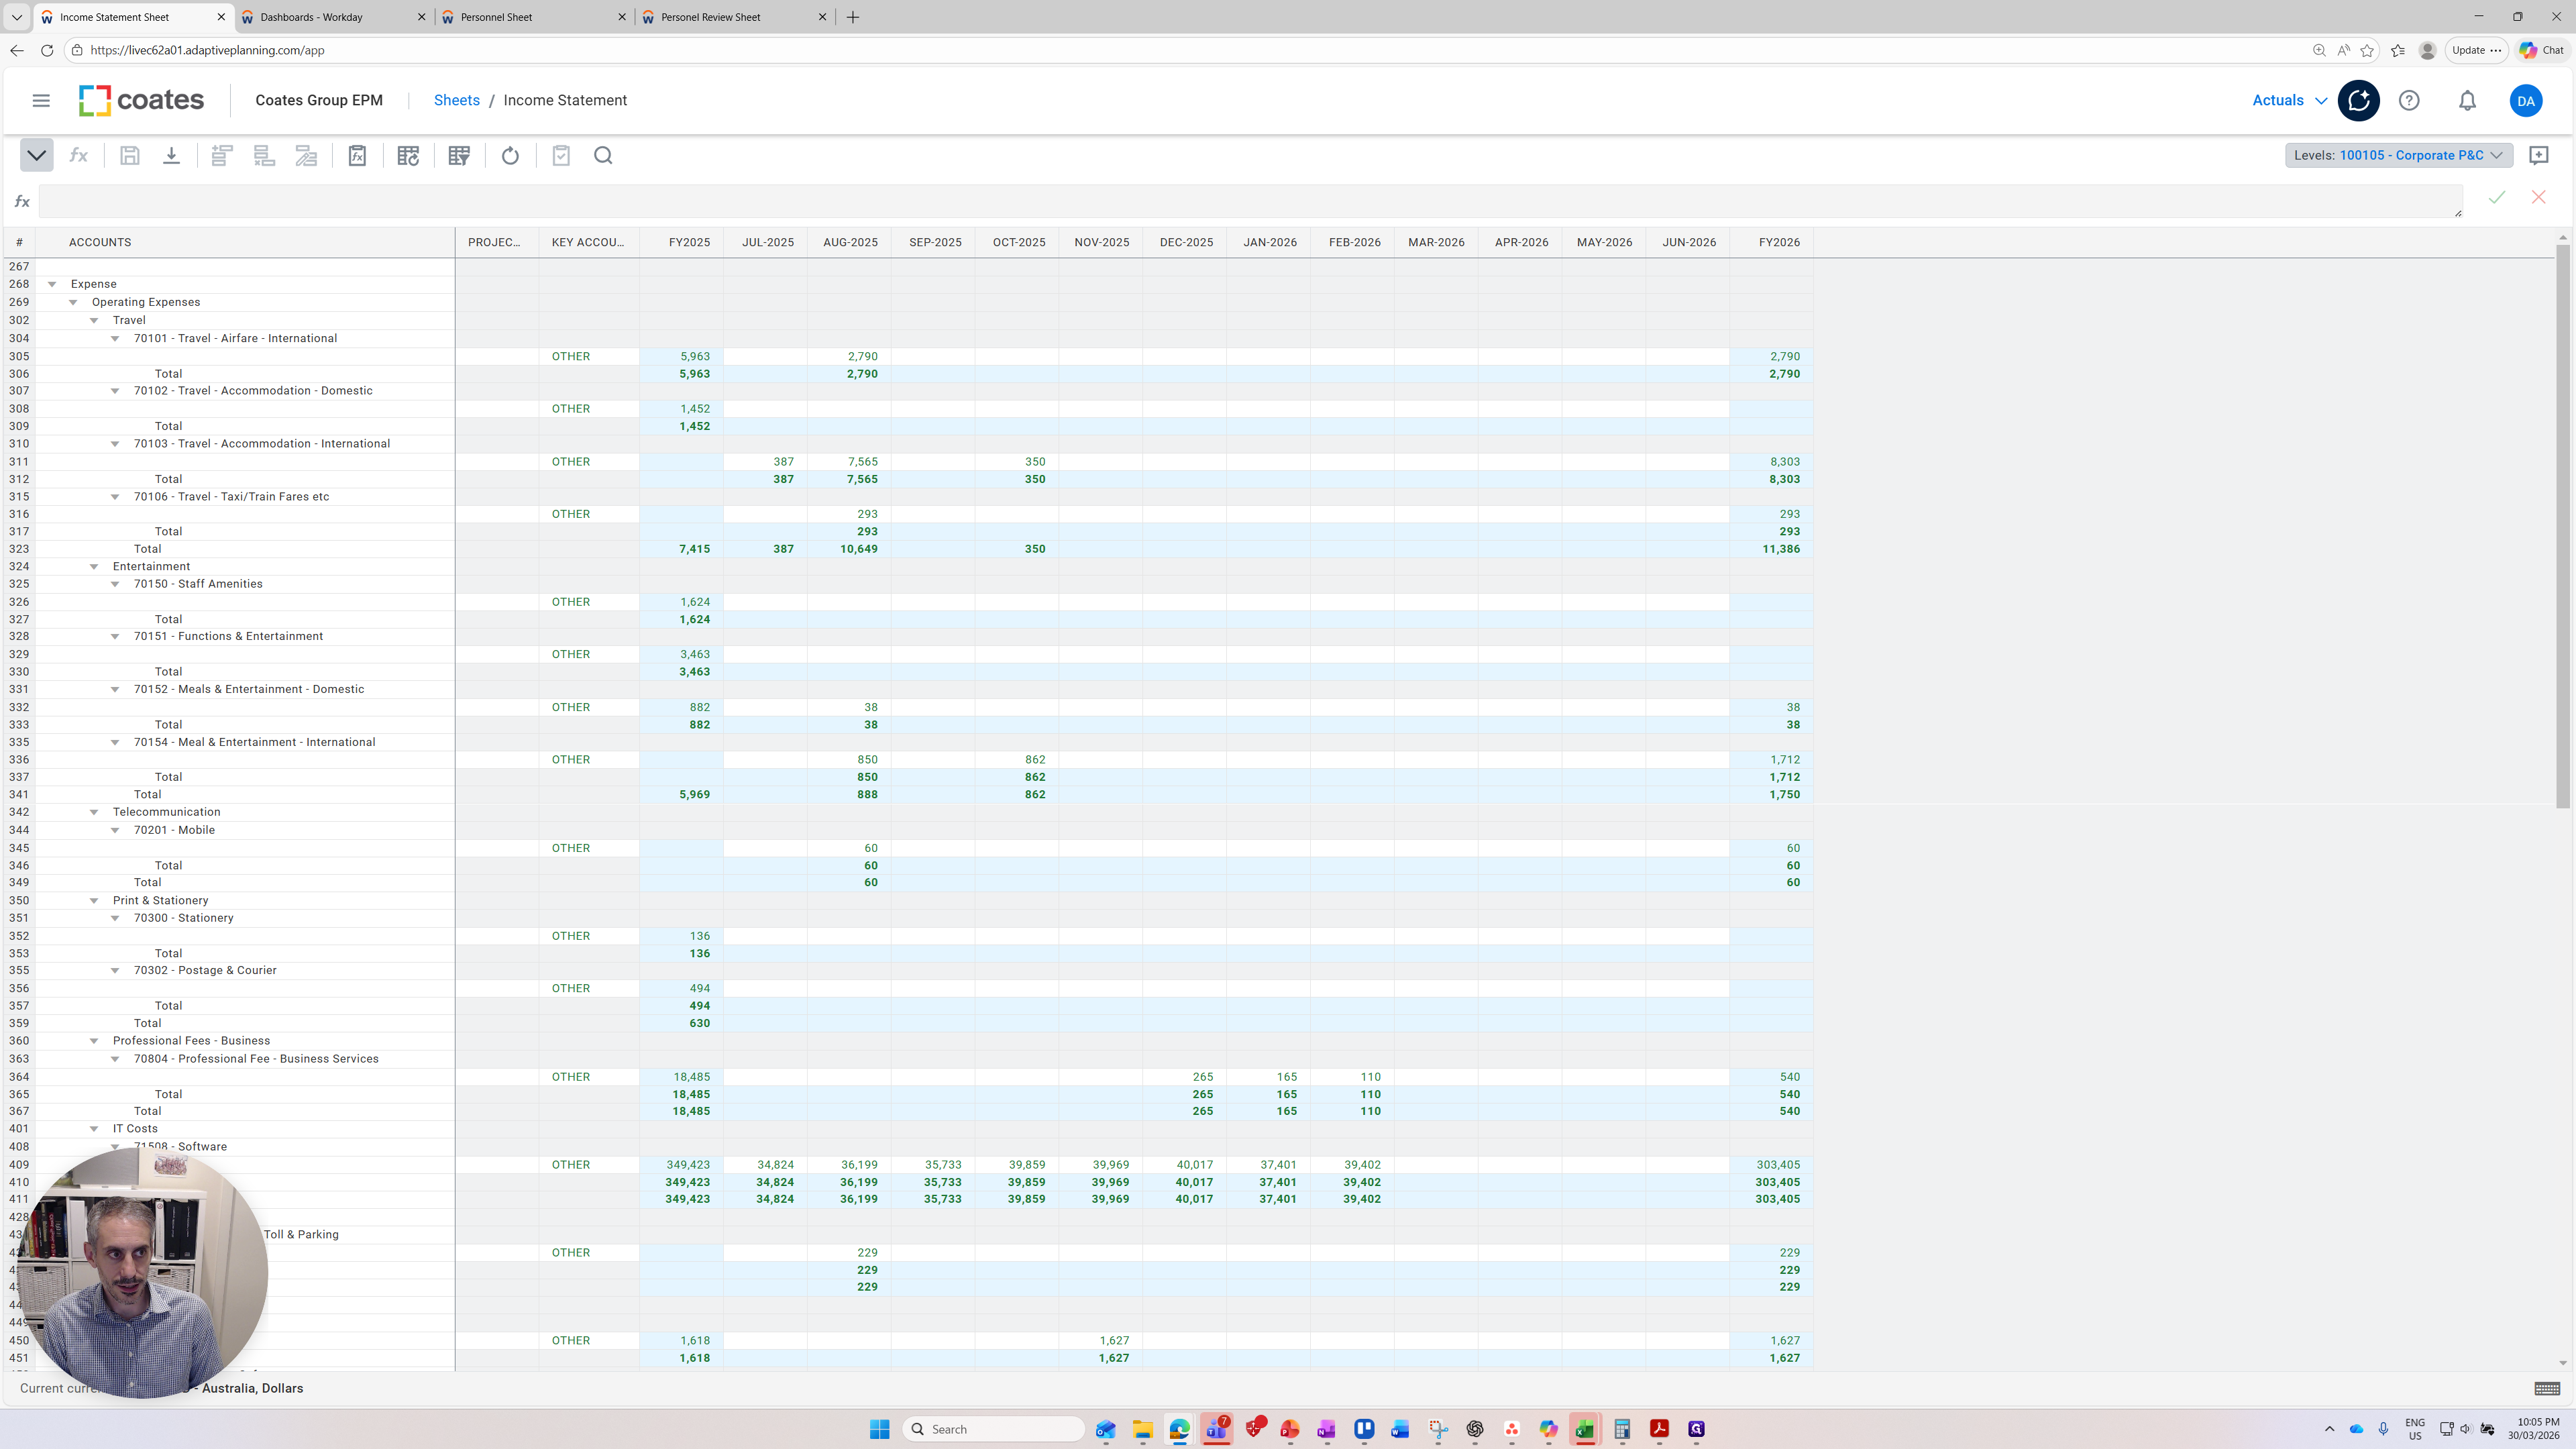
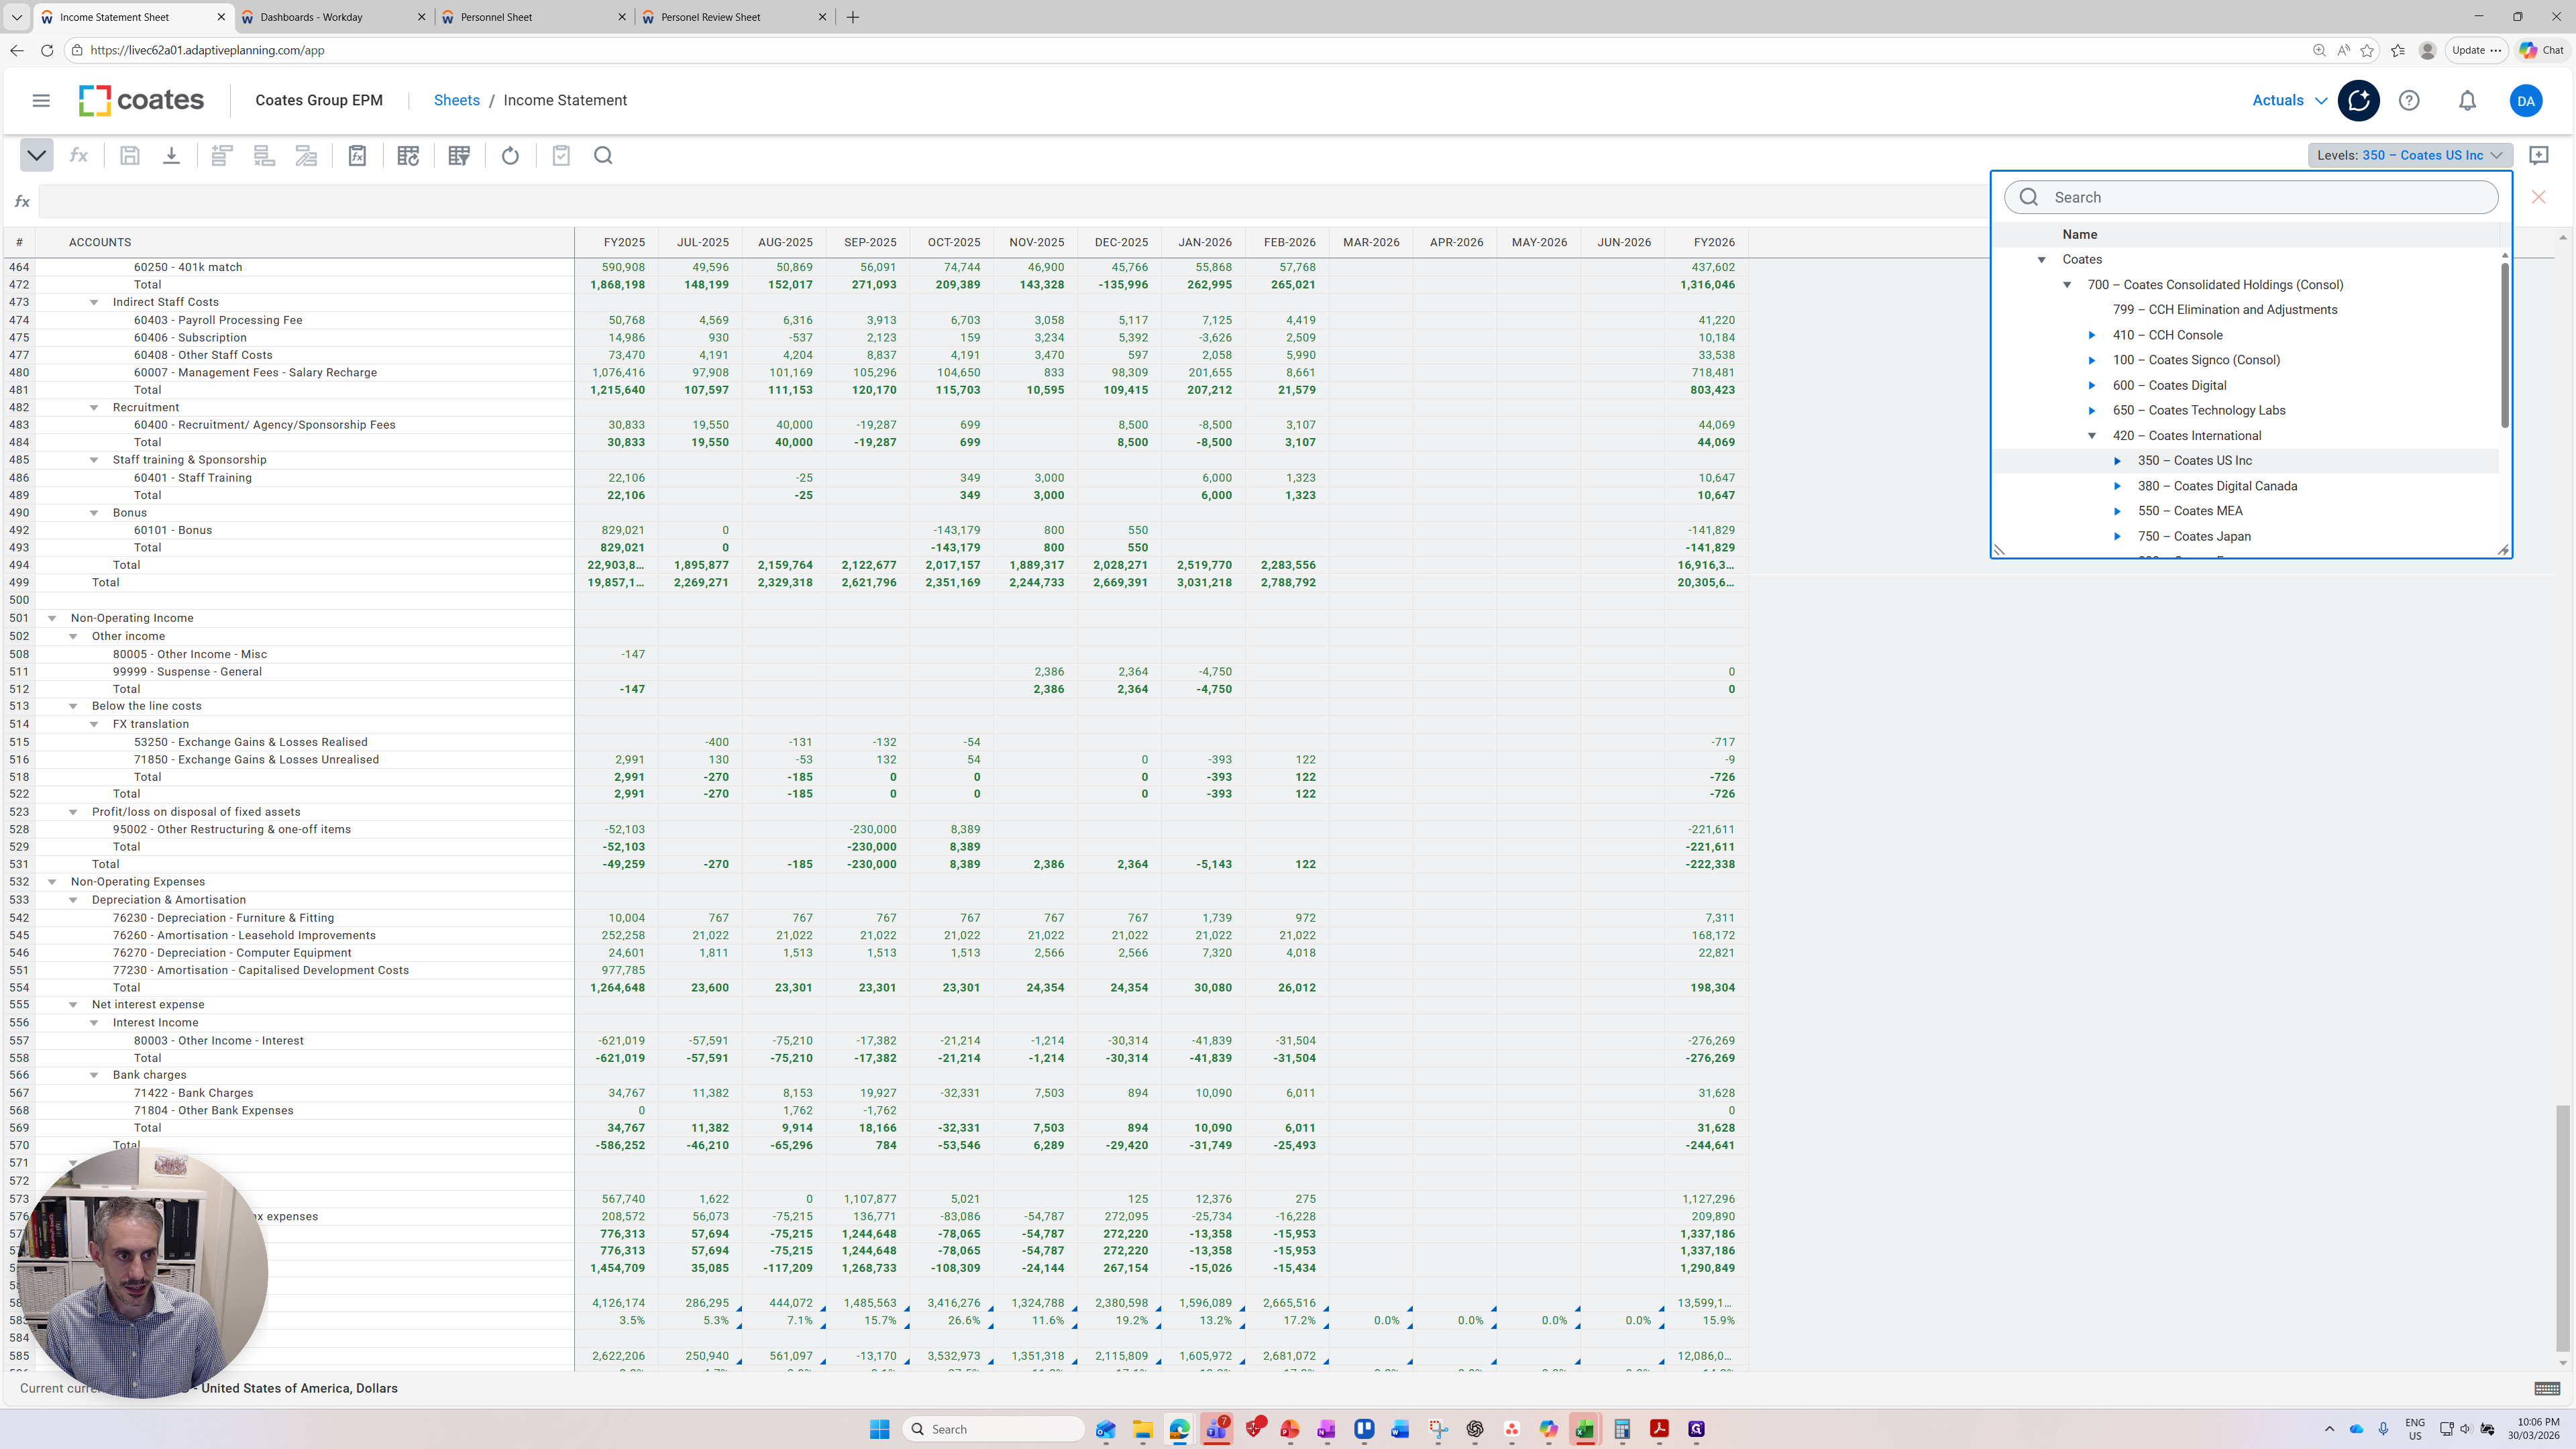
That's versions. You can see that once I changed it to actuals, some of the actual data started coming through for this cost center. What is a cost center, and what is a level? We have a concept called "levels" in the top right corner. I will click on it.
Levels combine our legal entity structure along with our cost centre structure and is kept in a structured parent-child relationship.

Legal entities appear first and they rollup consistent with their parent organisations.
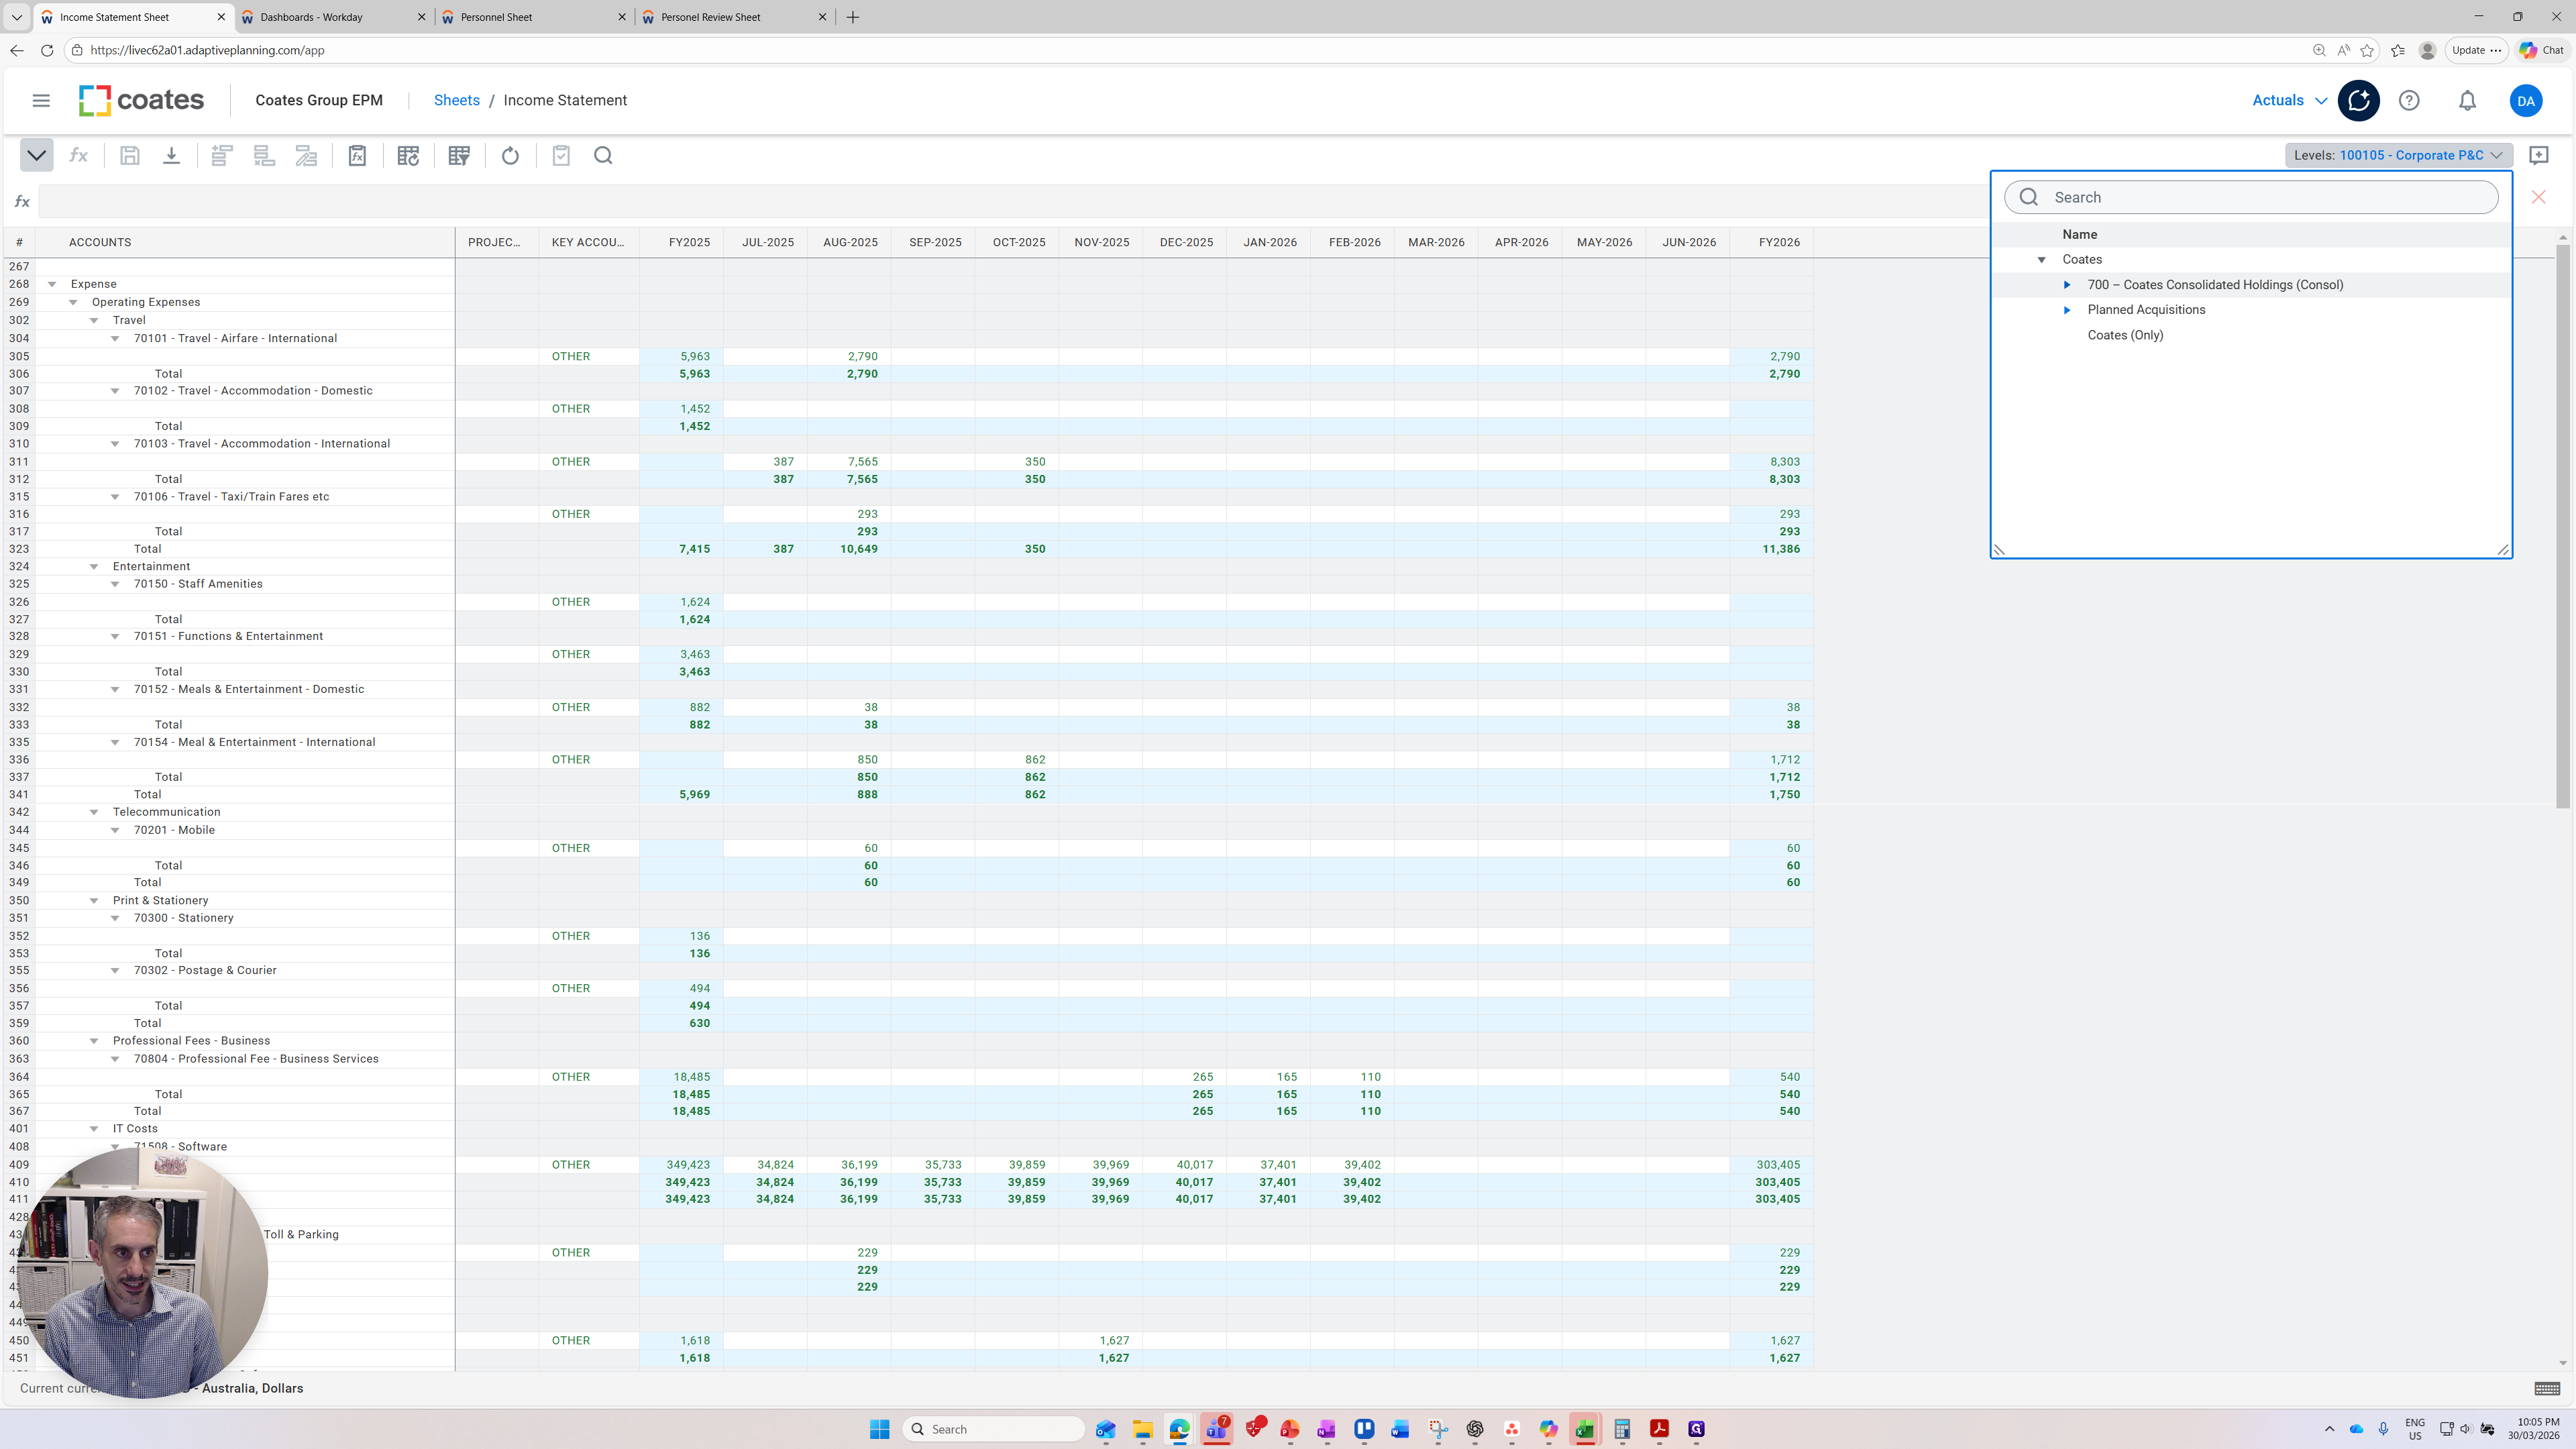
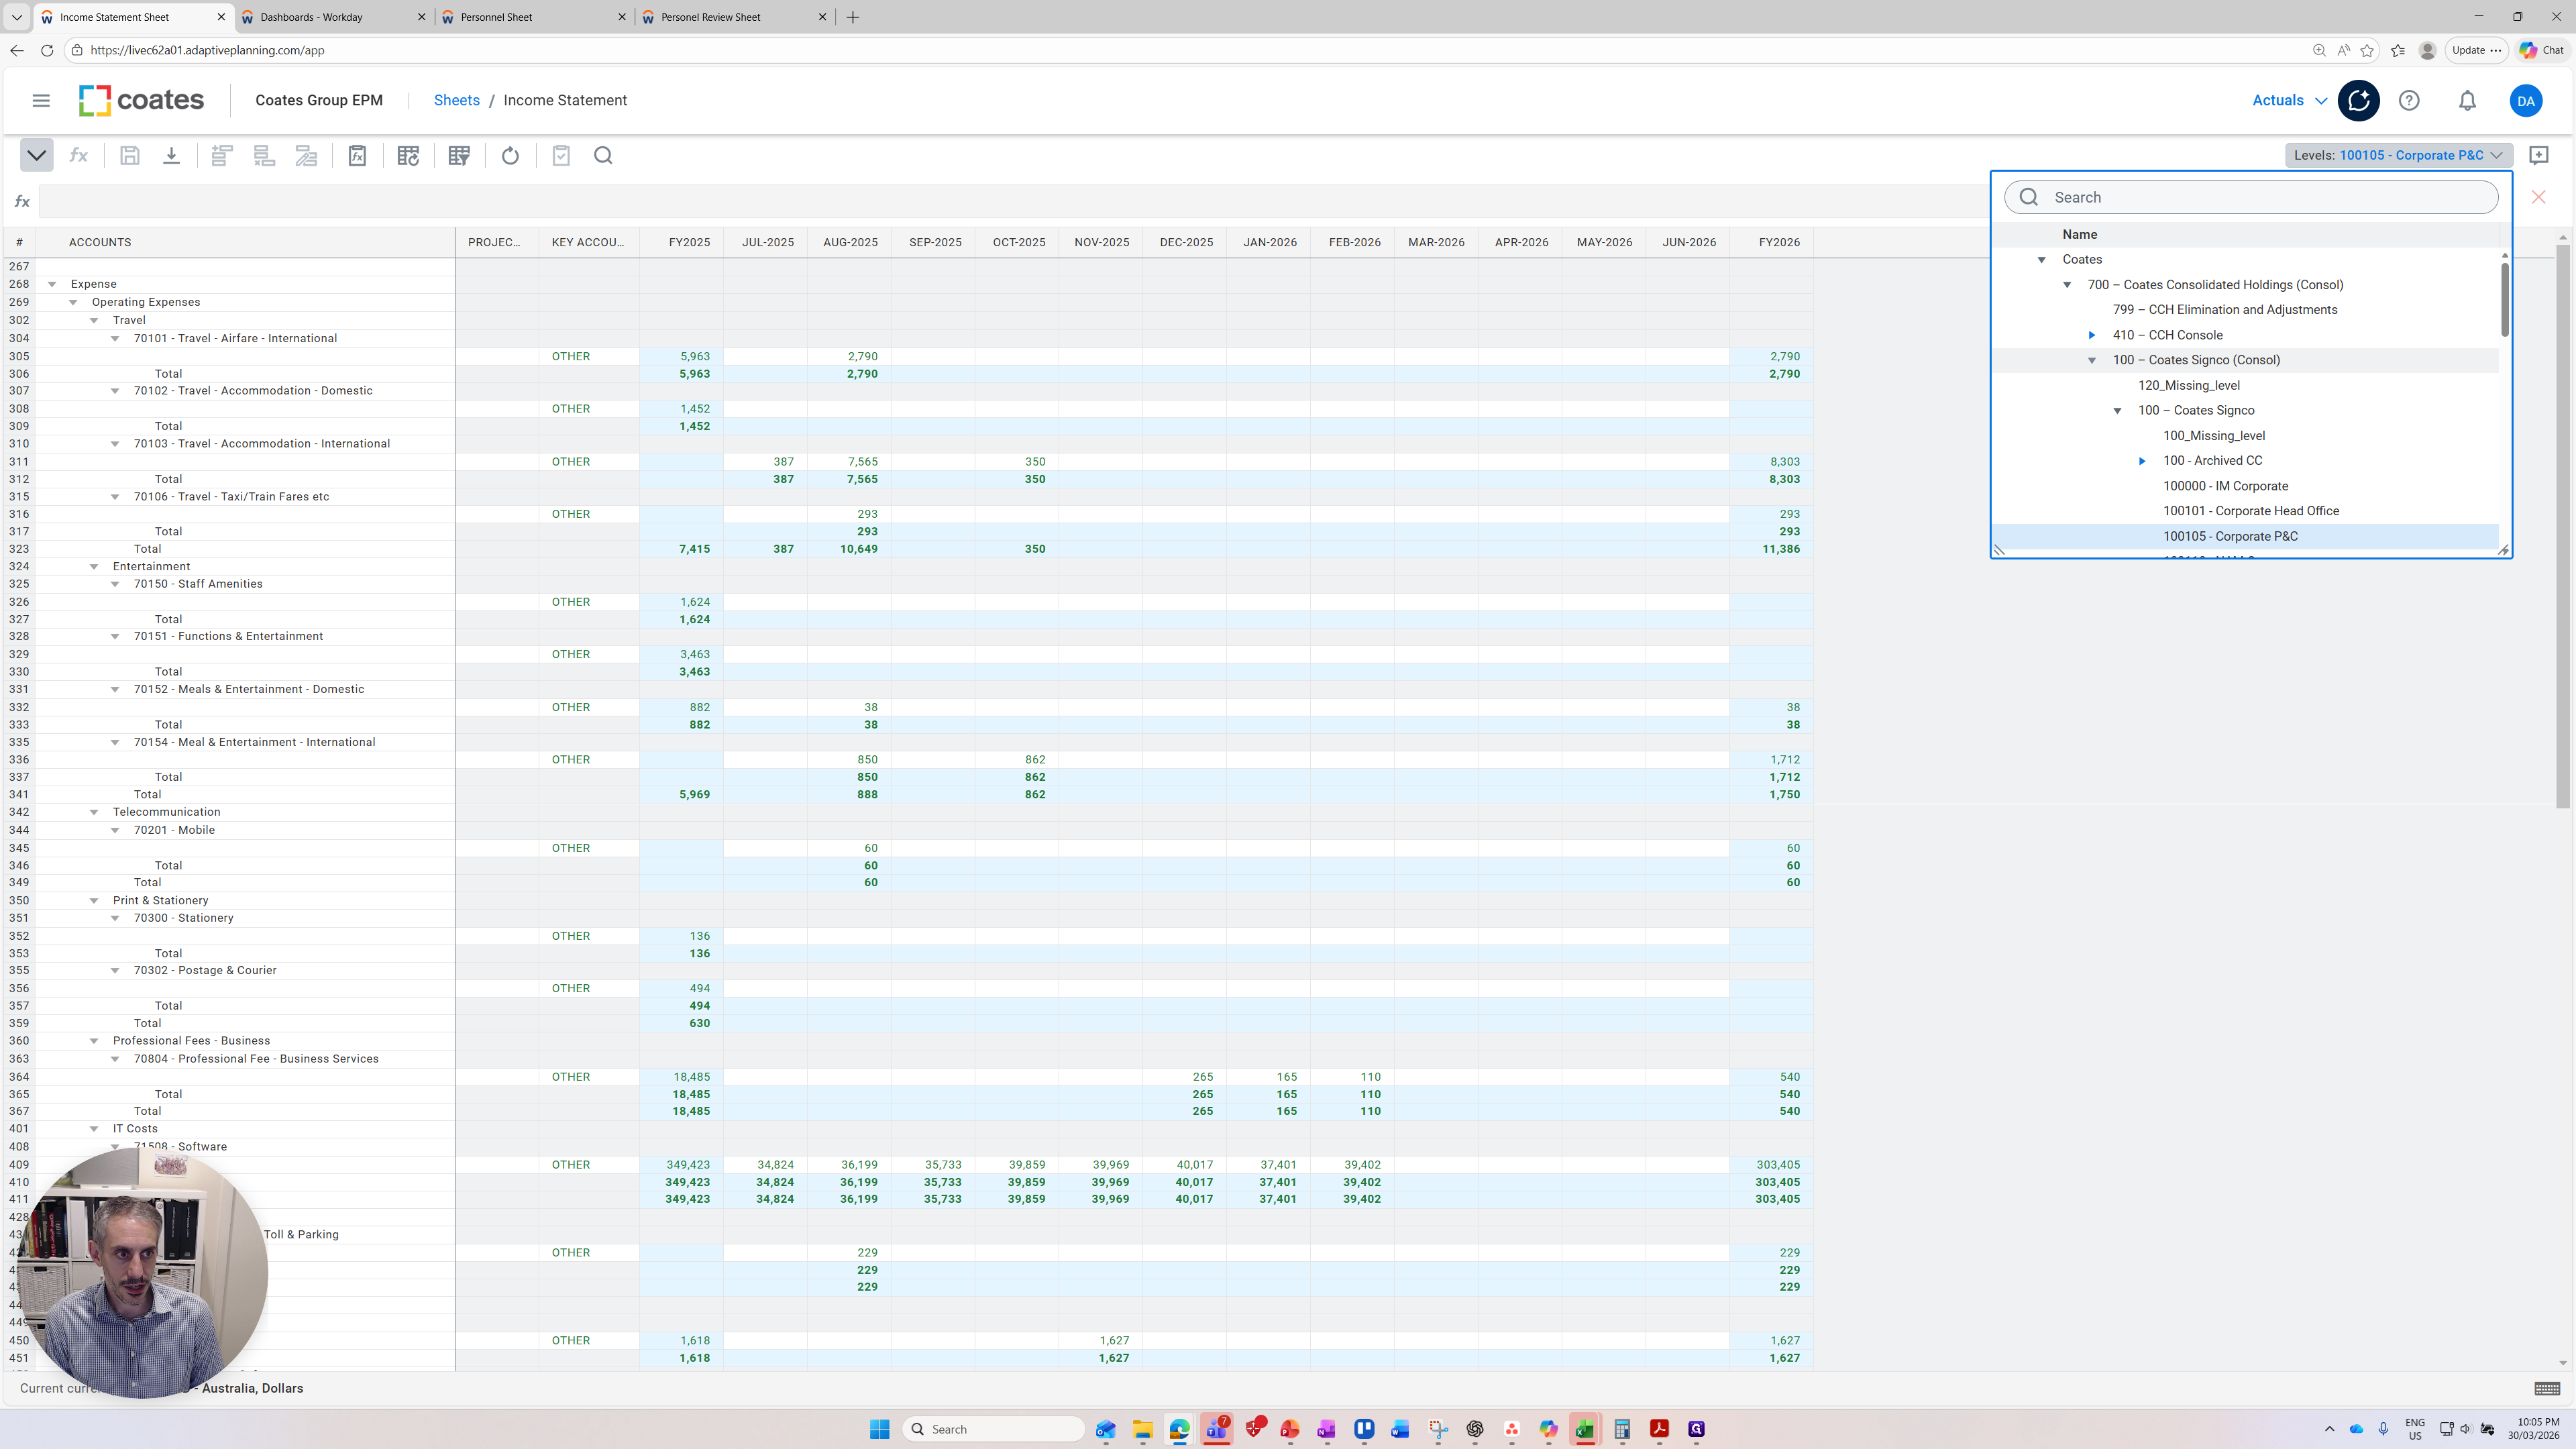
If I show this to the accountants, it might look familiar. For others, it may be more complex. Essentially, it's the names of the legal entities within the business. You can click and expand each of the legal entities.
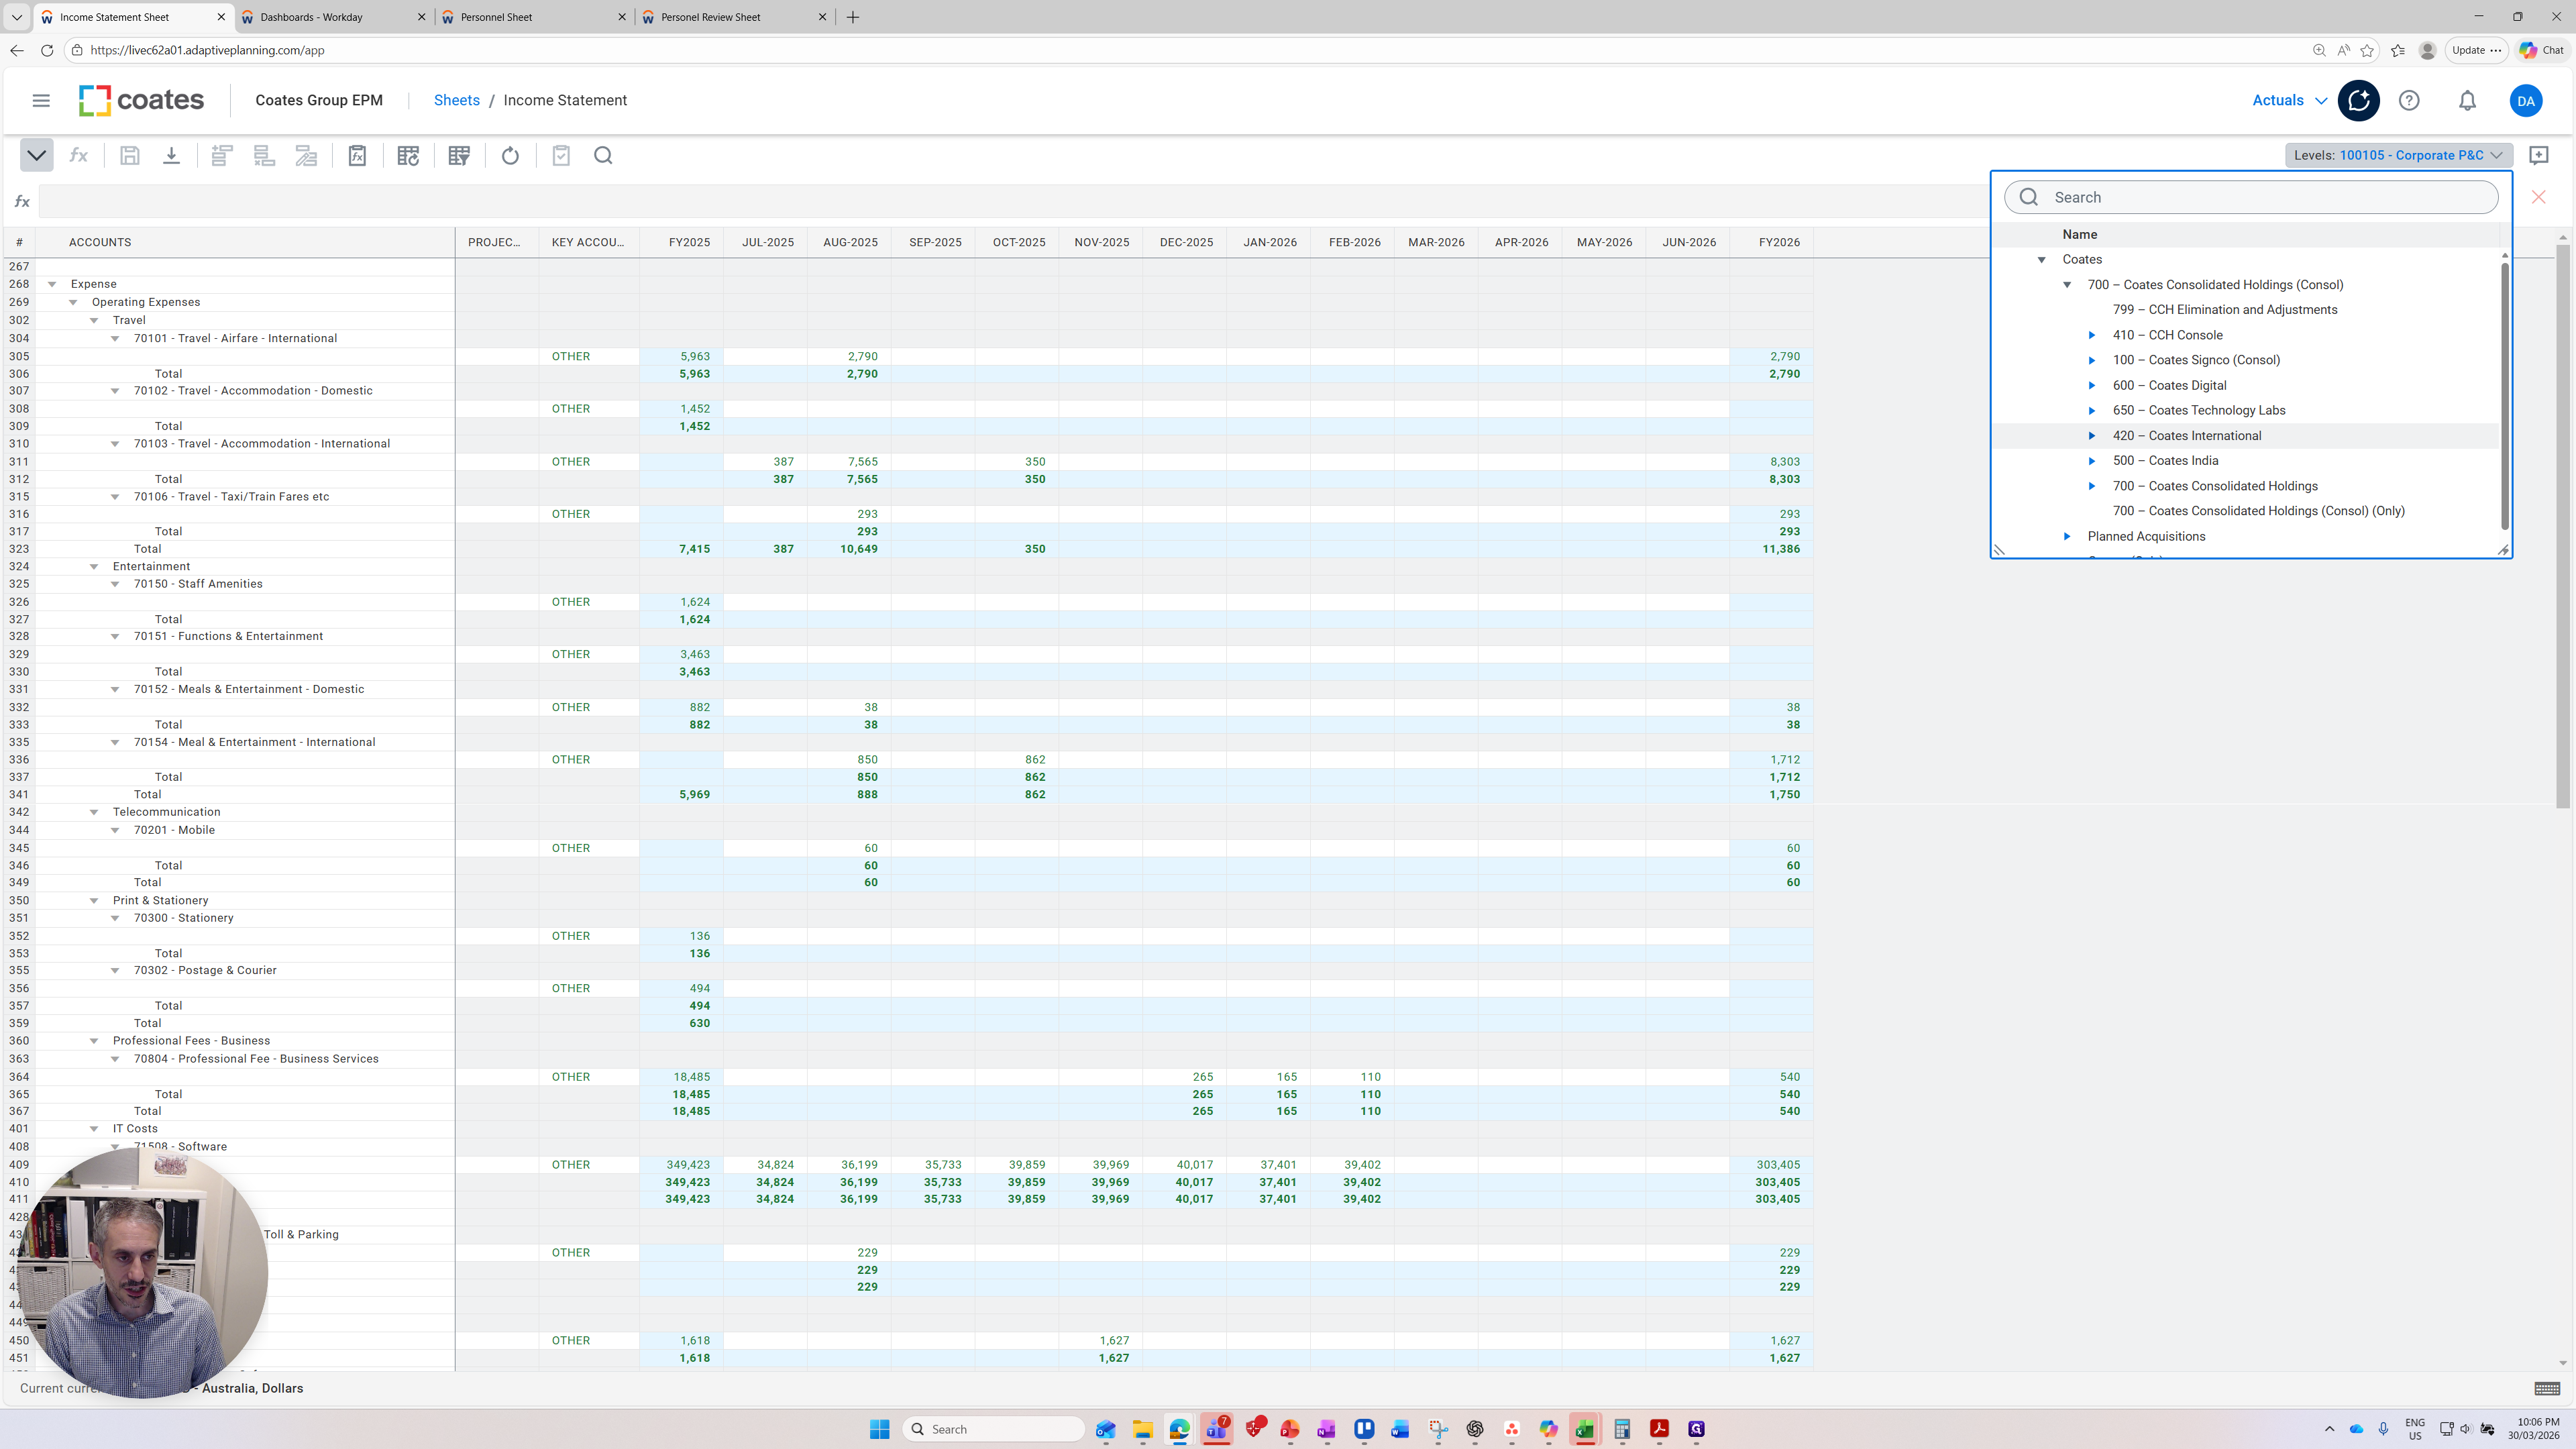
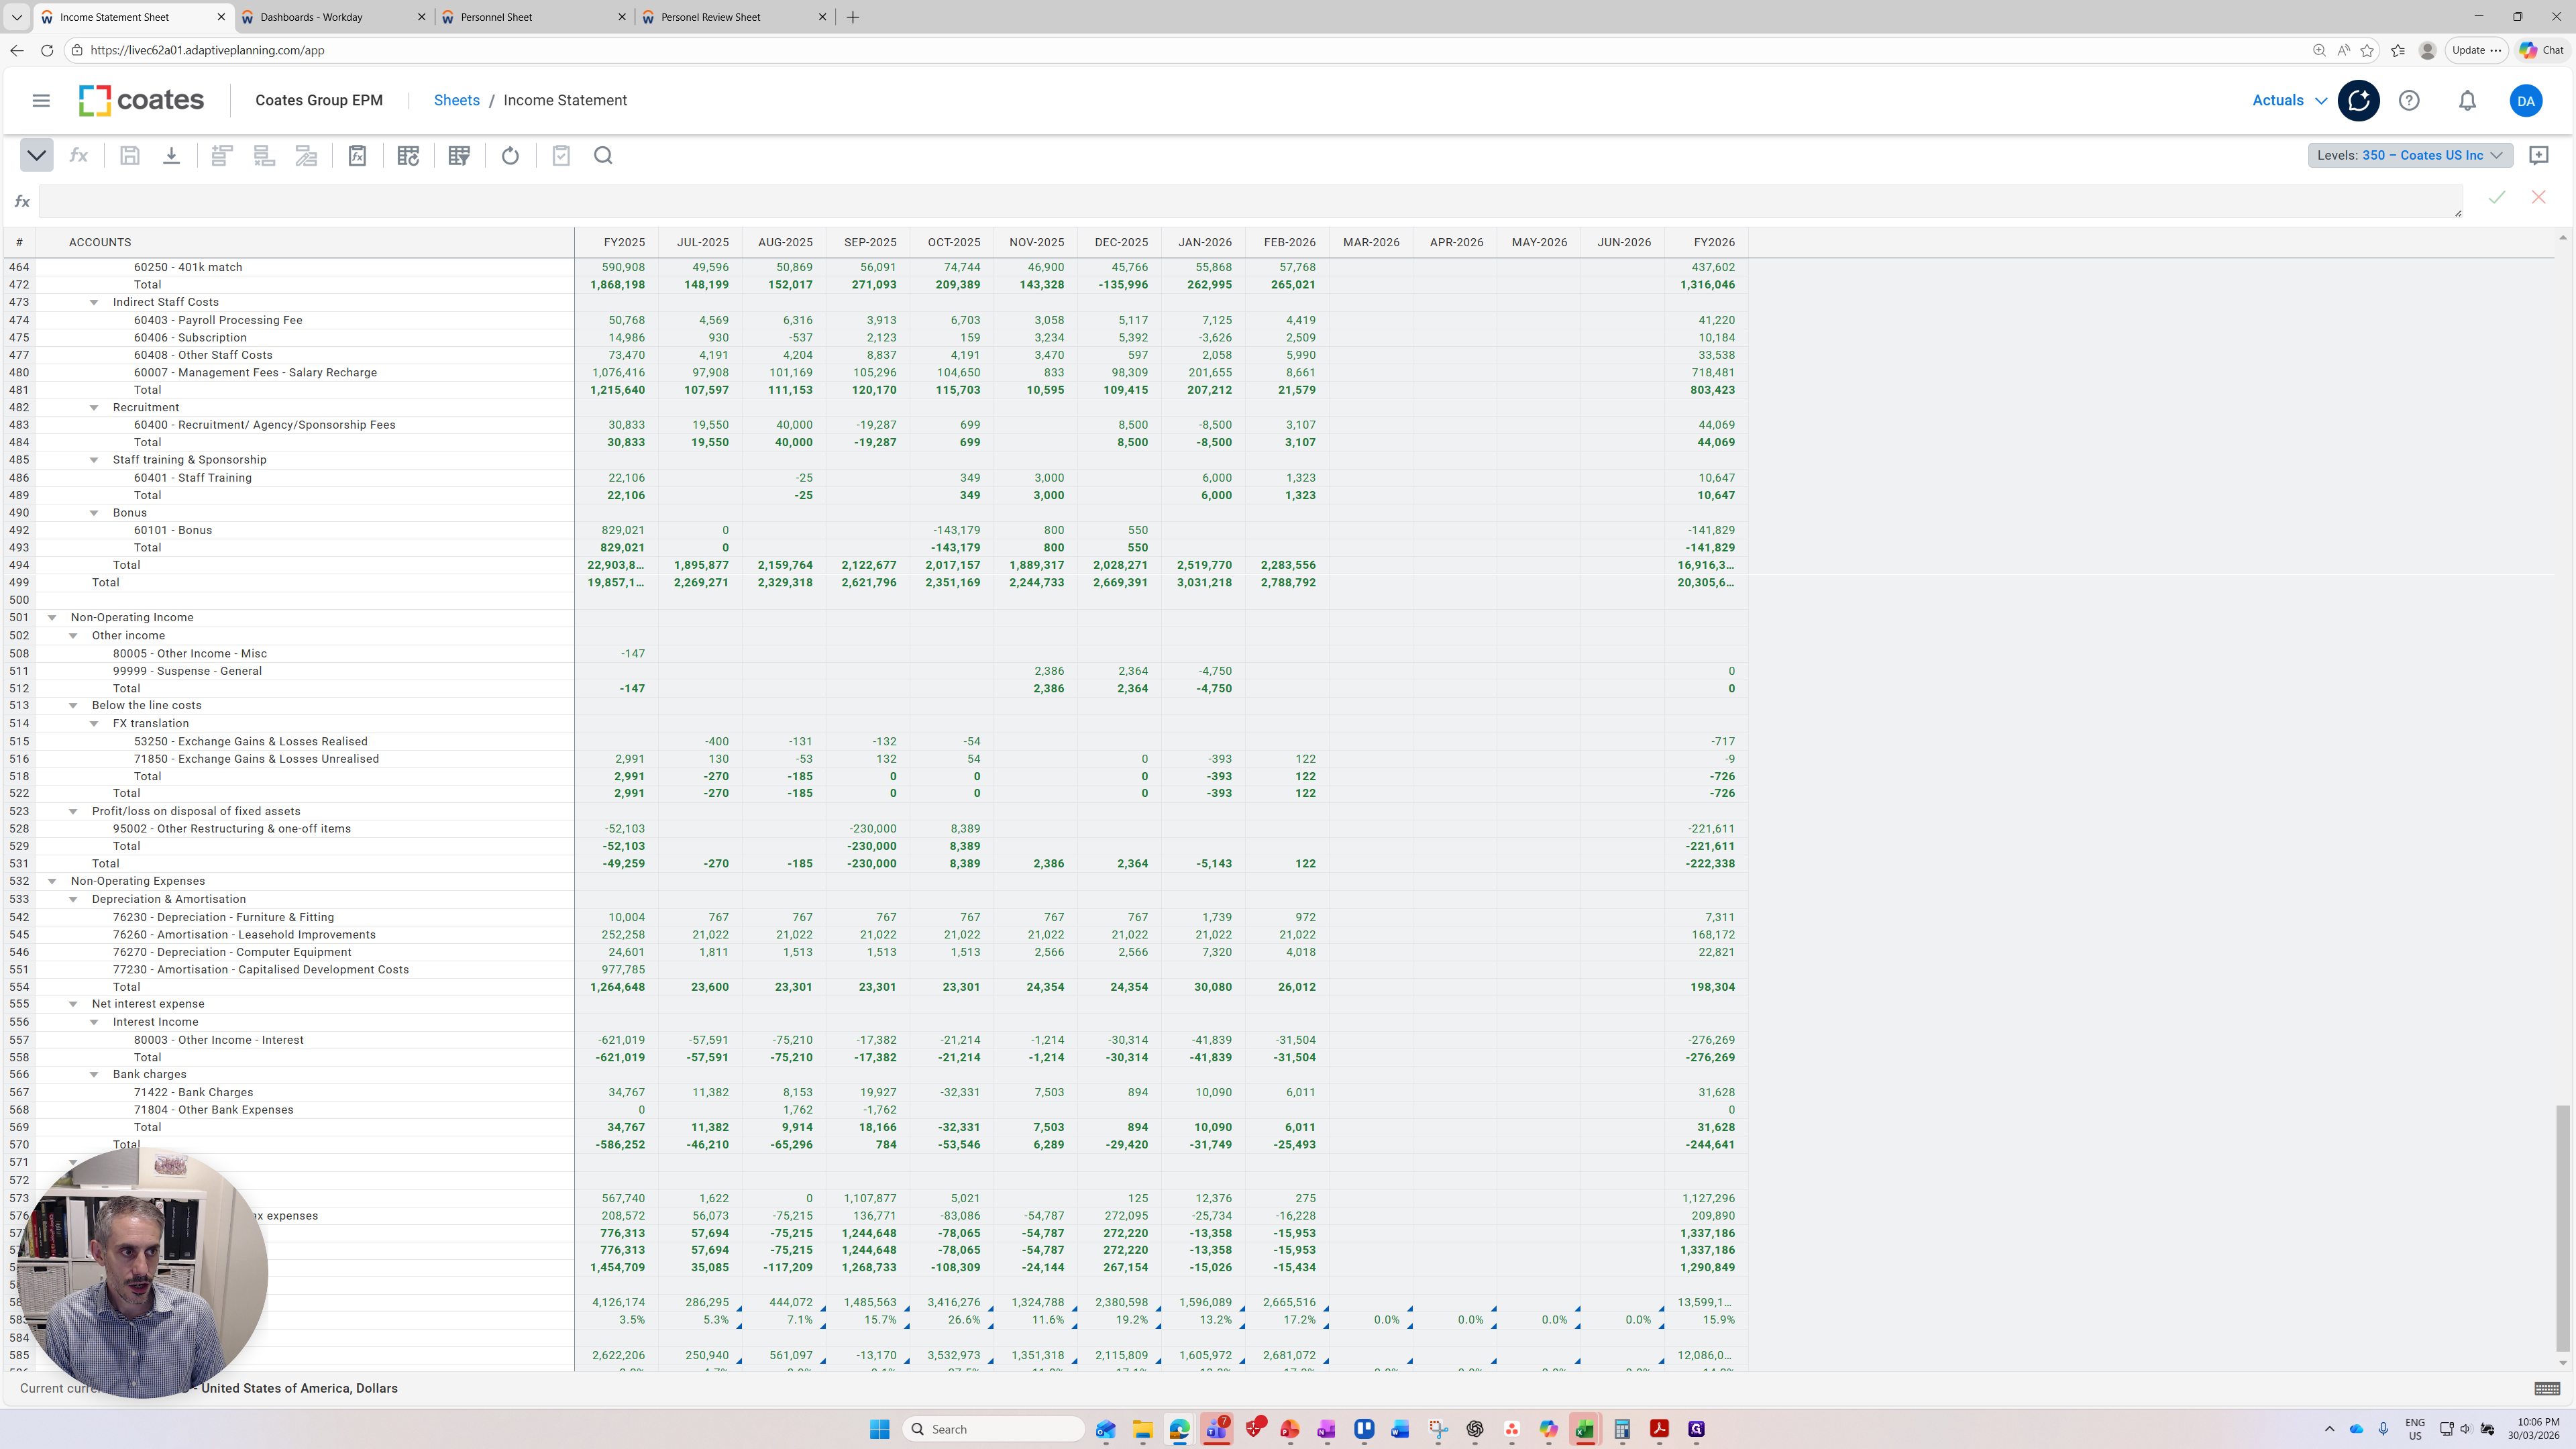
Within each of them, for example, Coates International is a holding company for other legal entities. I have Coates USA here. I can click on Coates USA and refresh it. This will display the legal entity of Coates USA.
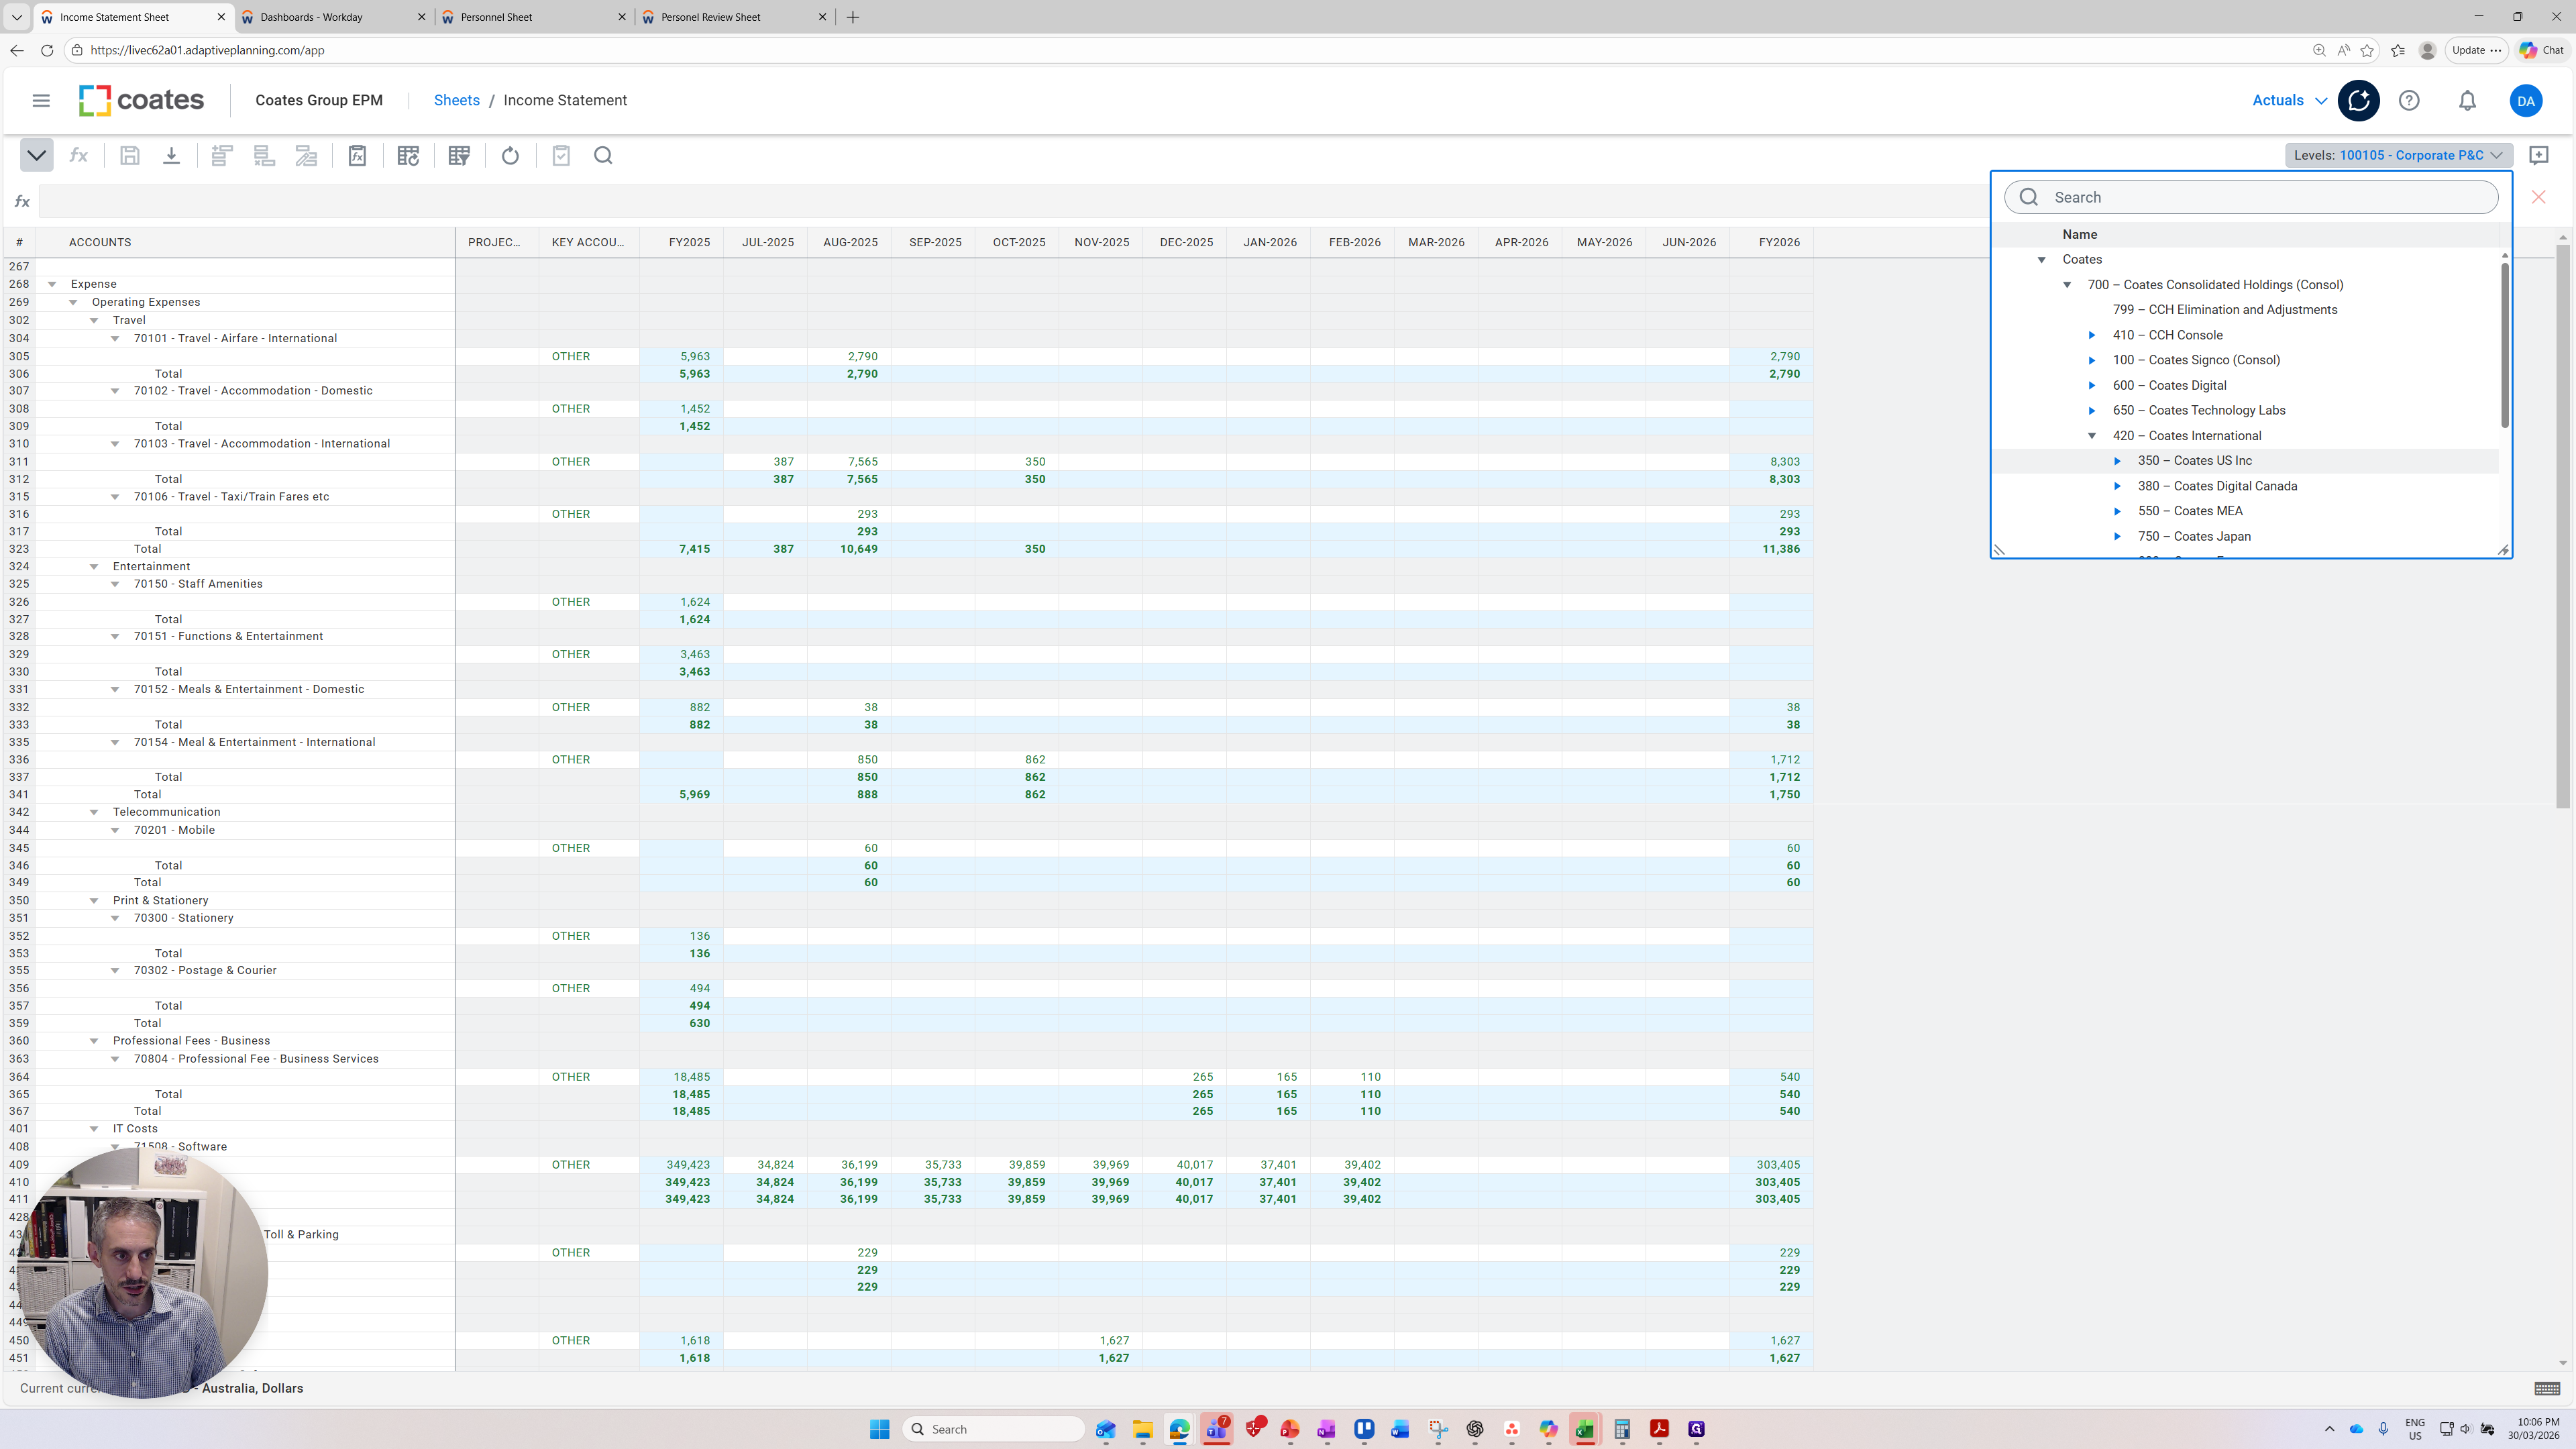
Alternatively, I can come in and click into an individual cost center that Coats USA might have, such as IM Corp.
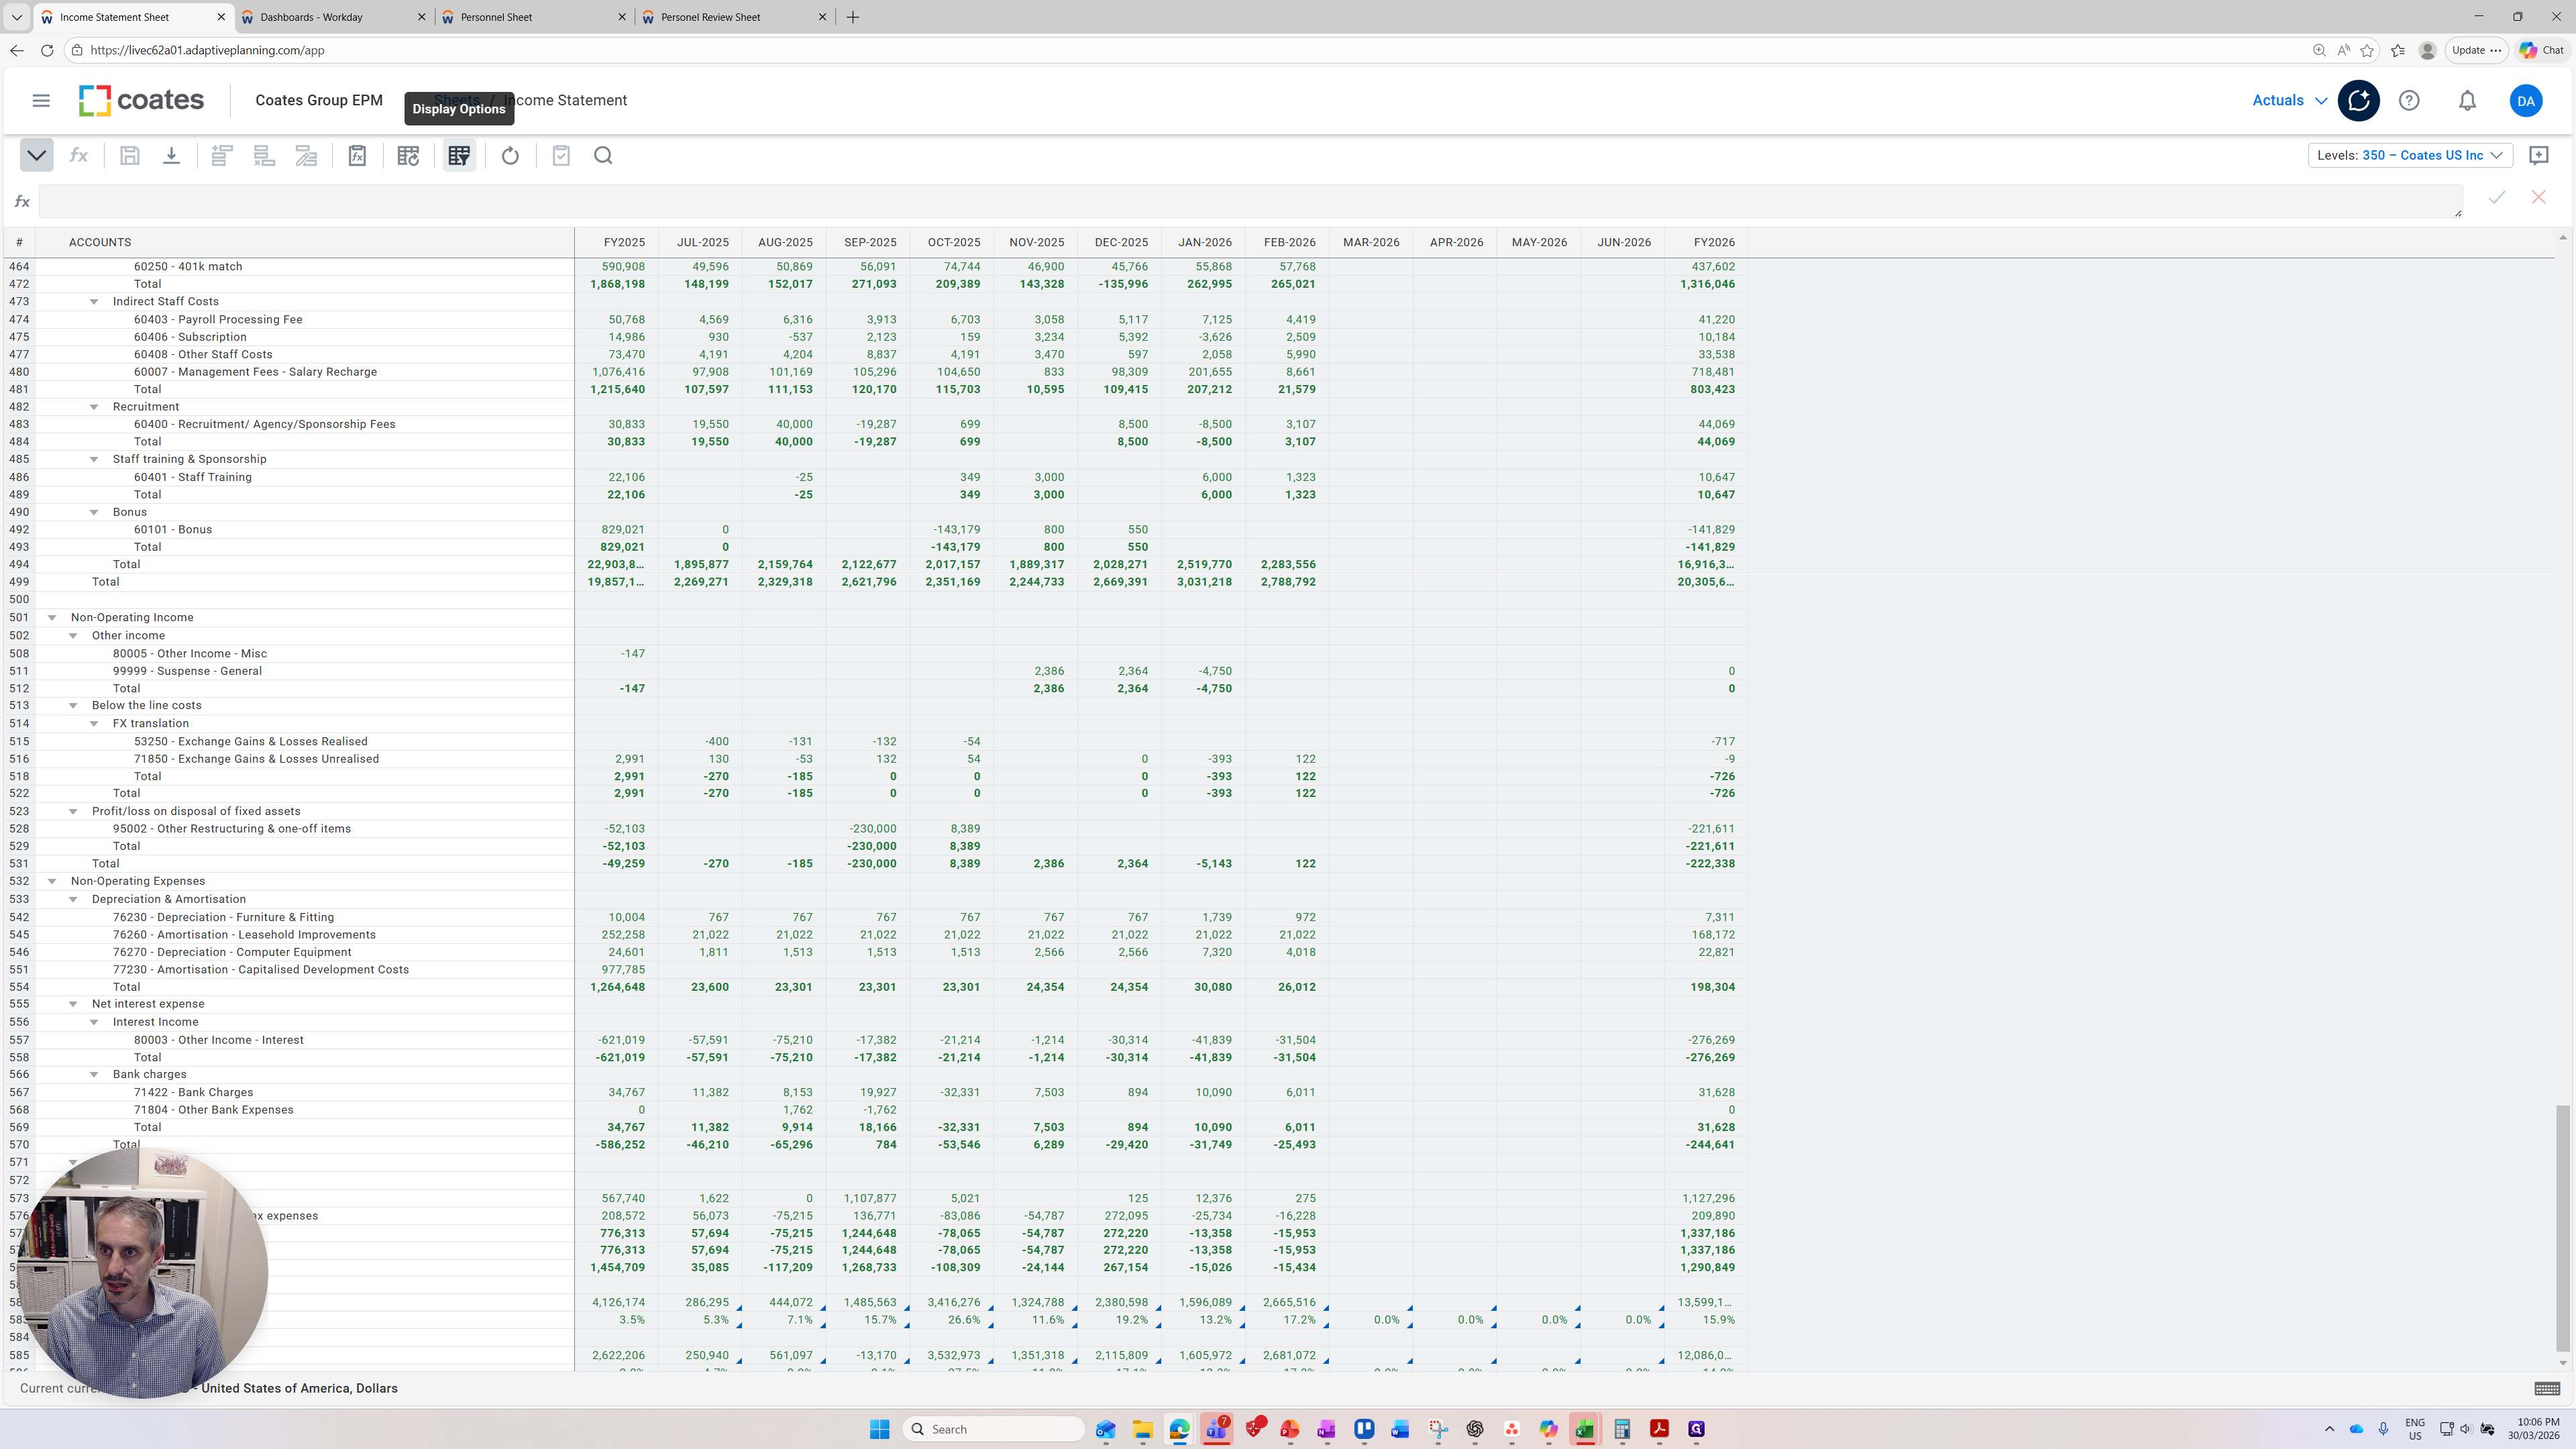
We have discussed the versions. Next, I want to discuss the features on the left. The most important feature is this small bar called Display Options. Display options are very powerful and its main purpose is to control the period you display.
Here, we are displaying FY25 and FY26 month-to-month data, as well as the full year totals. We can change that in the display options.
Within display options, clicking on it shows different boxes and options to change the time. We can present FY24 if we want to. We can present no months.
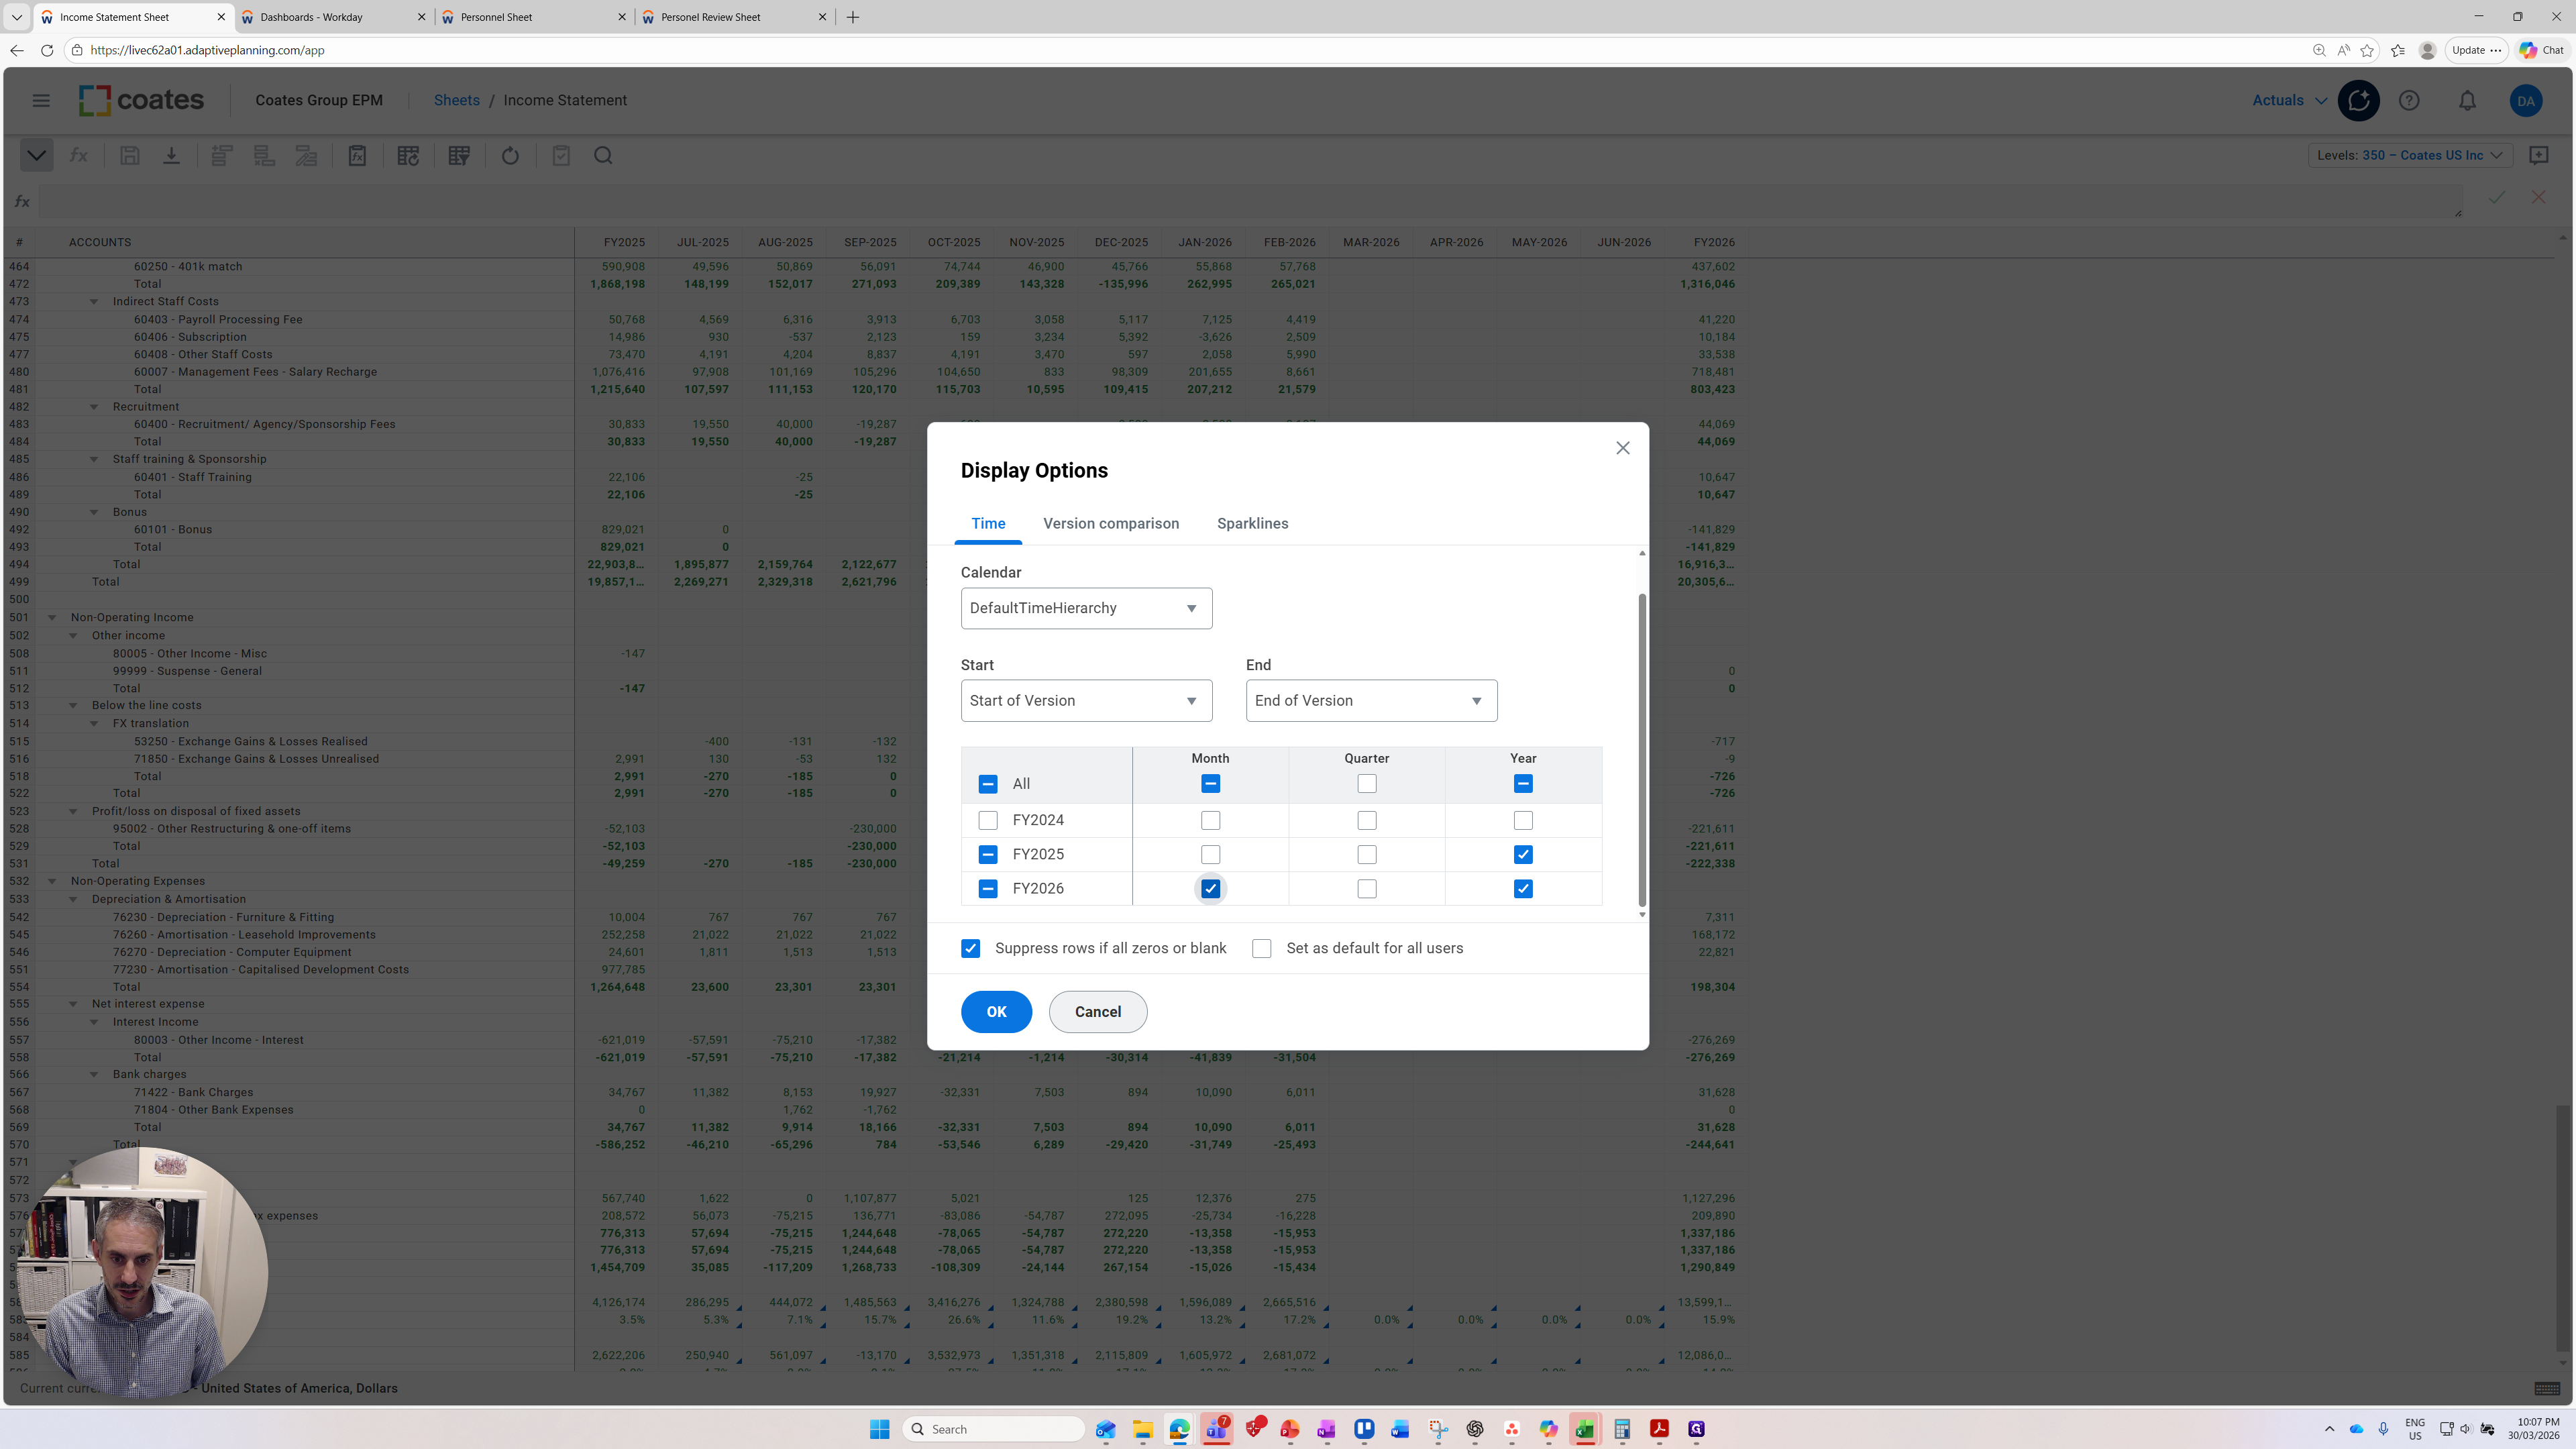
If I remove that, it will show no months, and I will have FY25 and FY26. We can suppress rows if all values are zero or blank. We cannot suppress rows.

If I do this, we should see some changes, such as only two columns being present.
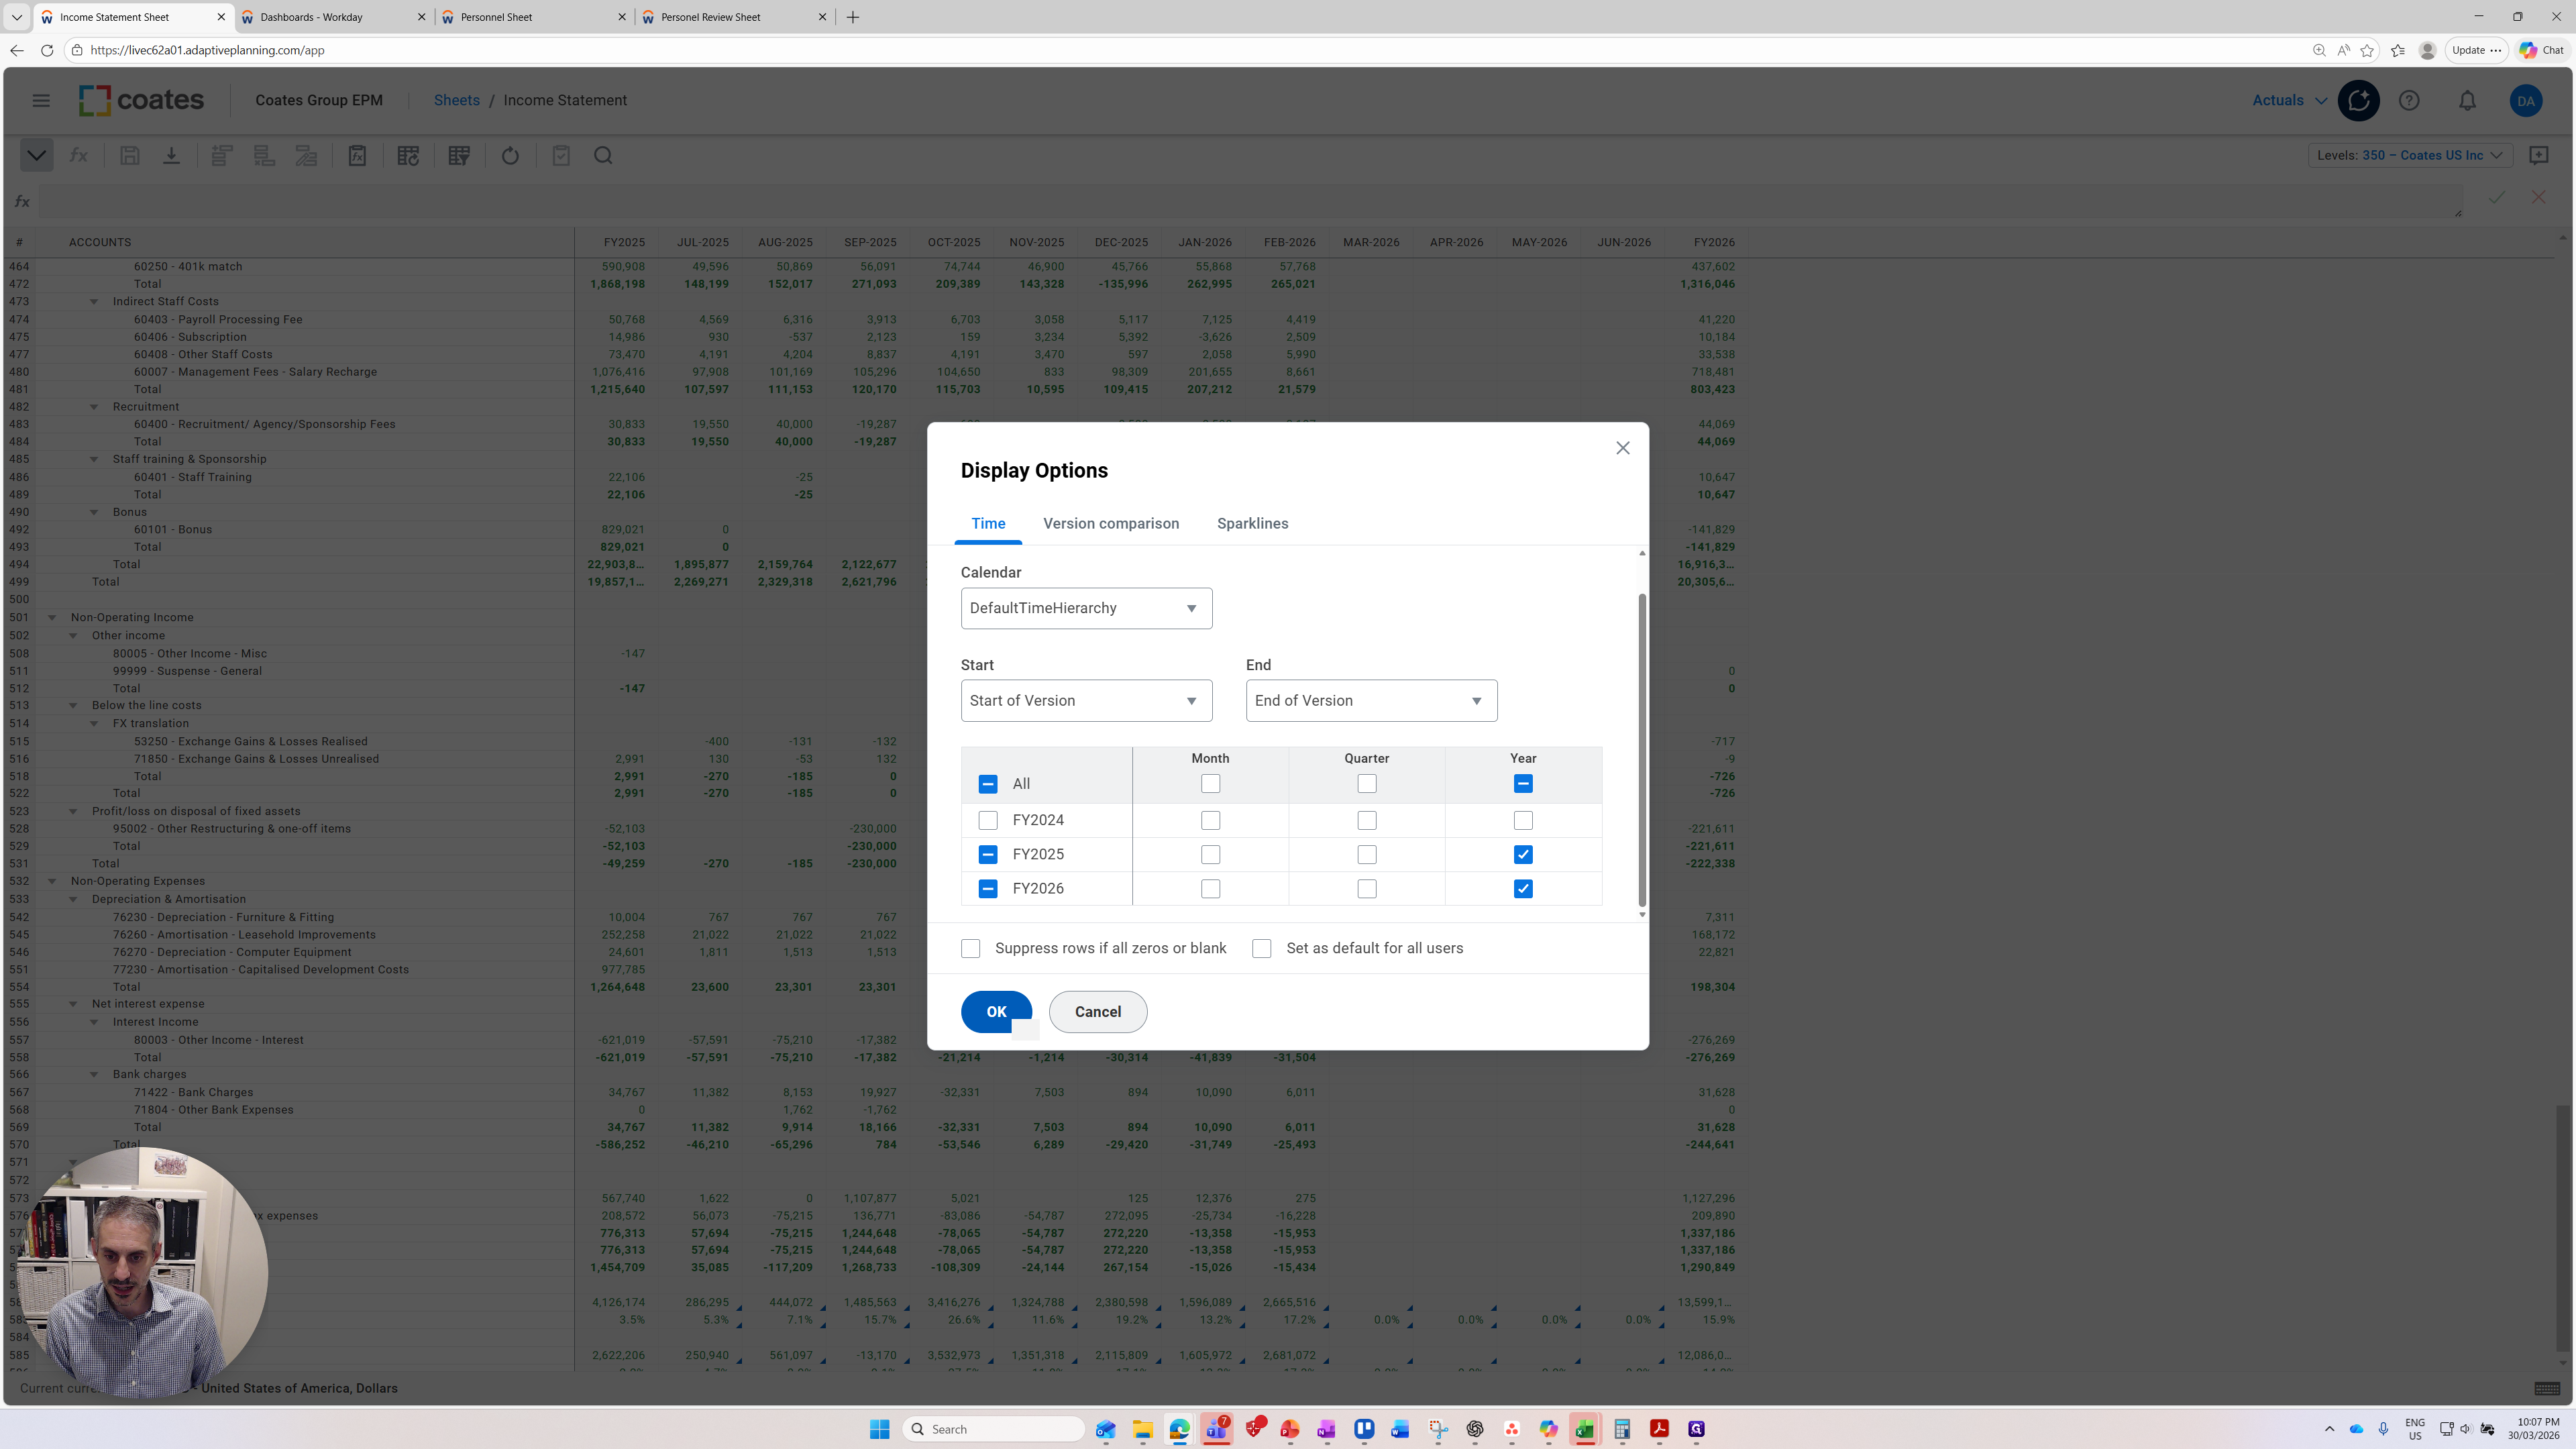
You can see that only FY25 and FY26 are present because I removed the monthly columns for FY26. The other change I made is to not hide zero. You can see that rows 46, 47, and 48 do not contain any zeros.
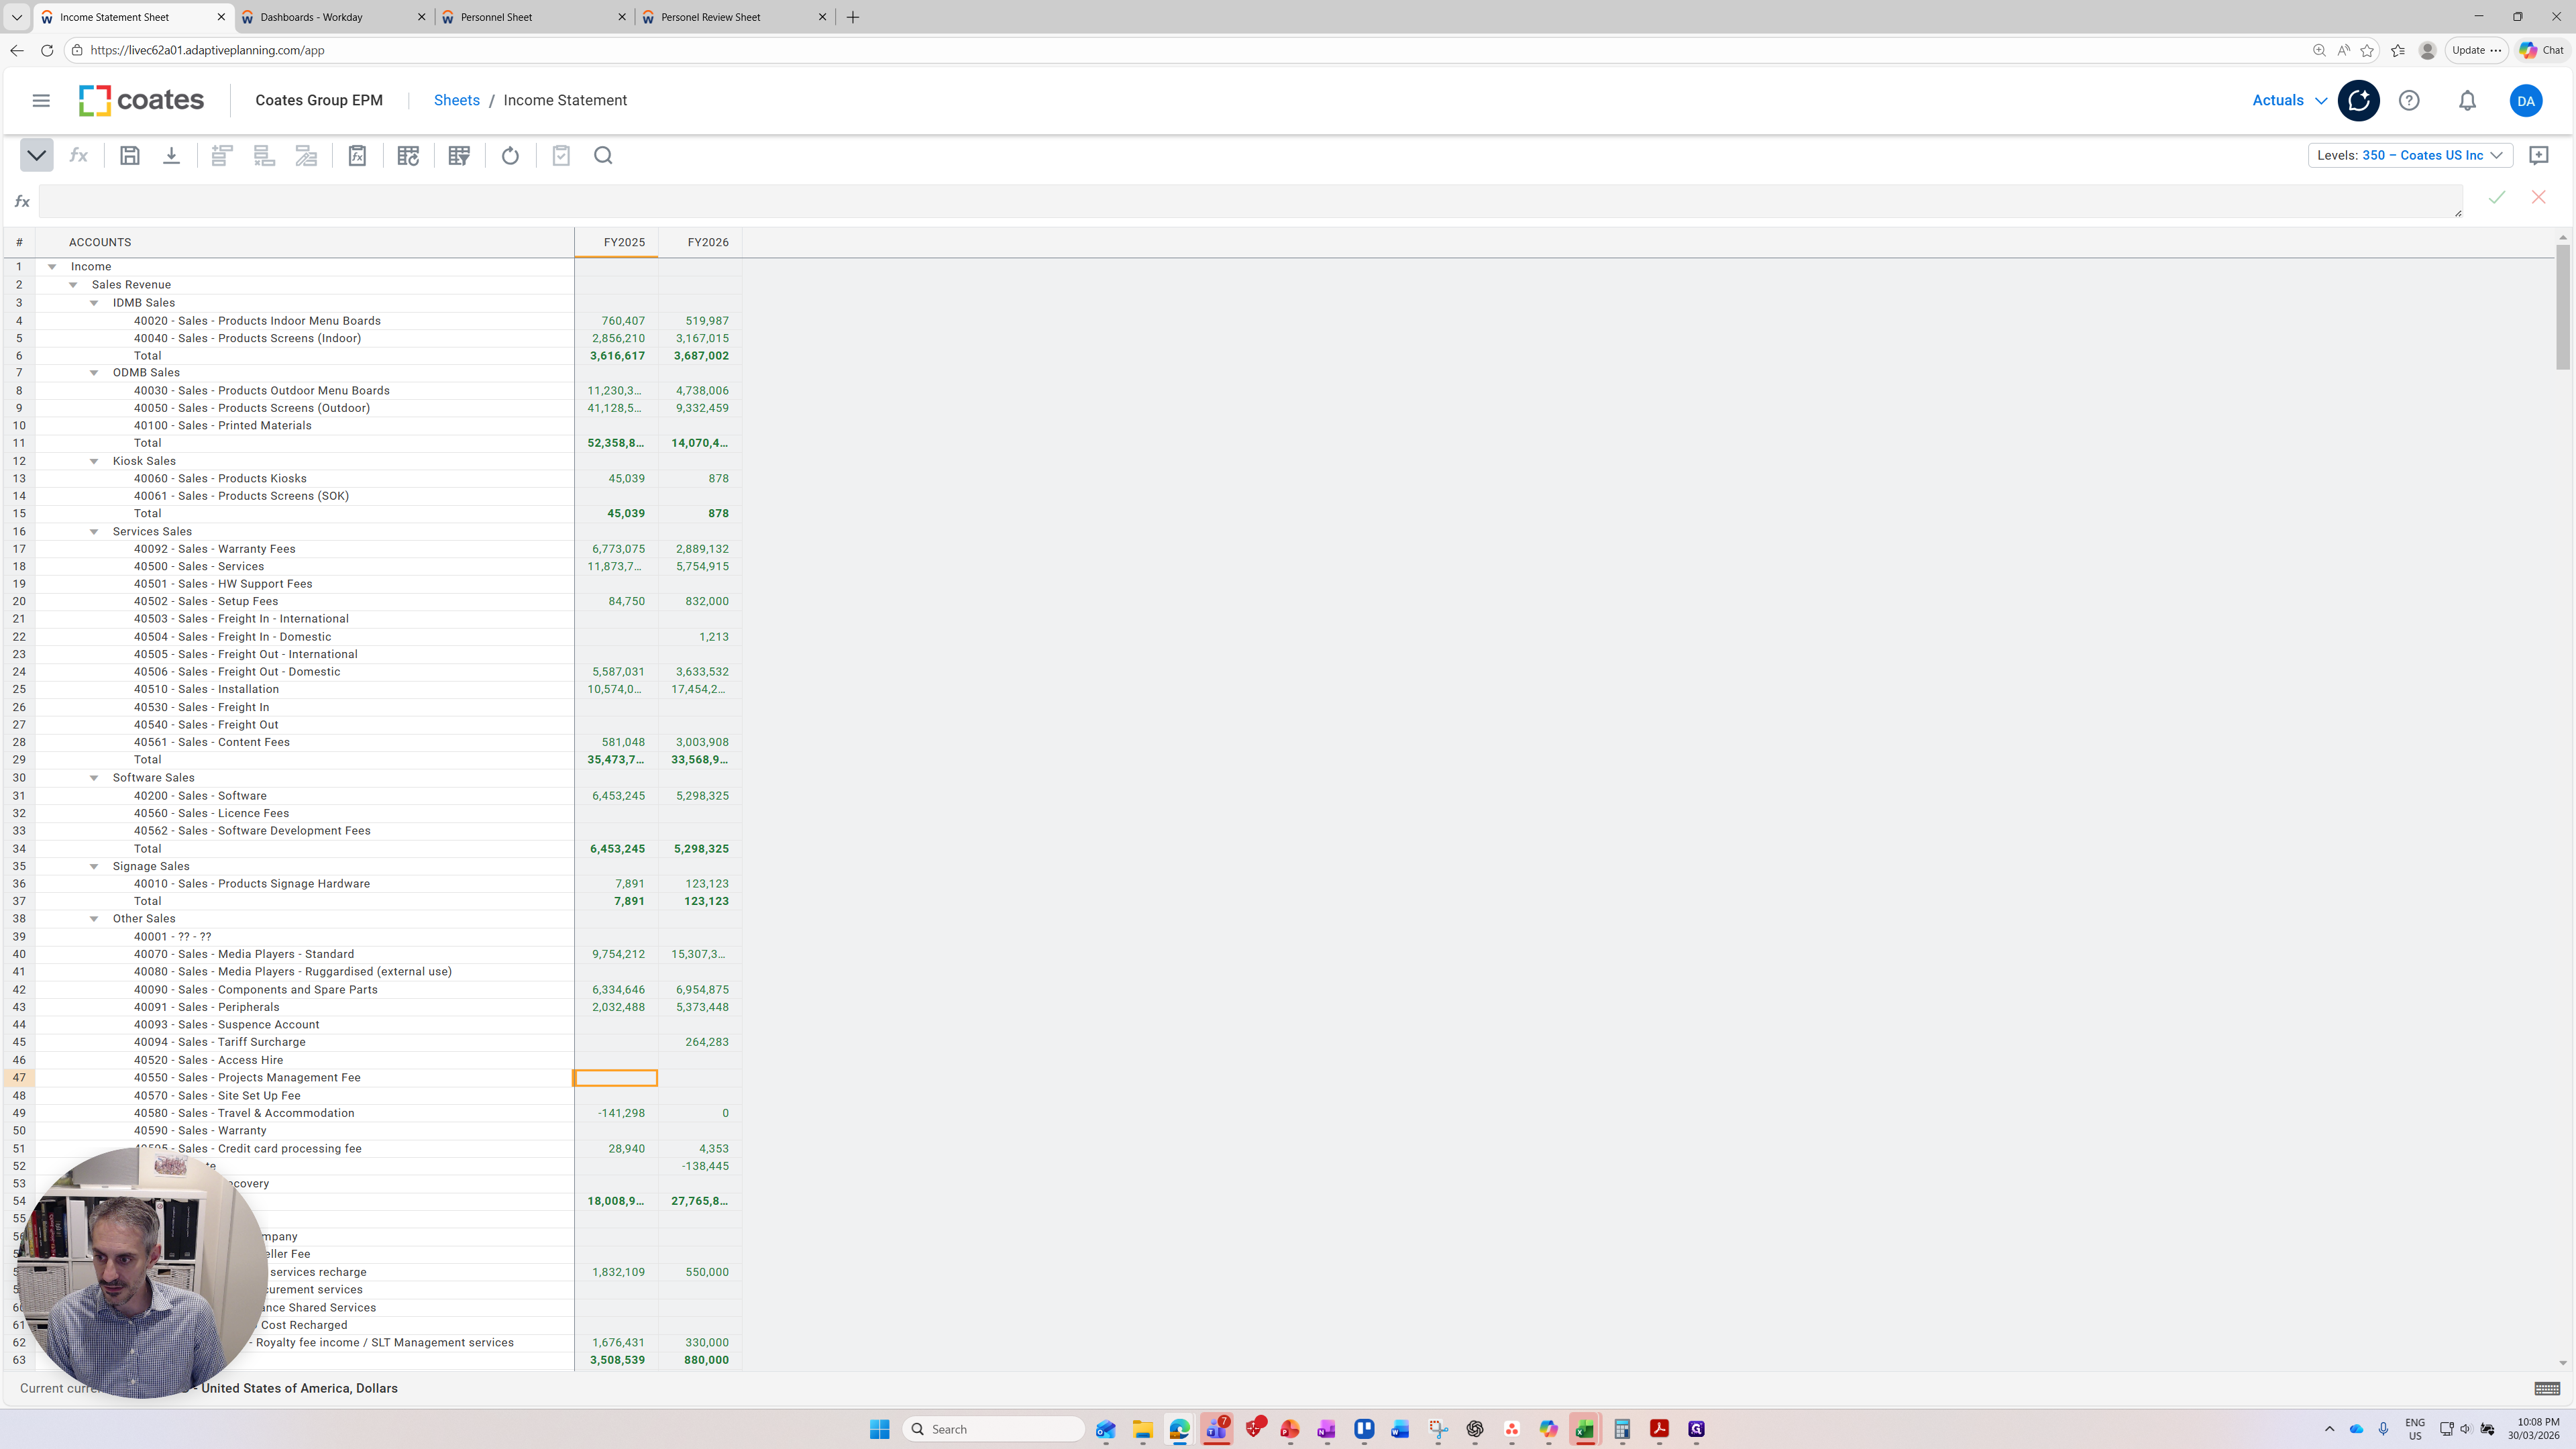
There are no values in these cells because I did not suppress zeros.
That covers the basics of getting started in Adaptive Planning.