Icon

Managing Data Sources in Legal Watch

Learn how to monitor, troubleshoot, edit, and preview legal data sources in the Legal Watch Source Management dashboard.

By Obama

This guide explains how to monitor, troubleshoot, and configure web scraping parameters for legal data sources. Completing this ensures your information feeds remain accurate, up-to-date, and free of persistent errors.

This workflow is primarily intended for legal engineers and system administrators responsible for maintaining data ingestion pipelines and resolving scraping failures in the platform.

Navigating the Dashboard

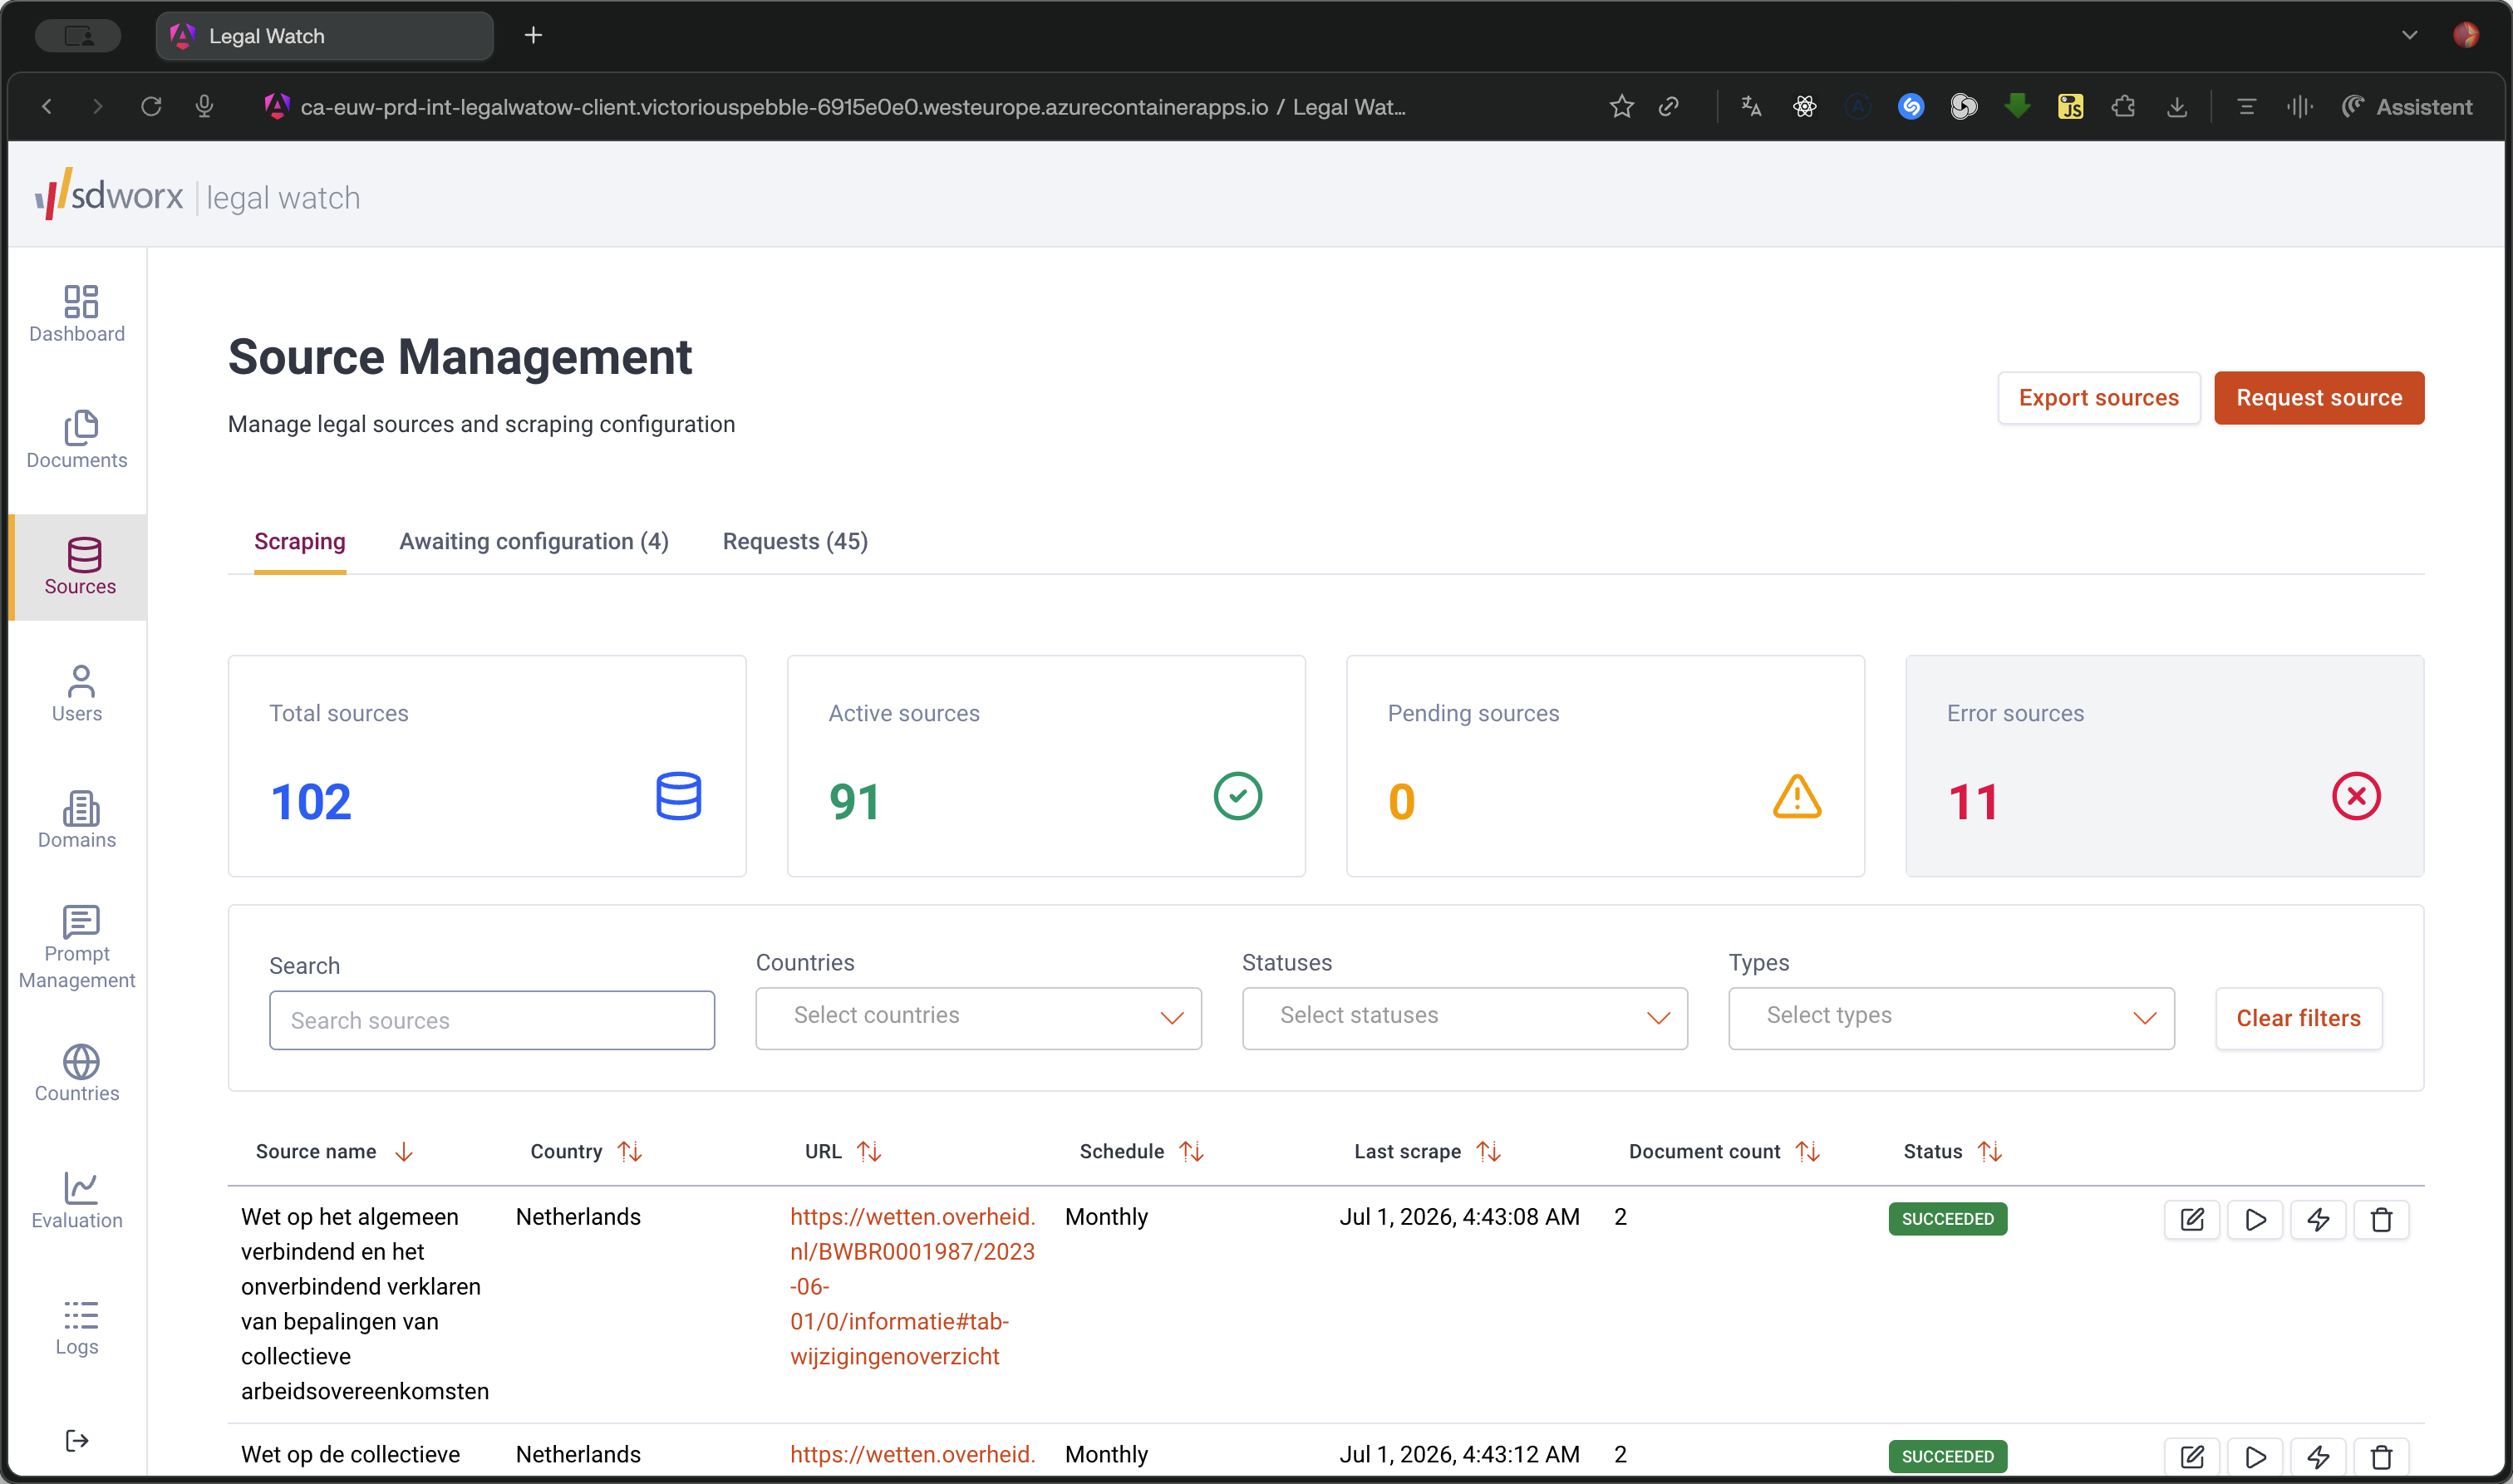
The Source Management dashboard provides a high-level overview of your data ingestion. At the top of the page, overview cards display counts for your total, active, pending, and errored sources.

You can quickly narrow down the visible sources using the filtering options available on this view:

Filter Type

Purpose

Sources

Search for a specific legal document or data origin by name.

Countries

Narrow down results to legal feeds from a specific geographic region.

Statuses

View sources based on their health (Active, Pending, Failed, or Partially Failed).

Types

Filter by the scraping method (e.g., Direct source, Custom scraper).

Troubleshooting Failed Sources

When scraping tasks fail, use the dashboard to identify the root cause and re-run the job.
1
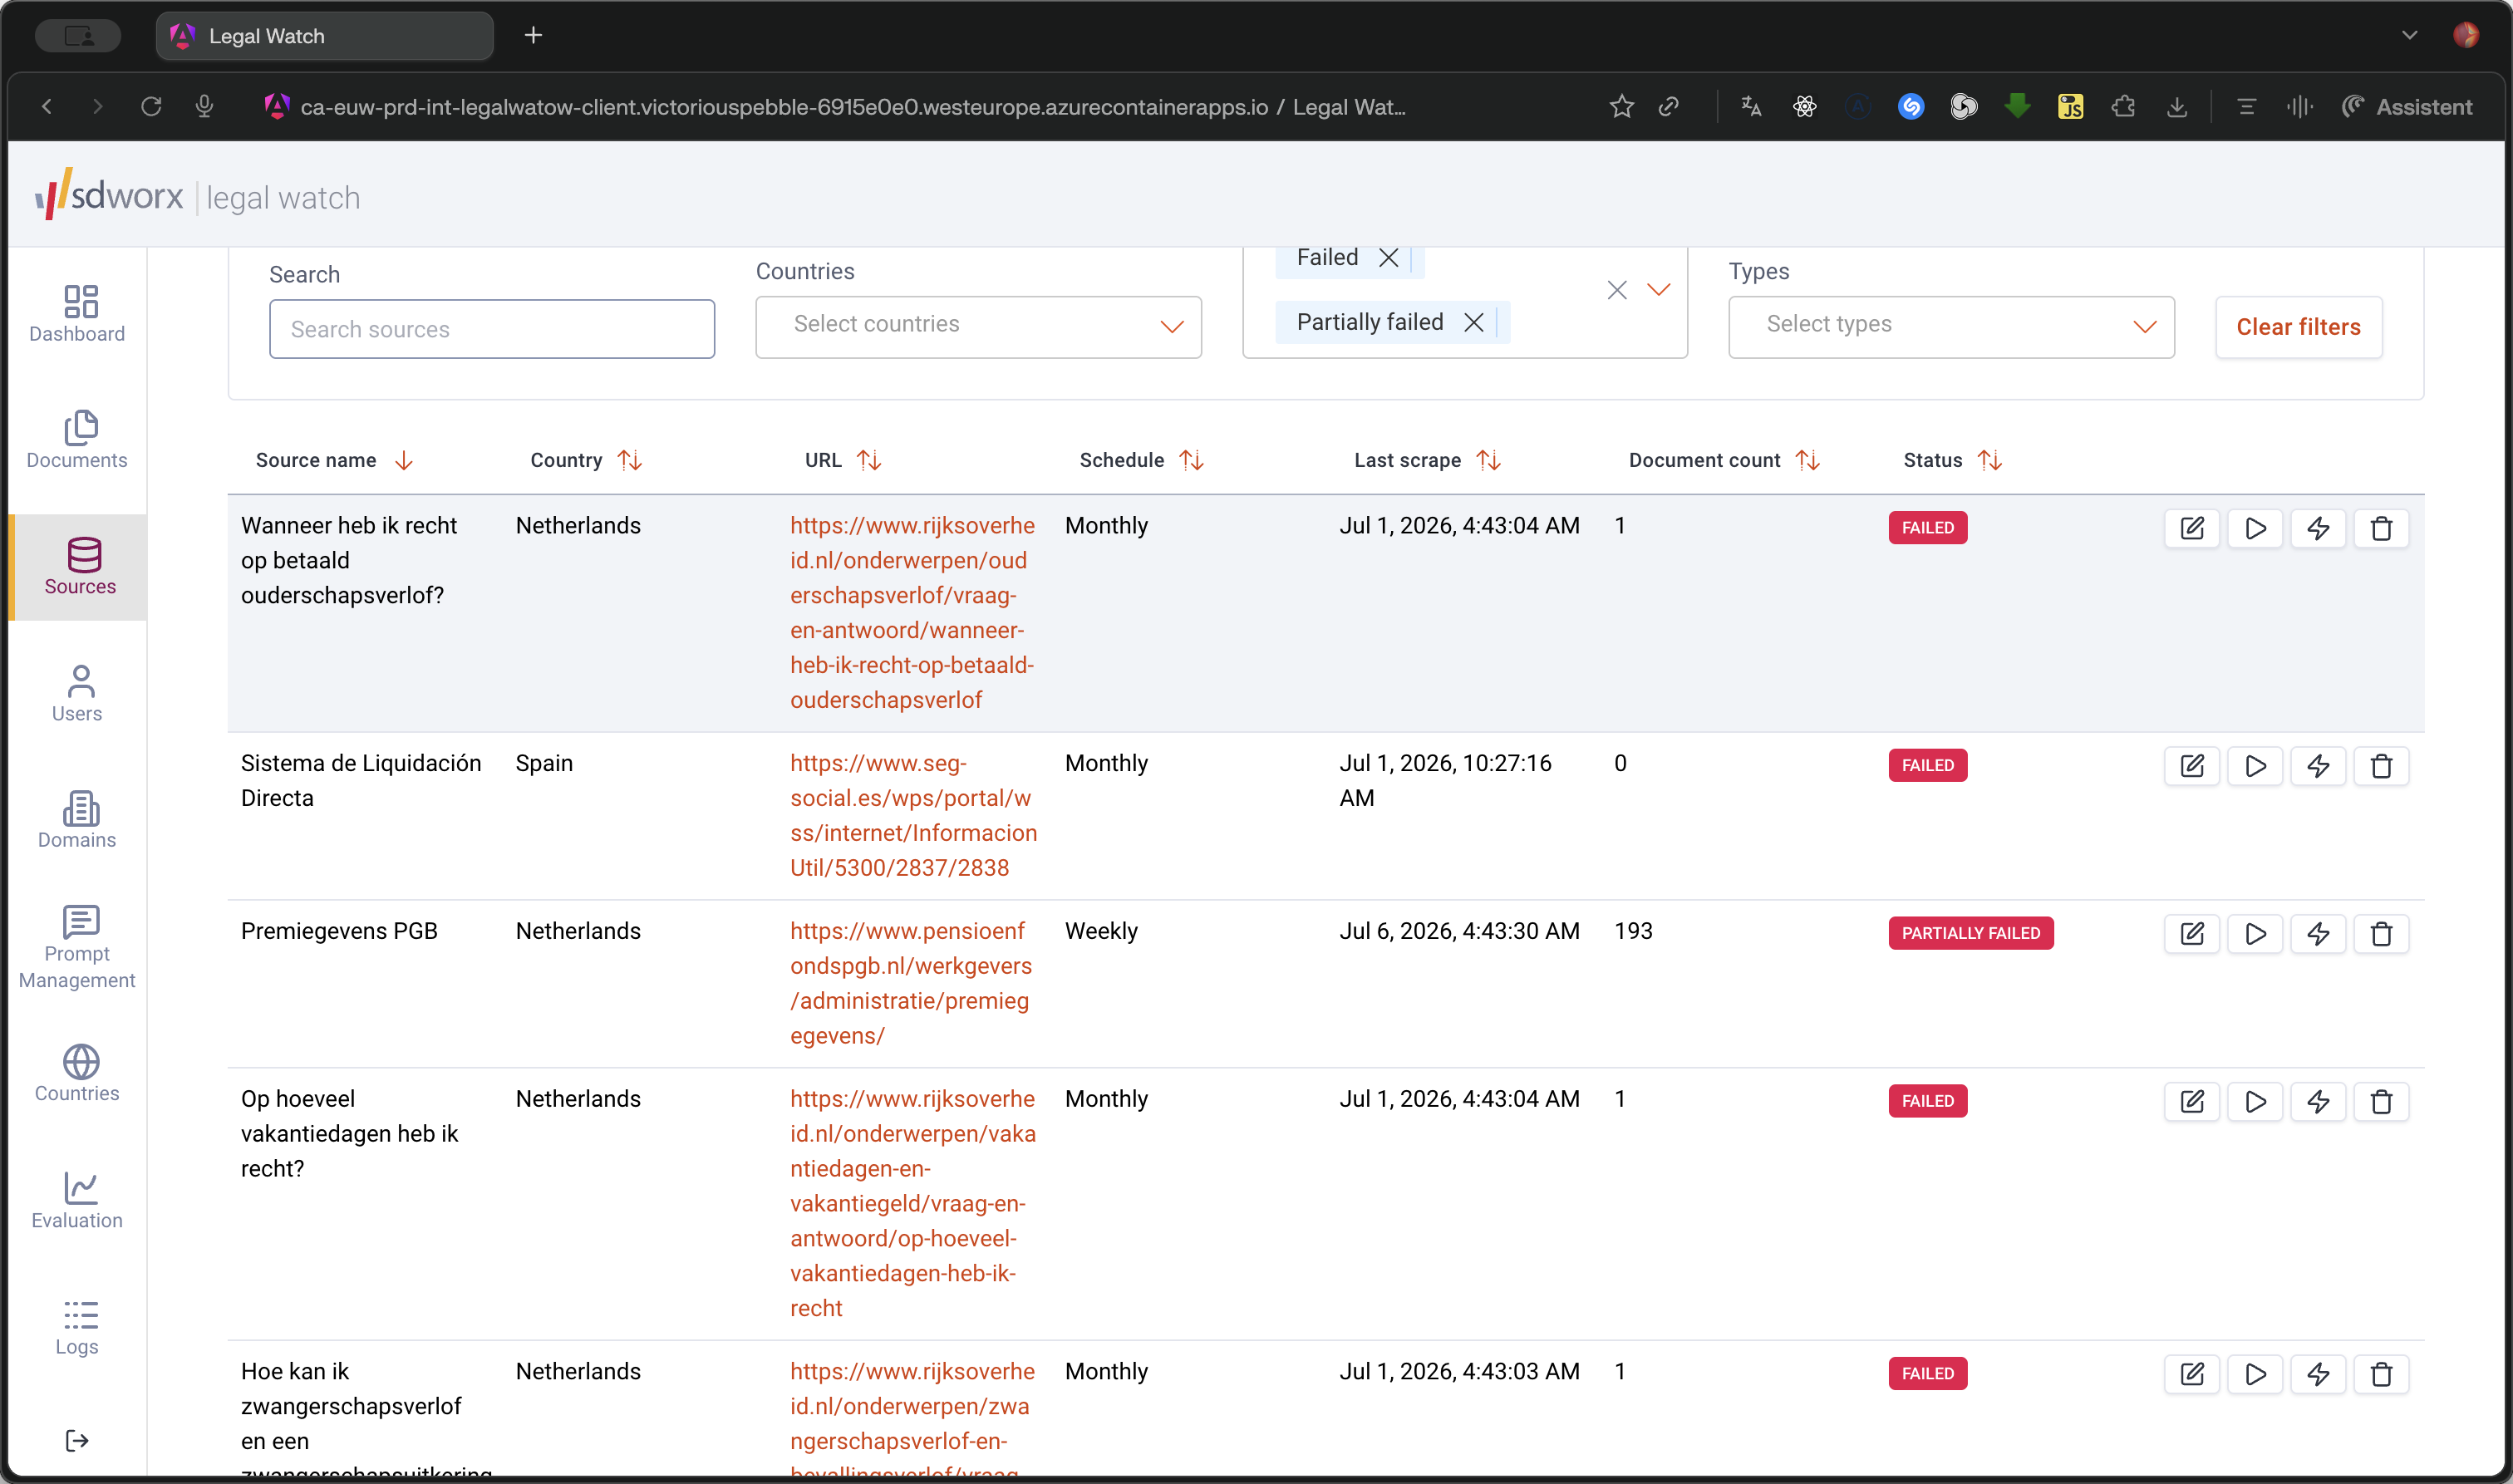
Click the error sources overview card at the top to automatically filter the data table for sources experiencing issues.
Step #1: Click the error sources overview card at the top to automatically filter the data table for sources experiencing issues.
2
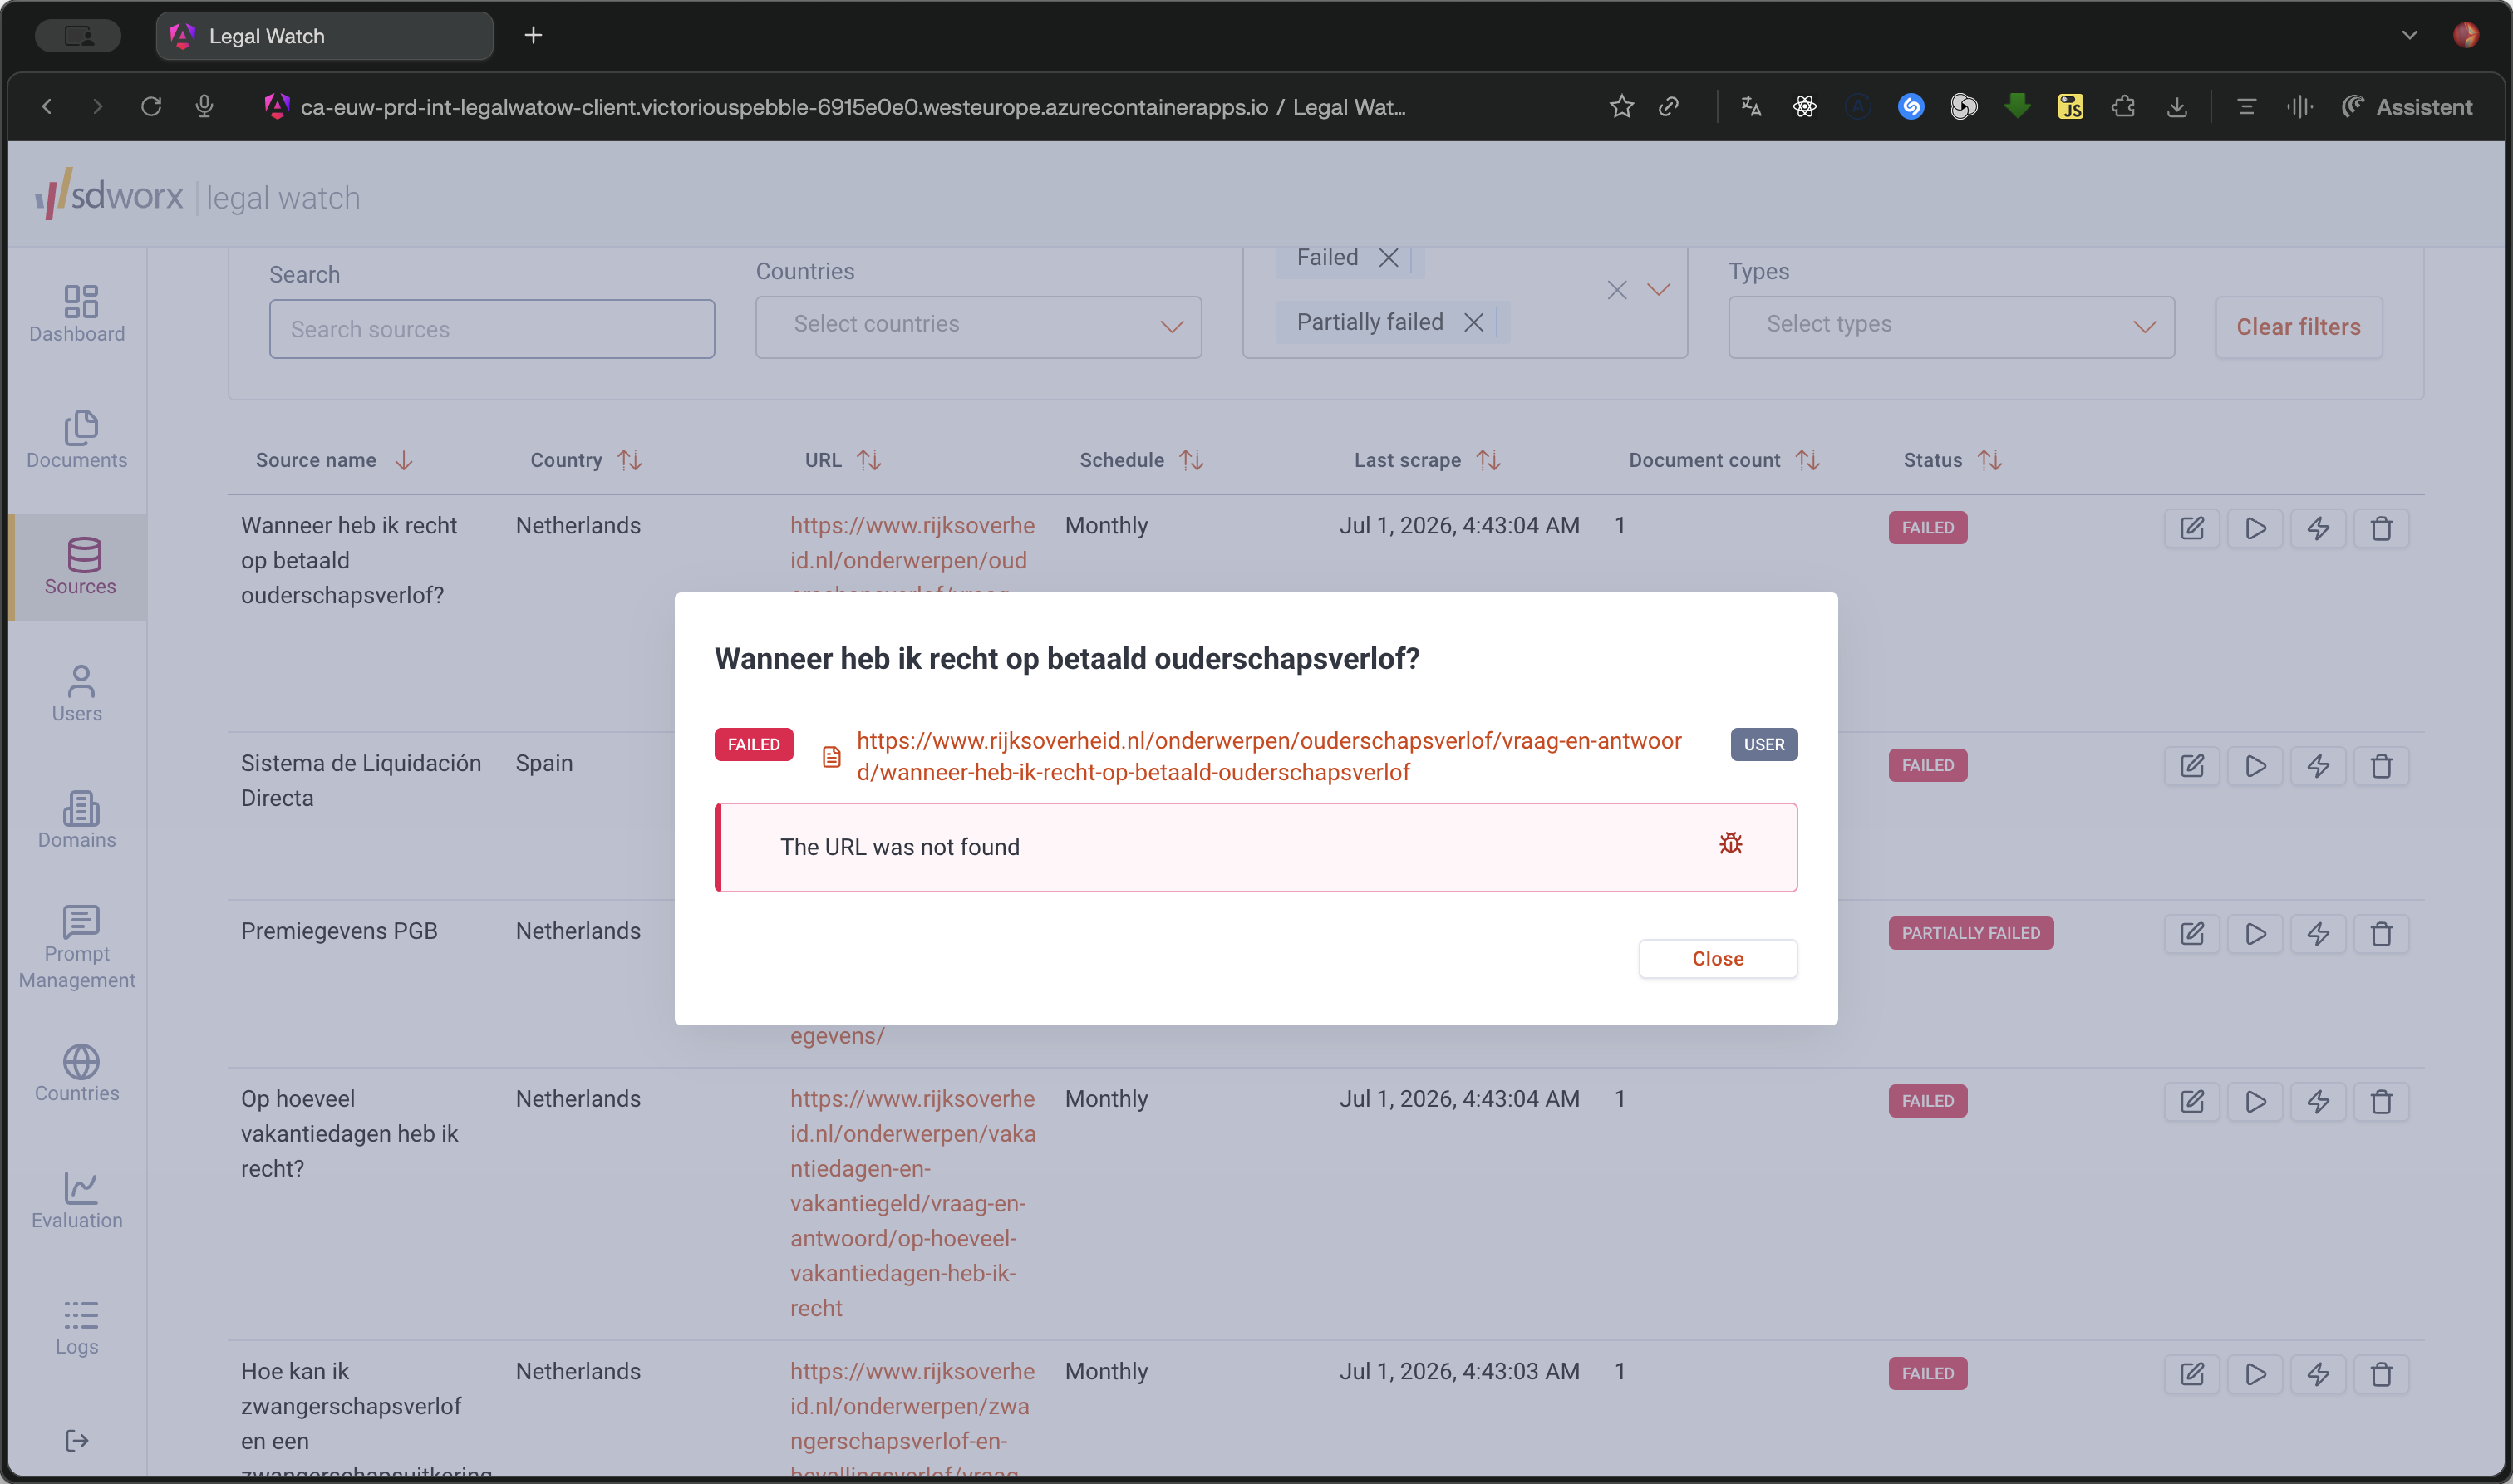
Click a FAILED status badge in the list to open the error details.
Step #2: Click a FAILED status badge in the list to open the error details.
3
Review the exact failure reason, such as "The URL was not found", to understand why the scrape failed.
Step #3: Review the exact failure reason, such as "The URL was not found", to understand why the scrape failed.
4
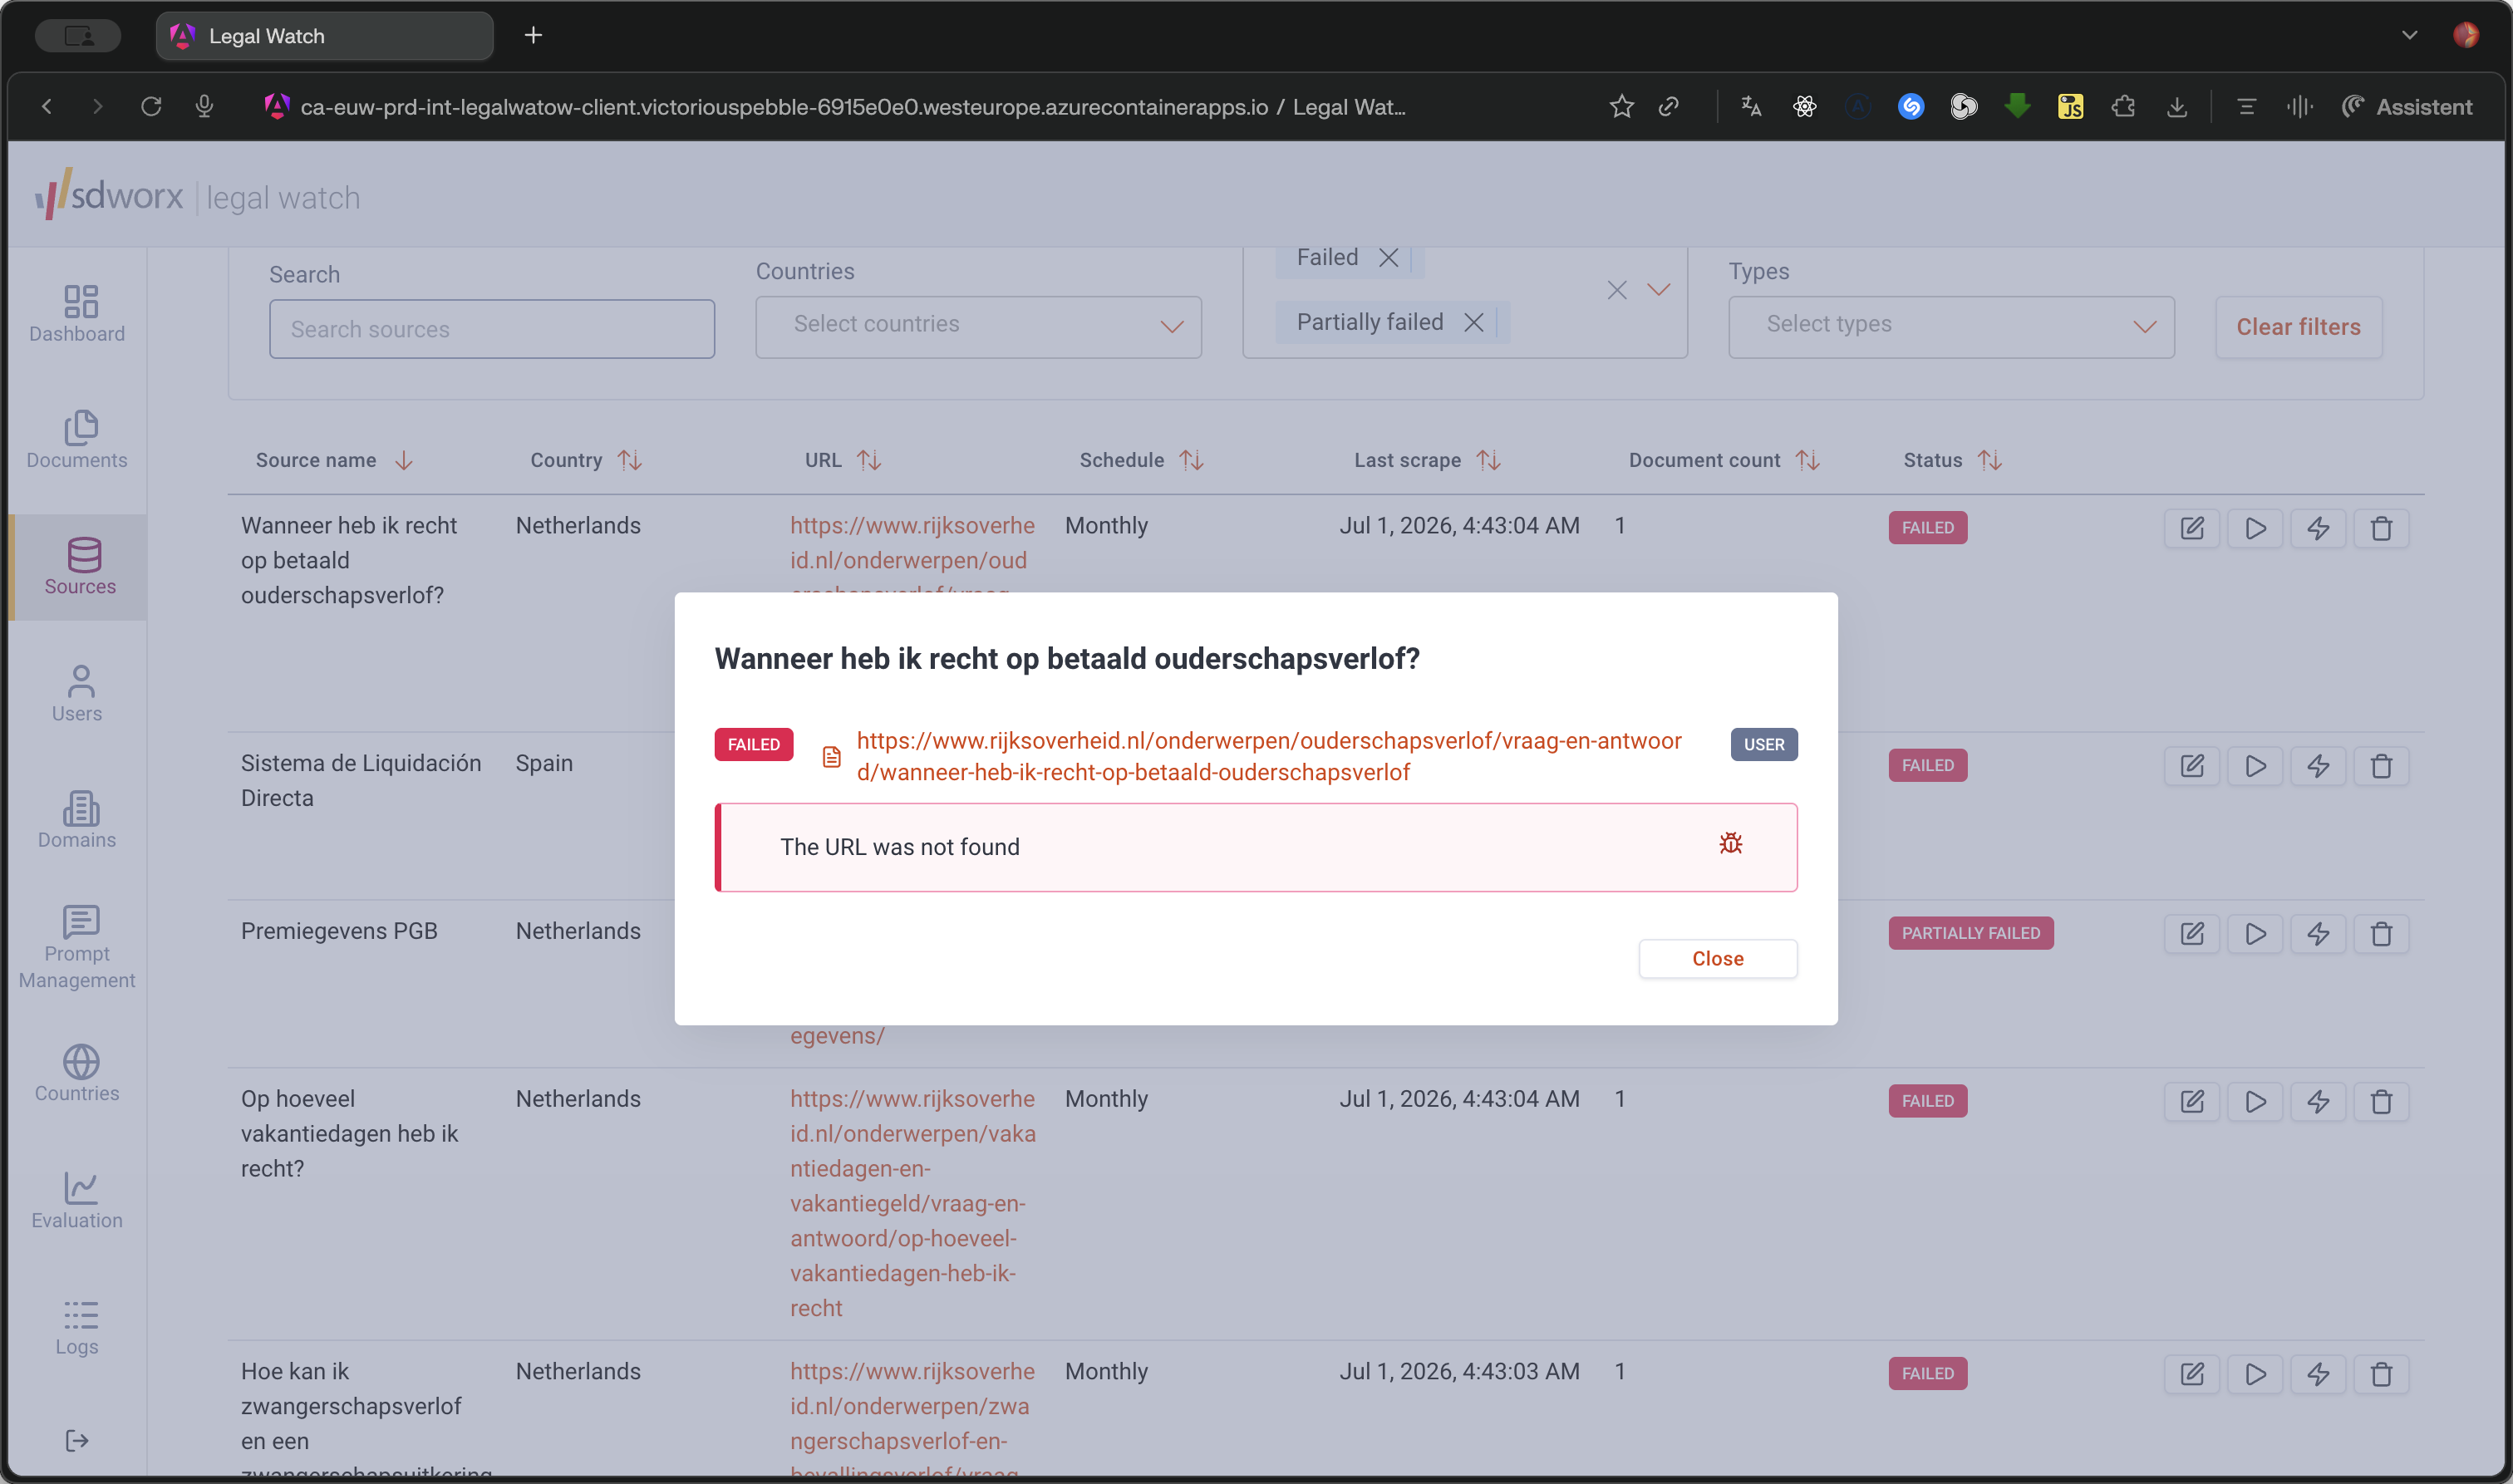
Hover over the debug pane on the right side of the screen to view the specific error code and detailed description provided by the scraping attempt.
Step #4: Hover over the debug pane on the right side of the screen to view the specific error code and detailed description provided by the scraping attempt.
5
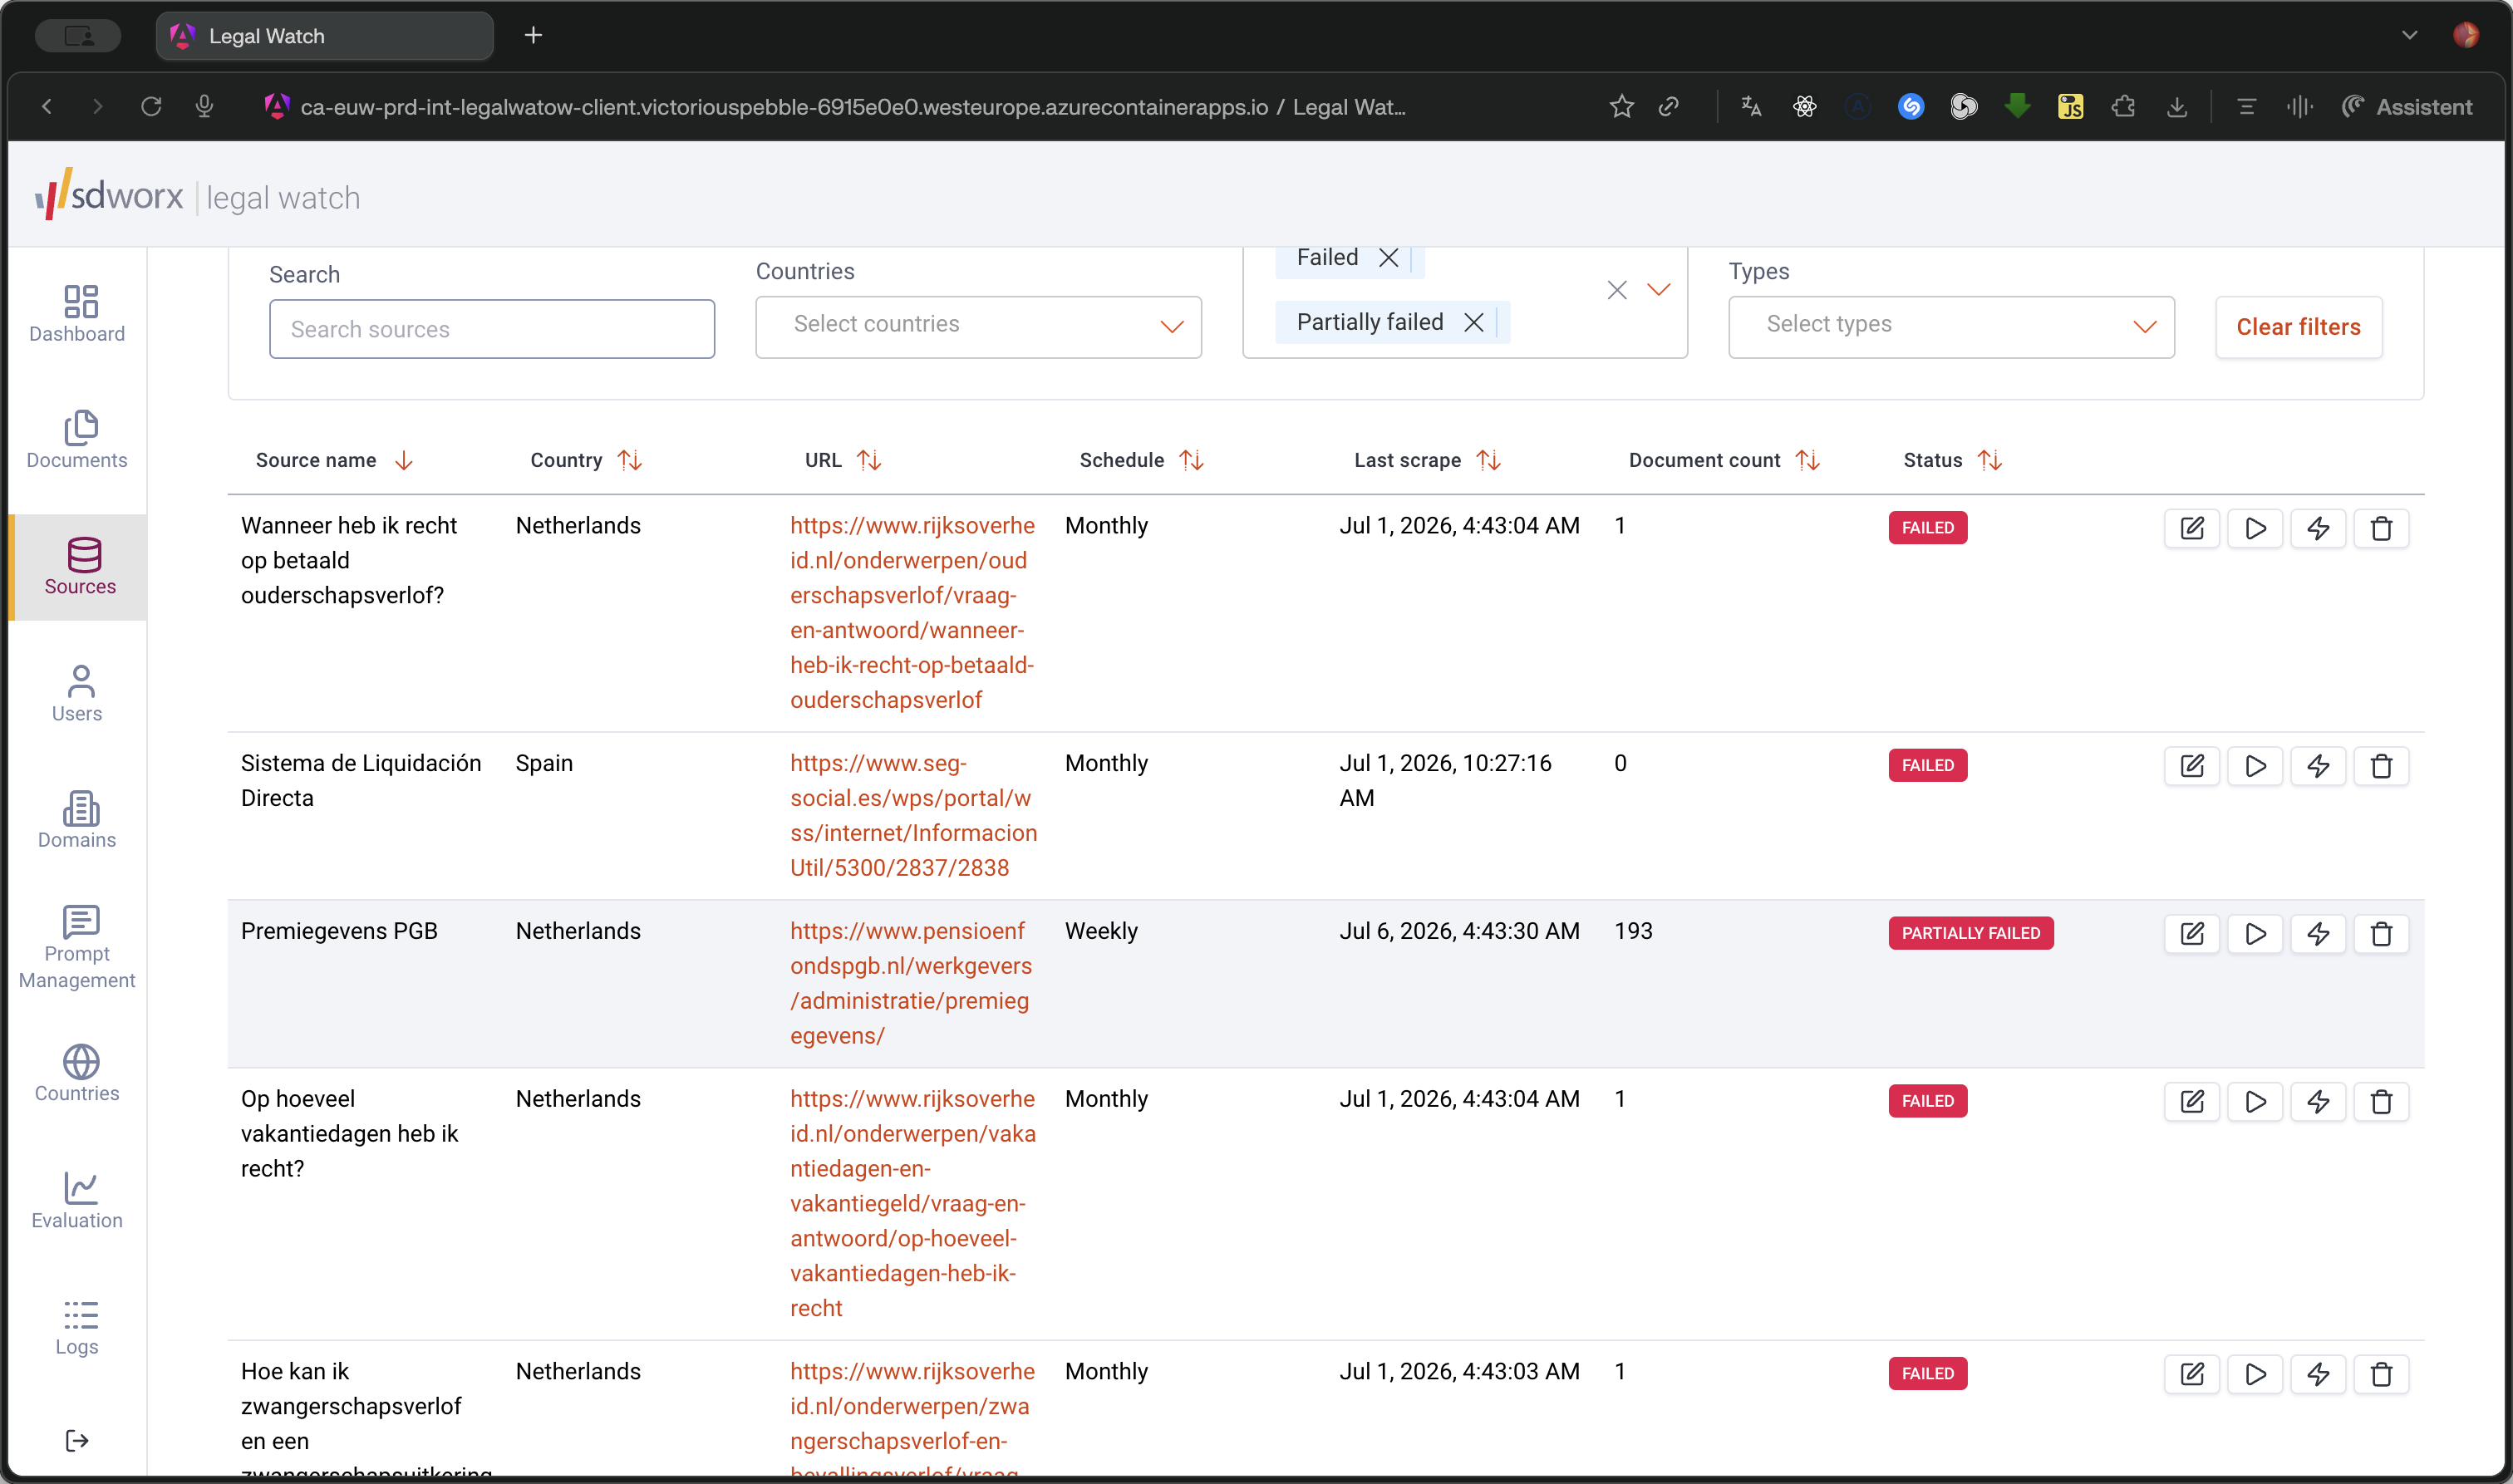
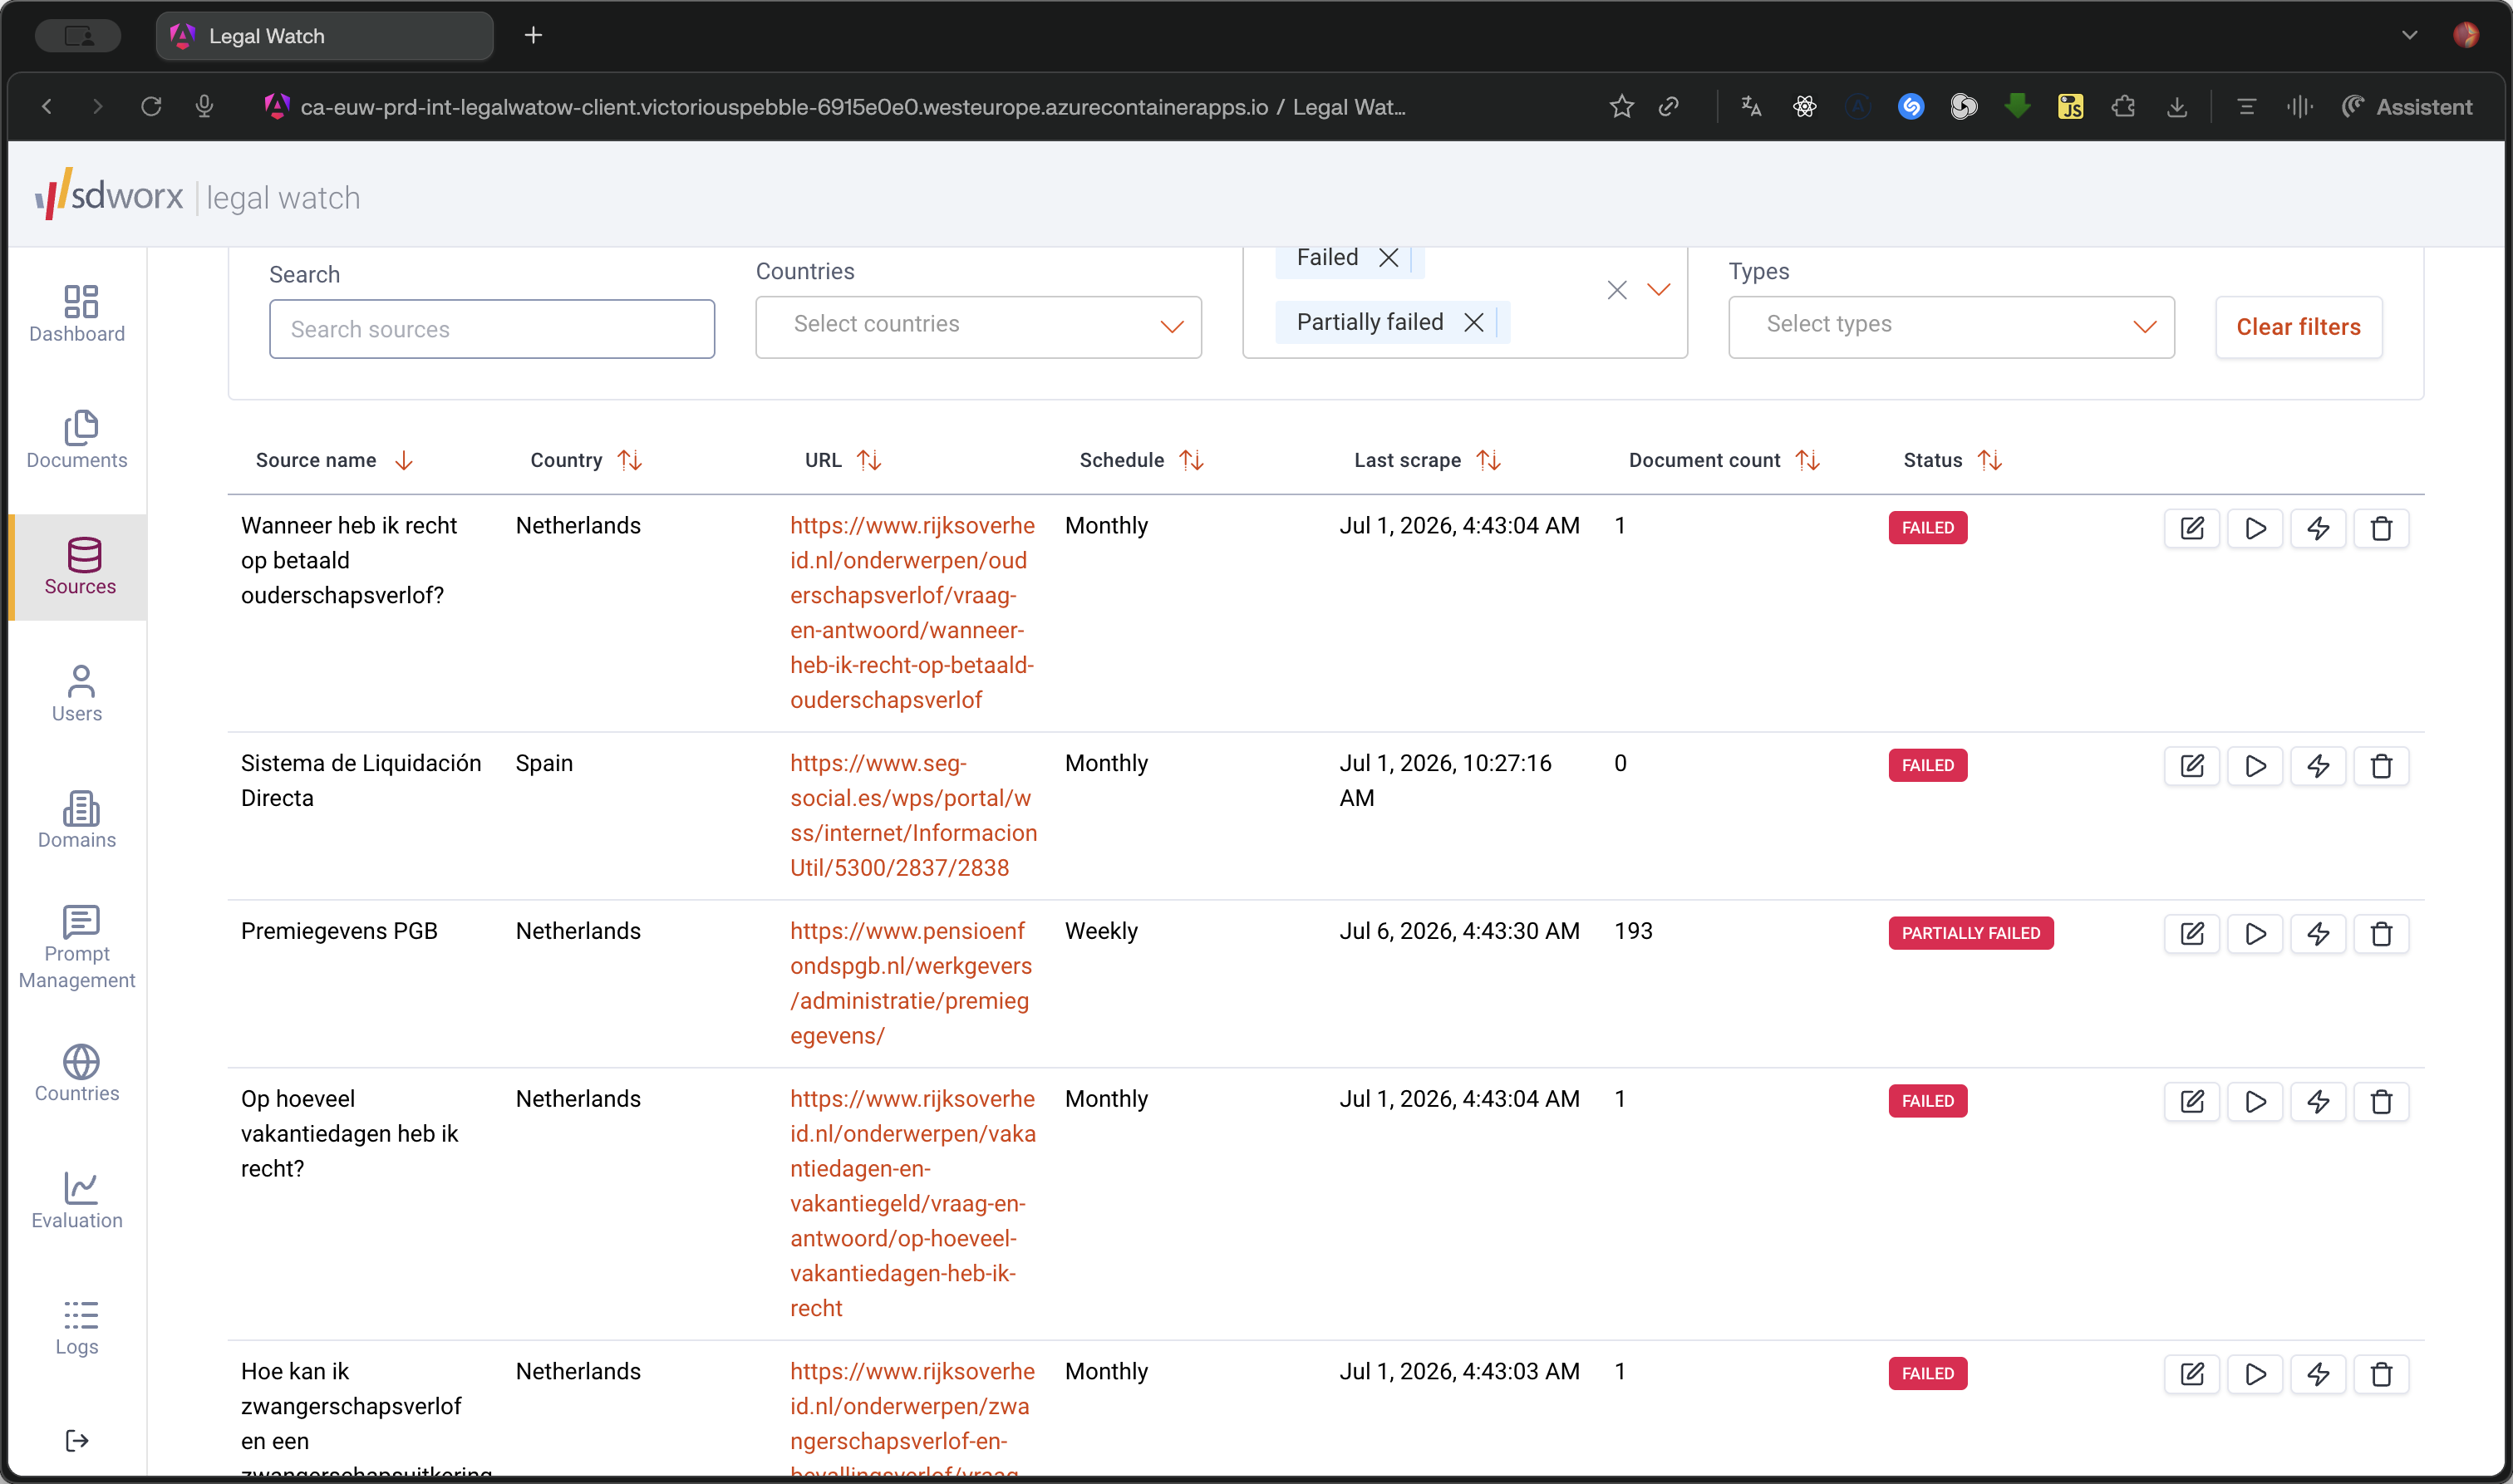
Click a PARTIALLY FAILED status badge to investigate sources where the majority of the data passed, but specific sub-elements encountered errors.
Step #5: Click a PARTIALLY FAILED status badge to investigate sources where the majority of the data passed, but specific sub-elements encountered errors.
6
Use the source view to configure new scraping instructions that exclude the problematic elements.
Step #6: Use the source view to configure new scraping instructions that exclude the problematic elements.
7
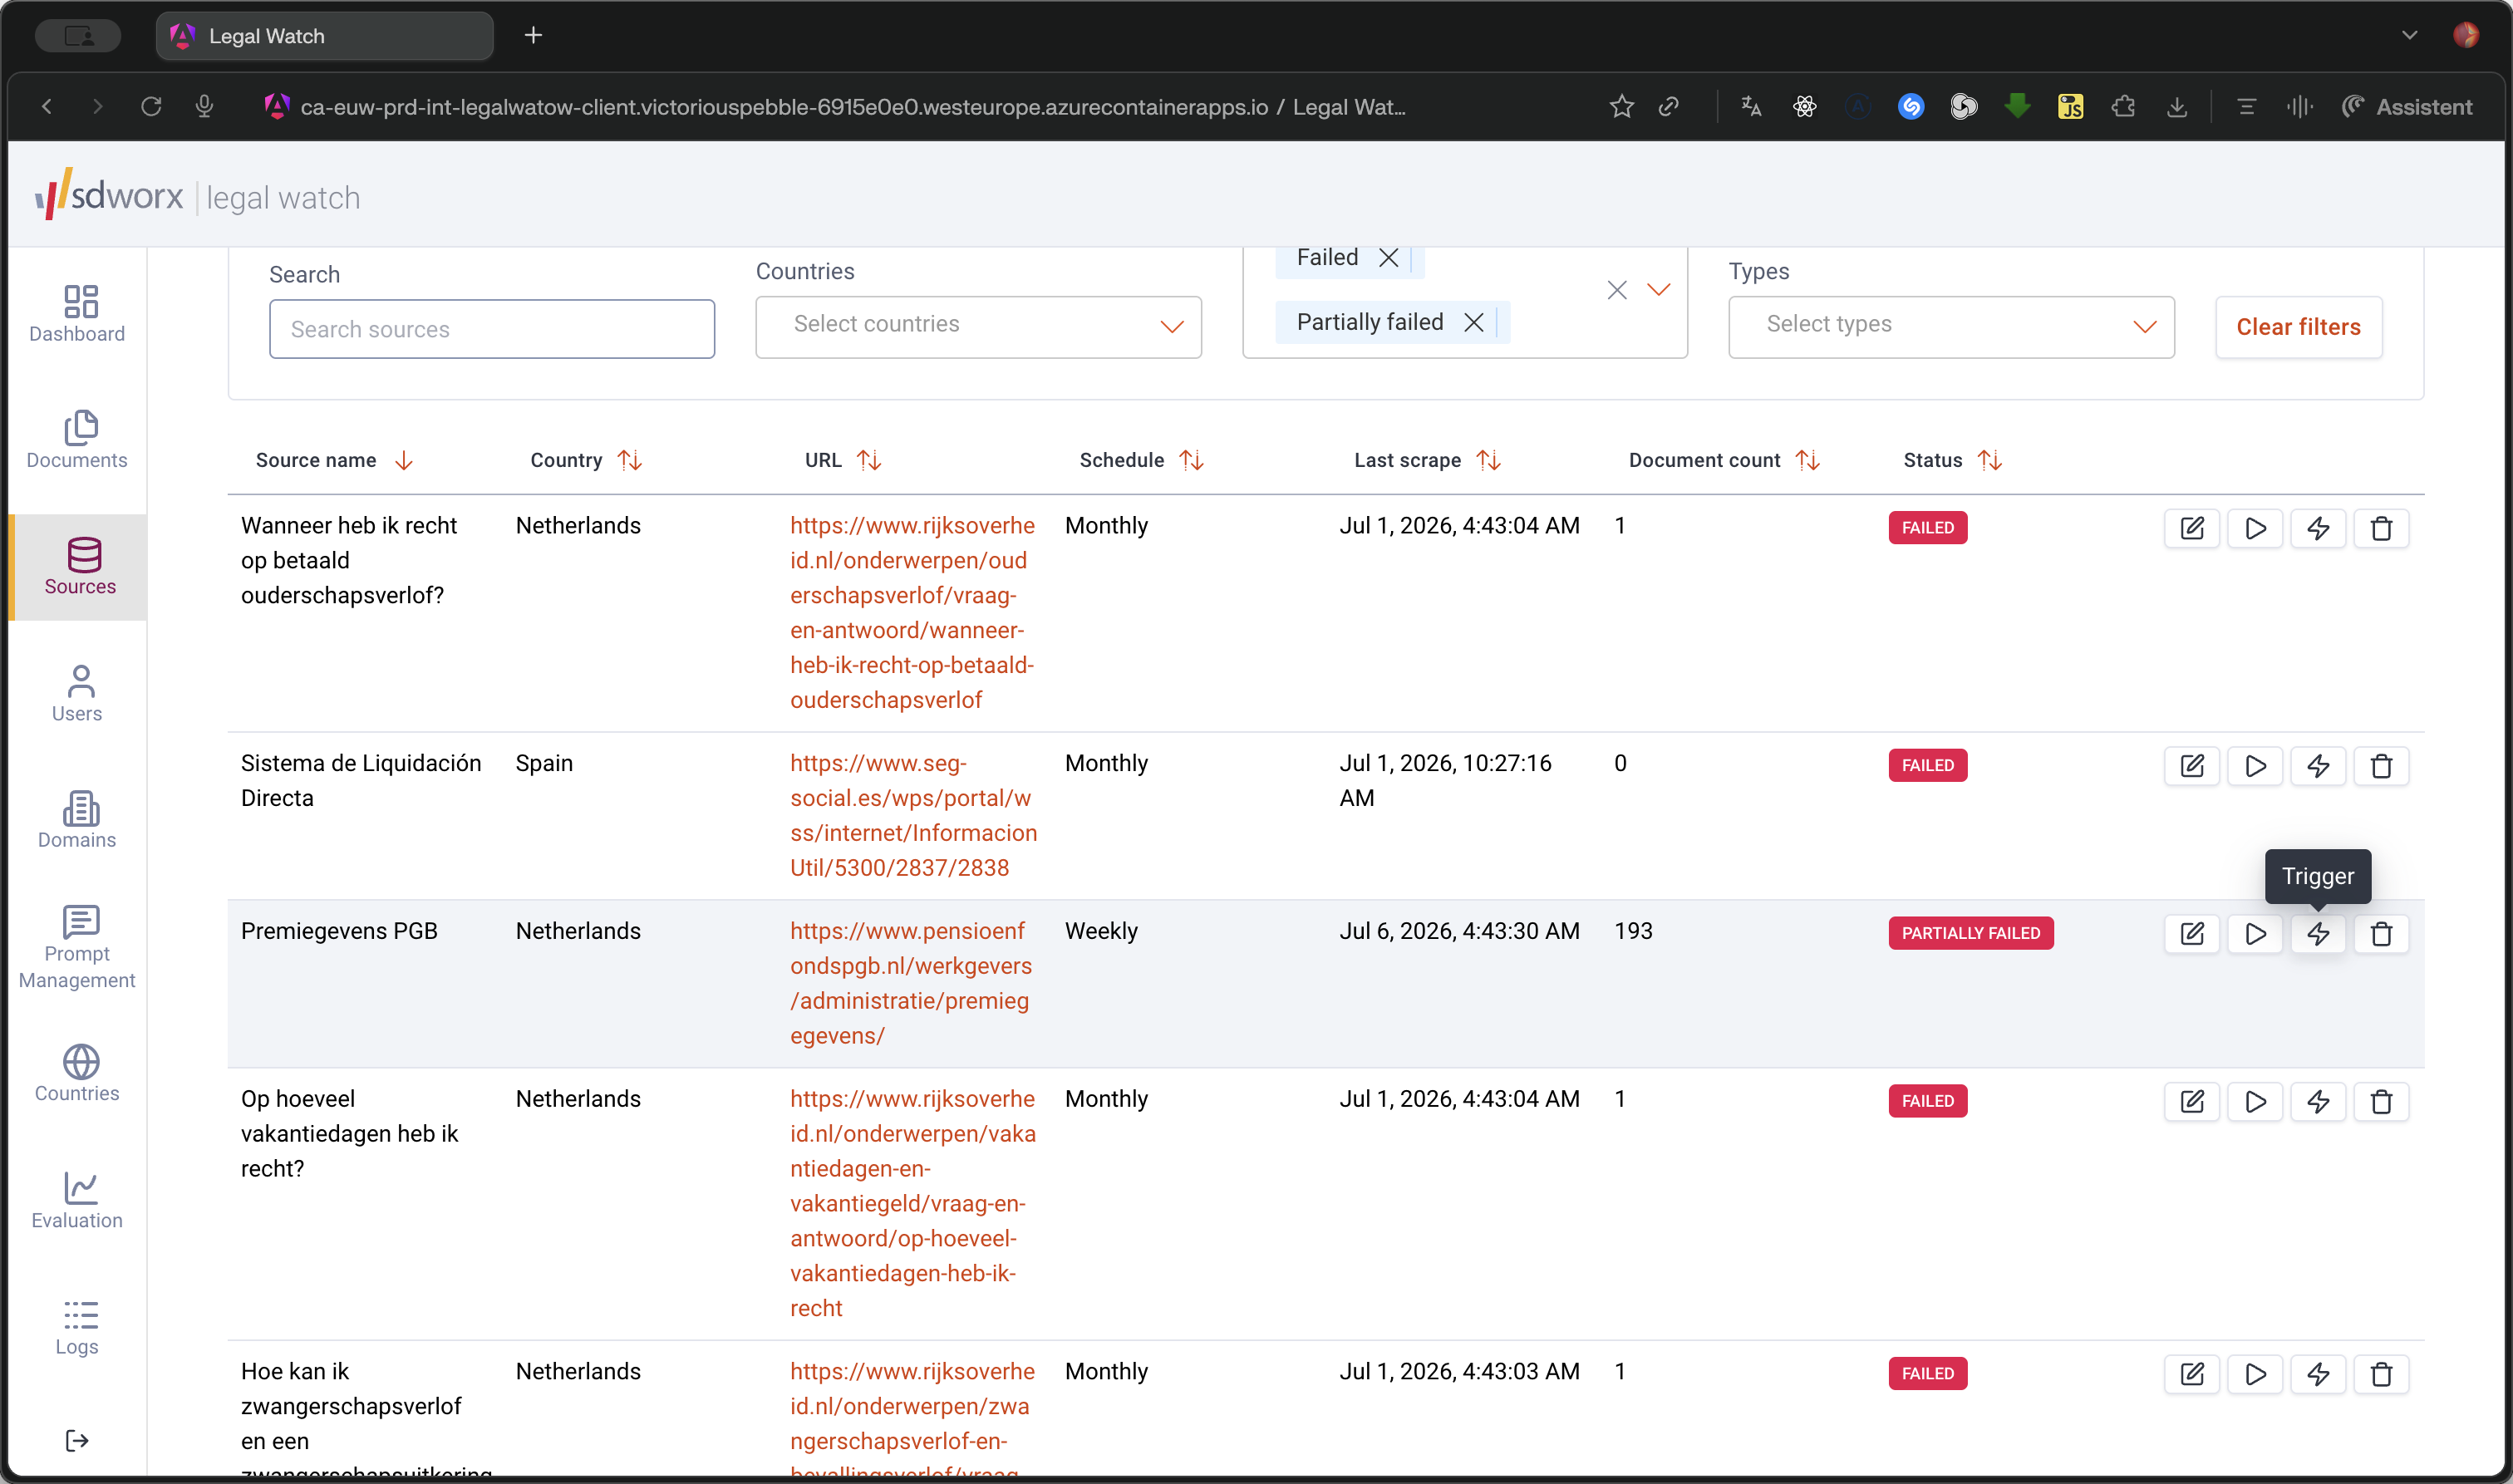
Click the Trigger icon (the lightning bolt) to re-run the scraping job.
Step #7: Click the Trigger icon (the lightning bolt) to re-run the scraping job.
8
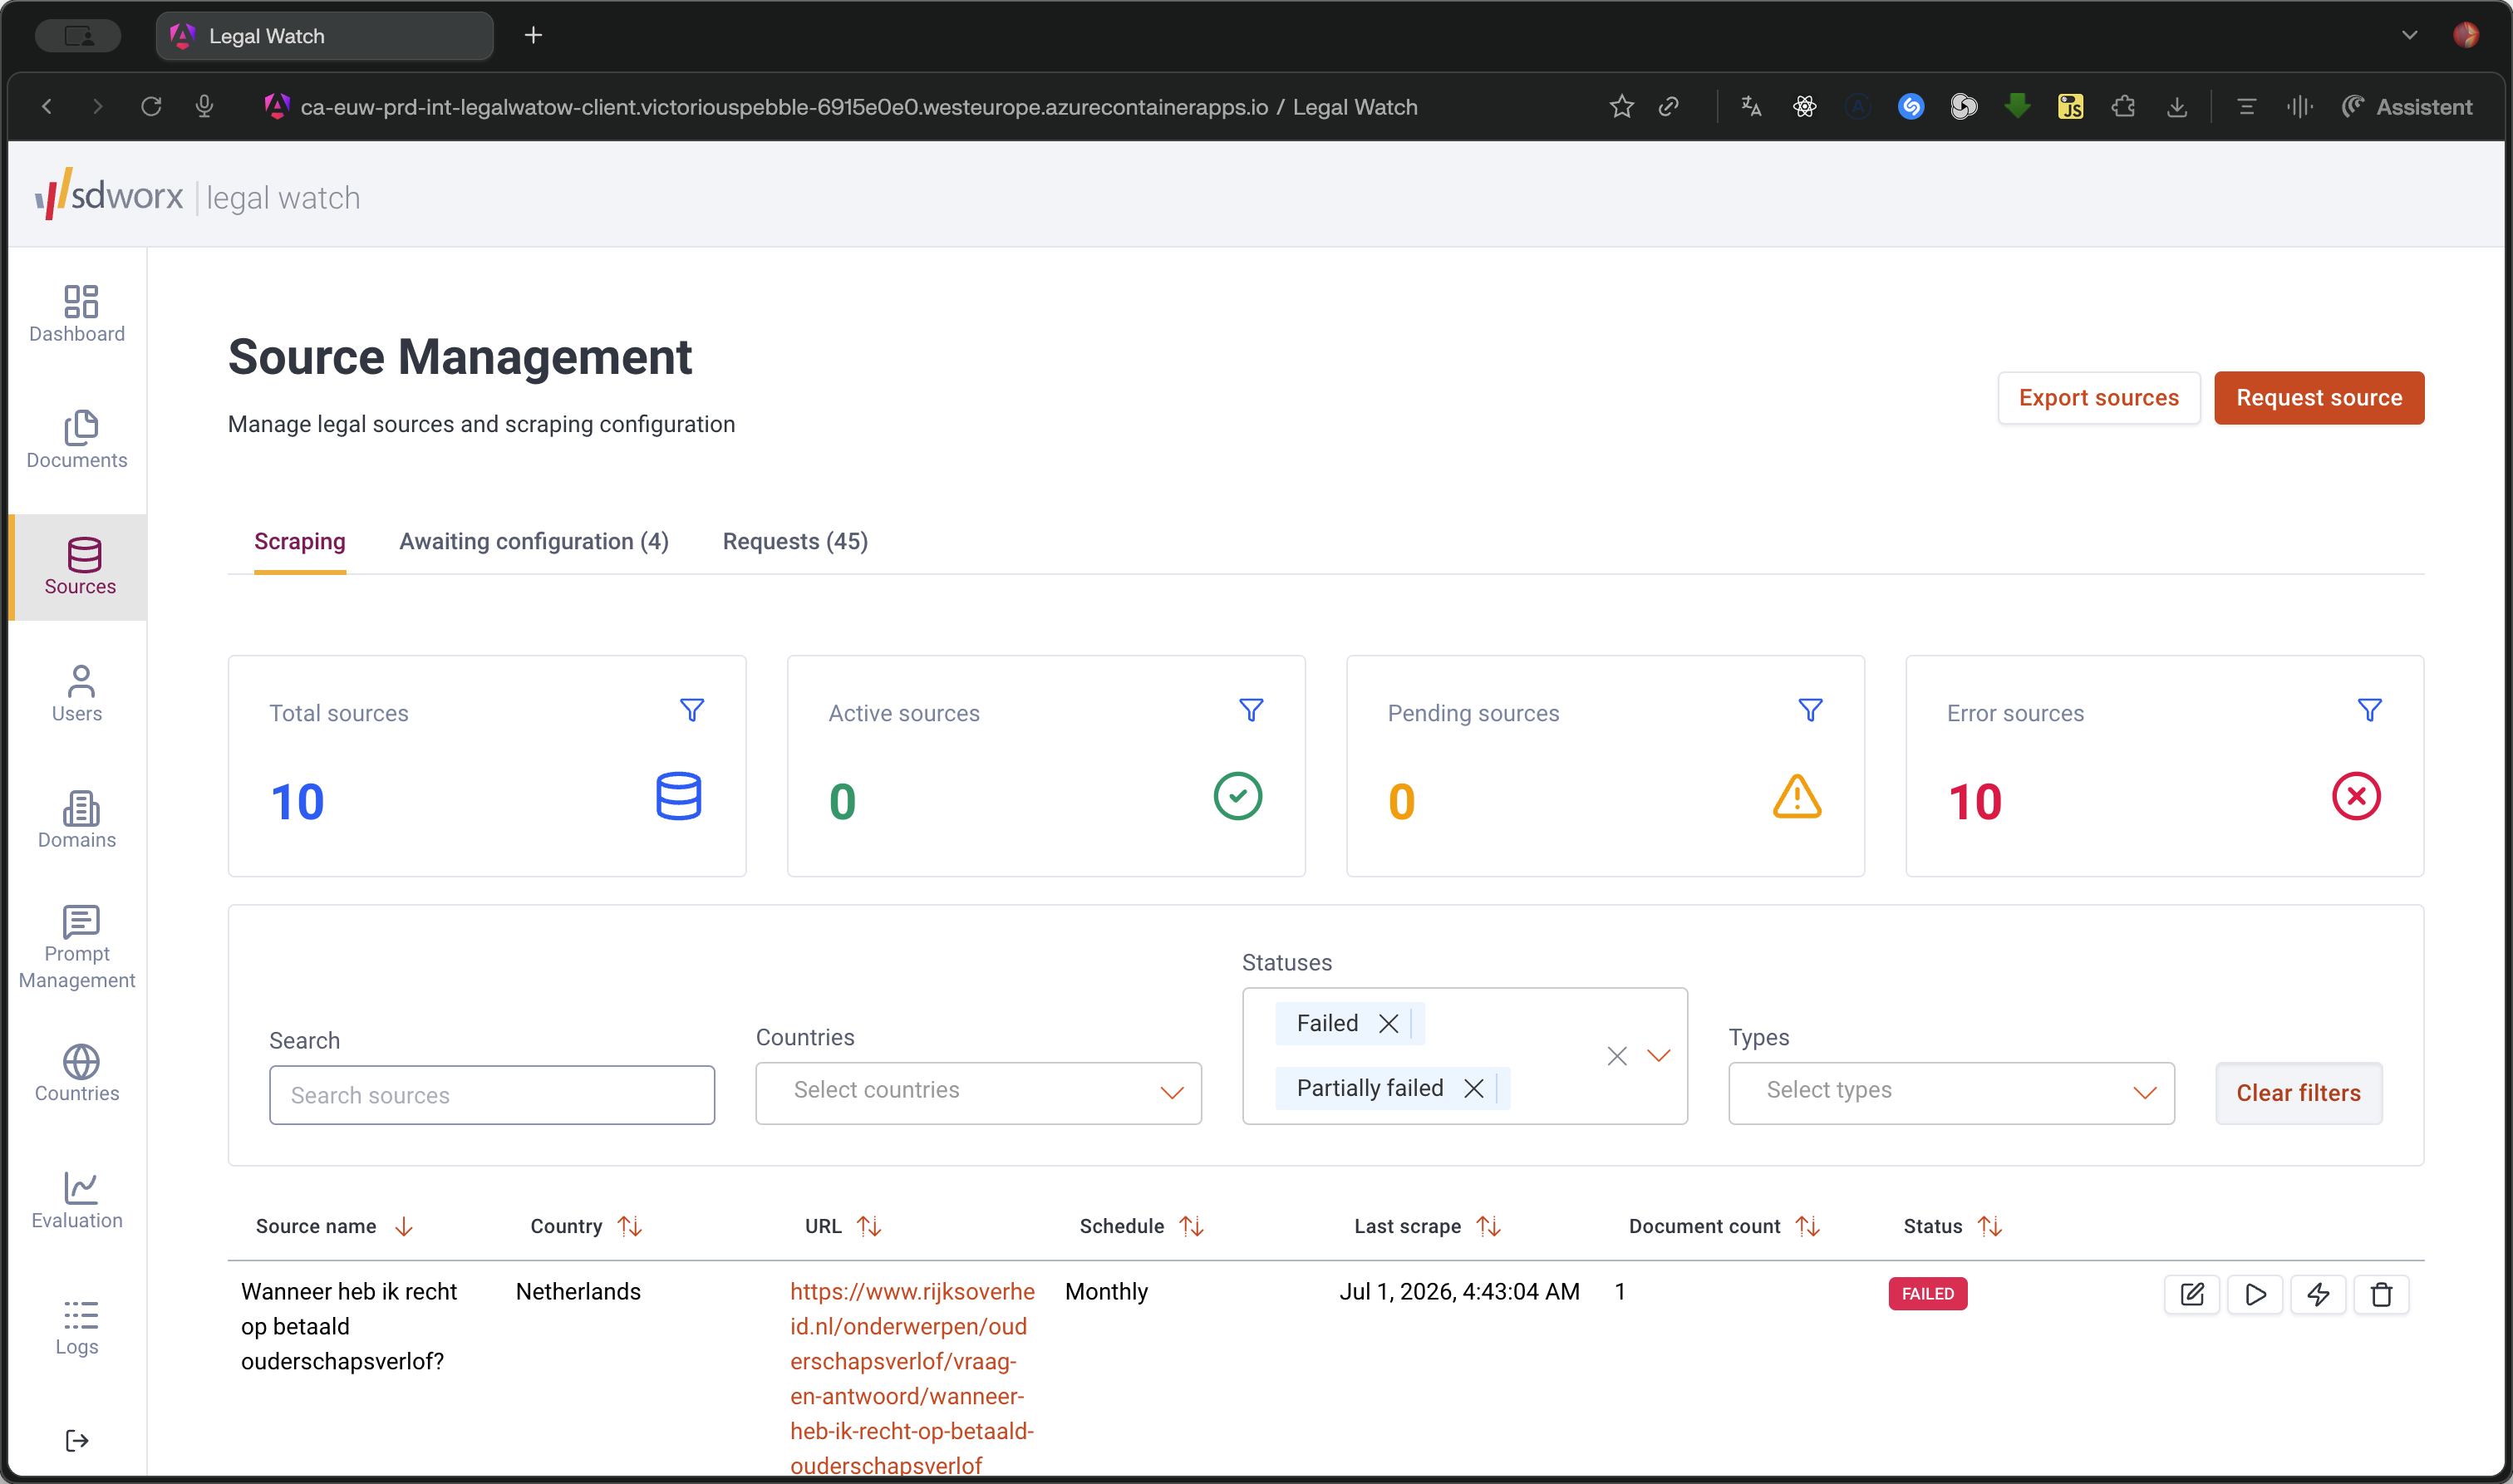
Click Clear filters in the top-right corner to view the full list of sources and monitor the re-triggered source's progress.
Step #8: Click Clear filters in the top-right corner to view the full list of sources and monitor the re-triggered source's progress.

Editing and Previewing Sources

You can make targeted adjustments to a source's configuration or run test previews without affecting the live ingestion.
9
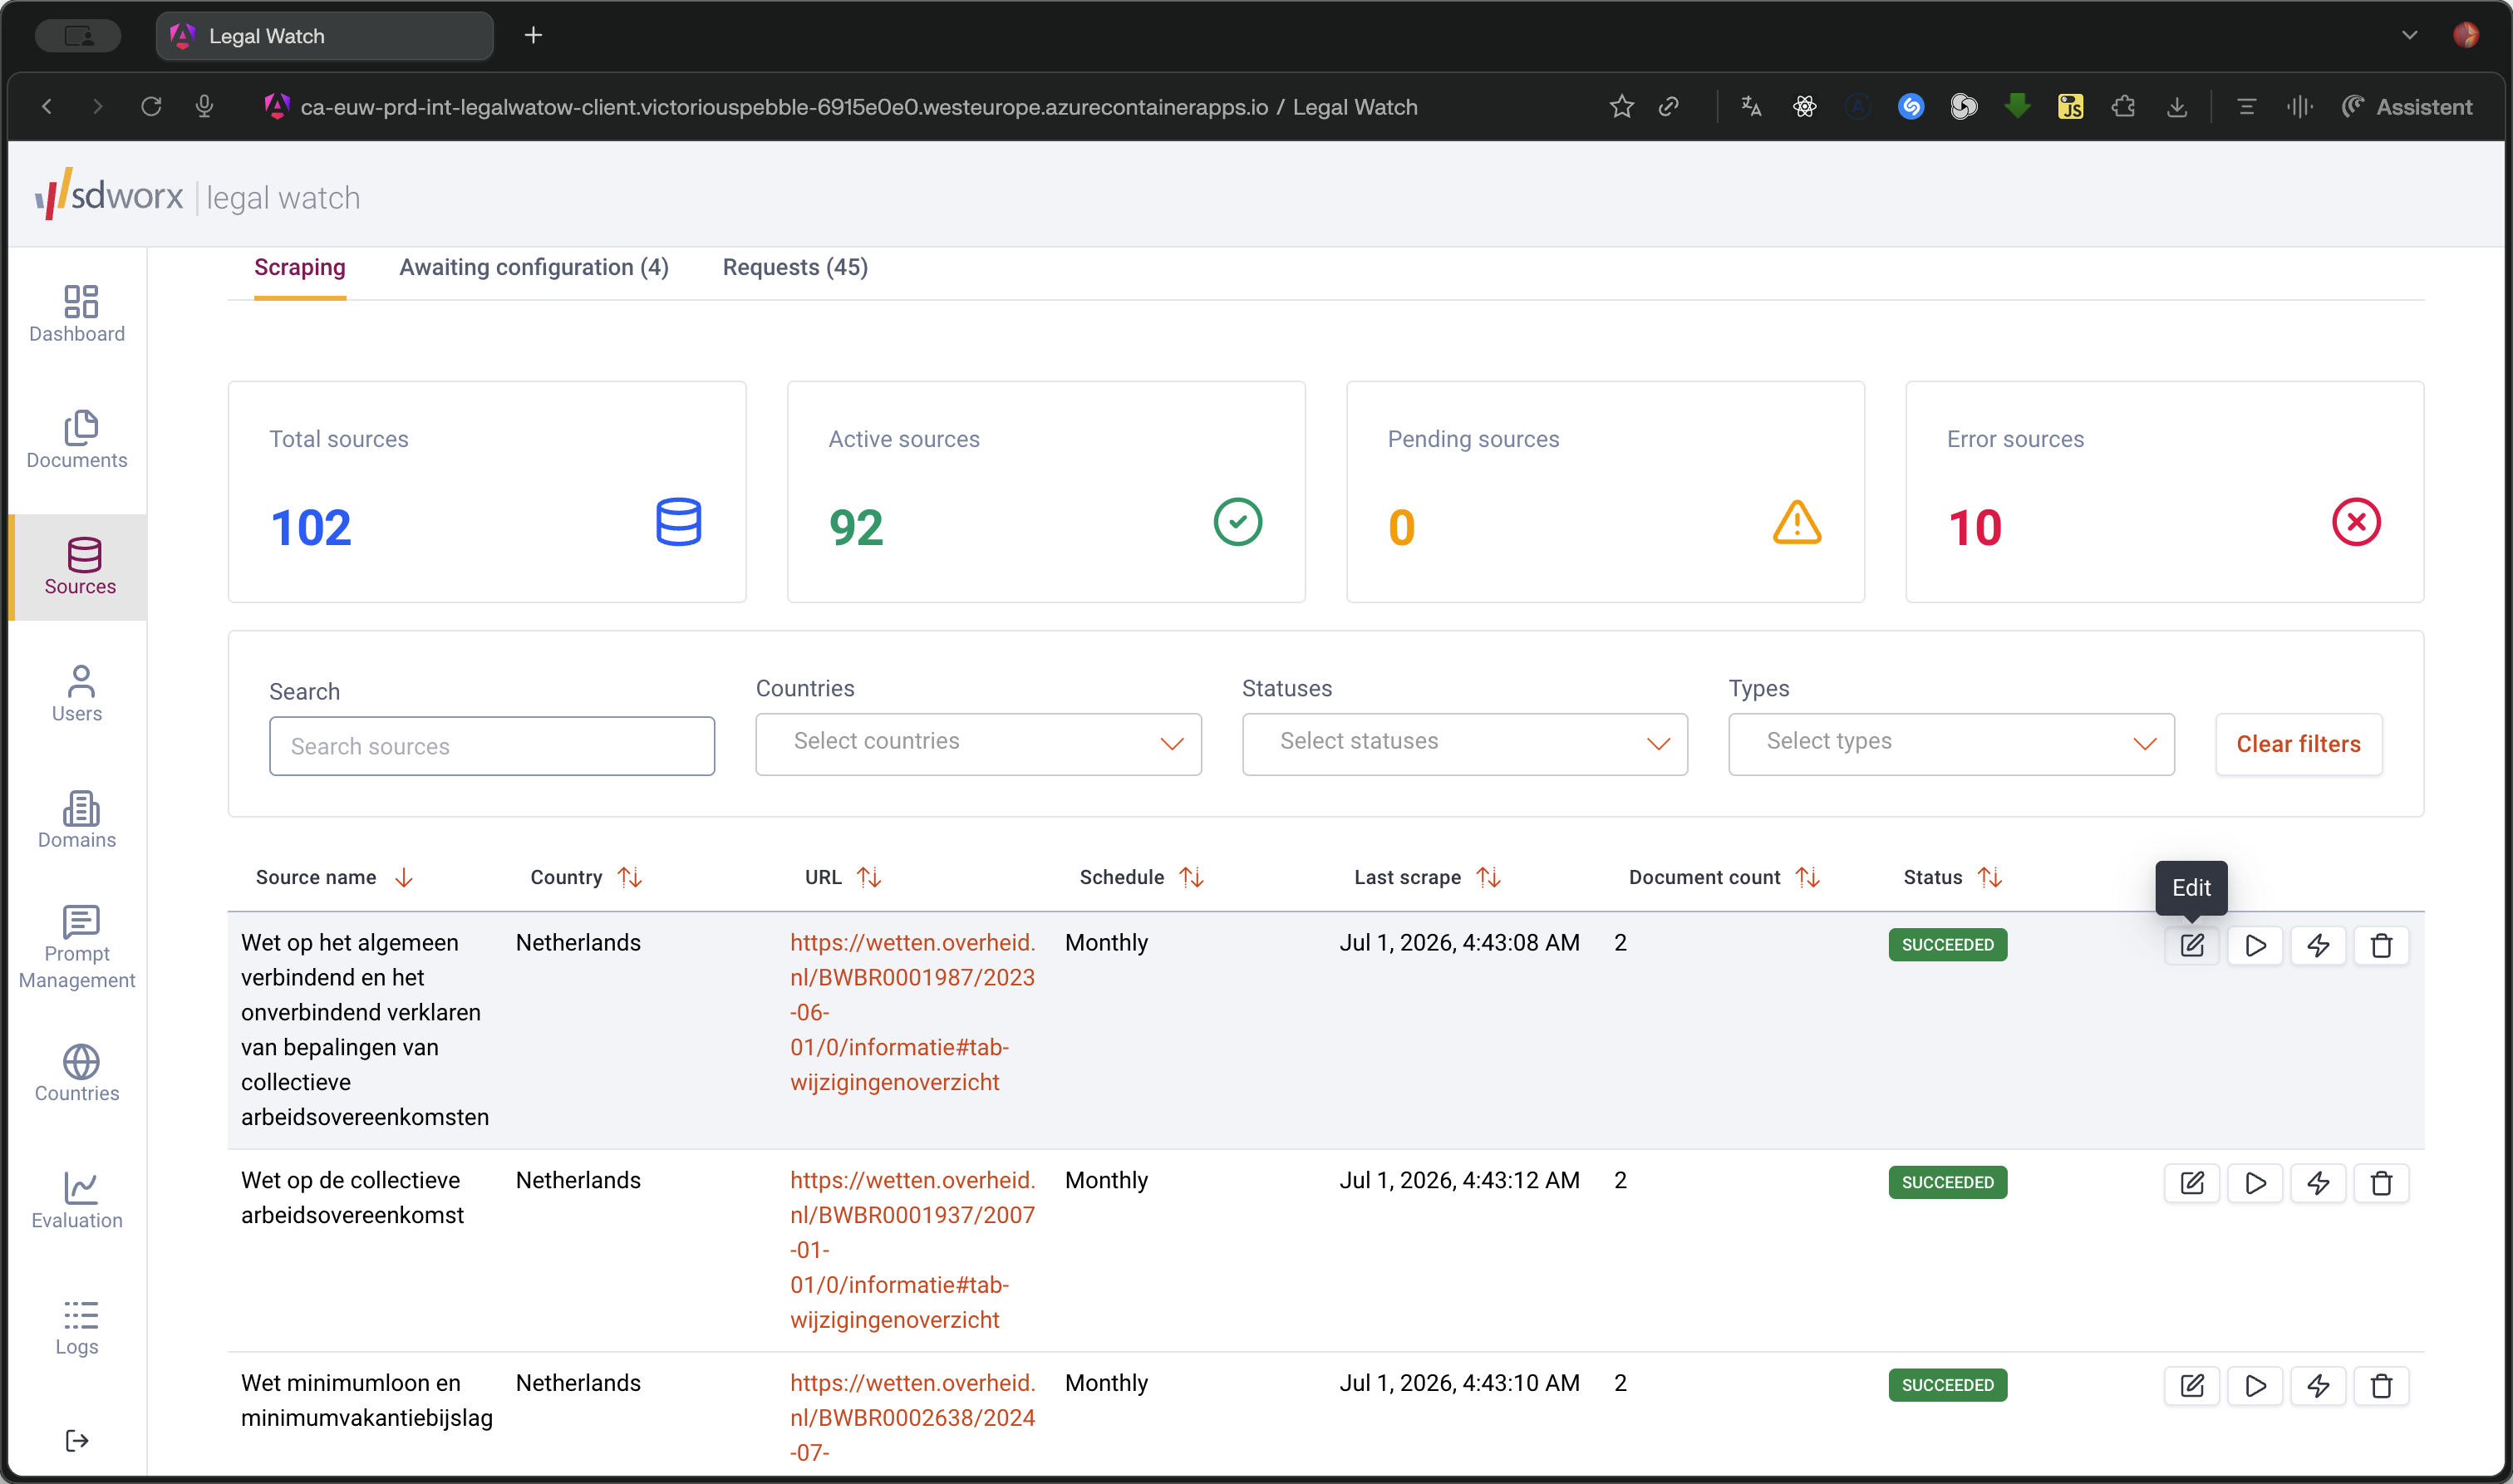
Click the Edit icon in the action column next to the source you want to modify.
Step #9: Click the Edit icon in the action column next to the source you want to modify.
10
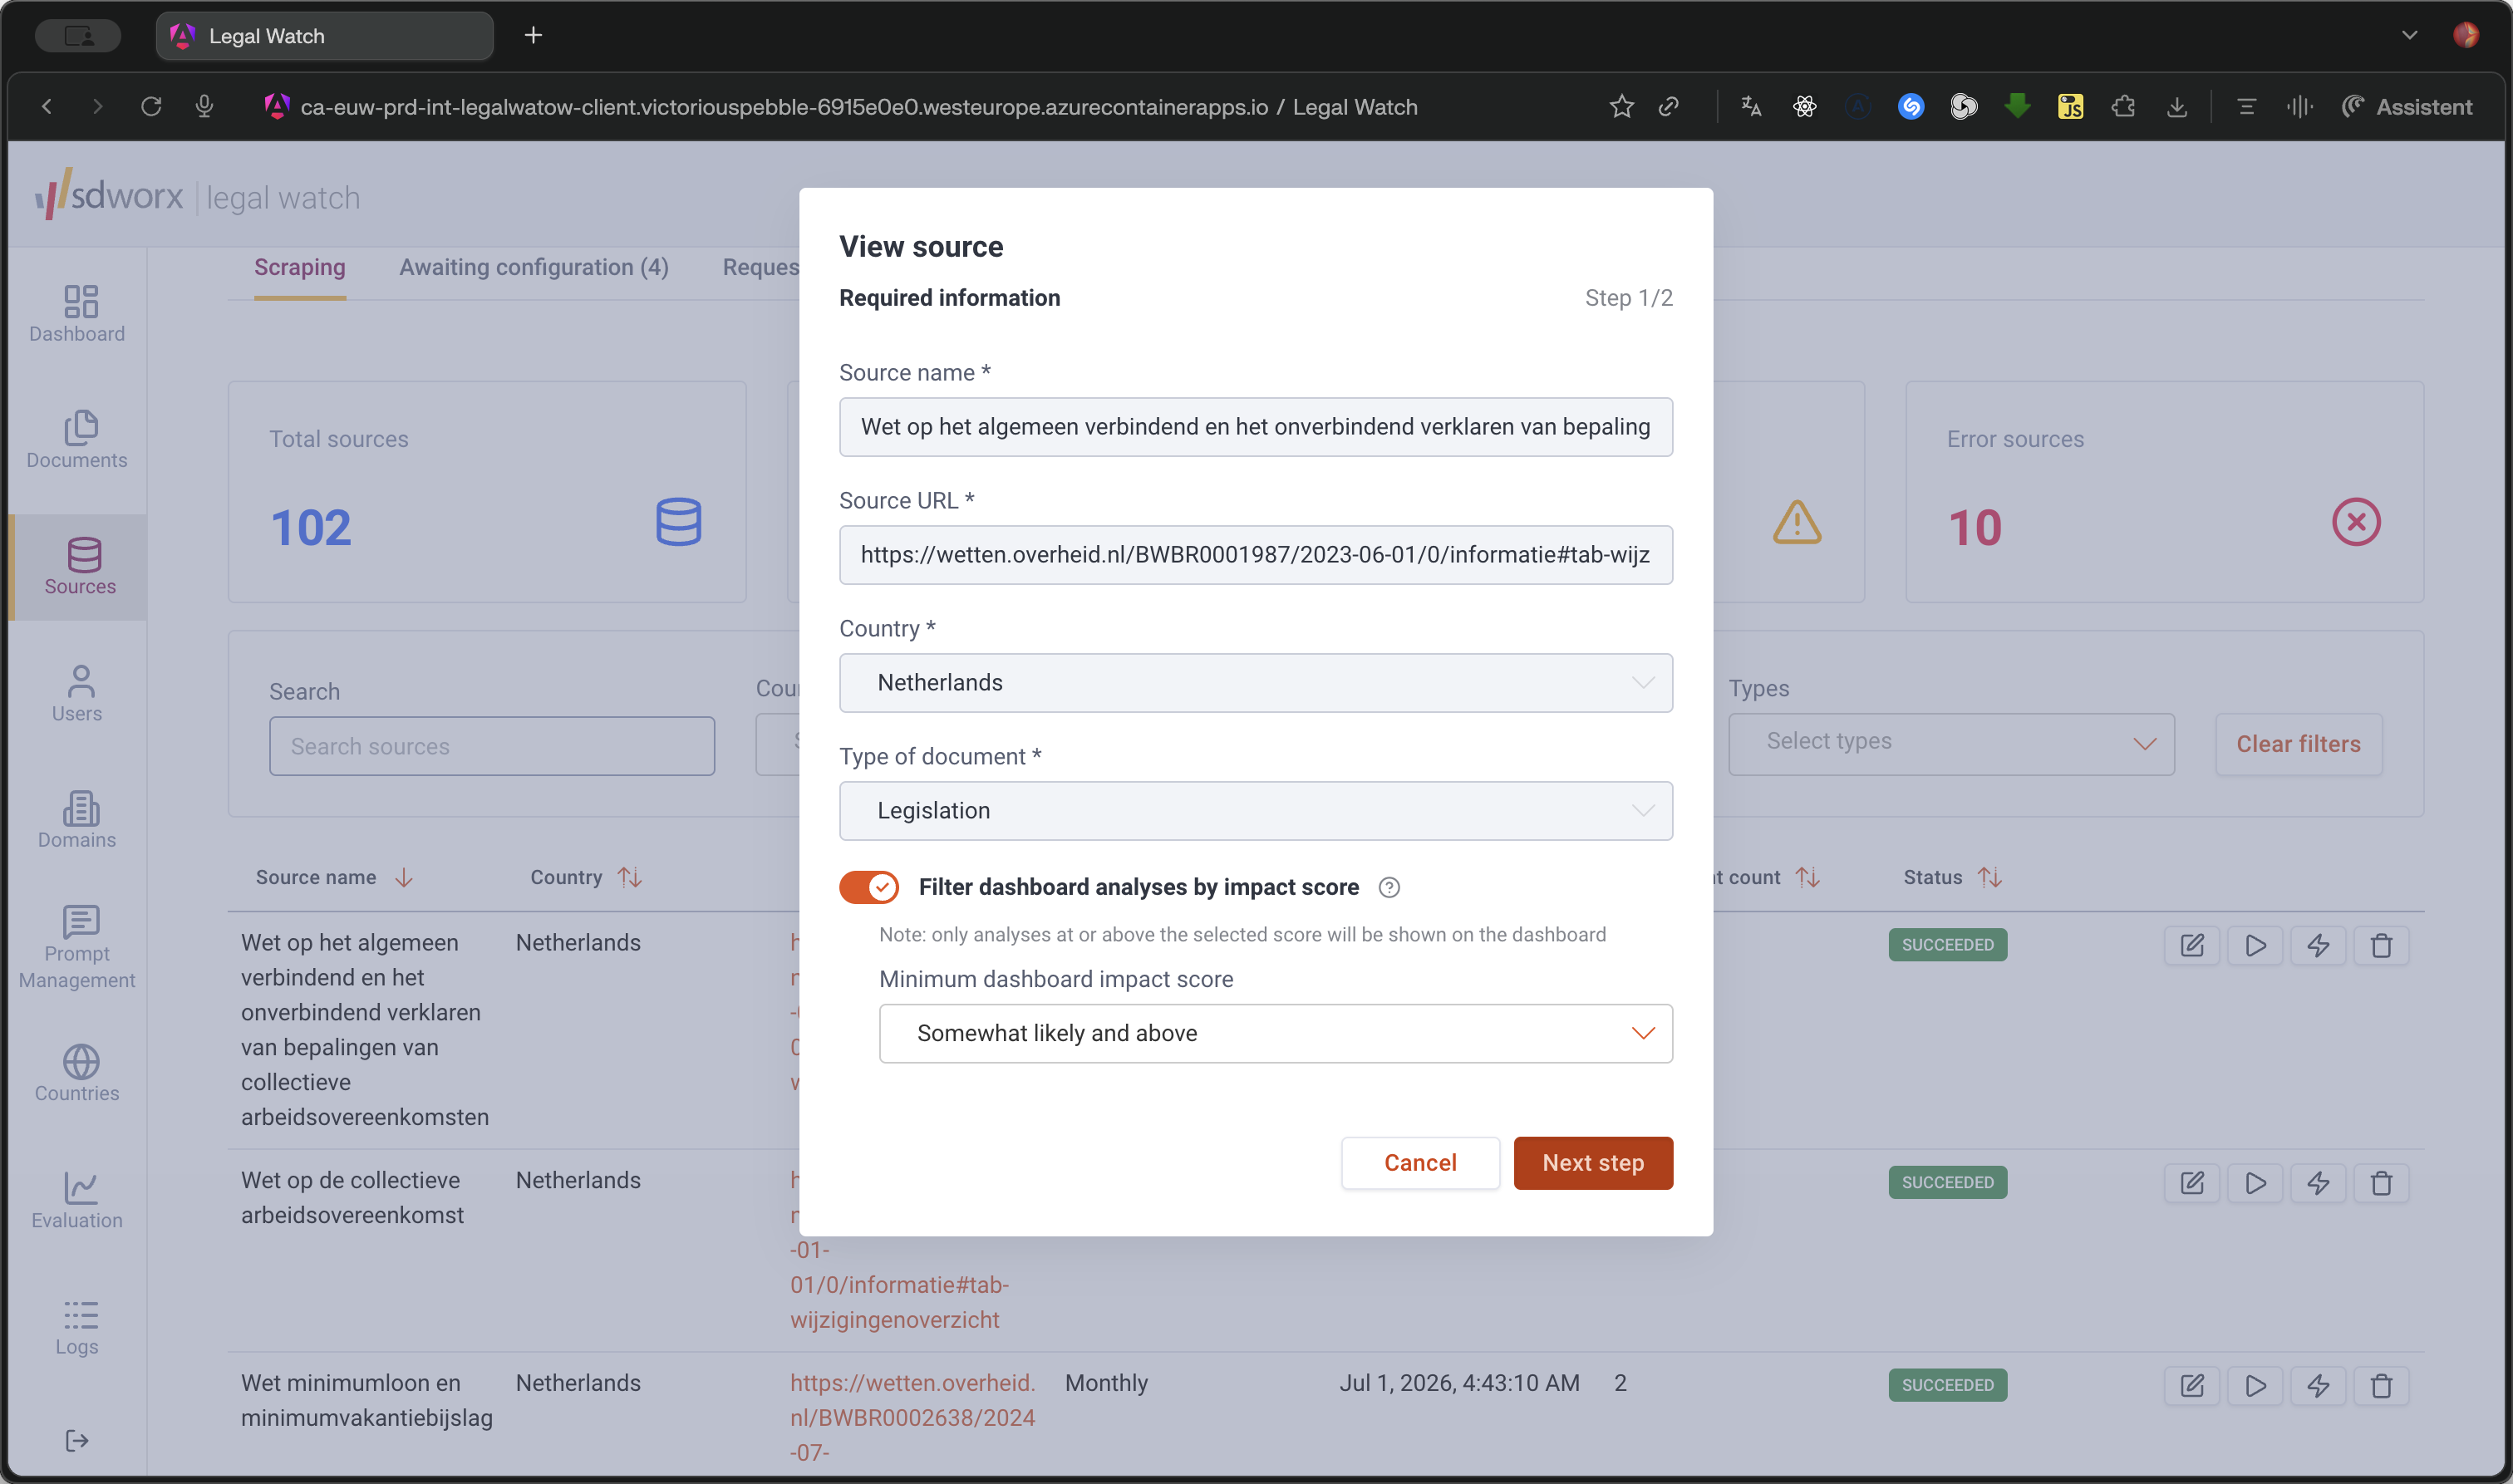
Modify minor parameters, such as the Filter dashboard analyses by impact score setting, then click Next step to save.
Step #10: Modify minor parameters, such as the Filter dashboard analyses by impact score setting, then click Next step to save.
11
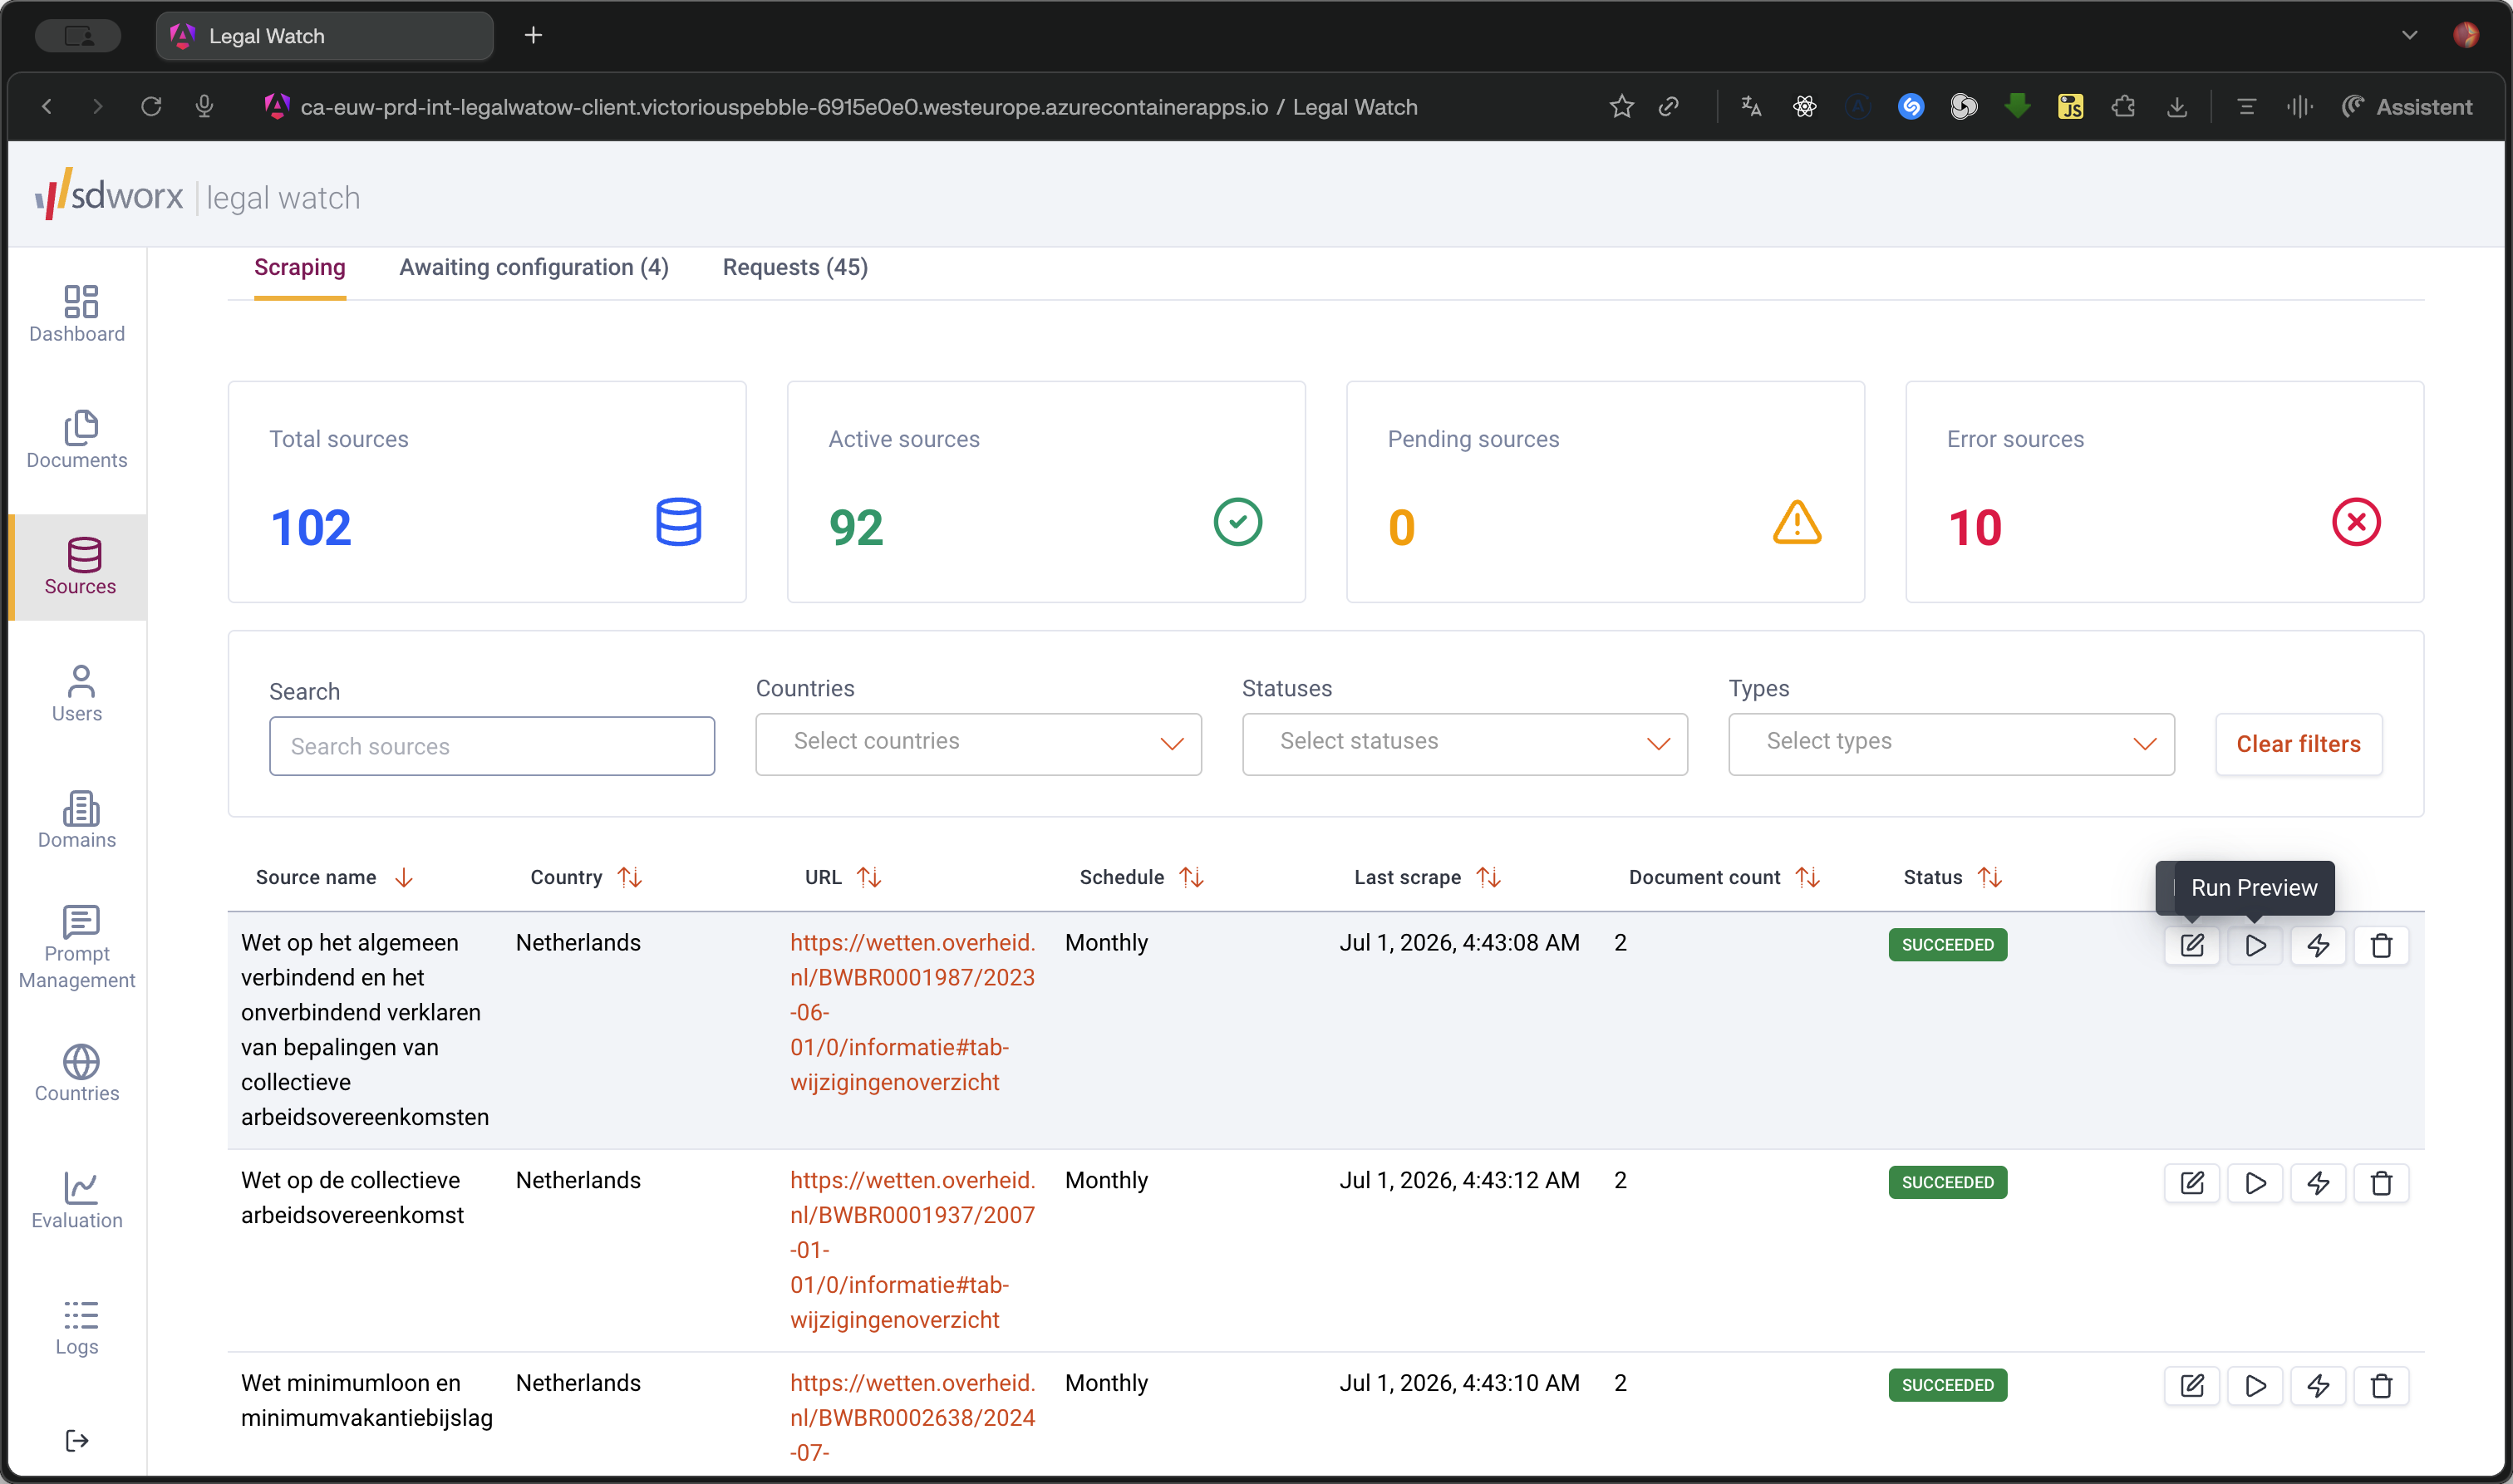
Hover over the play icon on a specific data source to reveal the testing options.
Step #11: Hover over the play icon on a specific data source to reveal the testing options.
12
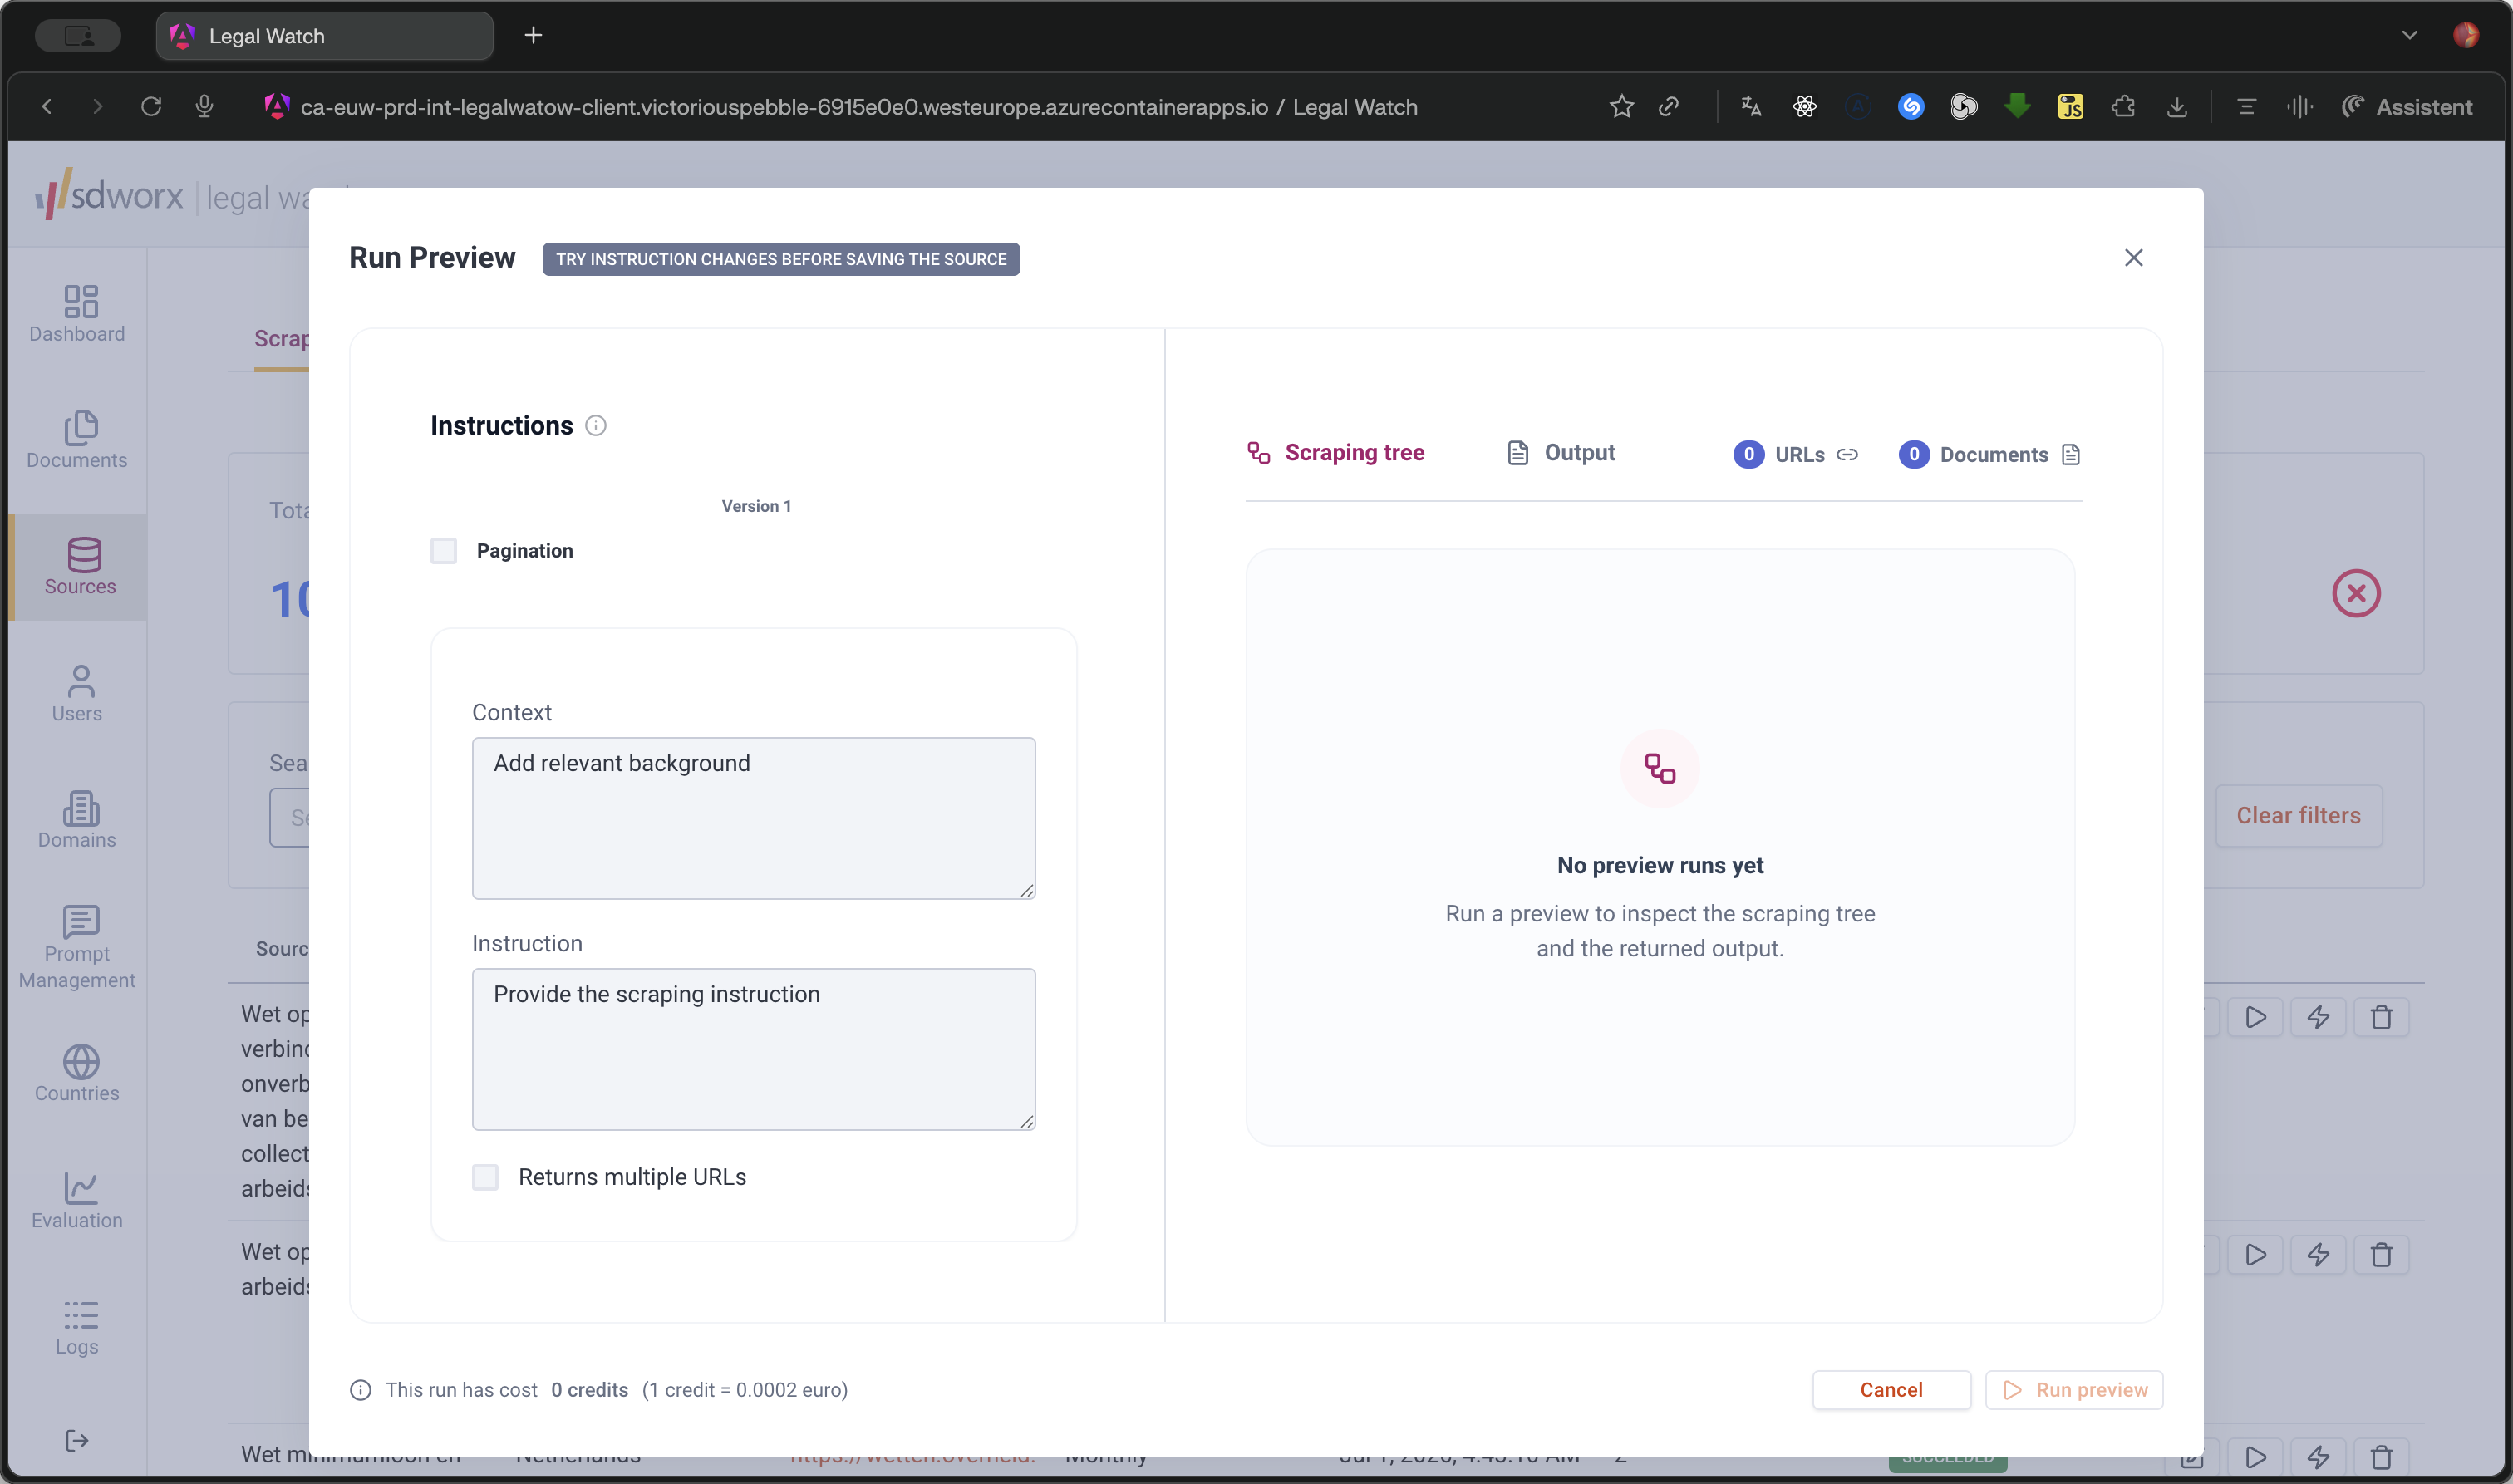
Click Run Preview to open the preview modal, allowing you to test small changes safely.
Step #12: Click Run Preview to open the preview modal, allowing you to test small changes safely.
13
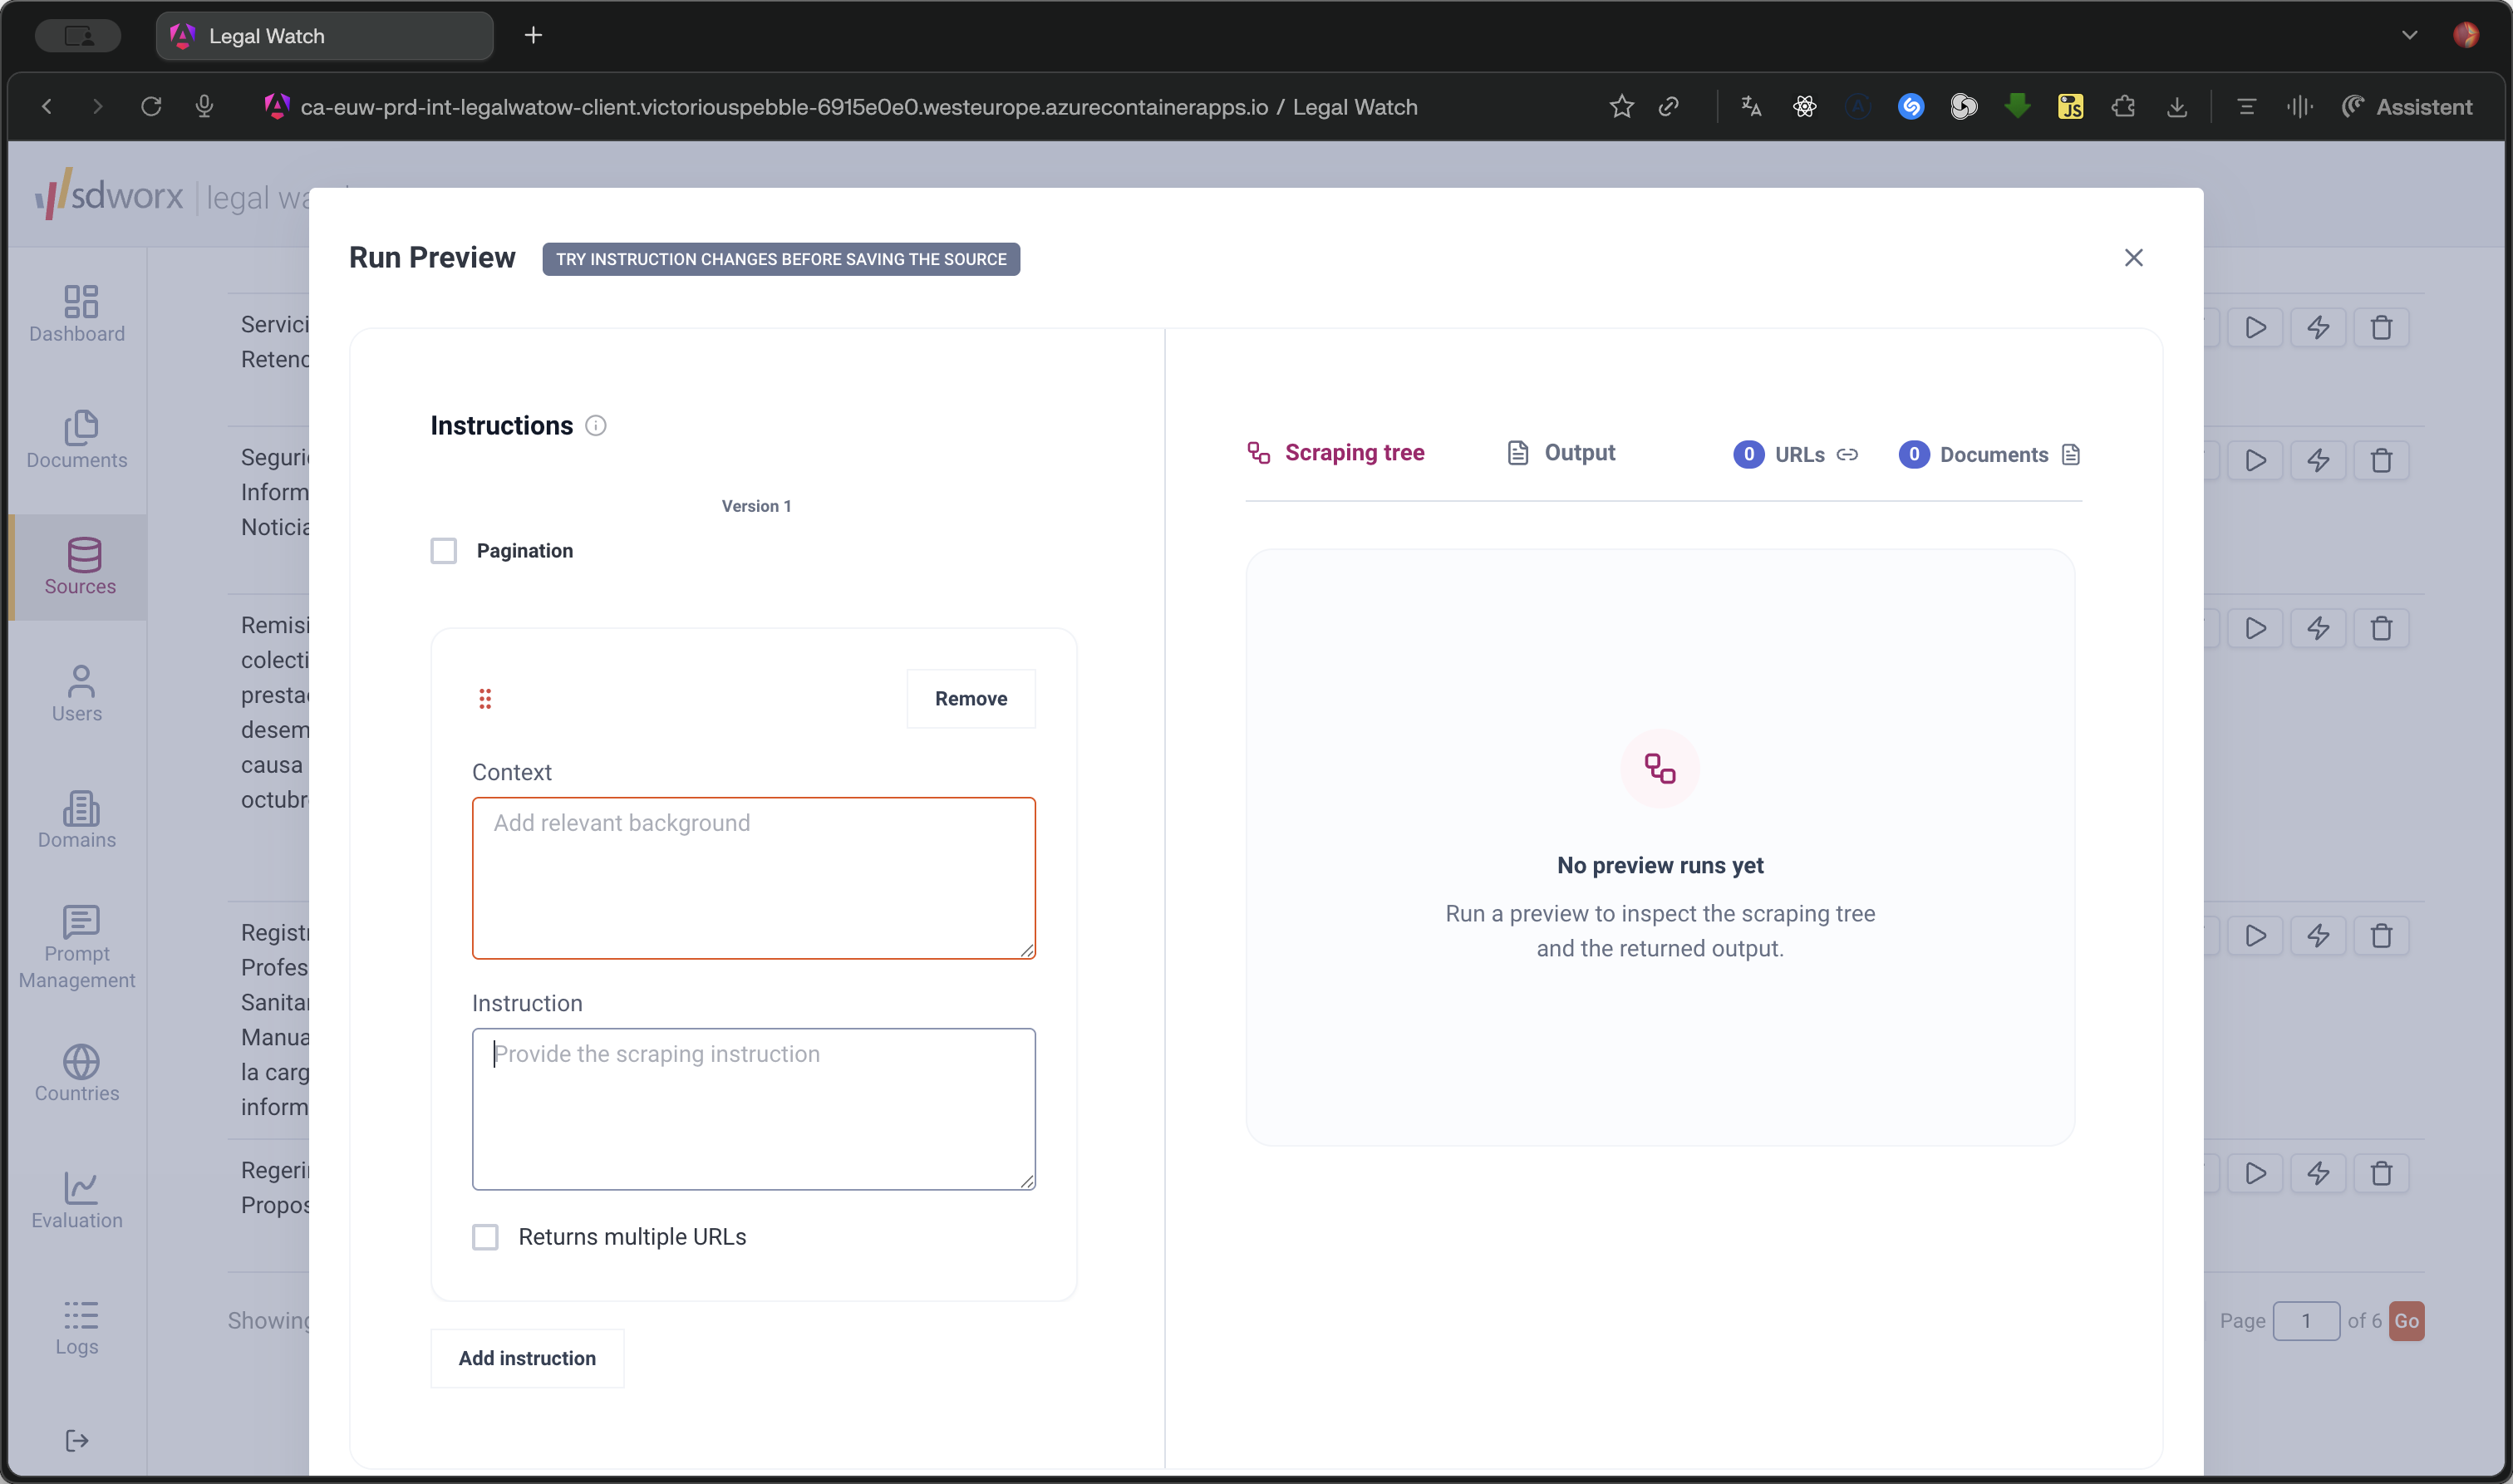
Click Add instruction in the left pane to define custom scraping rules or exclude data.
Step #13: Click Add instruction in the left pane to define custom scraping rules or exclude data.
14
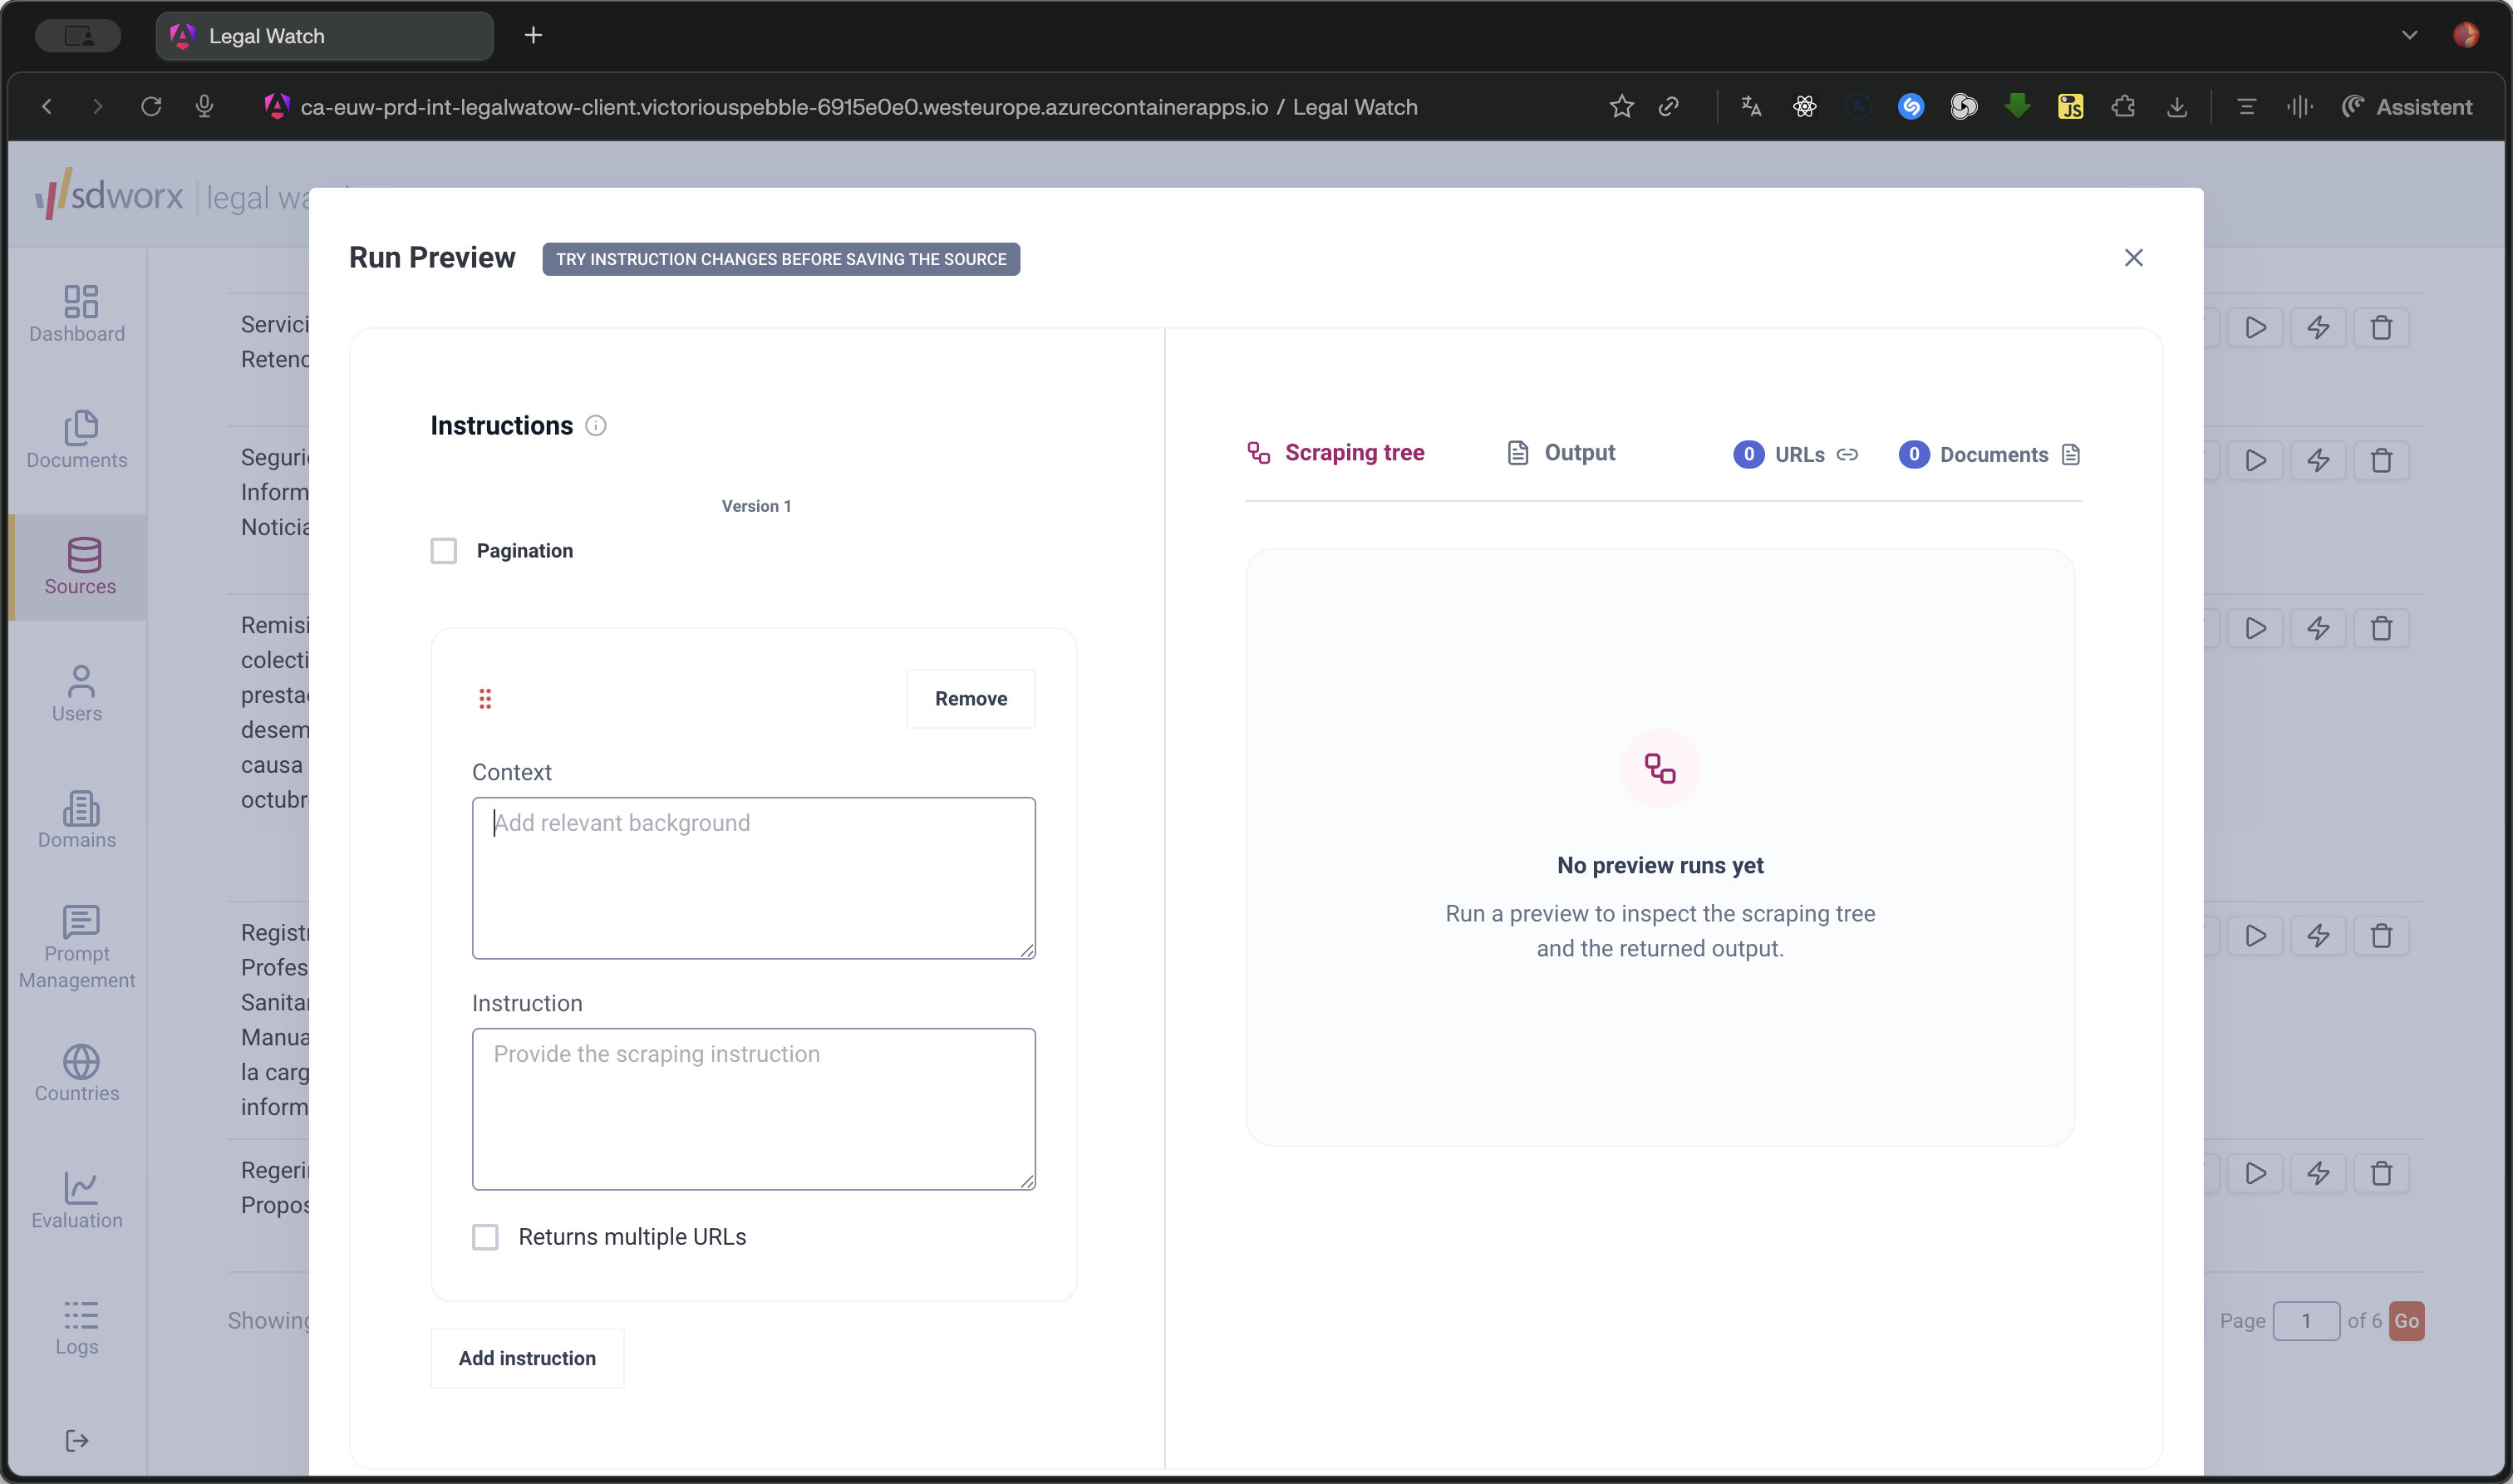
Enter your context and instructions, then click Run preview in the bottom right corner to execute the test and view the output.
Step #14: Enter your context and instructions, then click Run preview in the bottom right corner to execute the test and view the output.

Q: Why did my source disappear from the list immediately after I clicked Trigger?

A: If you are actively filtering the dashboard to show only errored sources, re-triggering the source changes its status to active/pending. Because it is no longer in an error state, it drops out of your current filtered view until you clear the filters.

Q: Why can't I edit instructions for certain data sources?

A: Direct sources and sources using custom scrapers cannot be edited through the standard instruction interface. Direct sources automatically ingest a direct file or RSS feed, while custom scrapers require an engineer to manually update the underlying scraper code.

Q: Should I frequently edit the core setup of an approved source?

A: No. Generally, you should avoid editing the core configuration of an approved source. Modifying the fundamental content rules will require the source to undergo the legal expert review and approval process again.

Term

Definition

Direct source

A data feed that directly ingests a structured file or RSS feed without requiring complex web scraping instructions.

Custom scraper

A specialized script built by an engineer designed to extract data from a highly complex or non-standard website.

Partially failed

A status indicating that the scraping job largely succeeded, but specific sub-elements or sections encountered errors.