
How to Manage Inventory and Sales Analytics in Einstein v2
Learn how to process inventory, manage product offers, and analyze sales performance dashboards using the Einstein v2 platform.
This guide walks you through managing repack lists, clearing product offers, and tracking daily and monthly sales metrics in Einstein v2. Completing these workflows ensures accurate inventory yielding and provides clear visibility into business performance and margins.
This applies to operations managers, sales analysts, and administrative staff who handle daily inventory processing, promotional offer management, and financial reporting.
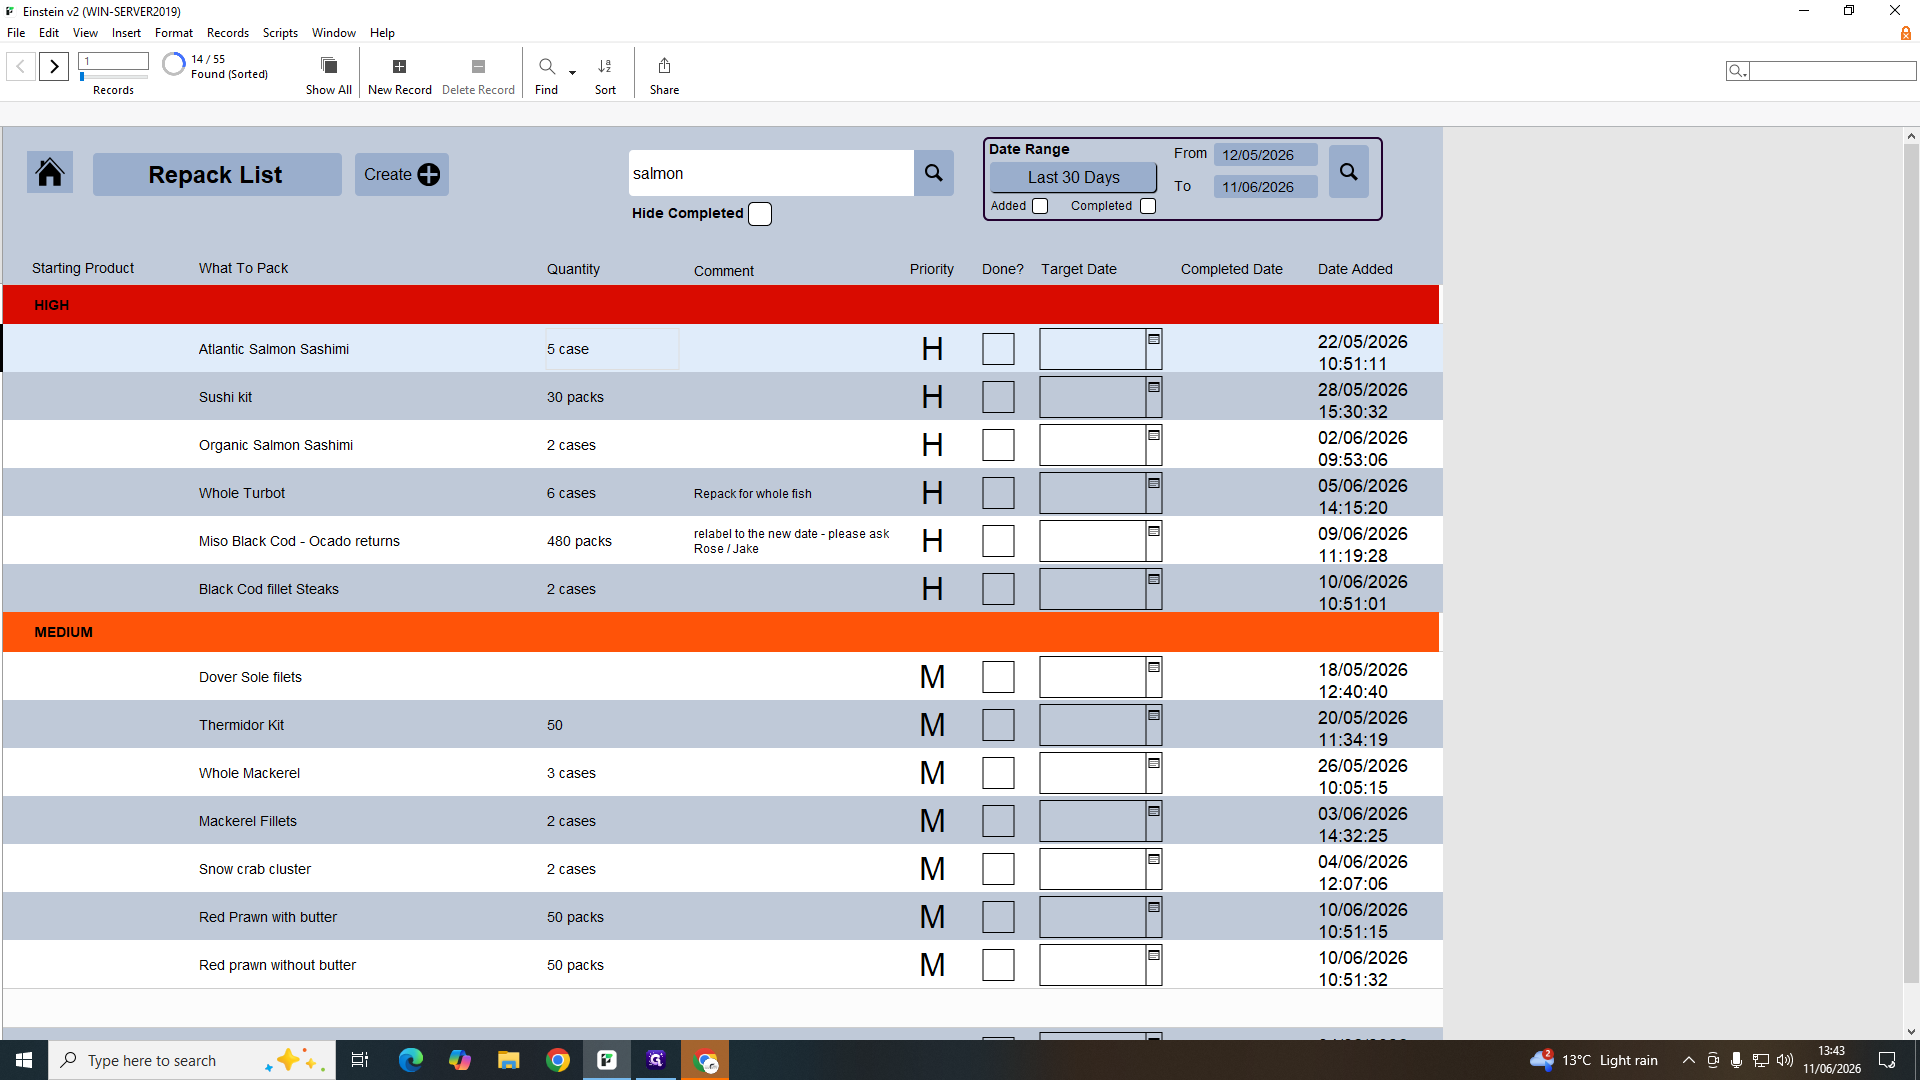
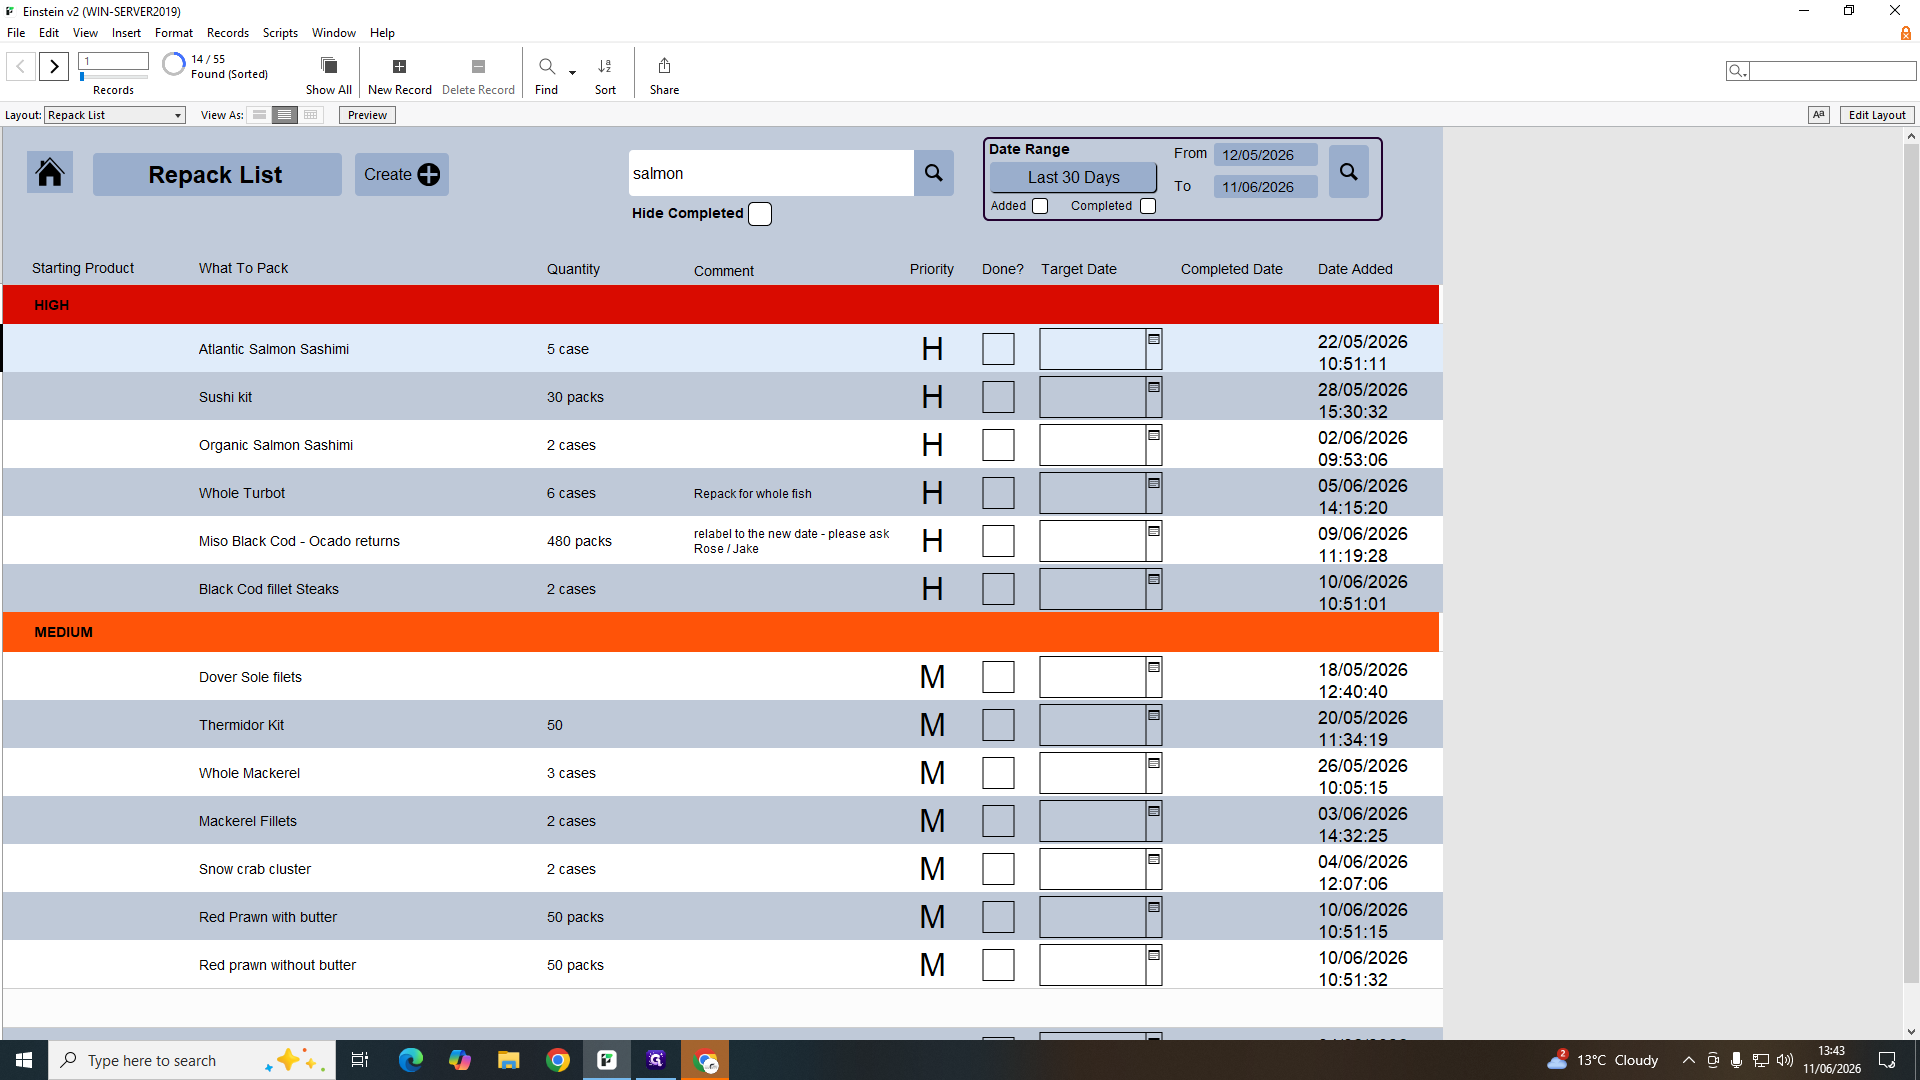
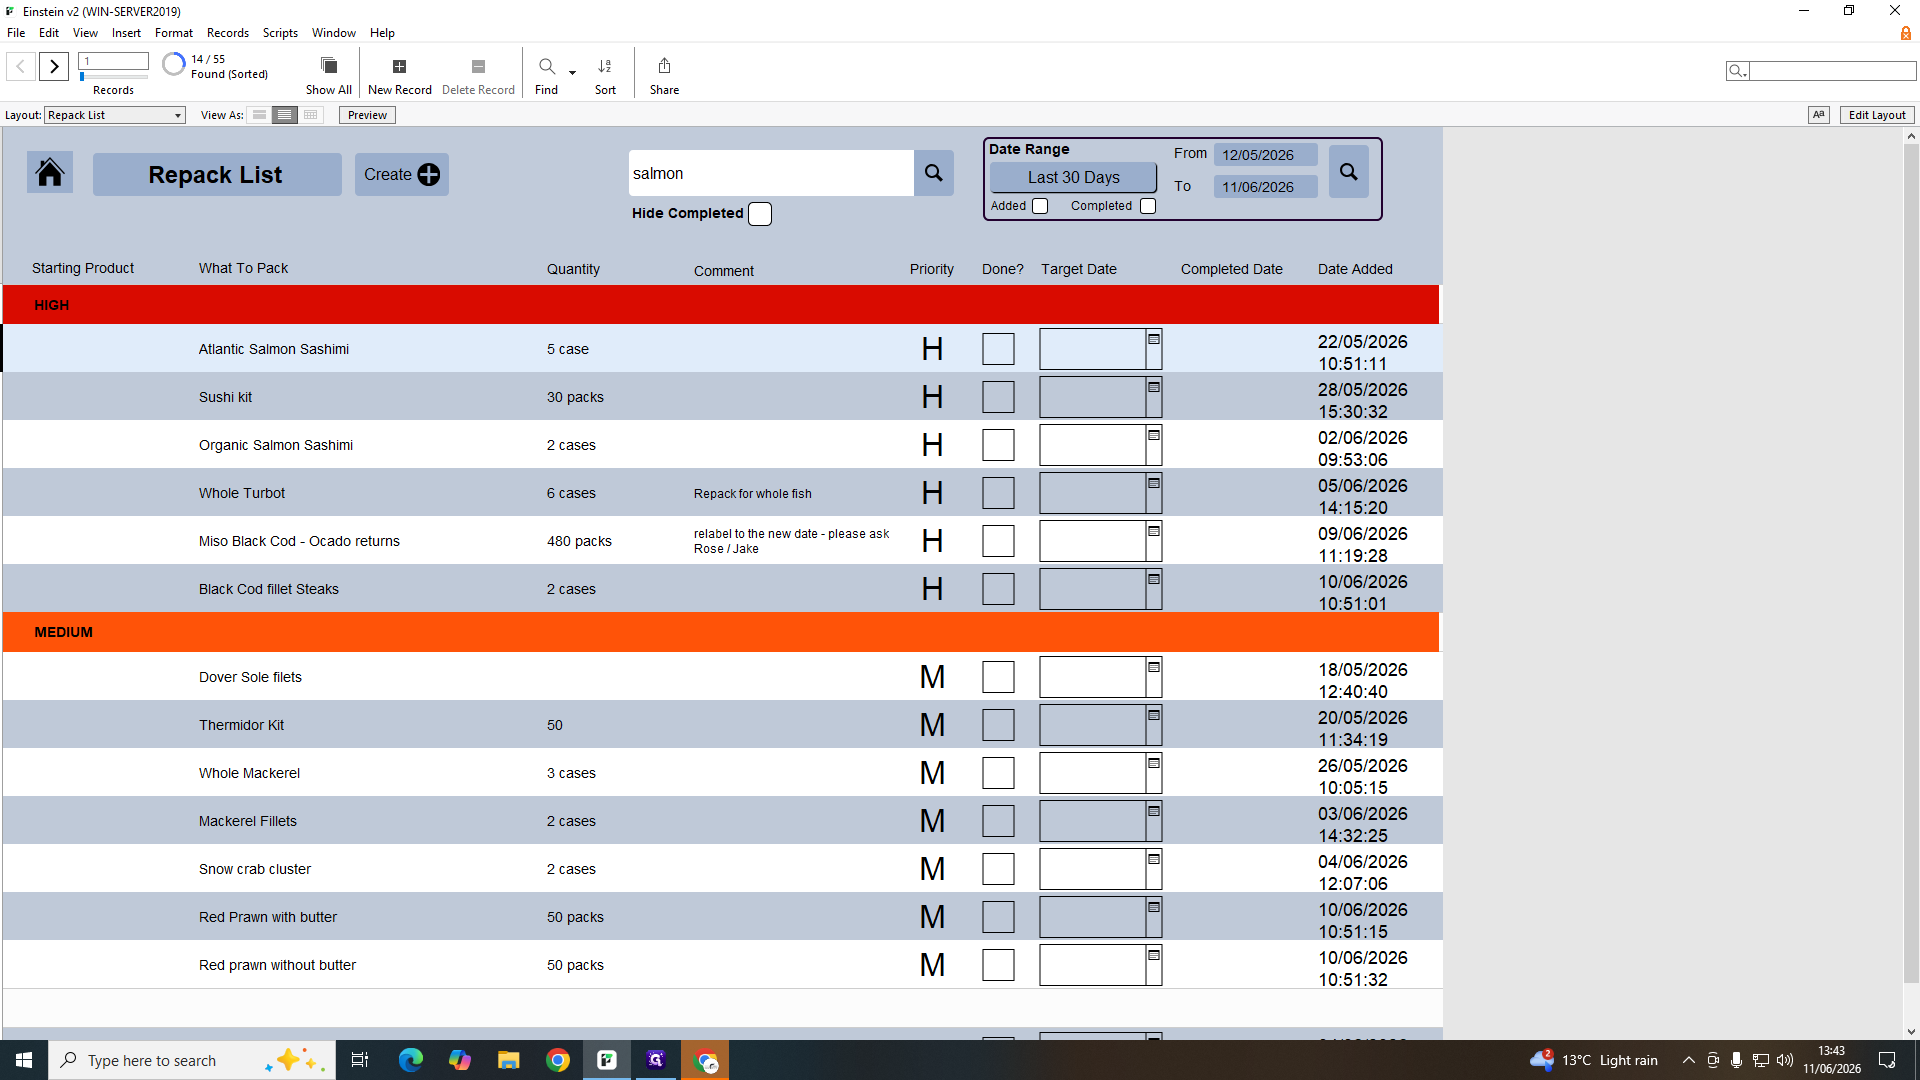
Managing Repack Lists
The repack list provides a queue of bulk products that need to be packaged into individual units for stock.


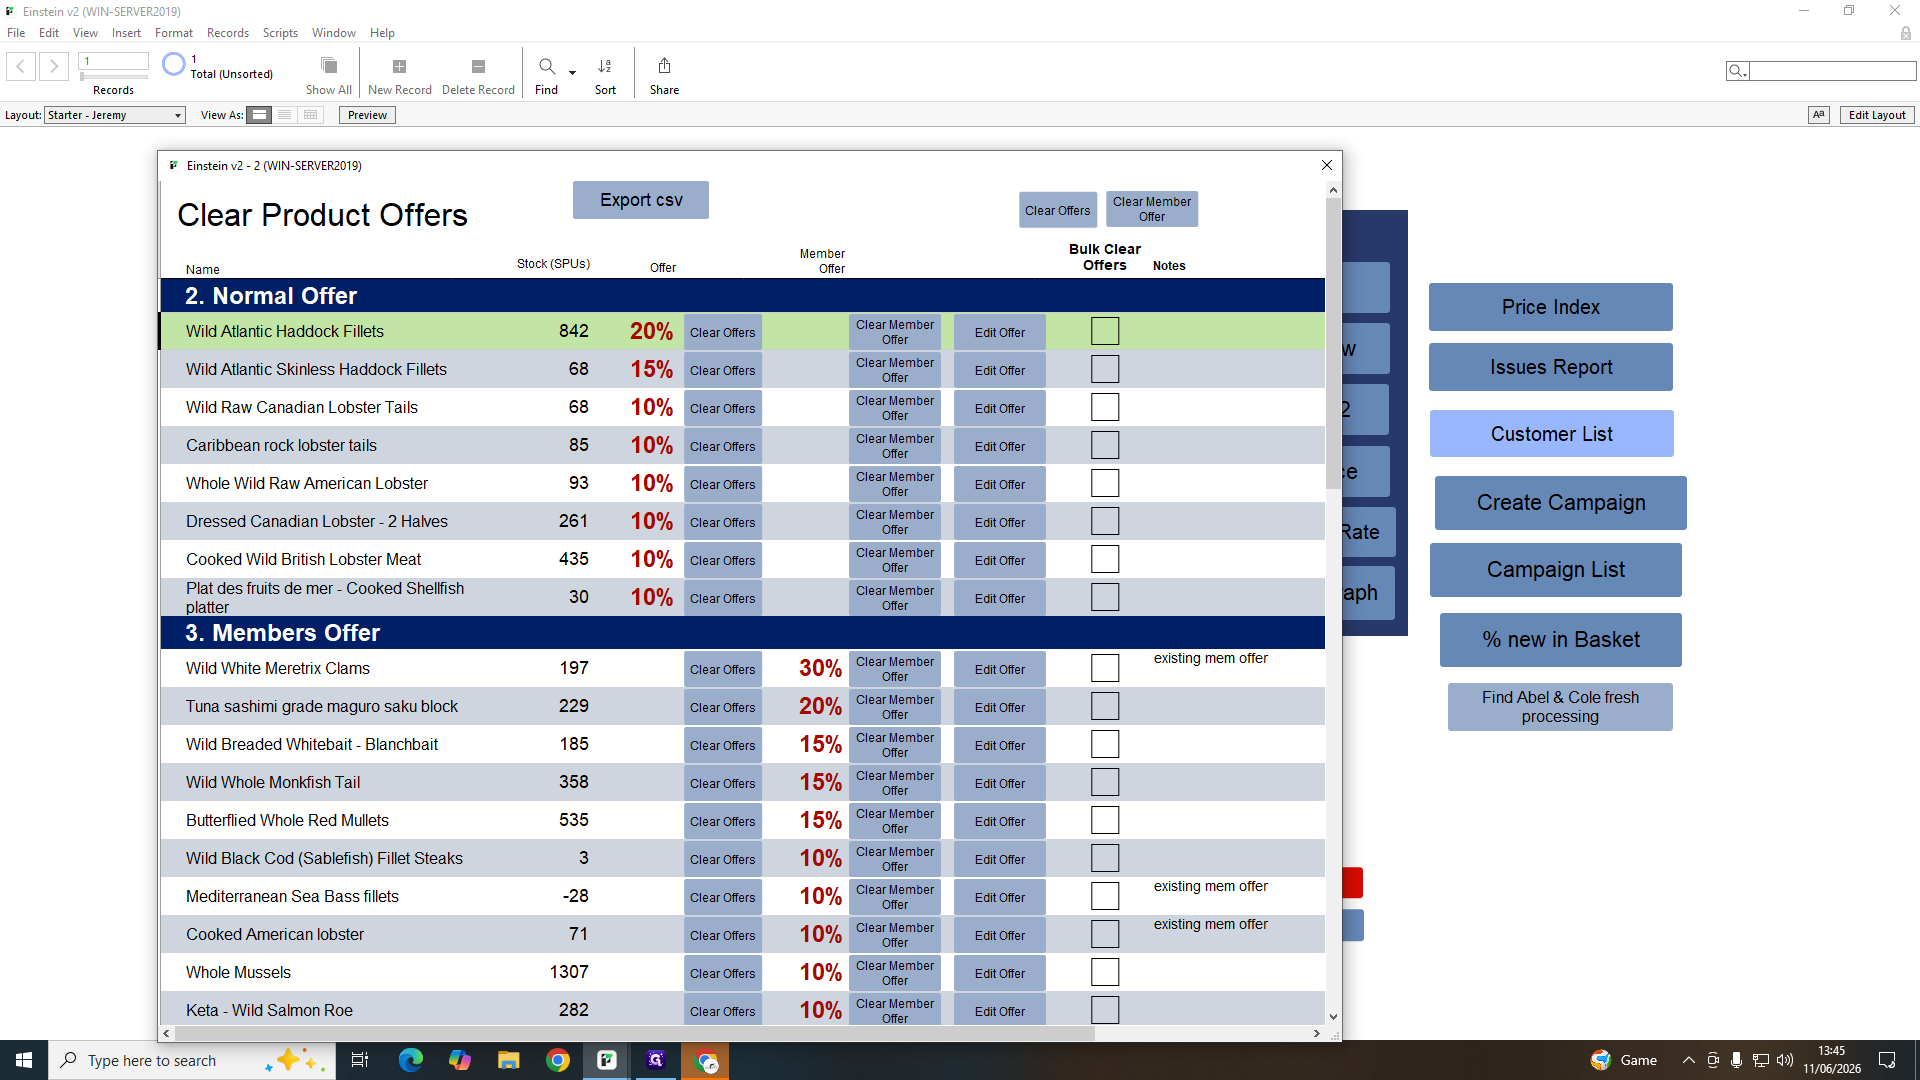
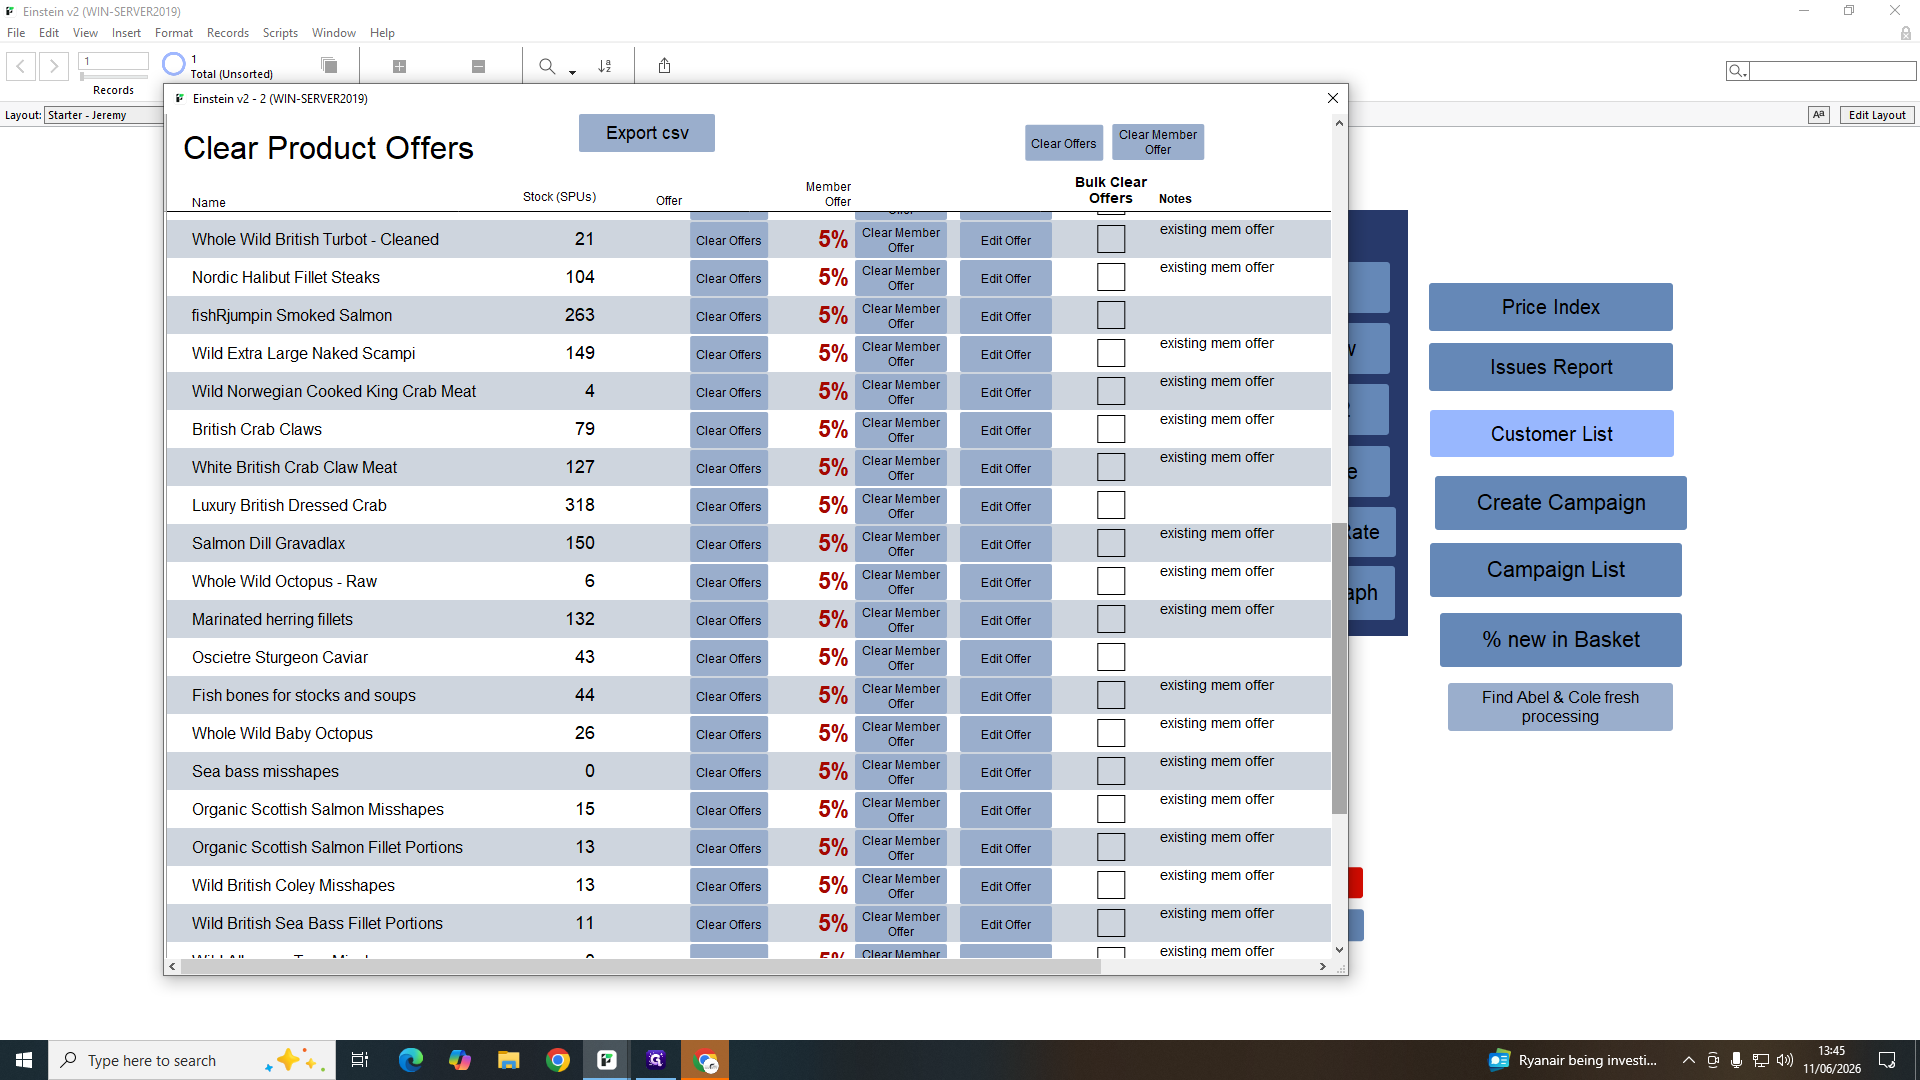
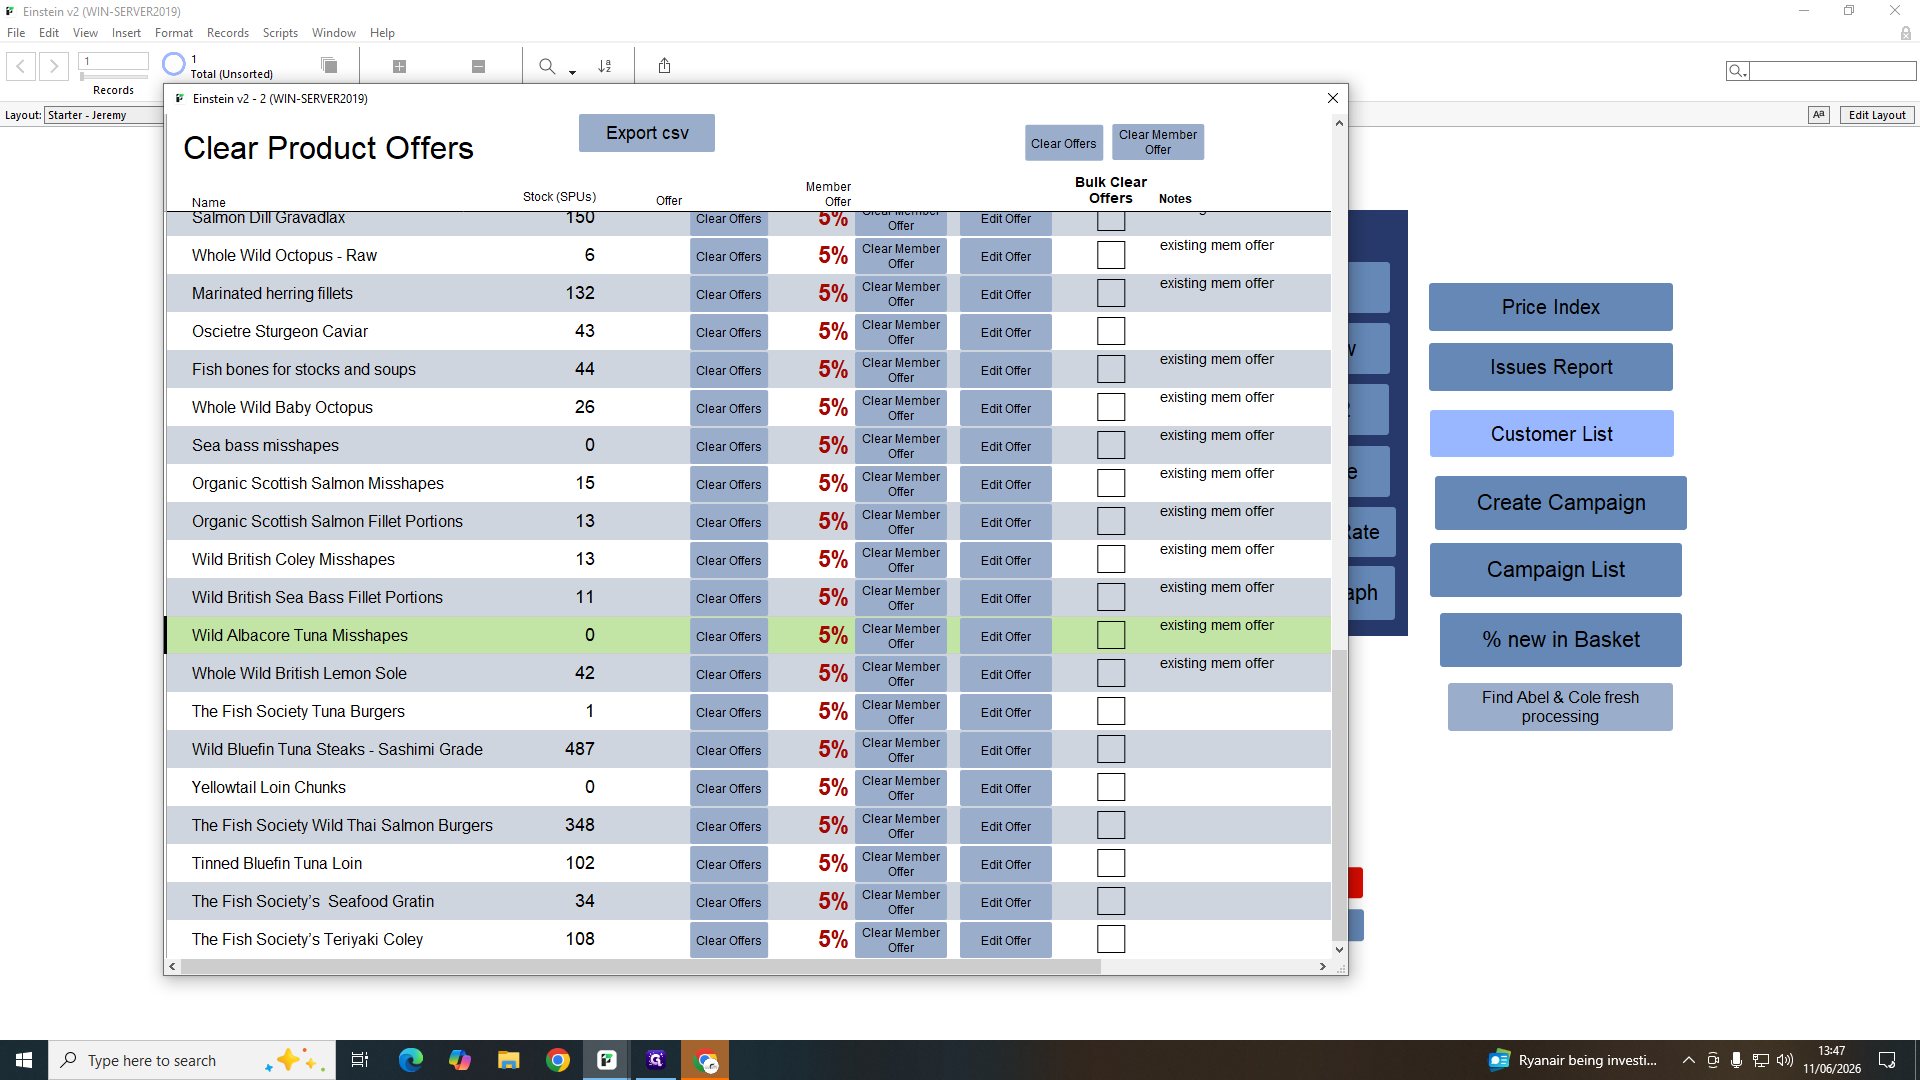
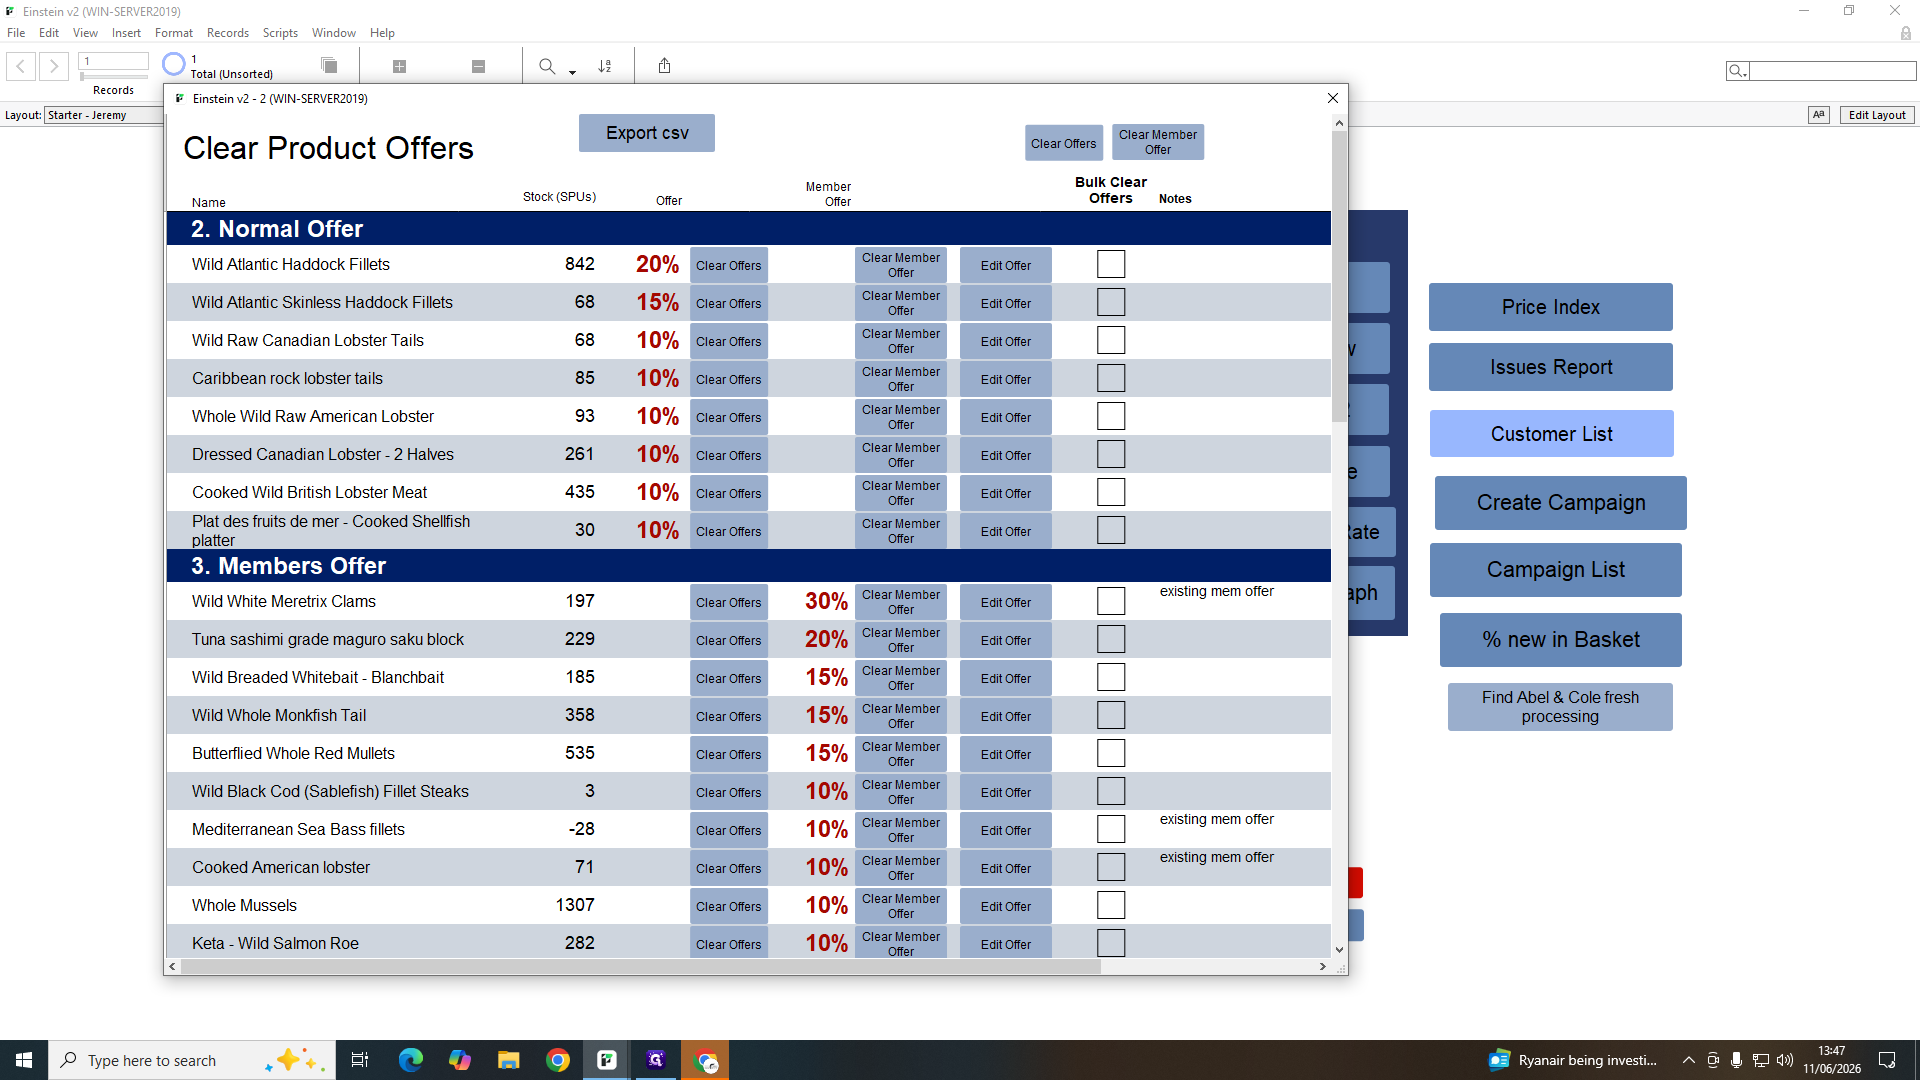
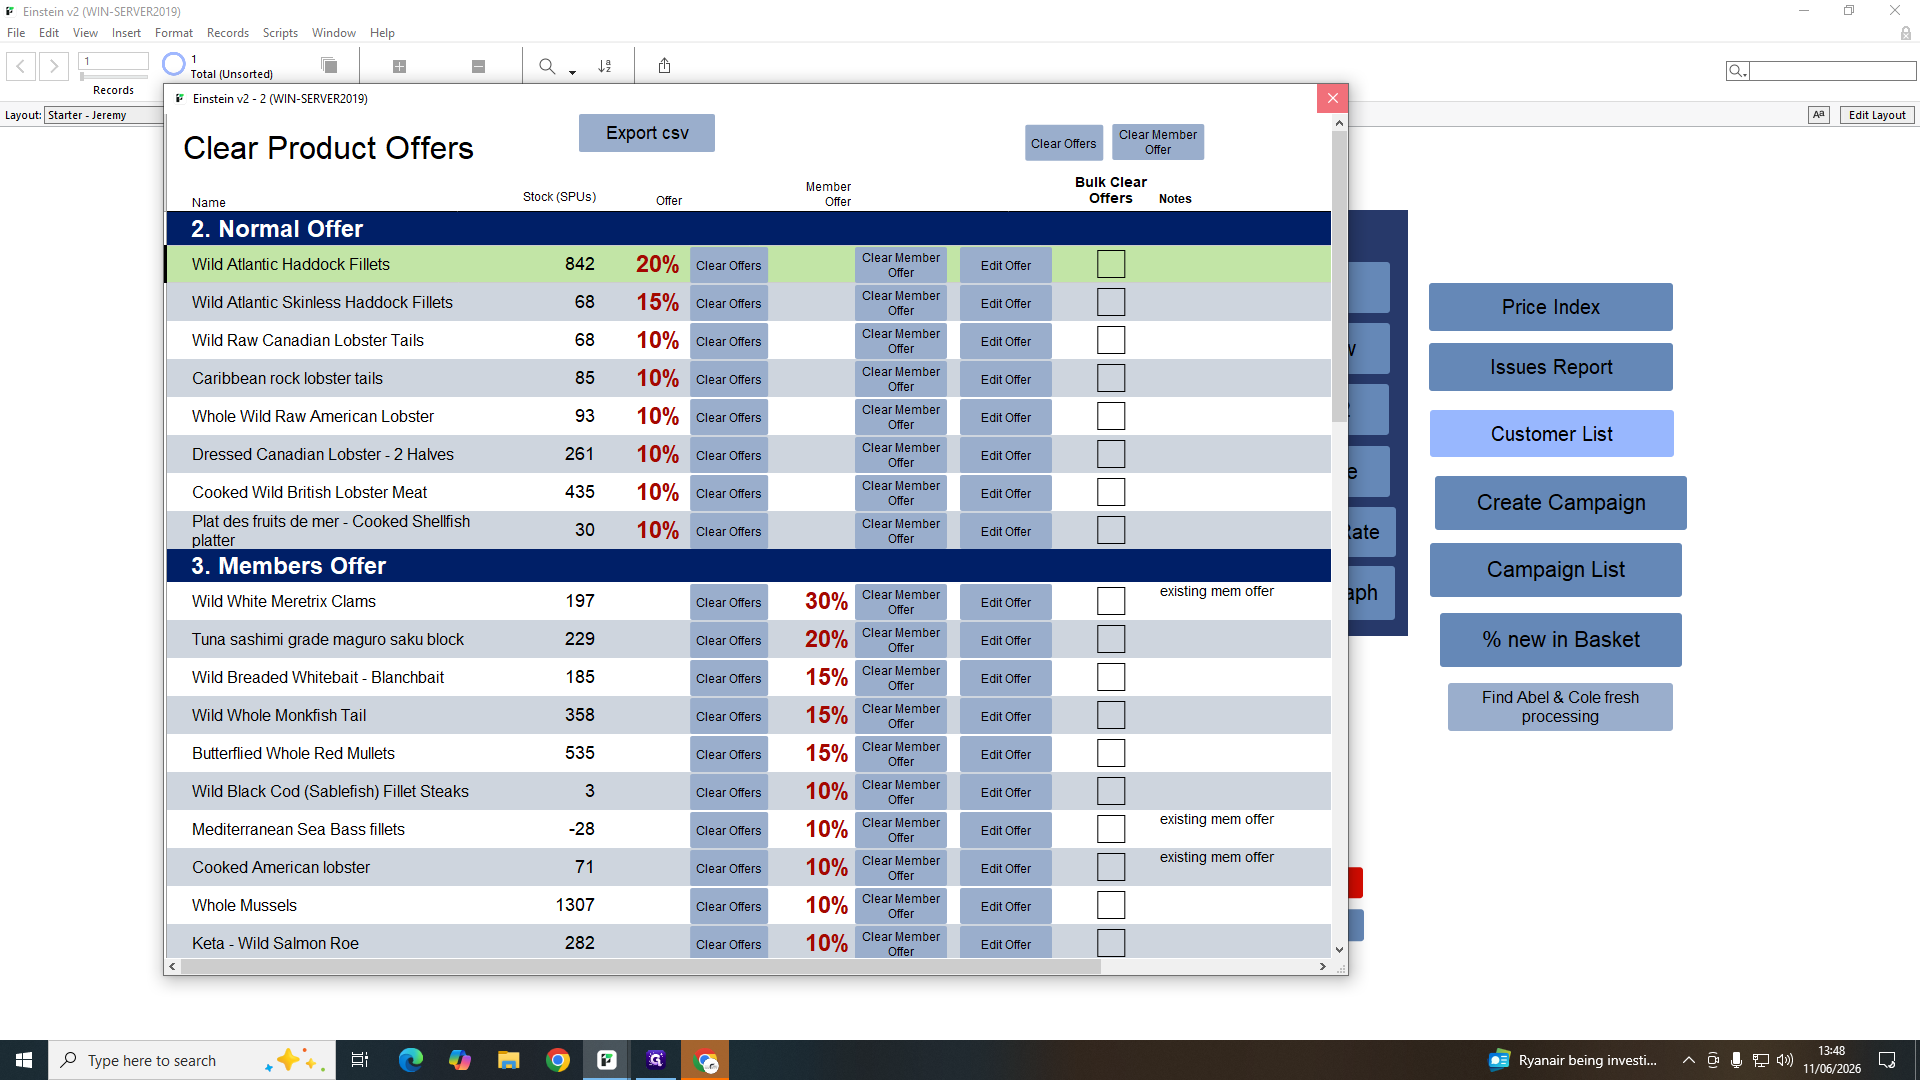
Clearing Product Offers
Use this module to remove bulk promotions or member-only discounts from specific products.
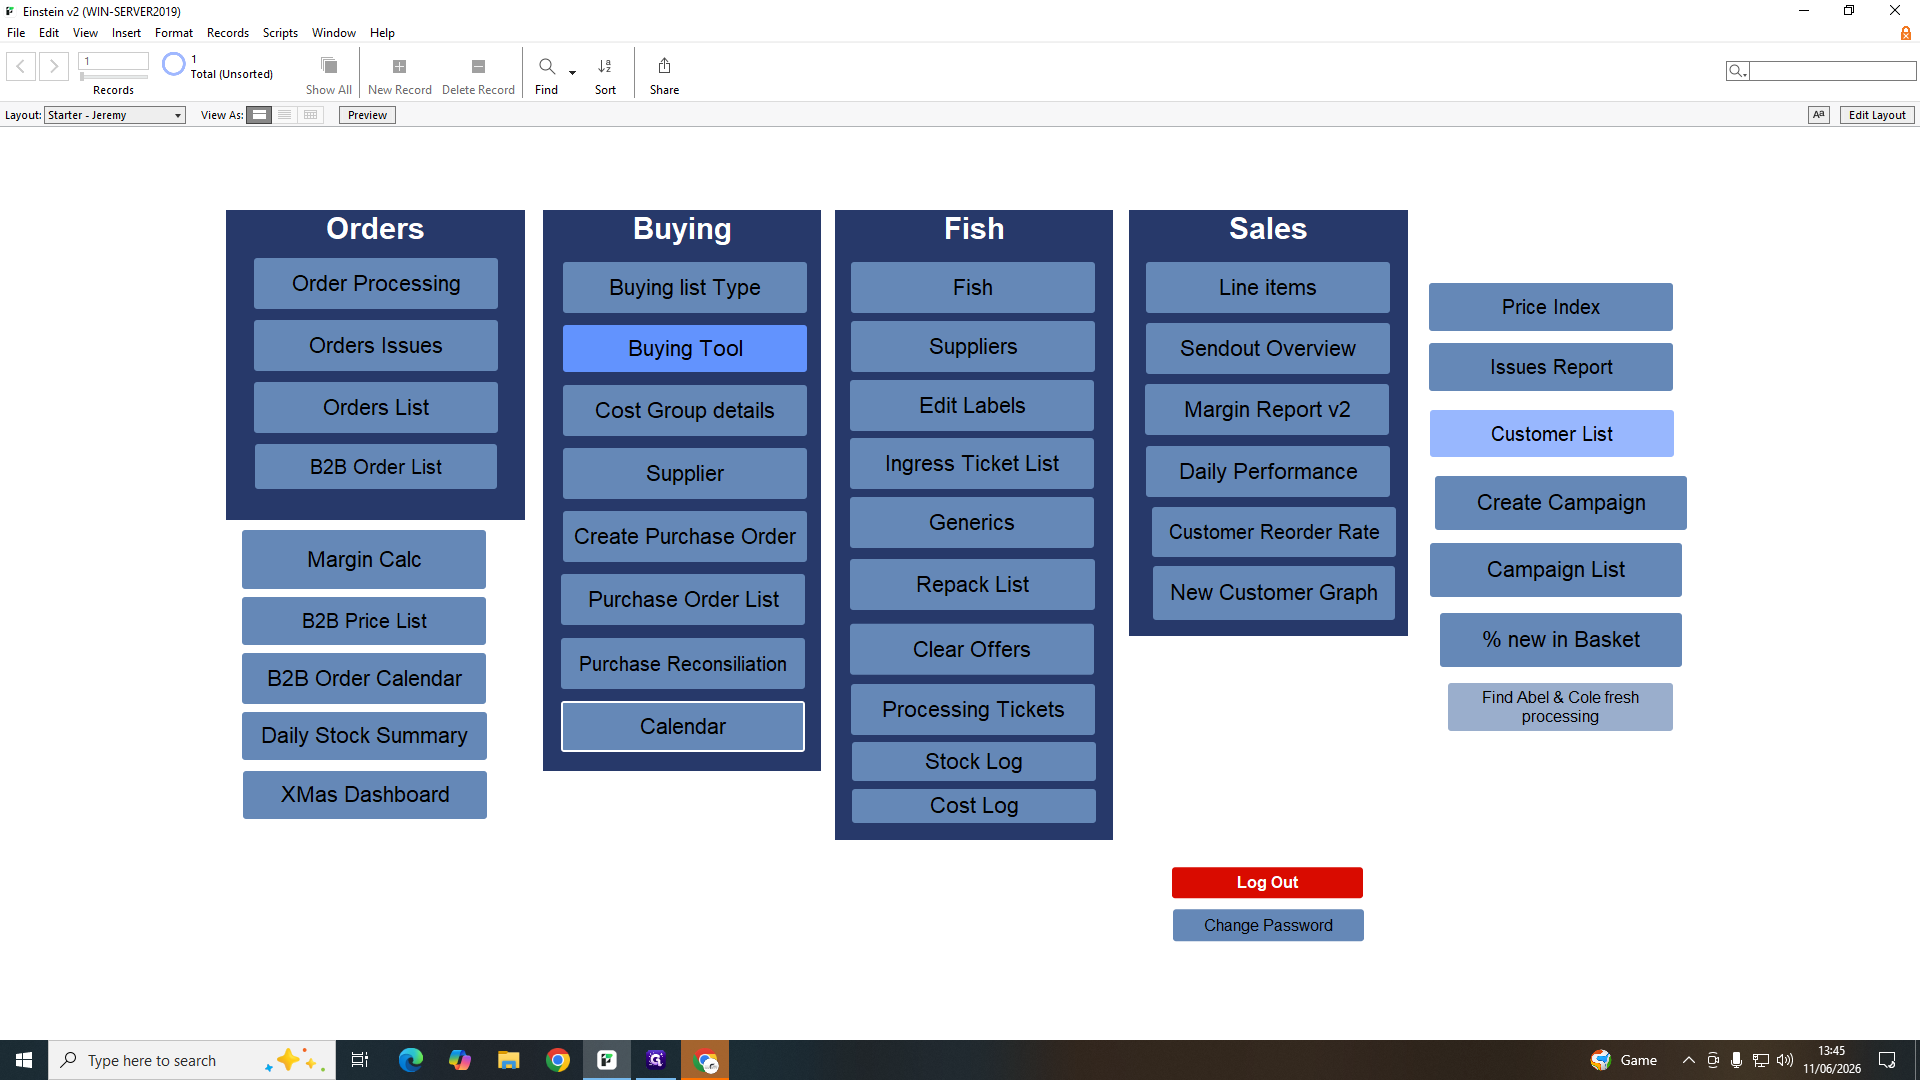
Analytics and Performance Dashboards
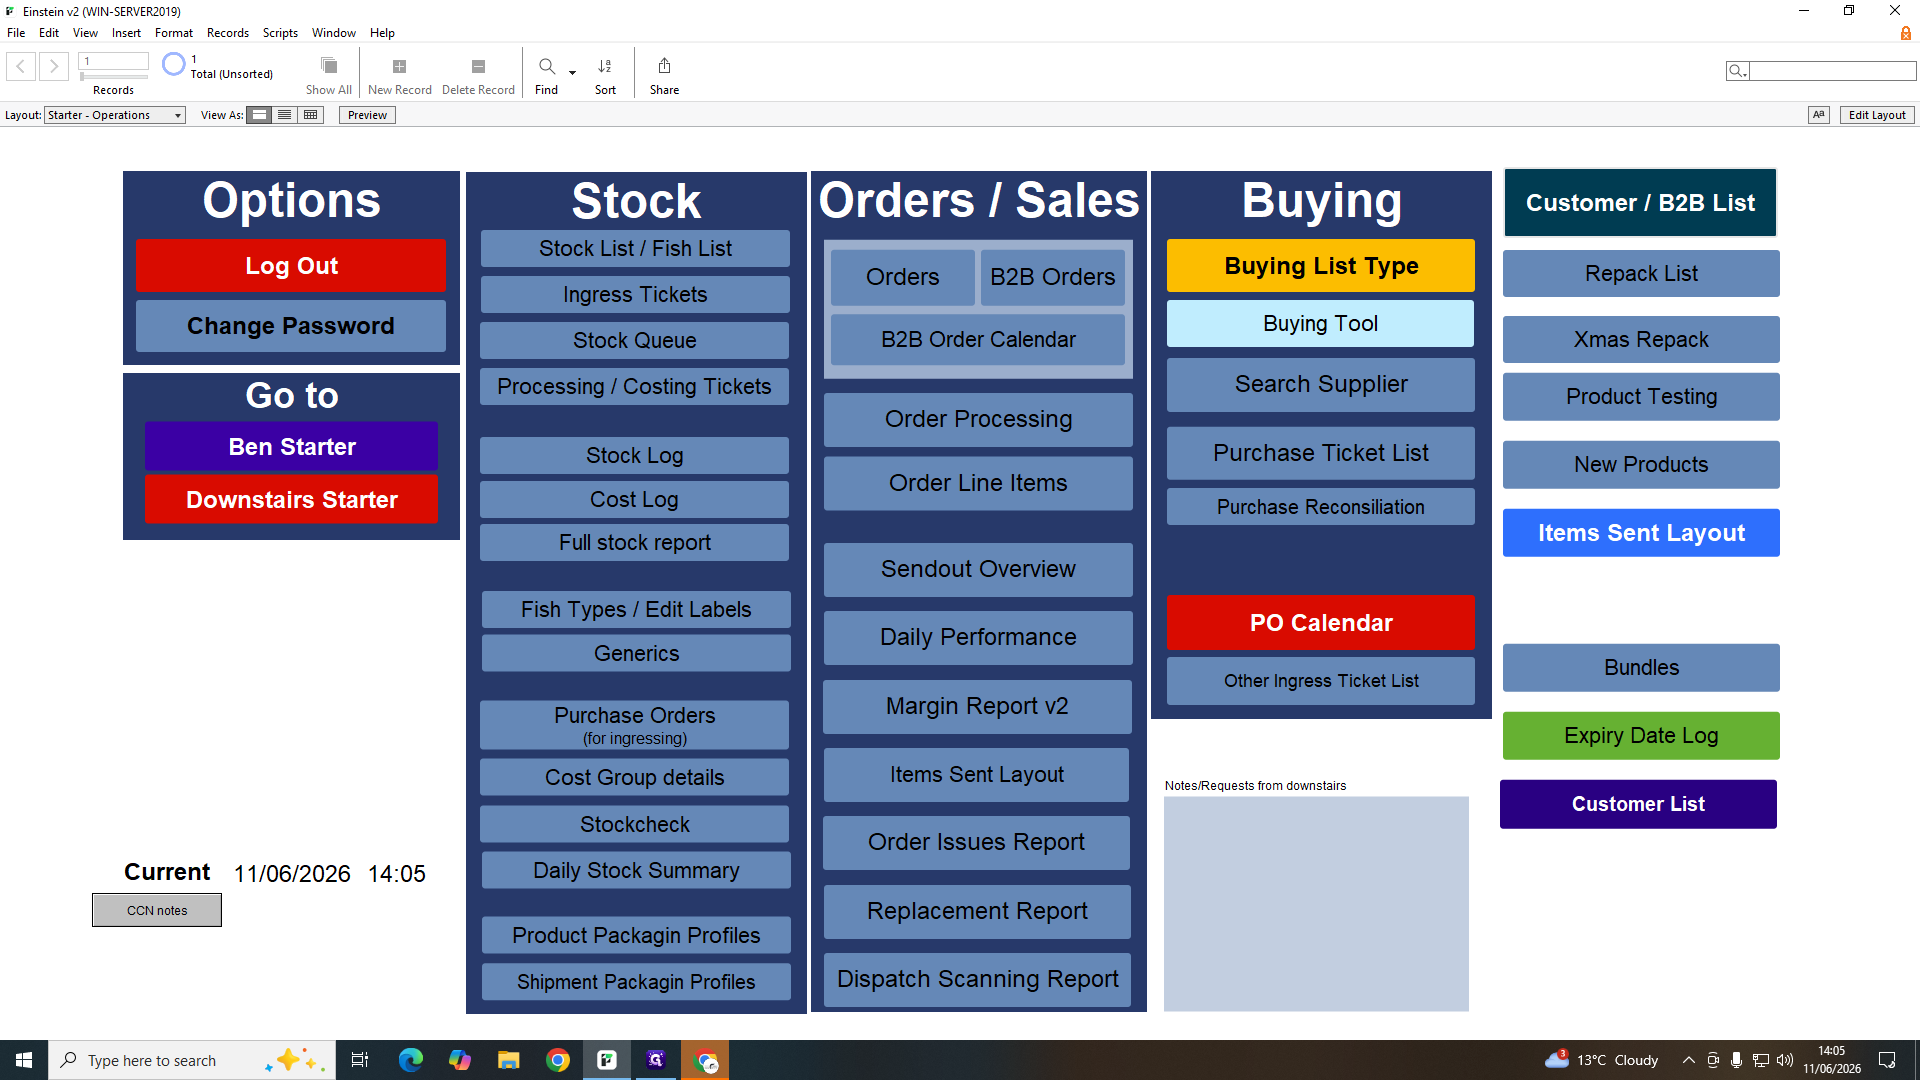
Einstein v2 offers multiple dashboards to track different performance metrics depending on the timeframe and operational focus.
Dashboard | Purpose | Use Case |
|---|---|---|
Sendout Overview | High-level summary of outgoing orders | Planning weekly production and logistics volume. |
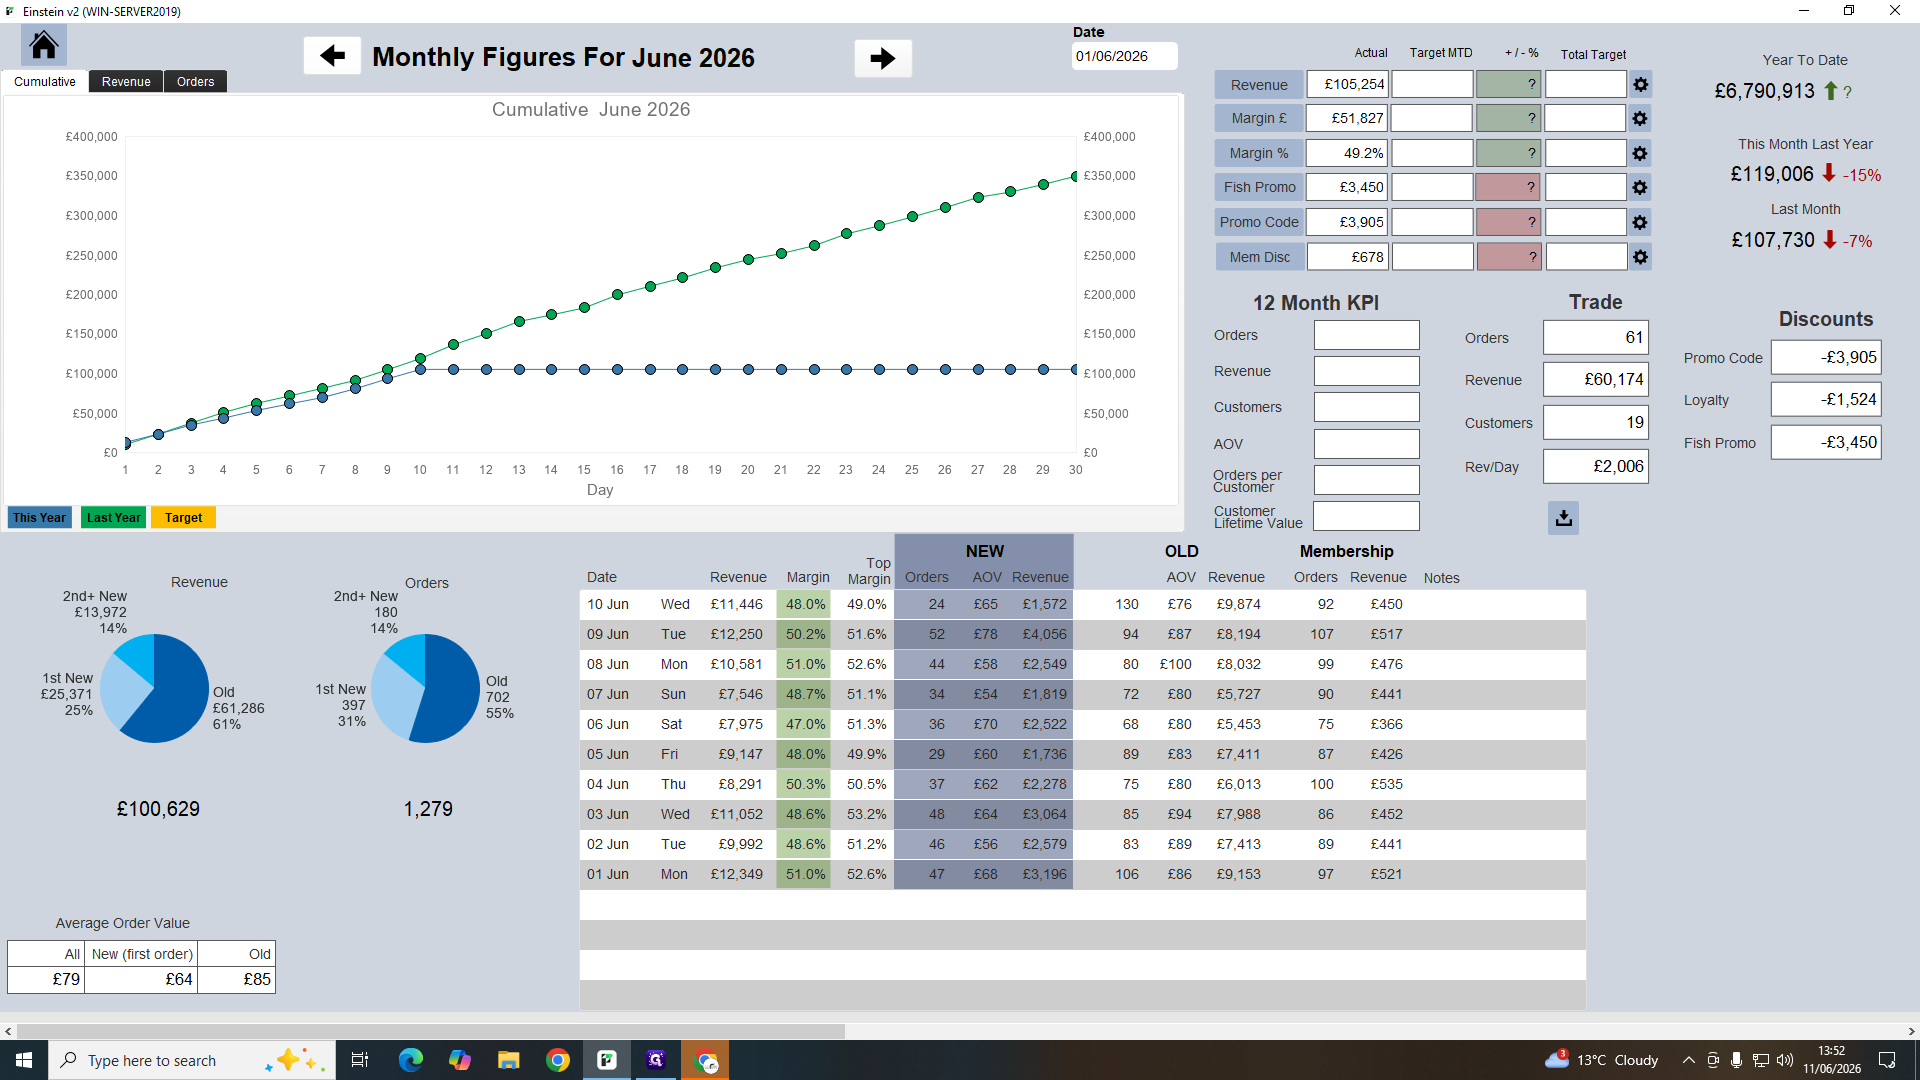
Daily Performance | Day-to-day retail sales, margins, and customer activity | Tracking short-term margin goals and recent order trends. |
Margin Report v2 | Monthly financial breakout comparing revenue and discounts | Analyzing gross margins, Average Order Value (AOV), and promotion costs. |
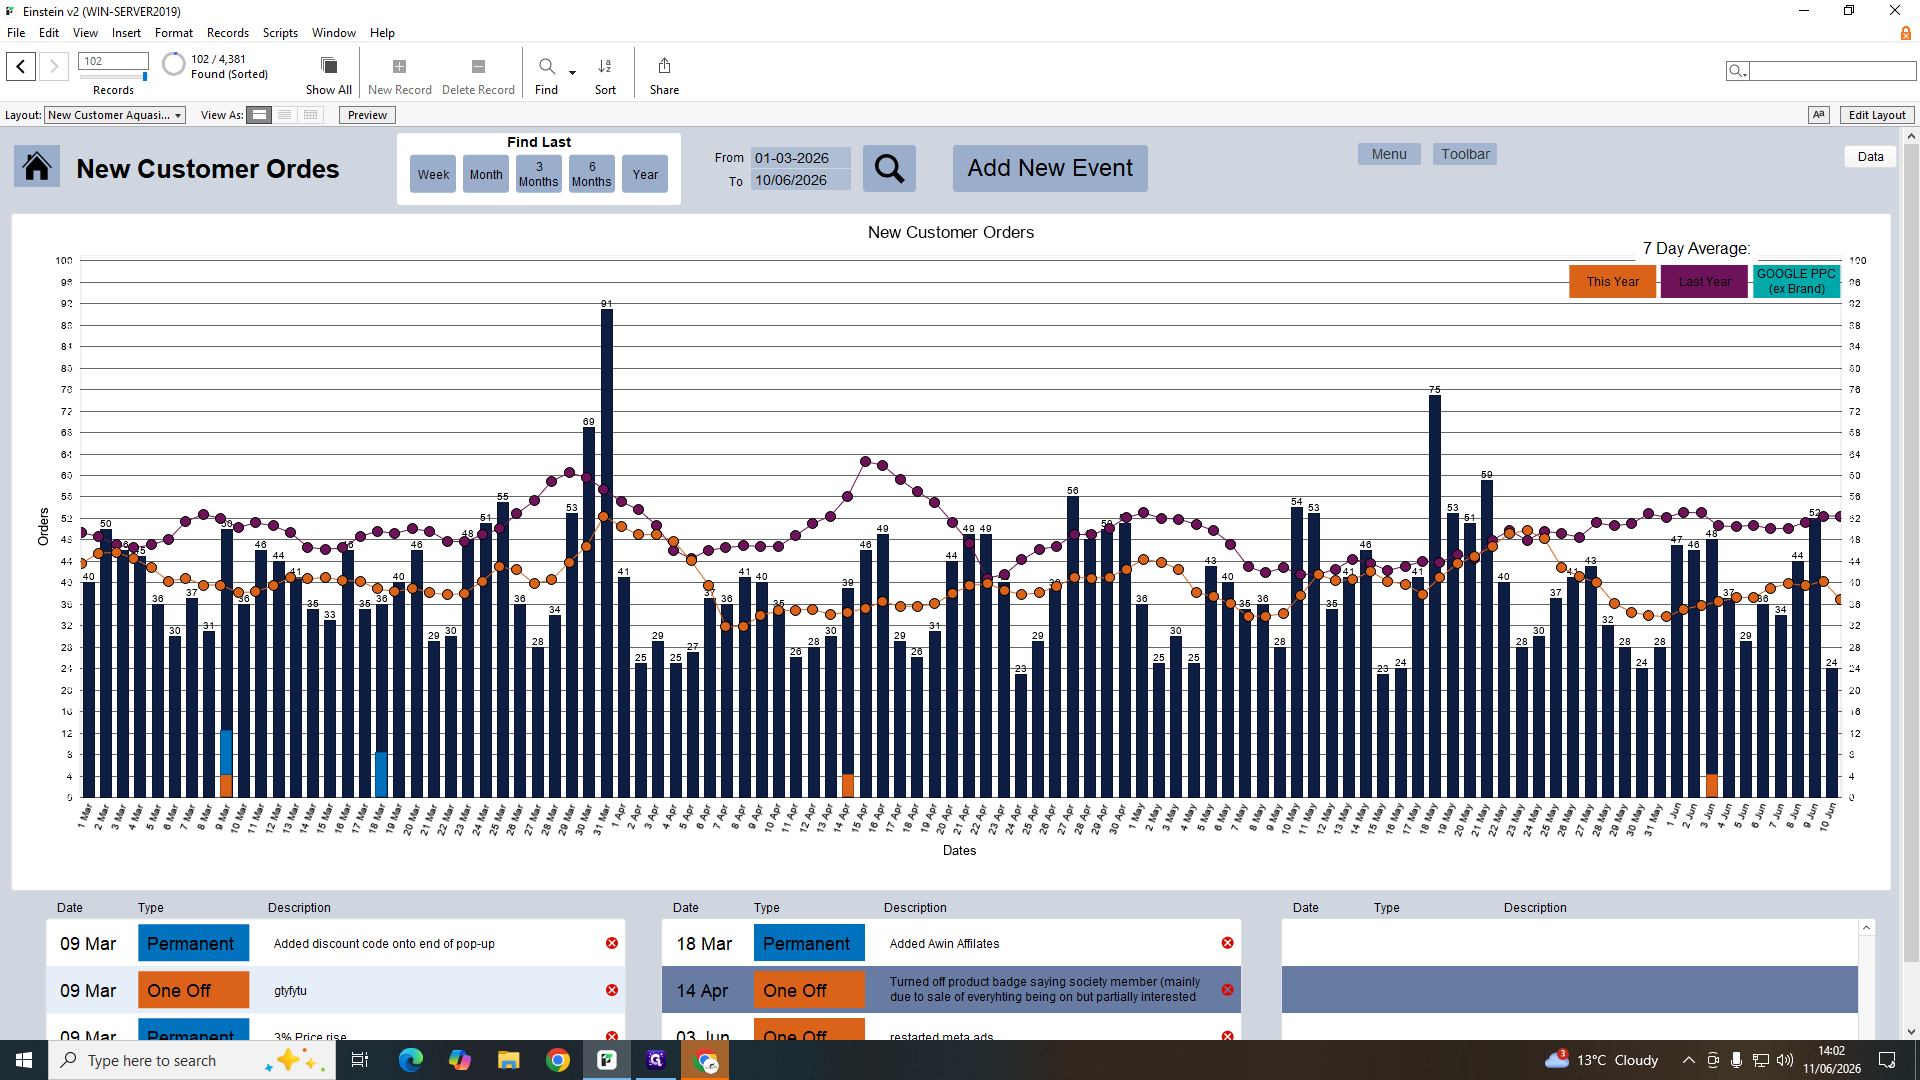
New Customer Graph | Year-over-year comparison of new customer acquisition | Assessing the impact of business events (like price changes) on growth. |
Daily Performance


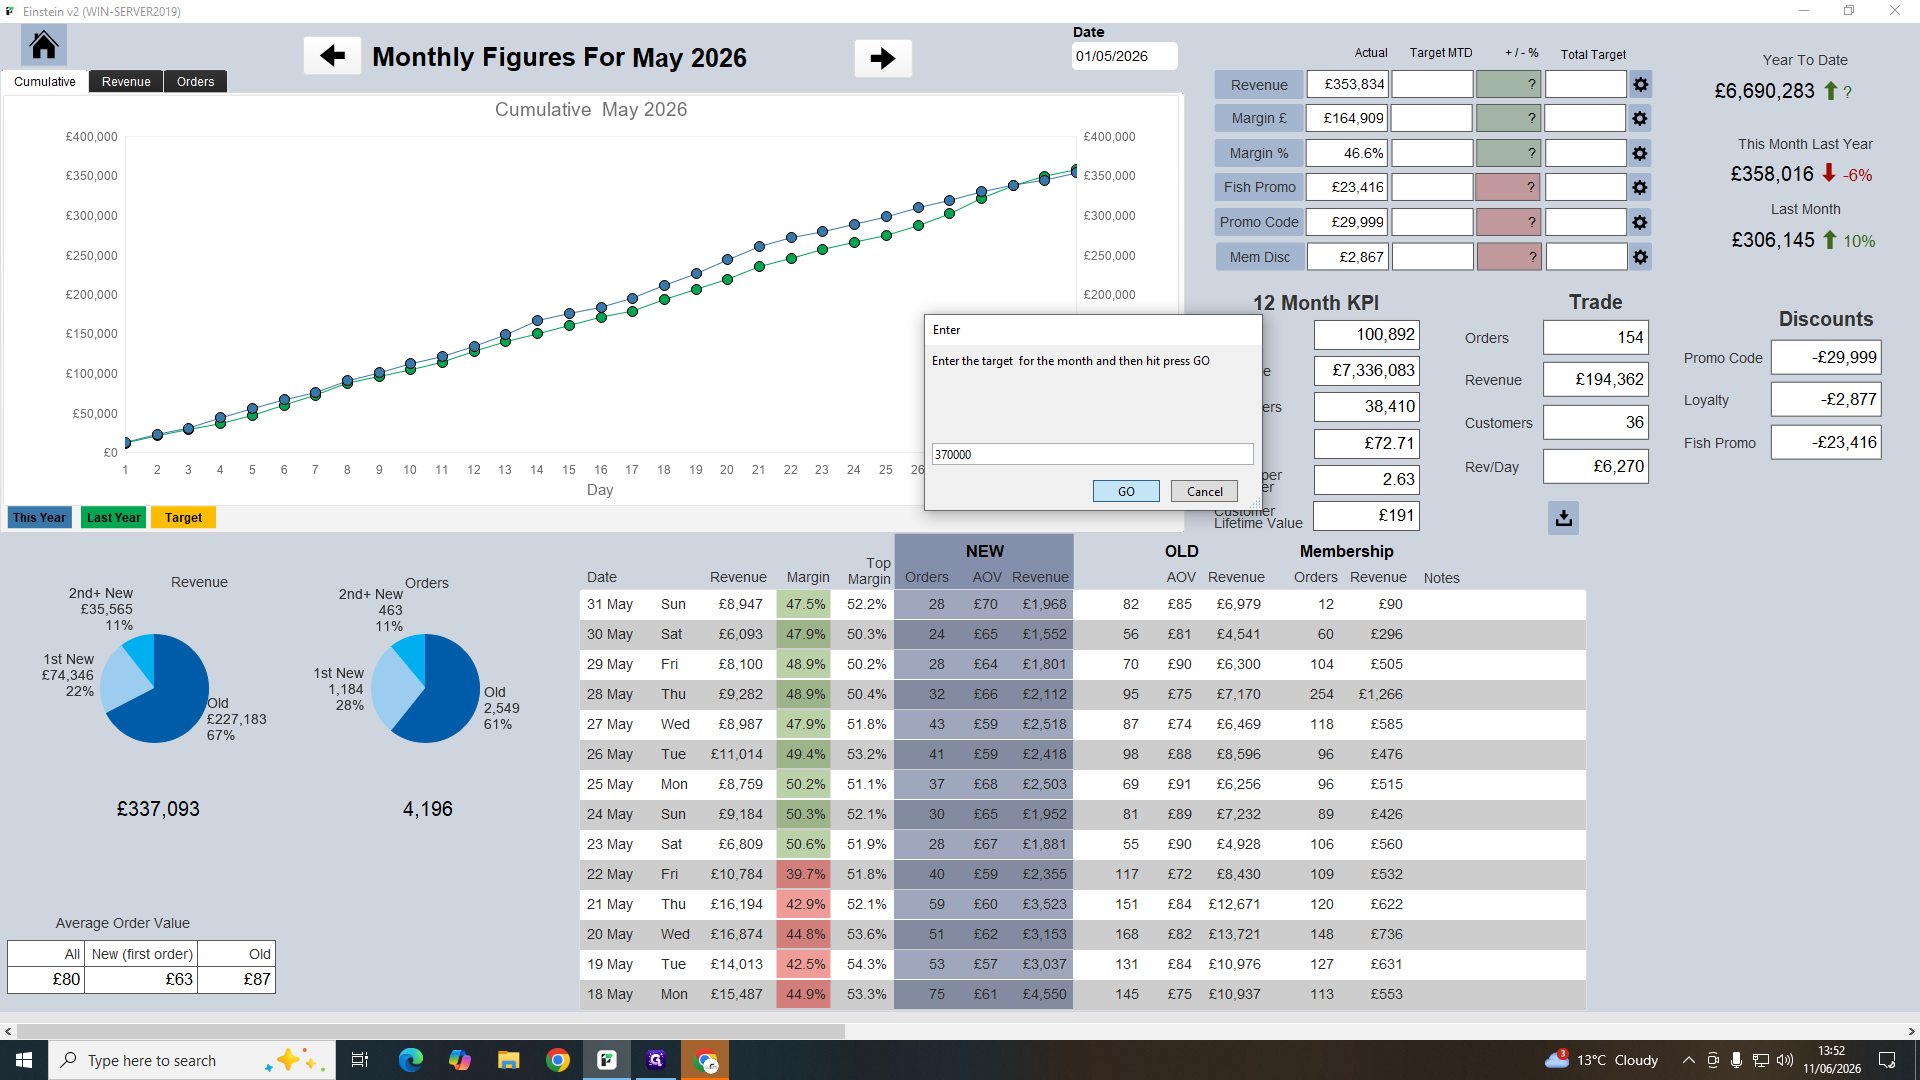
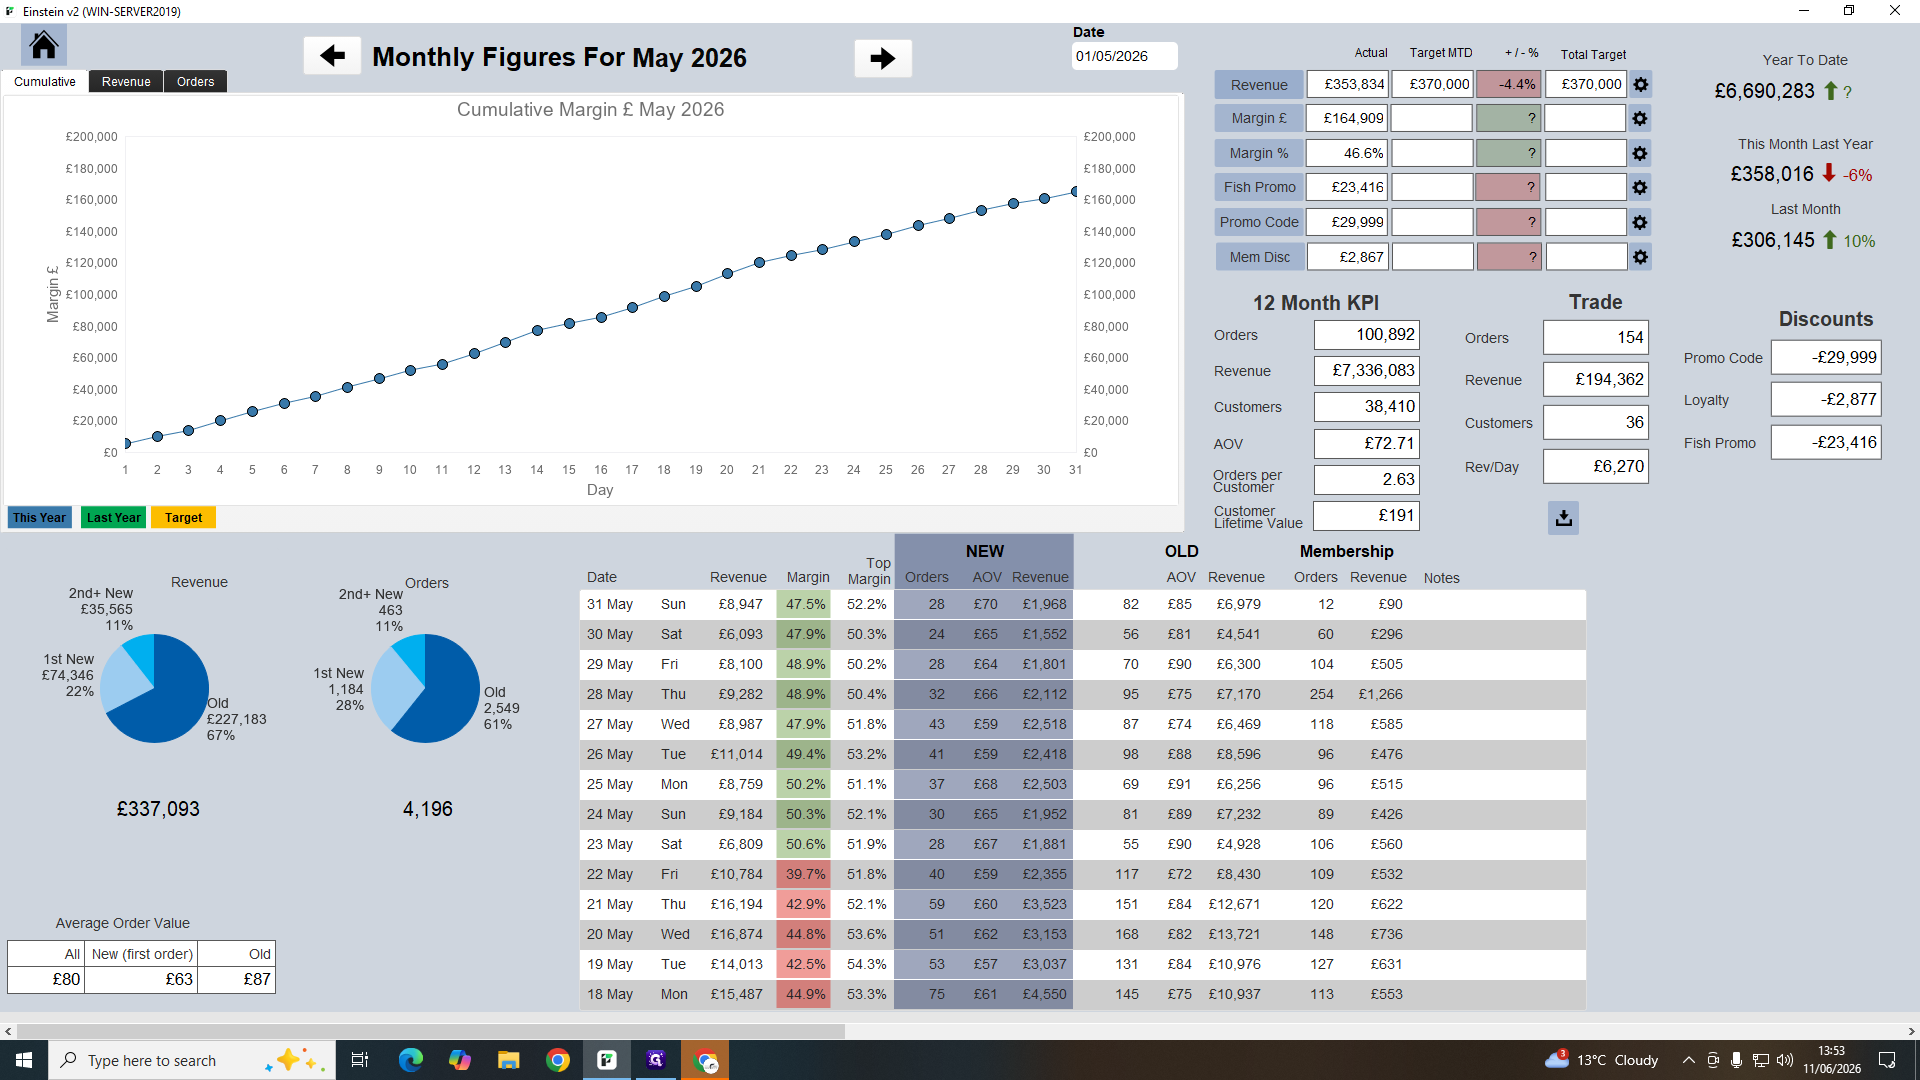
Margin Report v2
The Margin Report details your gross margins by deducting promotional costs from your income.

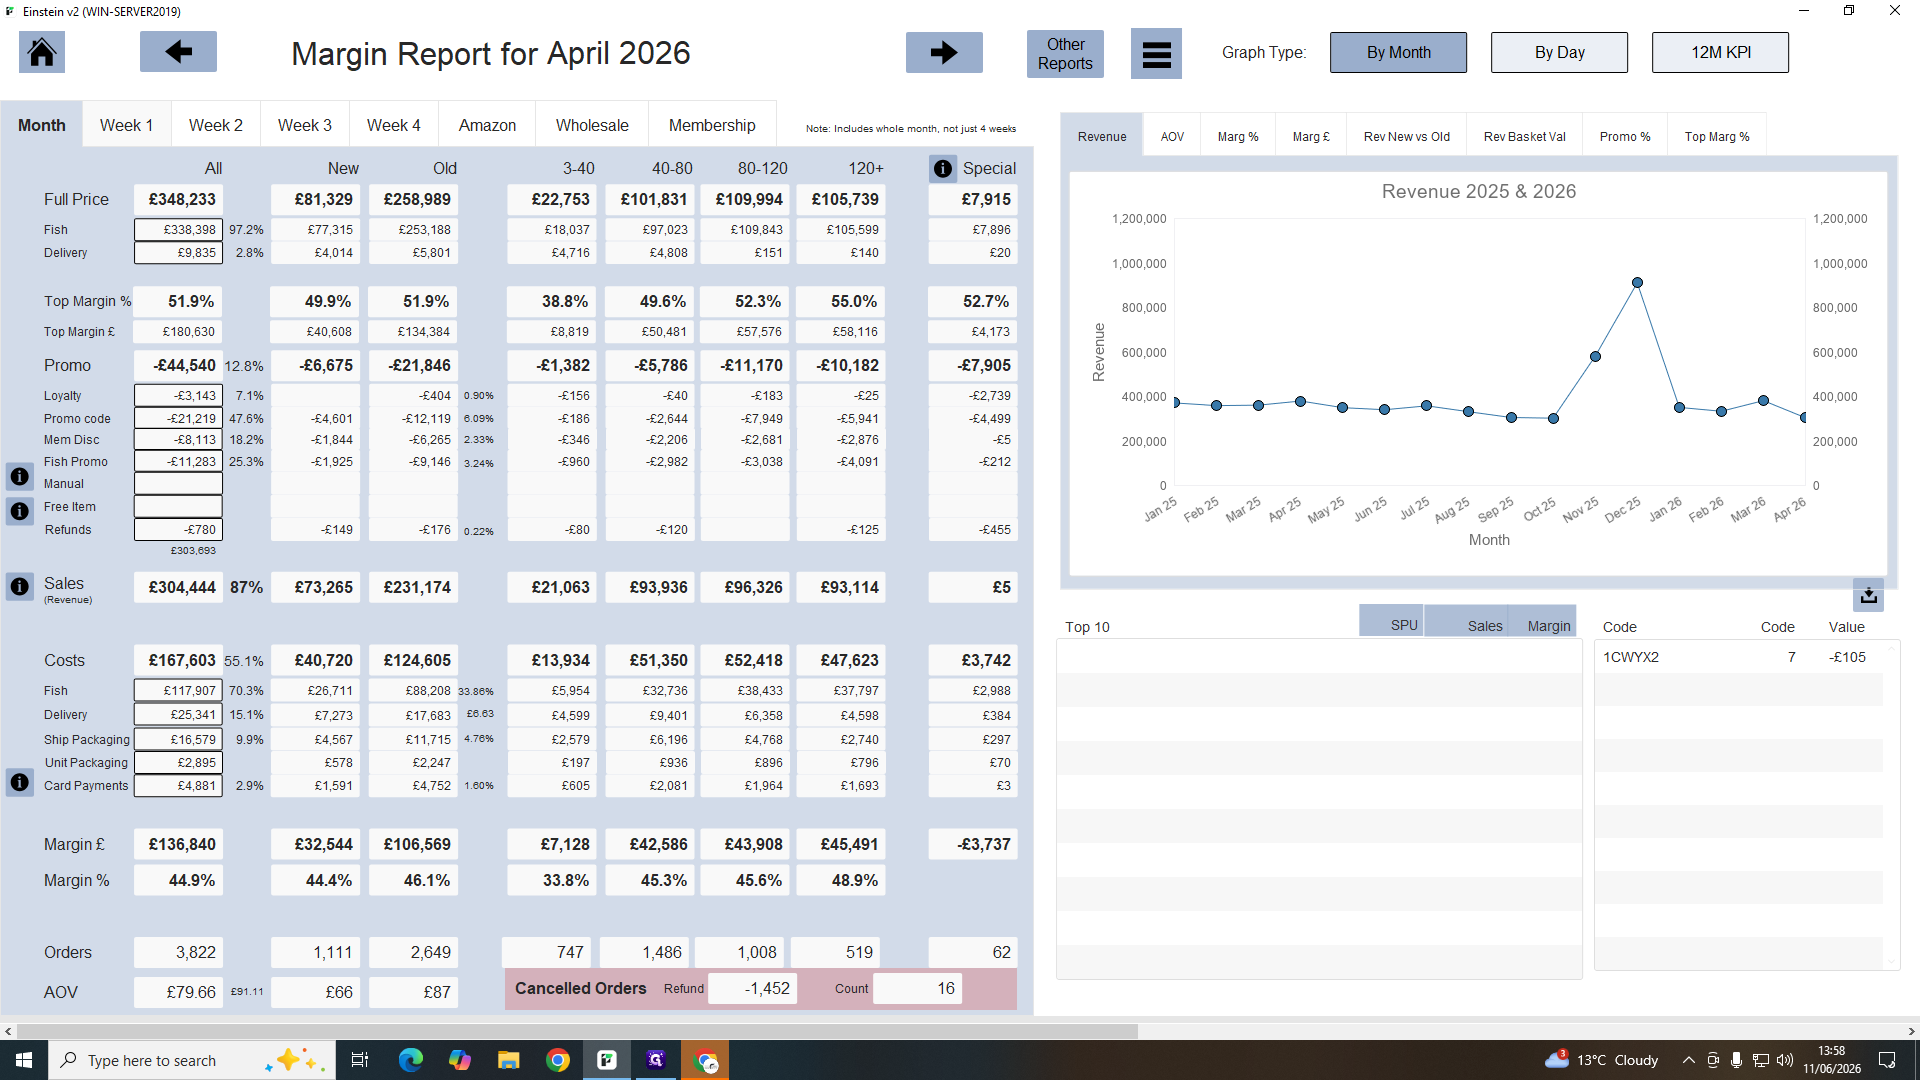

When reviewing discounts in the margin report, note the four main promotion streams:
Promo Type | Description |
|---|---|
Loyalty | General loyalty program discounts. |
Promo Codes | Discounts manually entered by customers at checkout. |
Membership | Exclusive discounts applied for active subscribers. |
Fish Promos | Direct product price reductions (e.g., 20% off an item). |
New Customer Graph

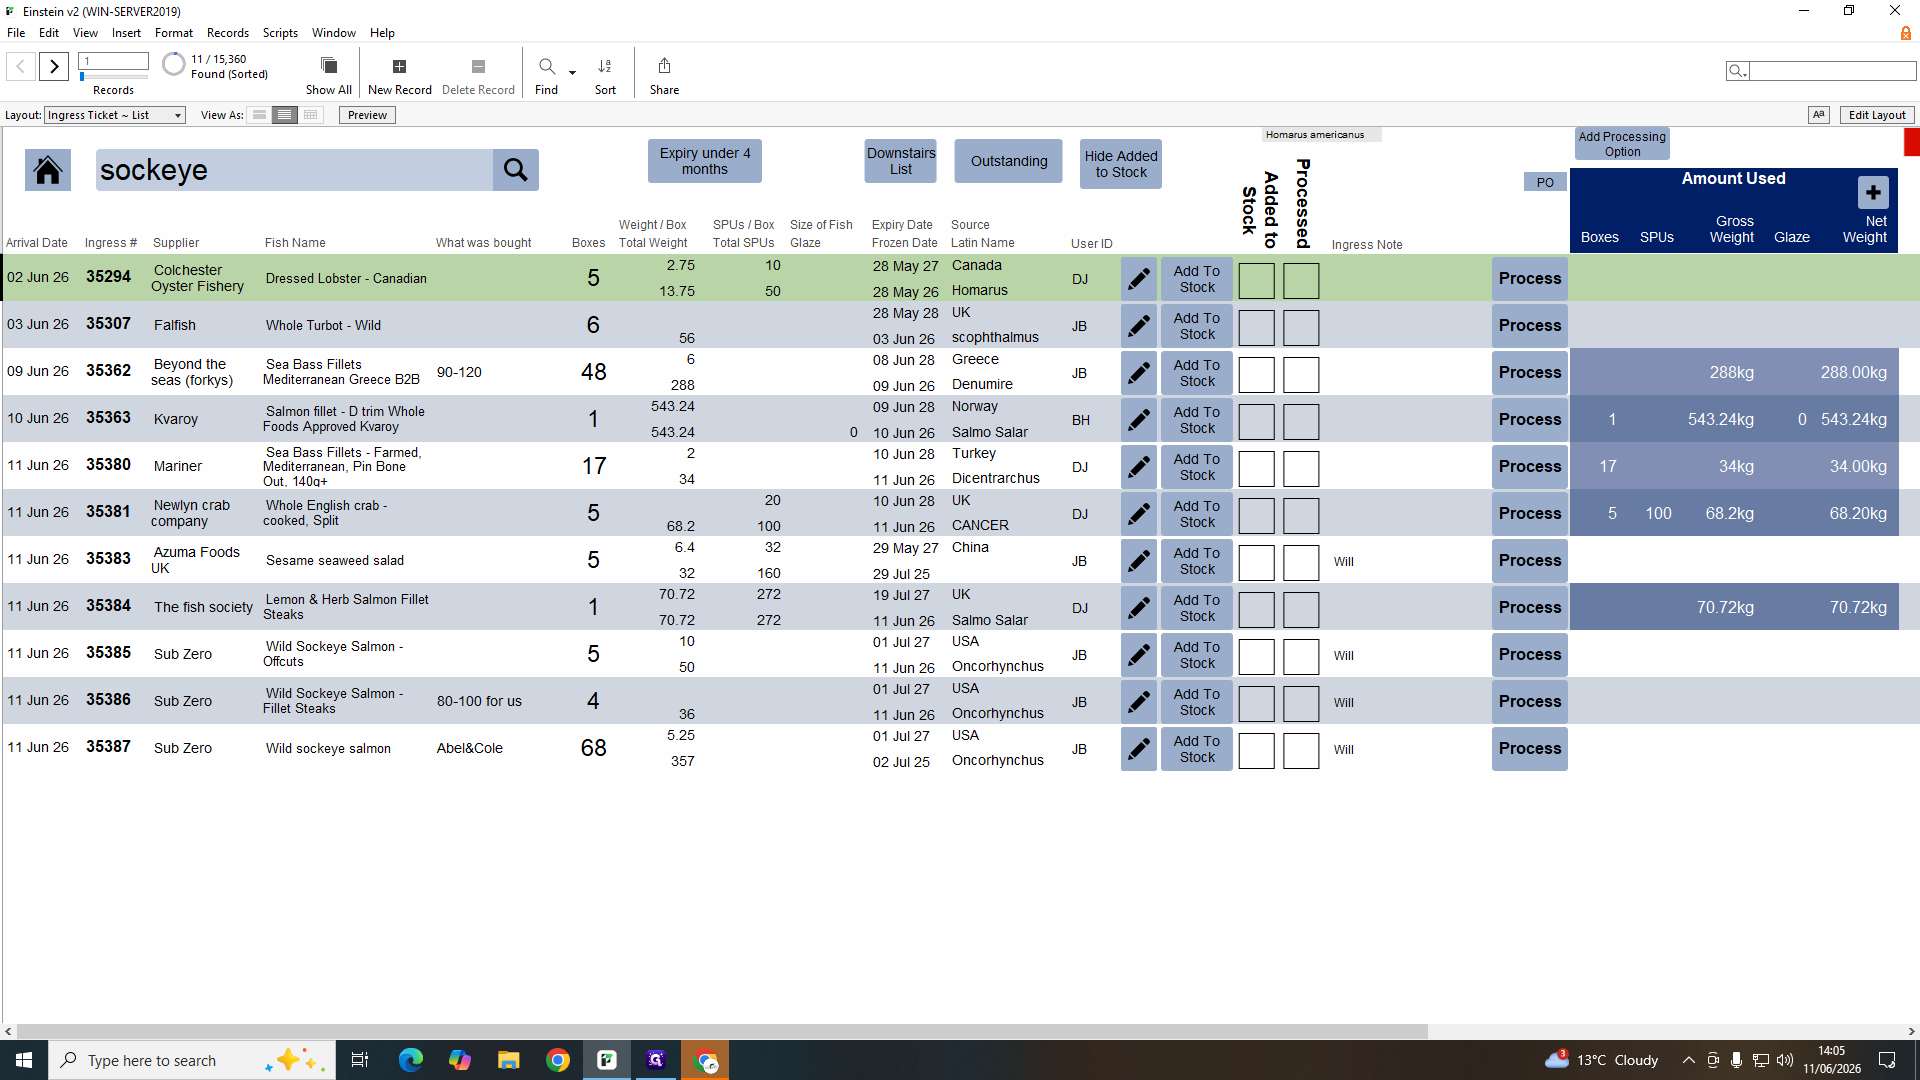
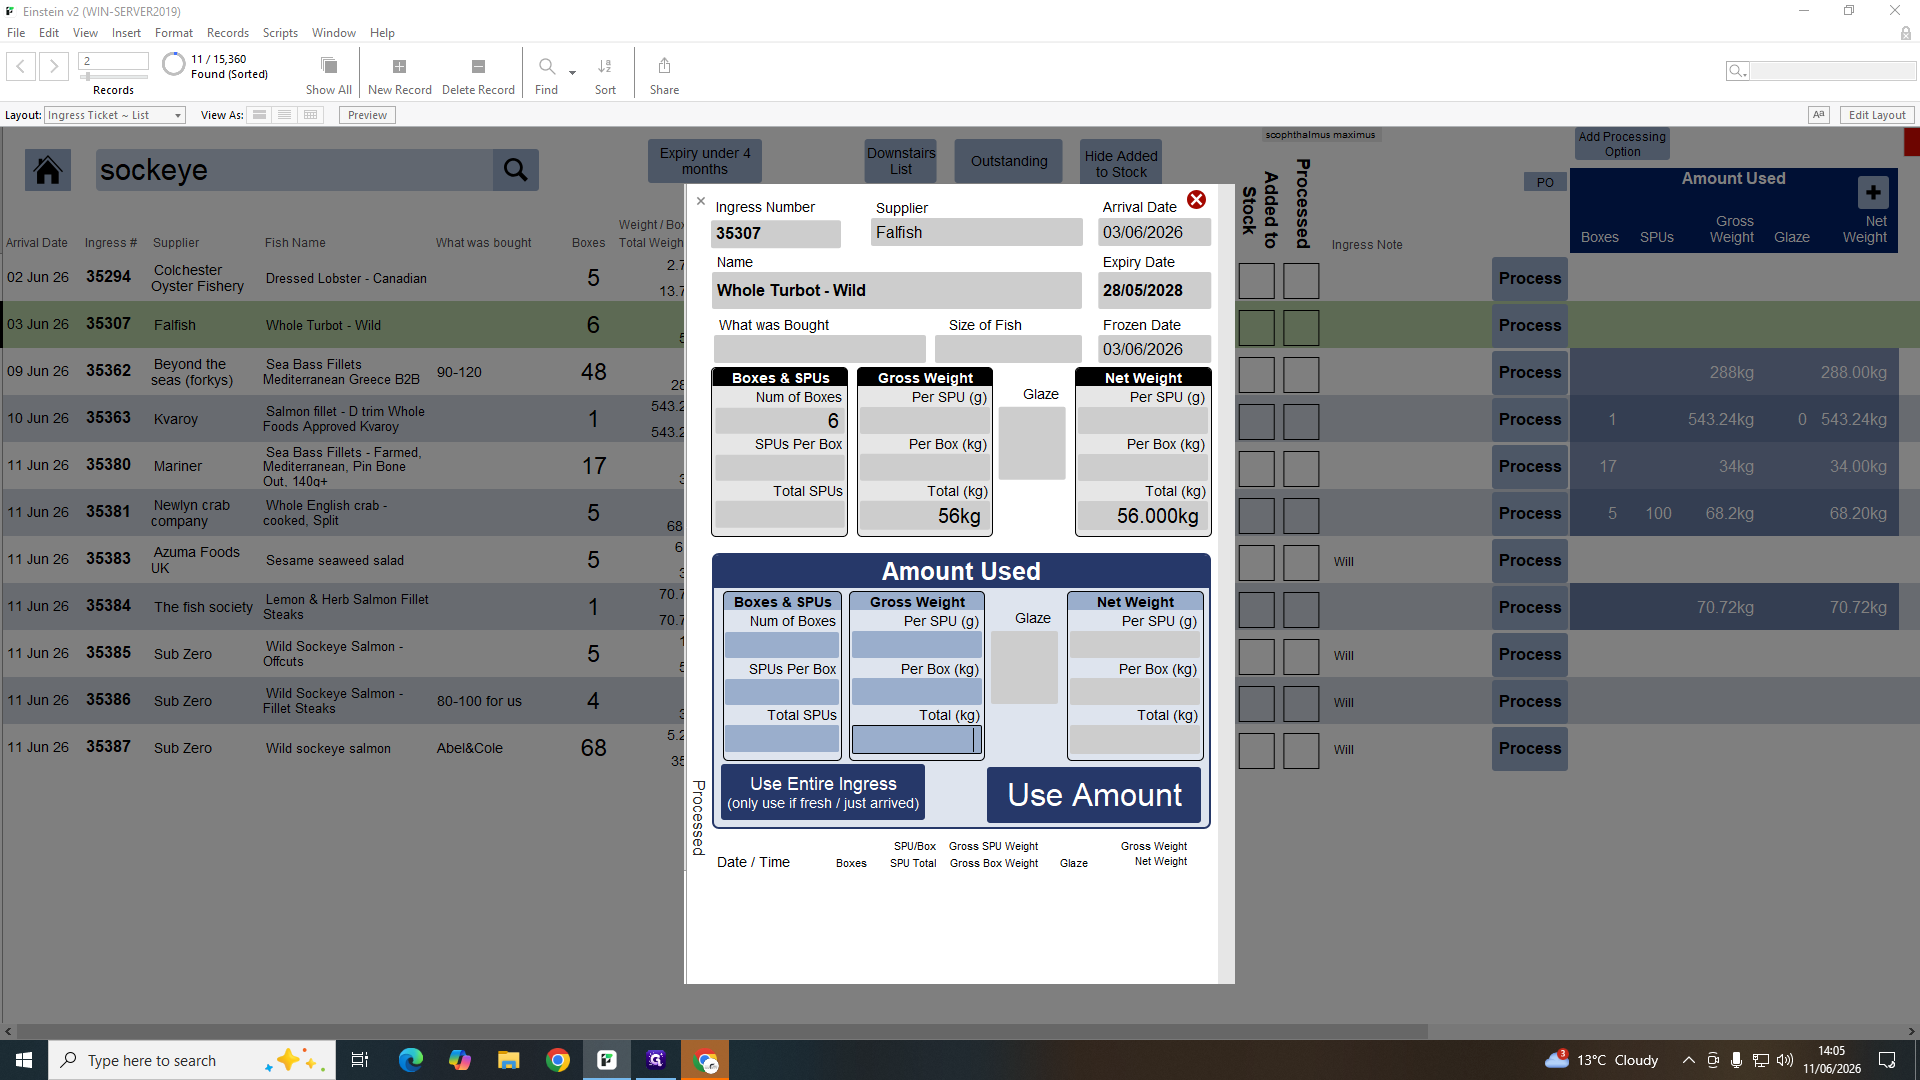
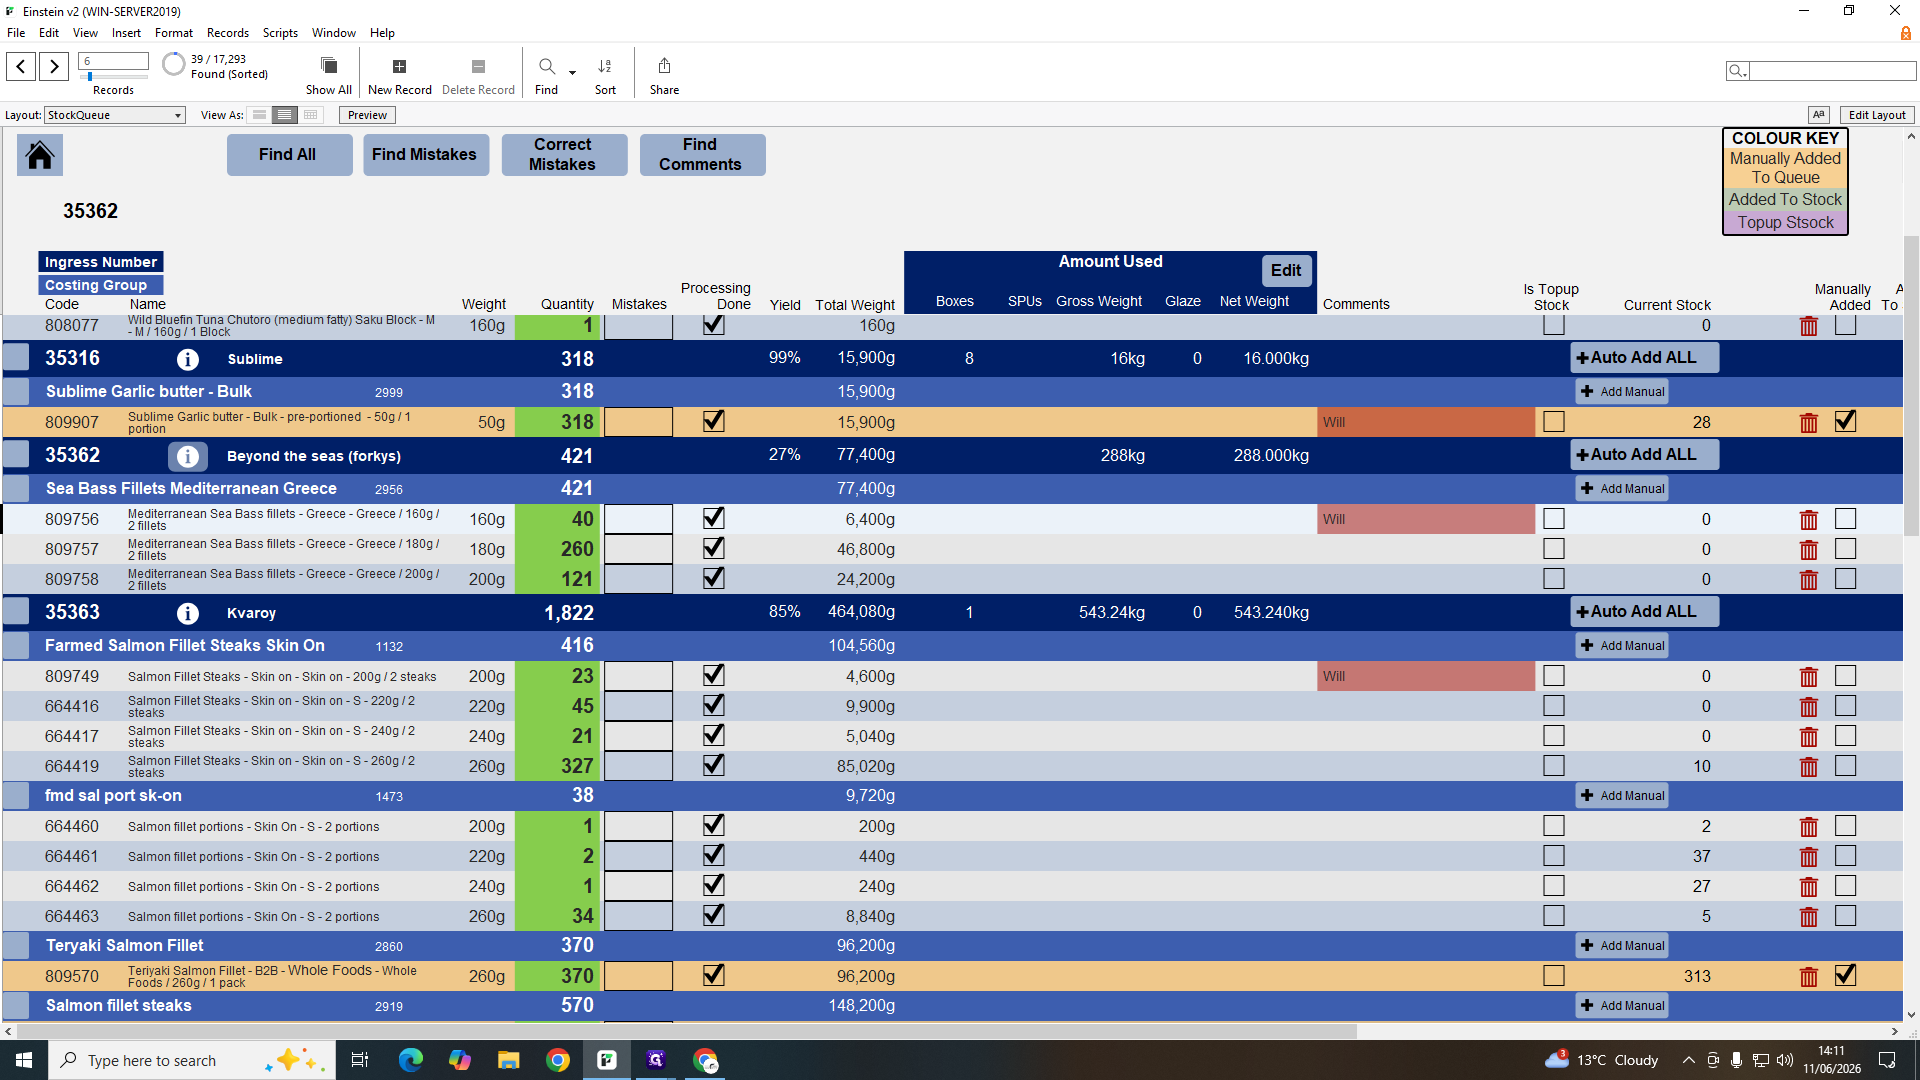
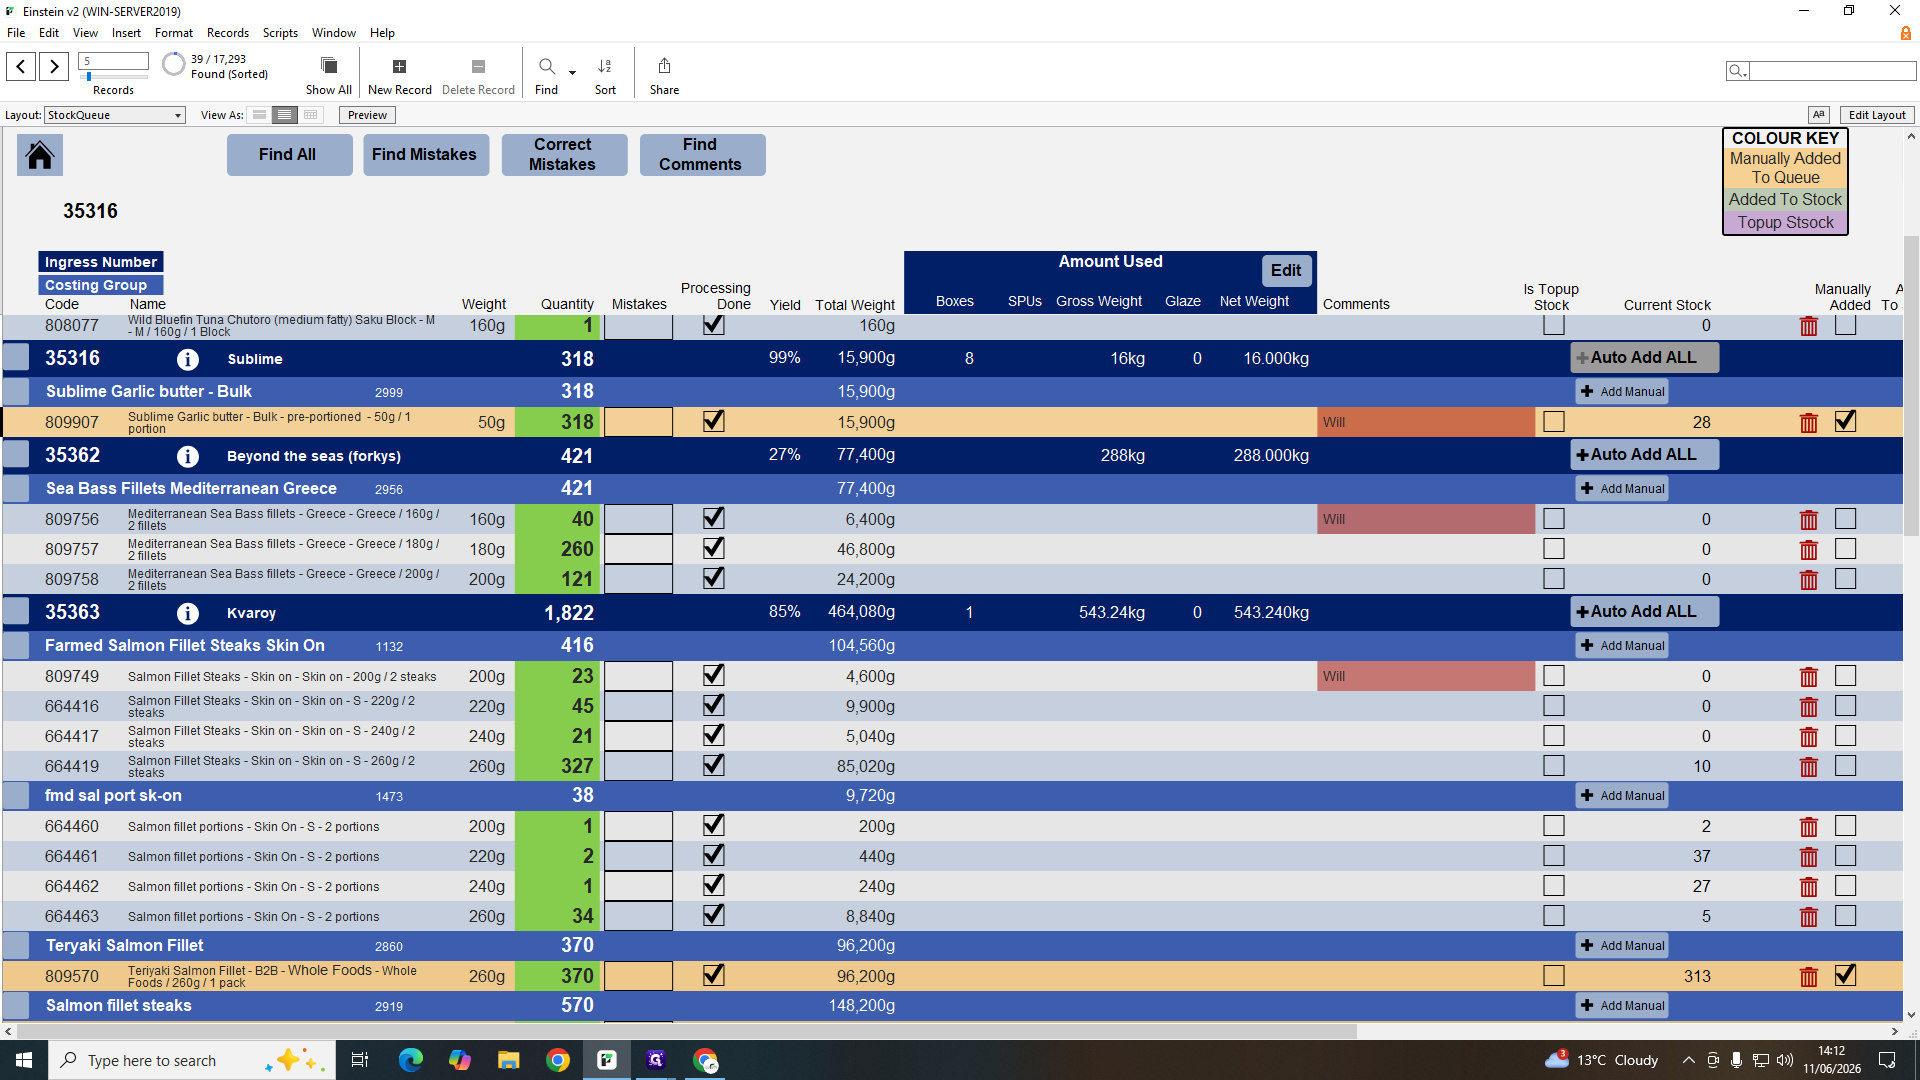
Managing the Stock Queue & Yields
When items are processed from raw material into individual inventory items, you must record their yield accurately to avoid stock discrepancies.


Q: Do tick boxes in the repack list automatically update the stock queue?
A: No, the repack list is separate. The stock queue updates automatically based on the labels you print, not the repack list checkboxes.
Q: What benefits do members get from membership offers?
A: Members receive exclusive product discounts and a free delivery upgrade, such as next-day delivery by noon, which normally costs £5.
Q: Why are some items in "Clear Offers" lacking a visible discount percentage?
A: Occasionally, the software may fail to load or display the discount percentage correctly, but the item is still actively on offer.
Q: What triggers a red flag on the daily performance margin?
A: The system flags margins in red if they drop below the target threshold (e.g., 45%), indicating that the business missed its margin goal for that day.
Q: How do I handle stock queue items with a yield lower than 50%?
A: Query the amount with the processing team and do not add it to stock until verified. Less than 50% yield typically indicates an incorrect manual weight entry.
Term | Definition |
|---|---|
Repack List | A queue displaying bulk products that need to be packaged into individual units. |
Stock Queue | The list of inventory waiting to be formally added to active stock after processing. |
Clear Offers | The interface used to manage, remove, or bulk-clear promotional discounts on products. |
Processing Ticket | A digital record of the tasks and quantities completed during inventory packaging in the processing room. |
Yield | The percentage of usable product retained after processing raw materials. |
Top Margin | The theoretical gross margin calculated as if all items were sold at full price without discounts. |
AOV | Average Order Value, representing the average amount of money spent by a customer per transaction. |