Icon

Power BI Sales Report: Step-by-Step Guide

Learn how to access, filter, and download data from Power BI reports. This guide covers exporting data by time period, customer accounts, invoice, and product level, with step-by-step instructions for export and data review.

By CWI Lighting Inc

In this guide, we'll learn how to access and download information from a Power BI report. You will see how to use filters and visuals to view data by time period, customer accounts, invoices, and product level. We will also cover how to export this data in different formats for further analysis.

Let's get started

2
The first row displays all the slicers/filters, allowing us to select options as needed. Second, these four visuals show information by time period, customer accounts, invoices, and product level.
Step #2: The first row displays all the slicers/filters, allowing us to select options as needed. Second, these four visuals show information by time period, customer accounts, invoices, and product level.

3
Let's look at an example. Select year or month from Date slicer
Step #3:  Let's look at an example. Select year or month from Date slicer

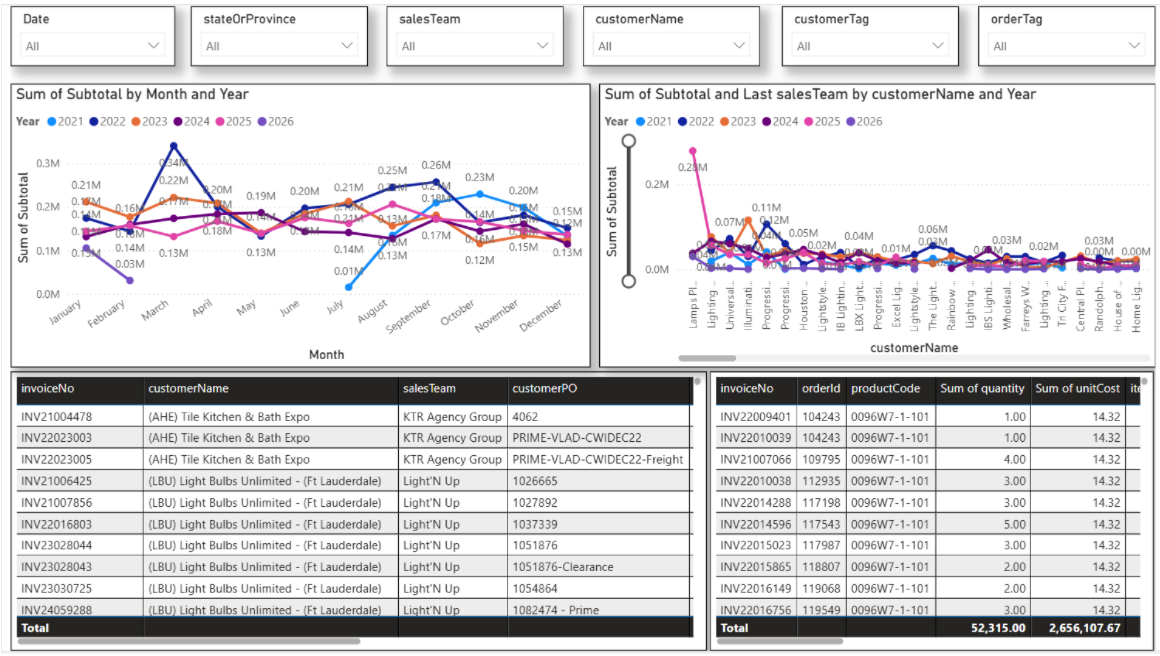
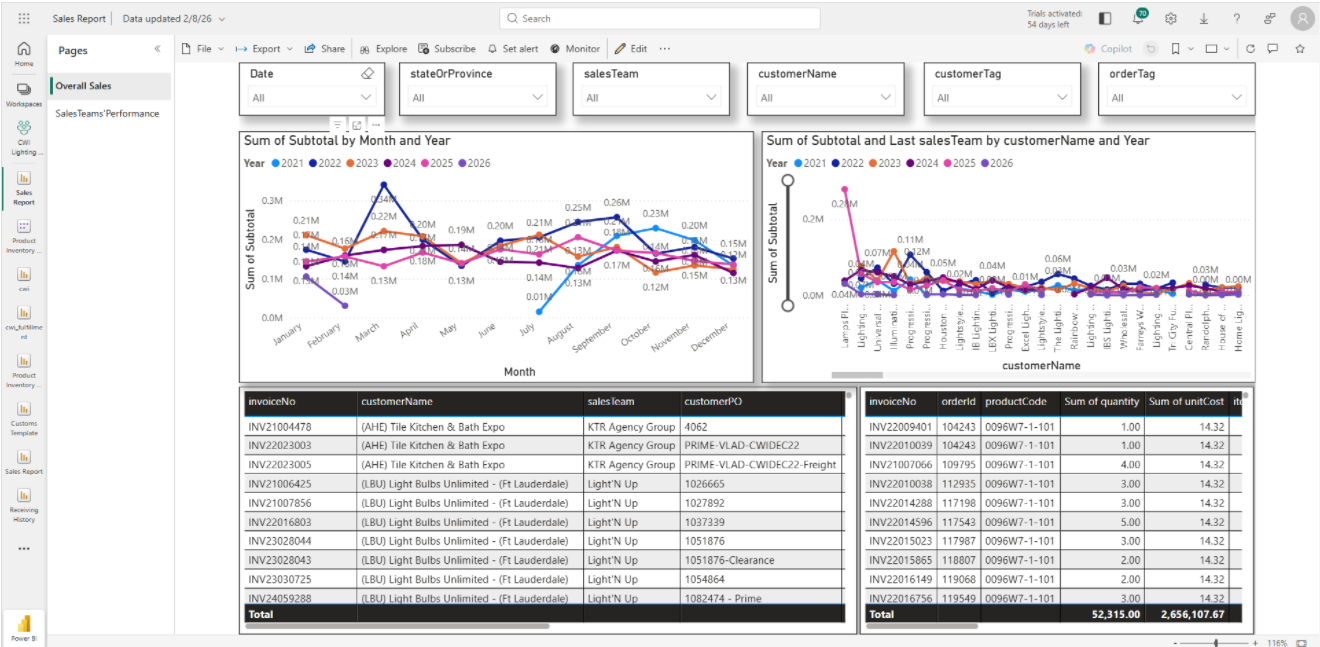
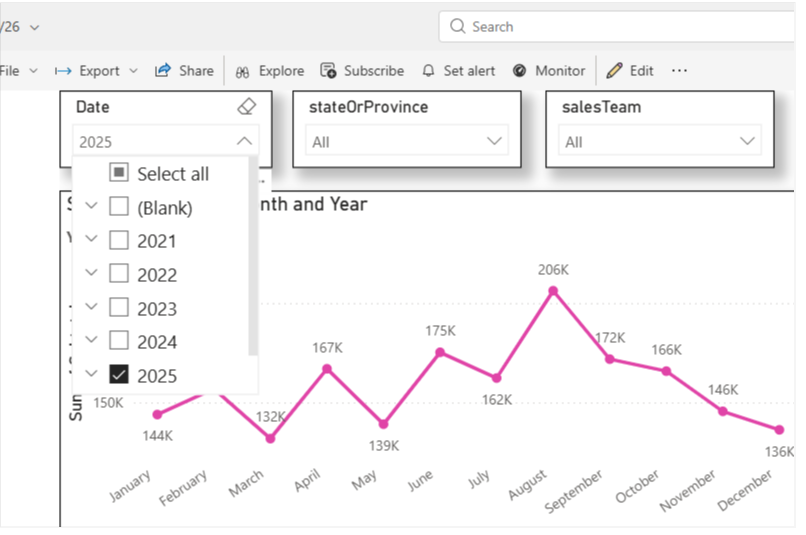
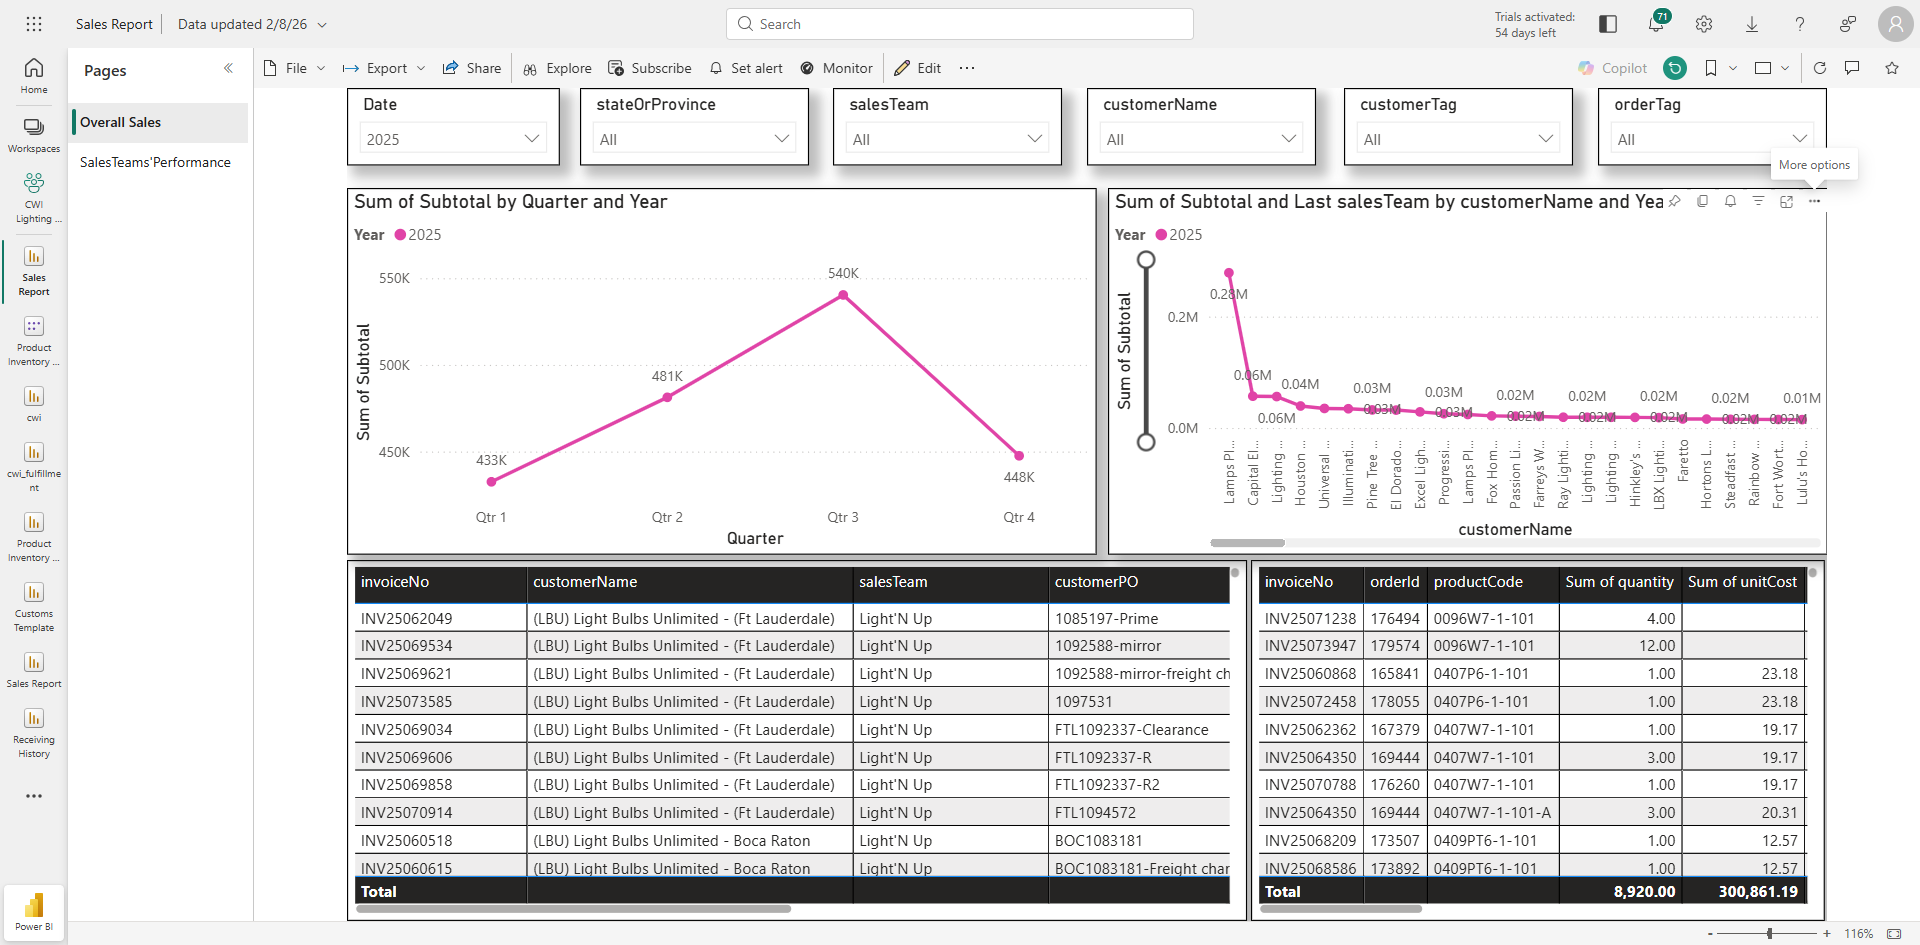
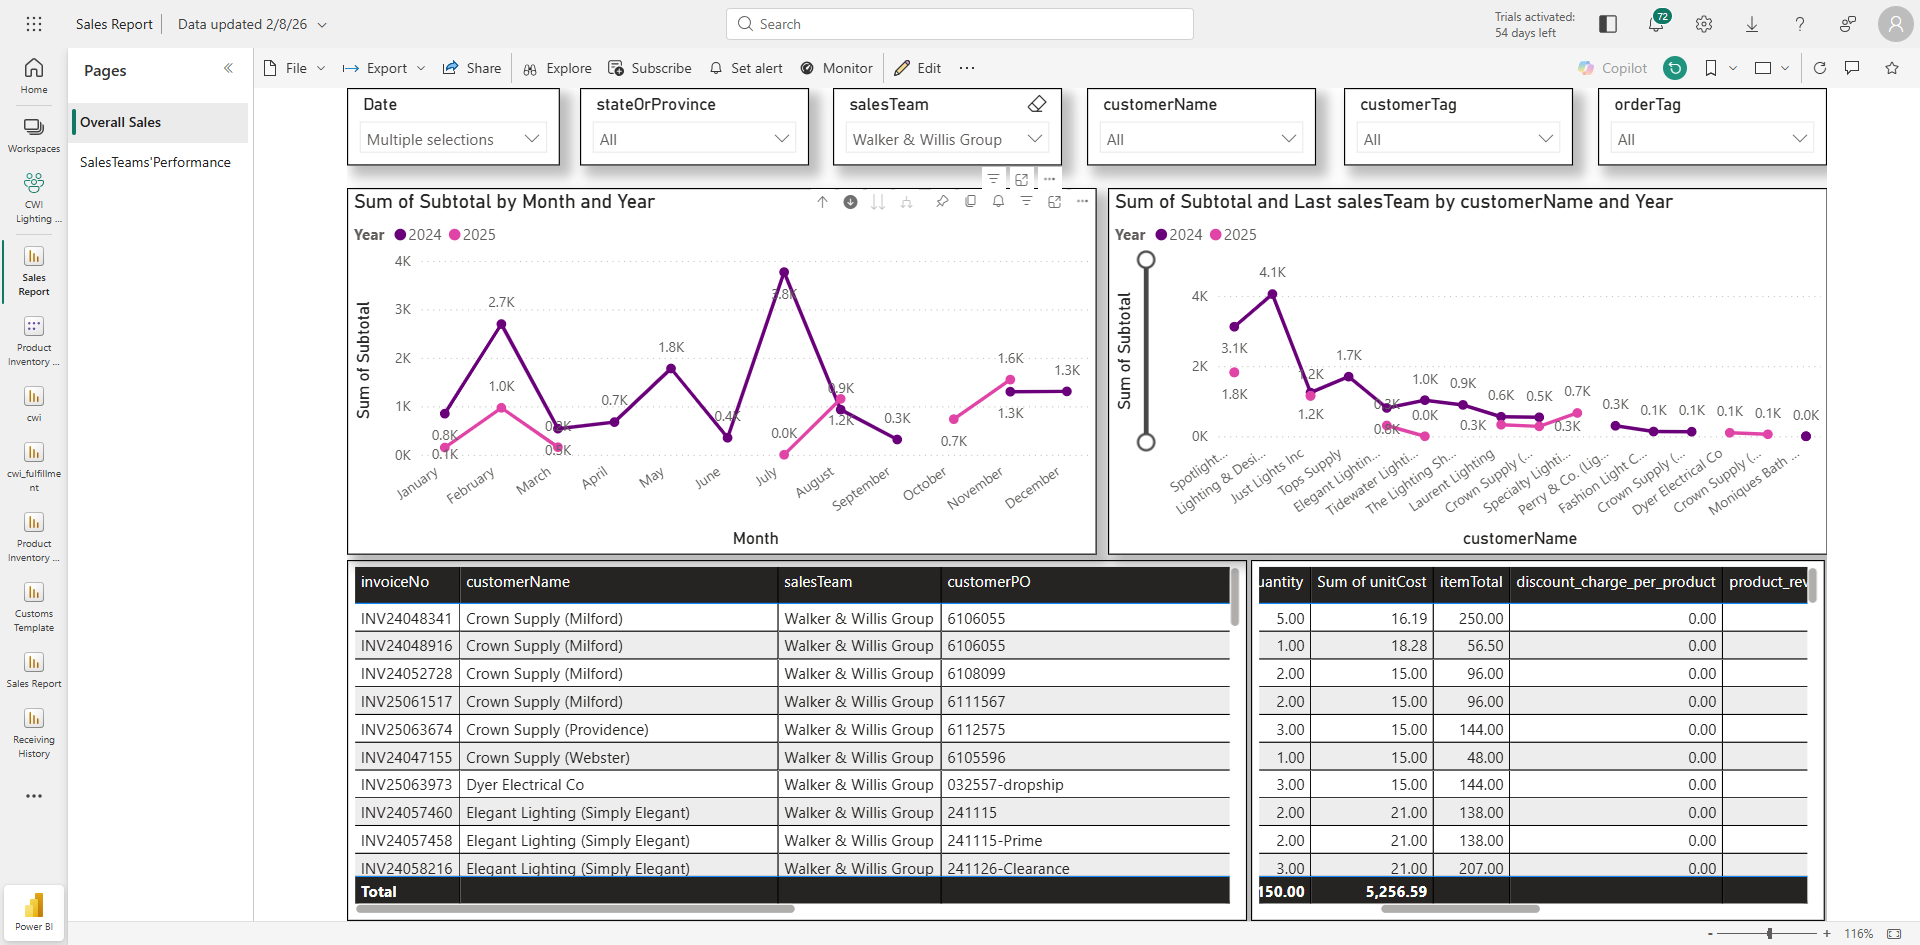
The first visual displays my month-on-month sales revenue for 2025.

4
Let's look at 2025.
Step #4: Let's look at 2025.

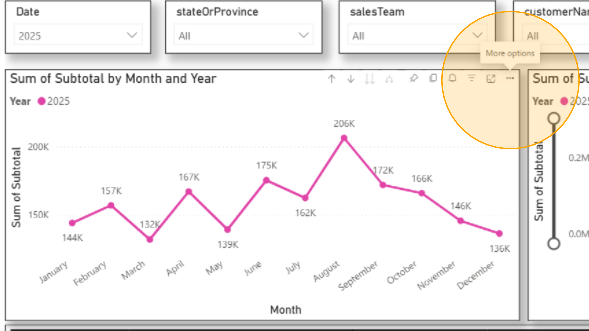
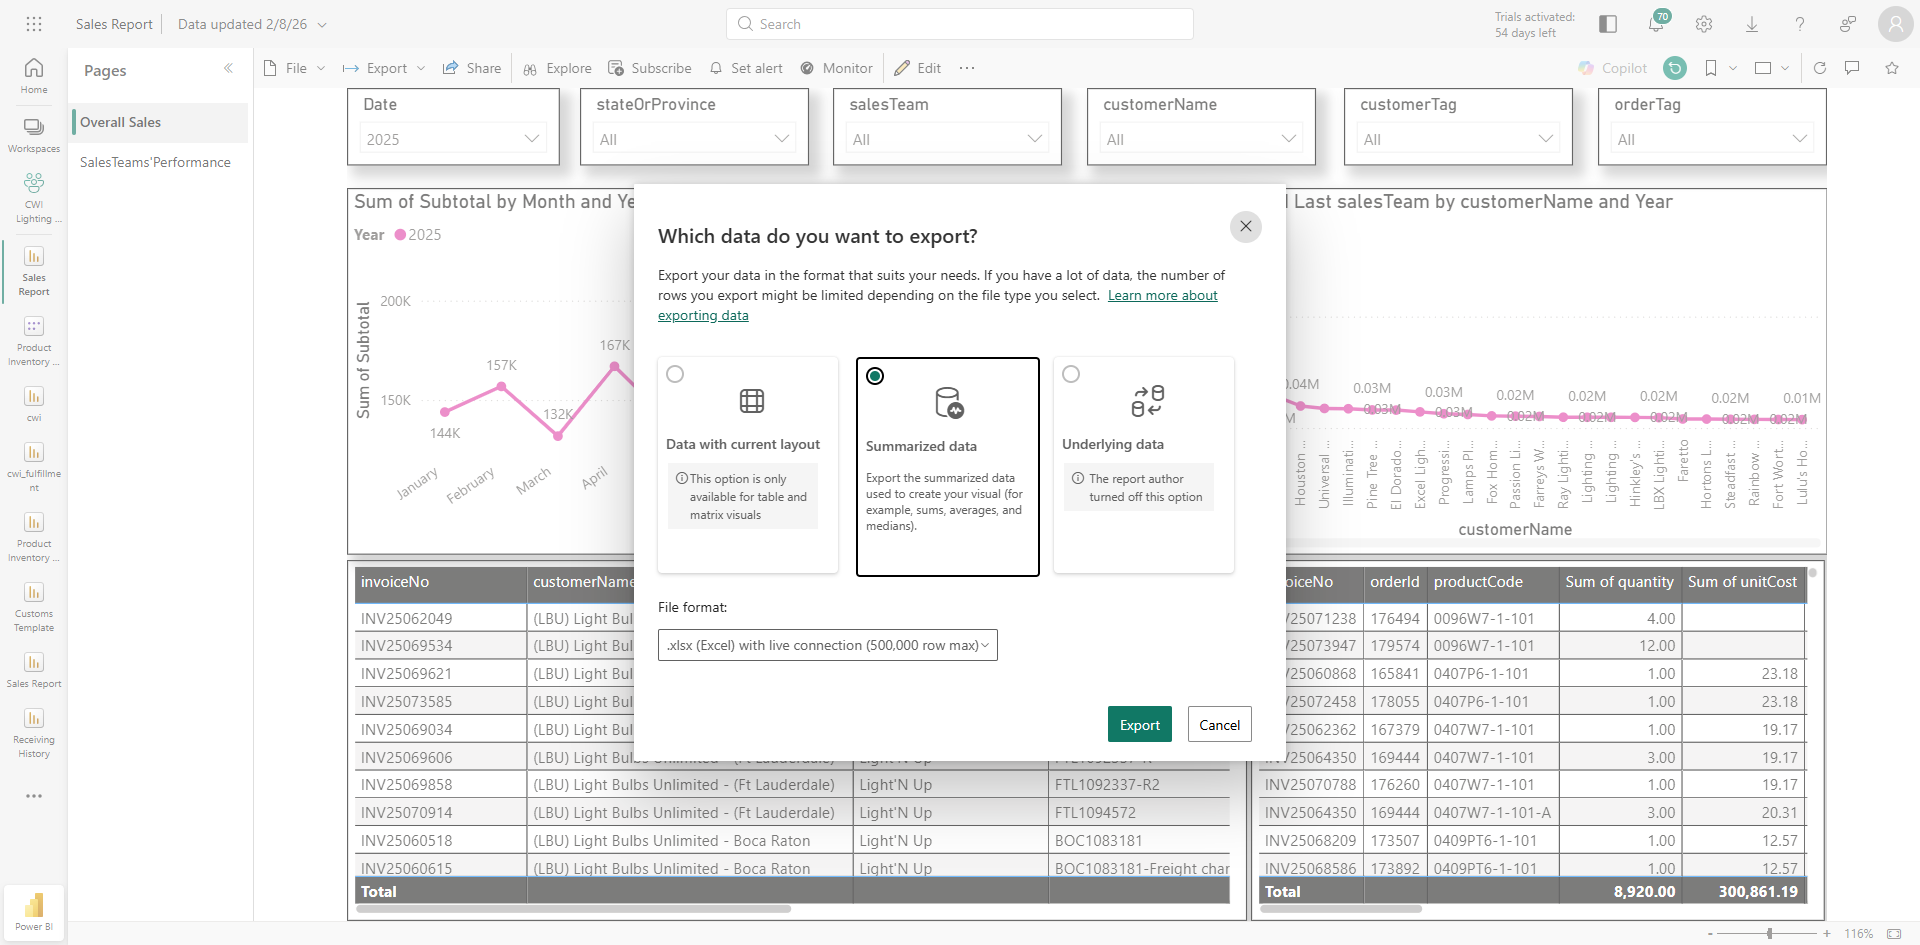
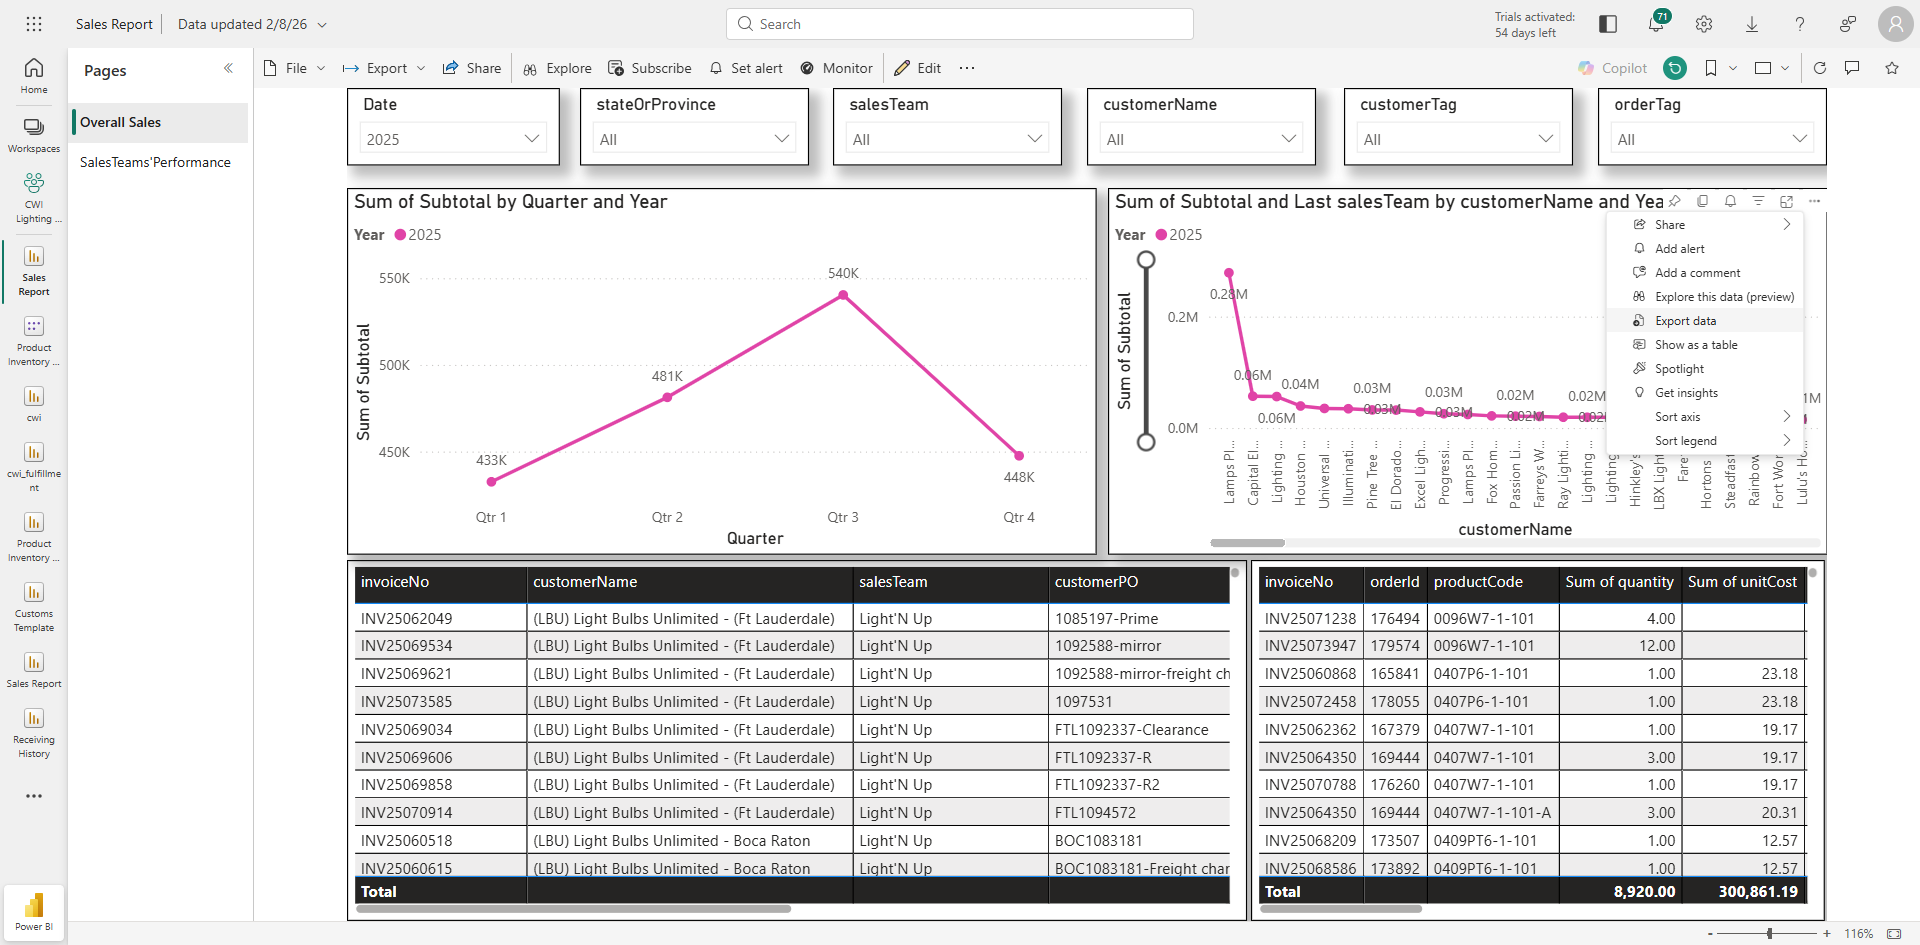
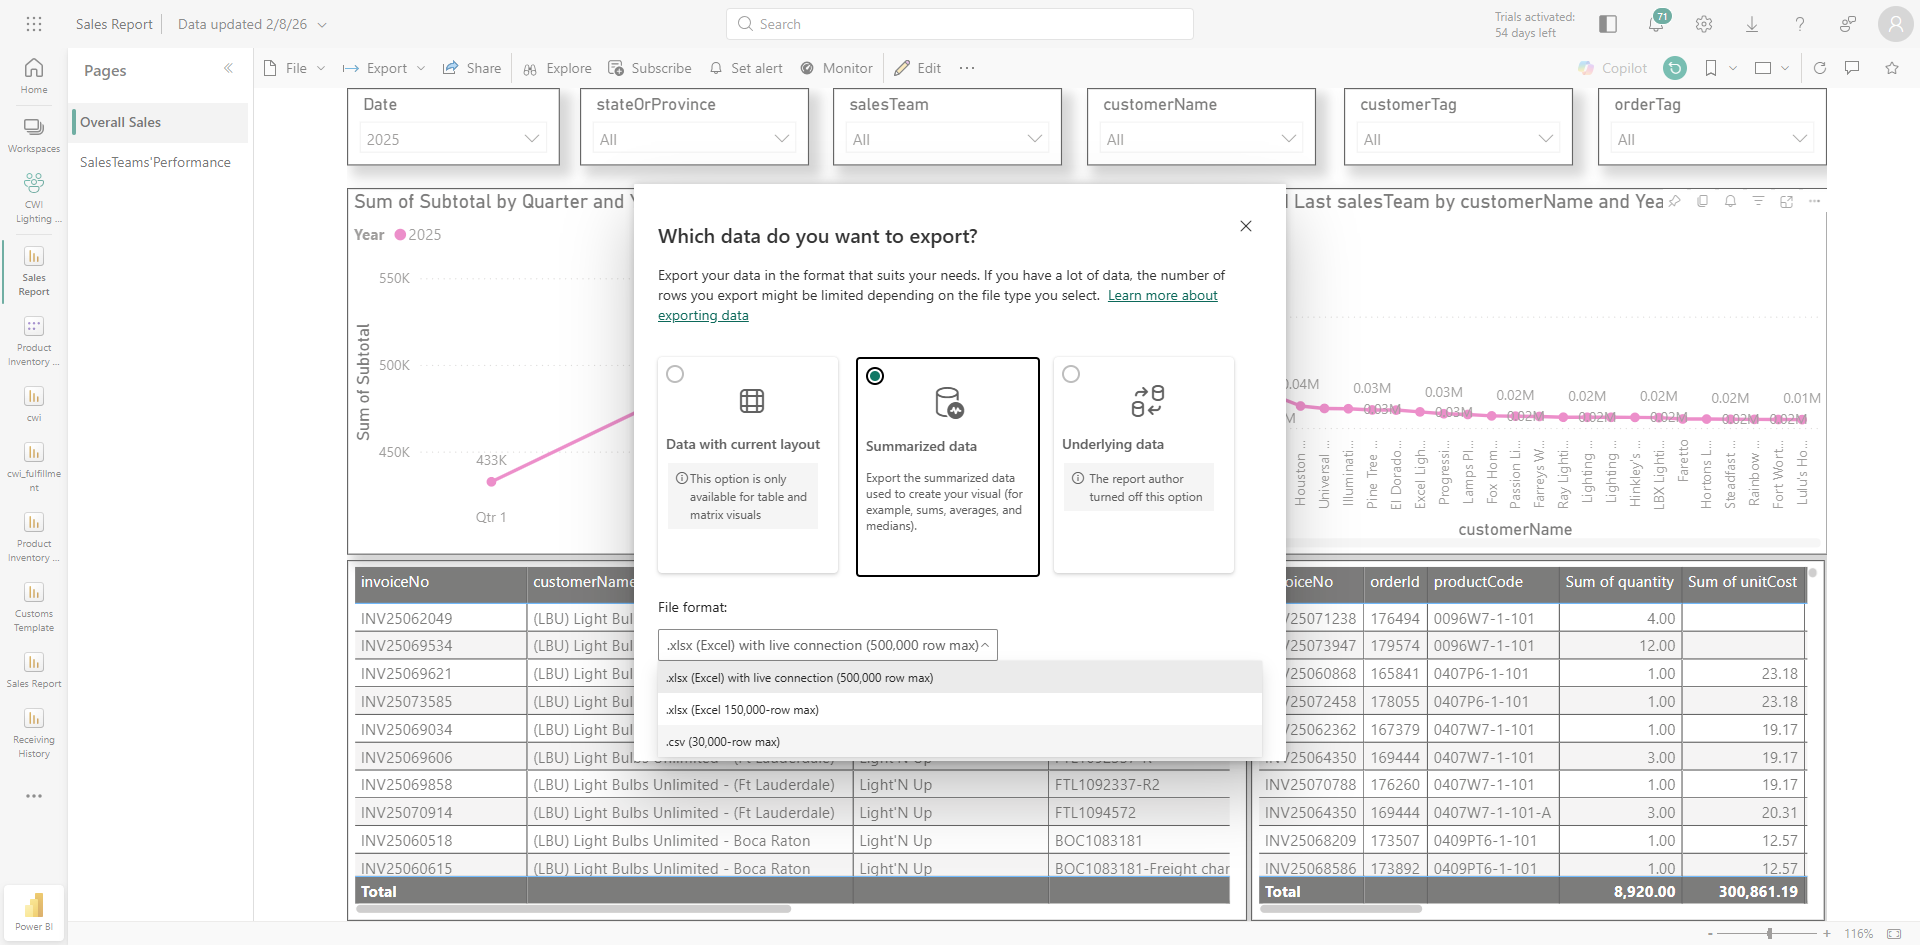
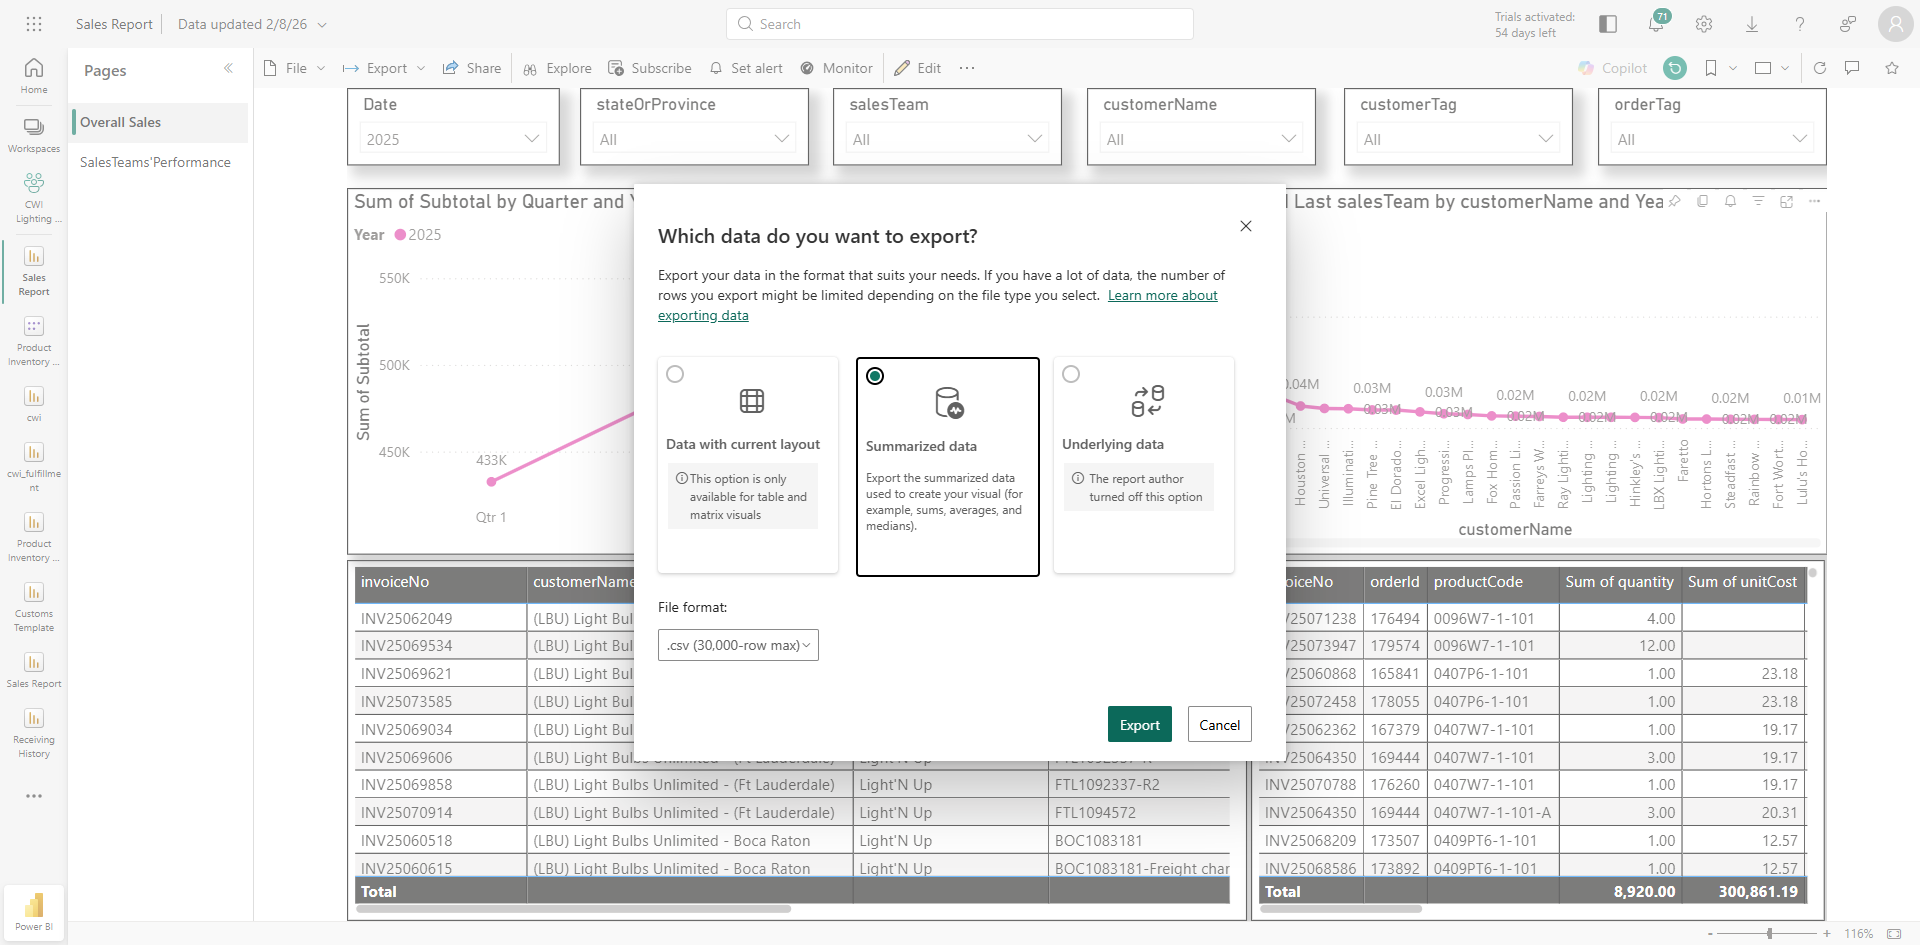
To download the current visual/chart.
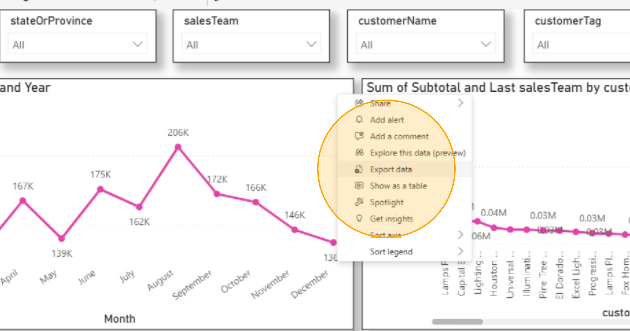
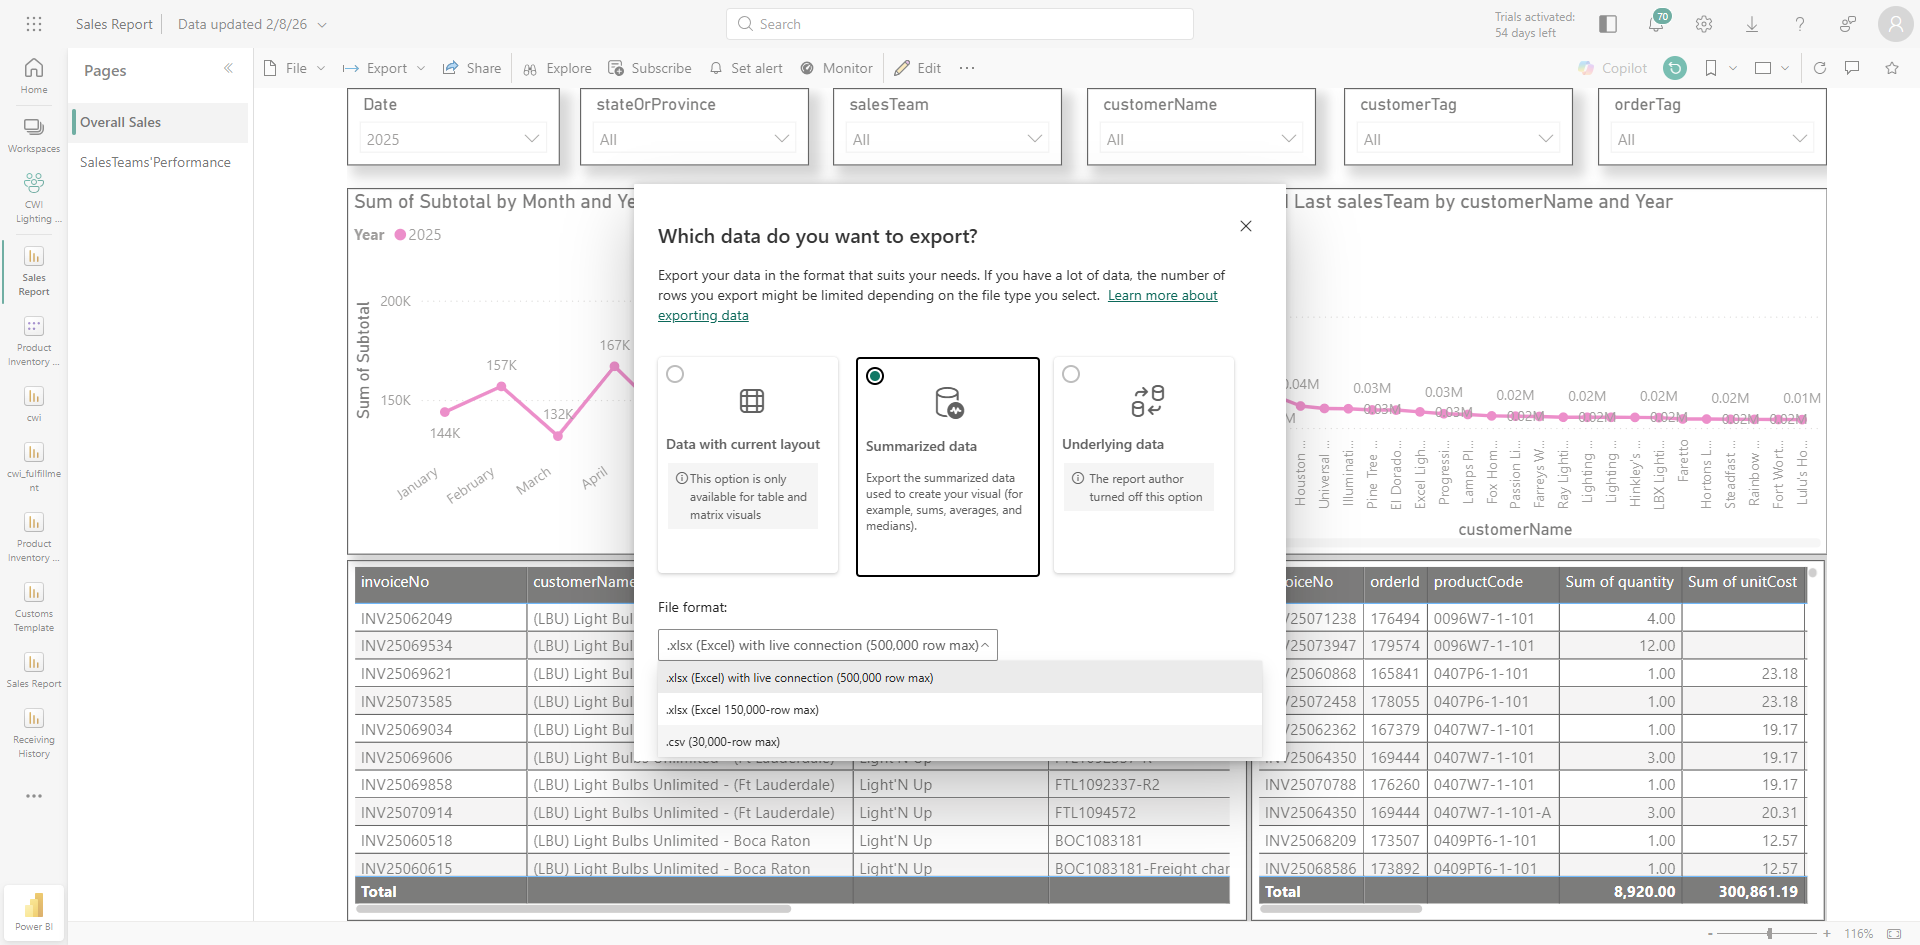
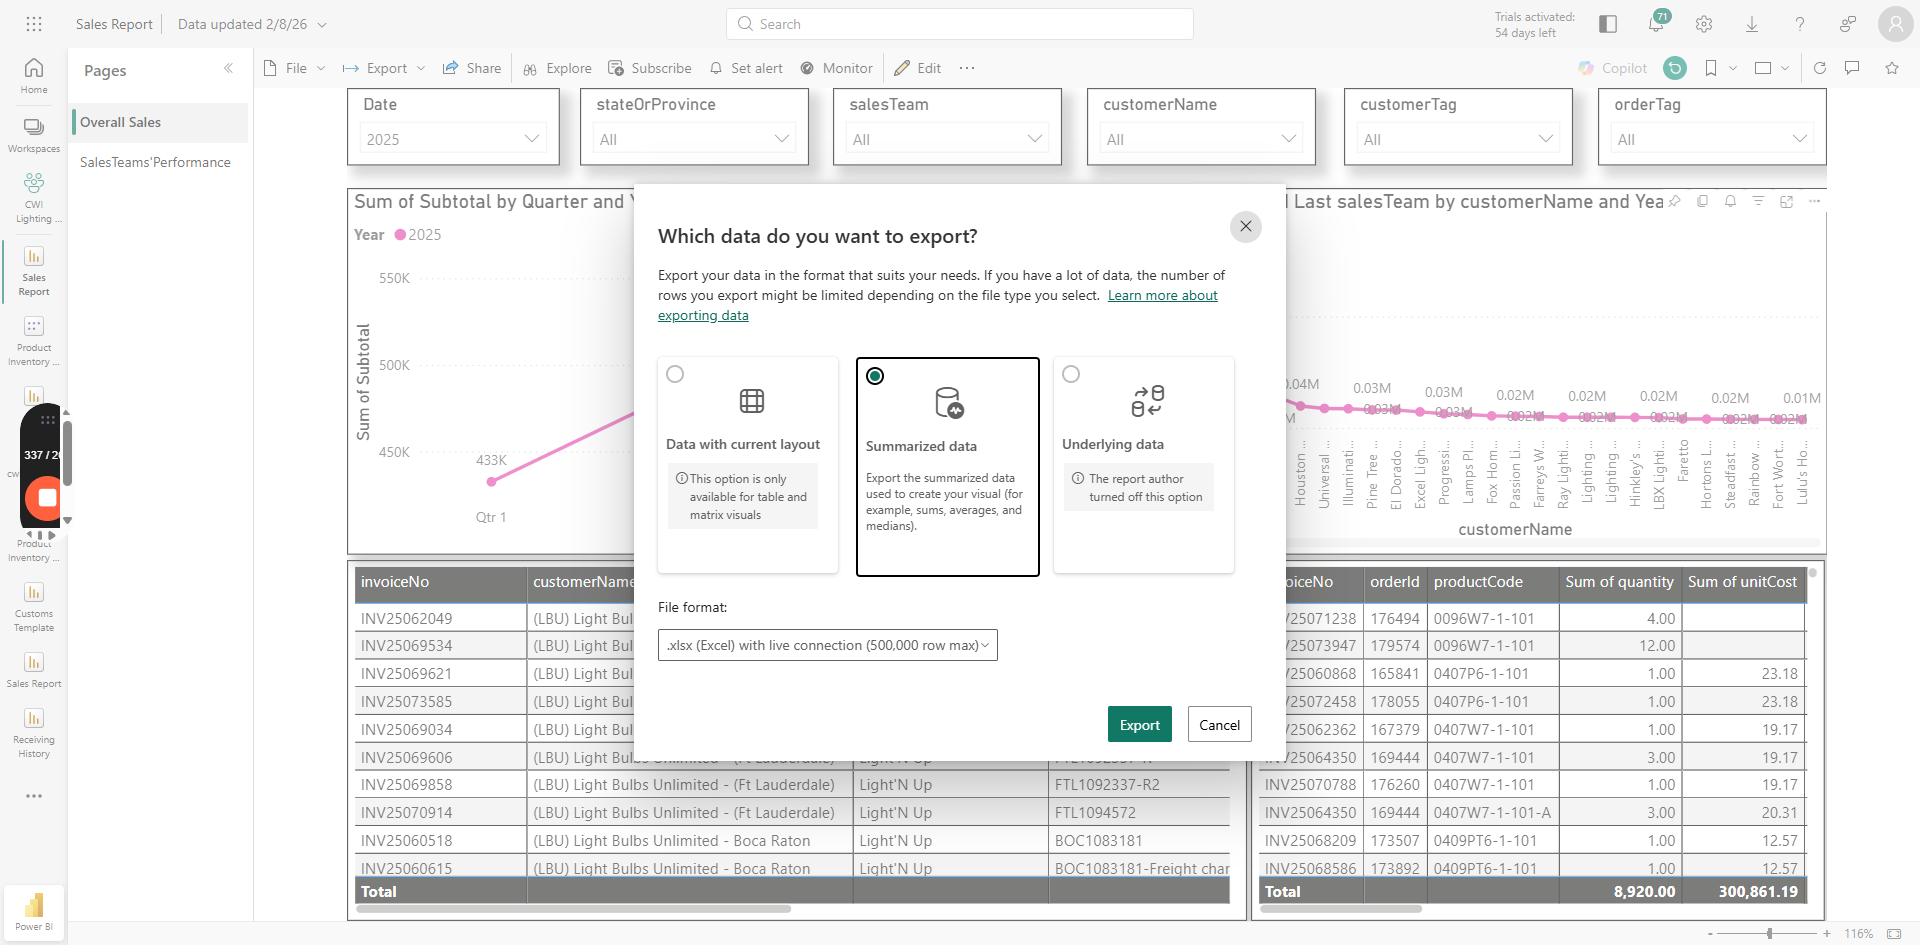
Click the three dots, choose "Export Data," select "CSV," and then click "Export" to download as shown in the below steps

5
Click on three dots(...)
Step #5: Click on three dots(...)
6
Click on "Export data"
Step #6: Click on "Export data"
7
Choose "Summarized data"
Step #7: Choose "Summarized data"
8
choose ".csv (30,000 - row max )"
Step #8: choose ".csv (30,000 - row max )"
9
Click on "Export"
Step #9: Click on "Export"

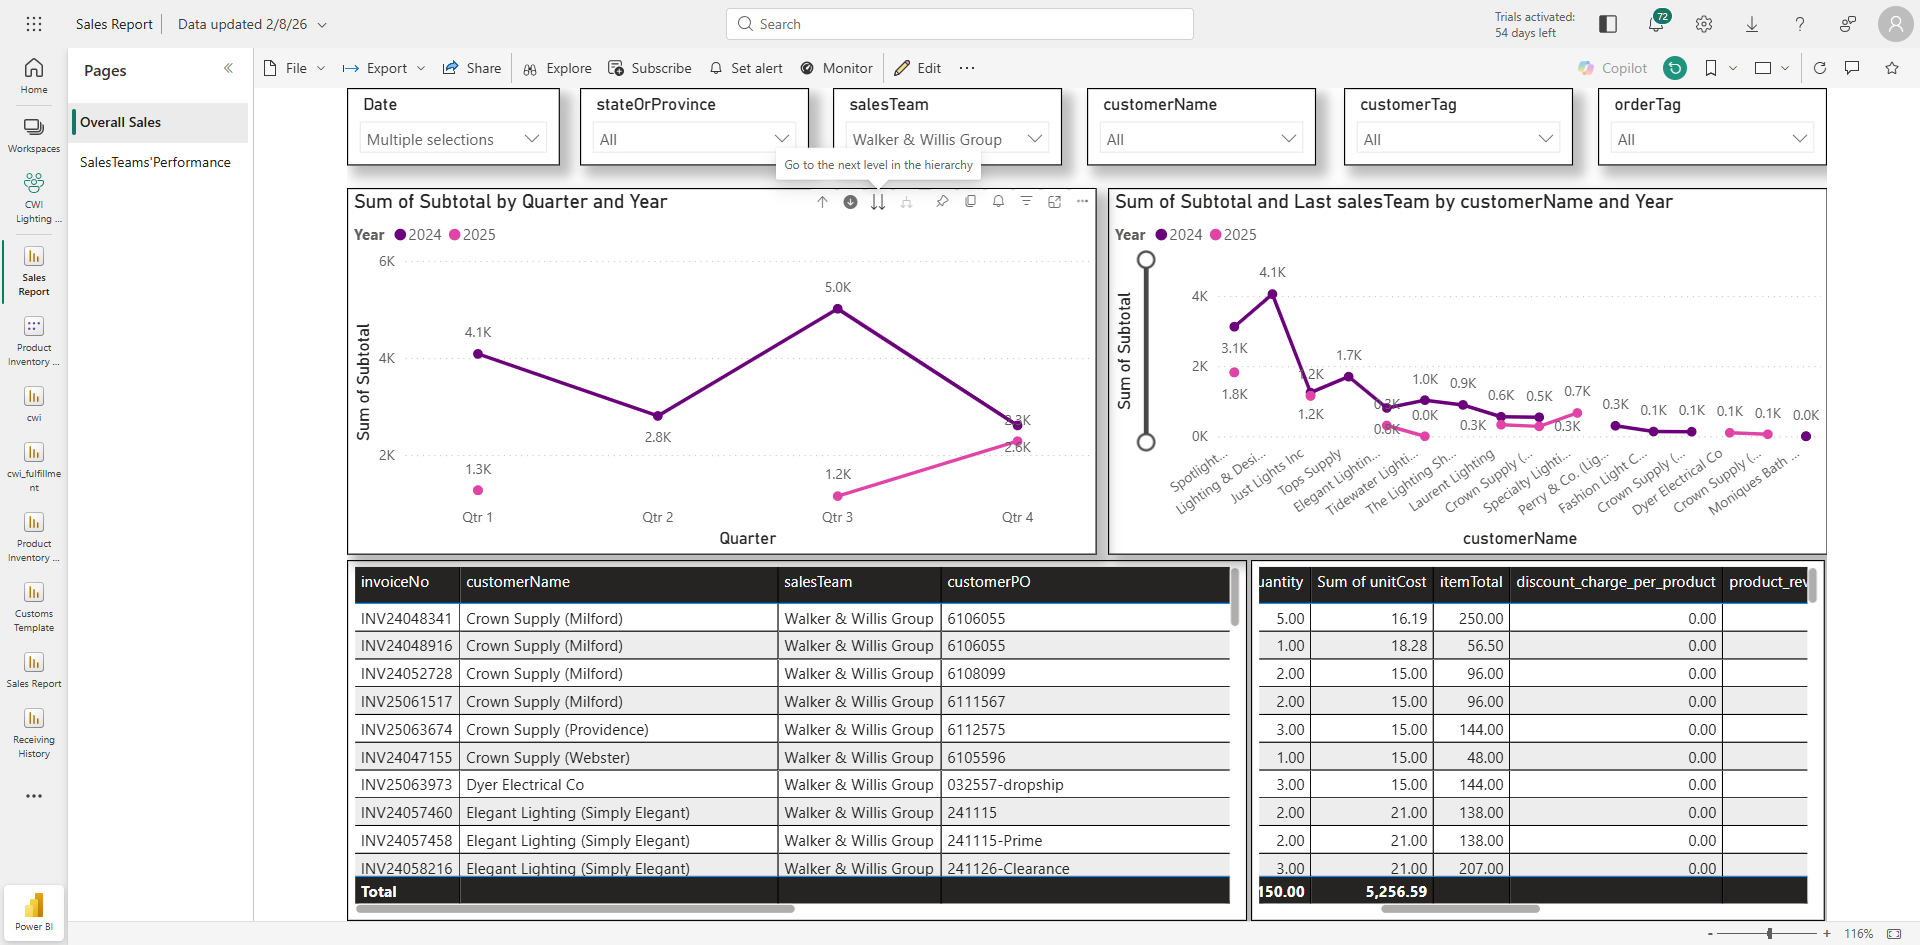
To view this information by quarter for the same period, click the drill up option—the upward arrow. This will display sales for quarters one through four in 2025.

10
Click on "Drill up" option/ Upwards option
Step #10: Click on "Drill up" option/ Upwards option

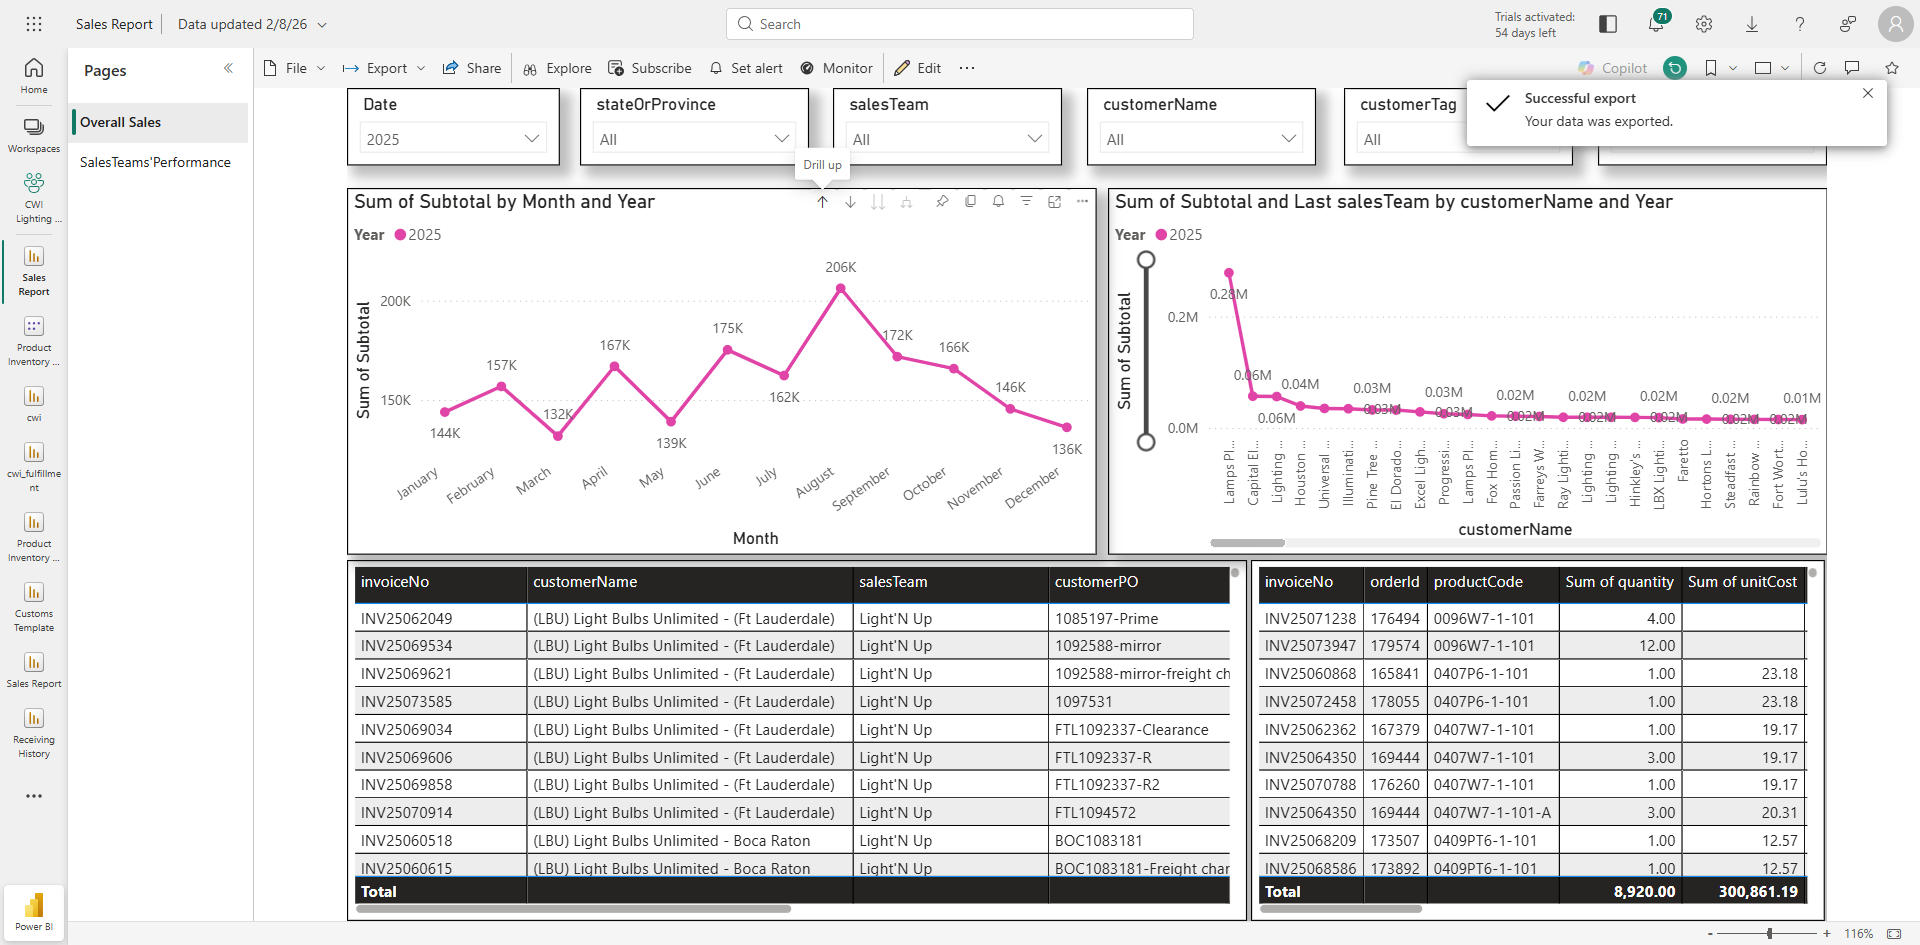
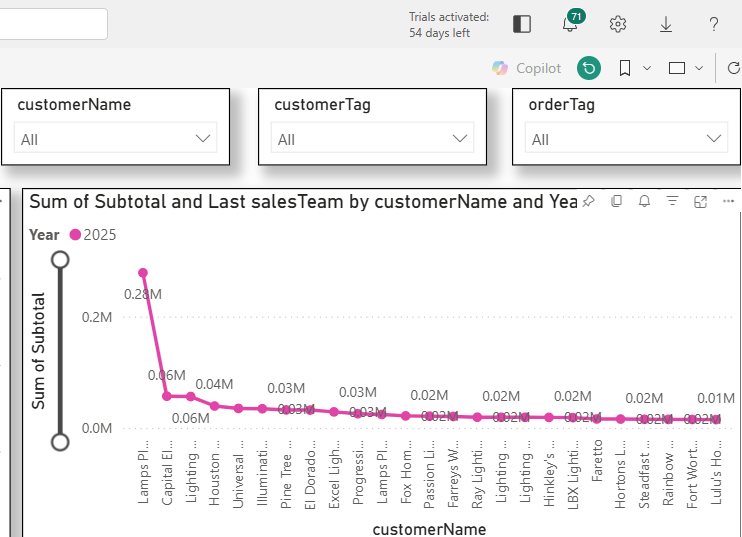
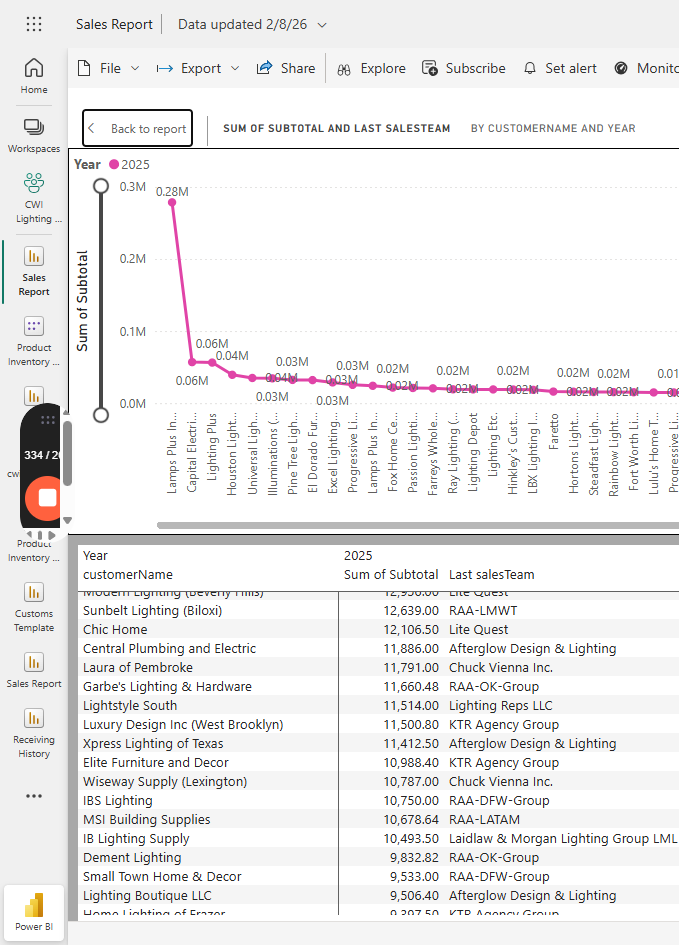
If you want to view this information at the customer account level, use the second visual, which shows customer accounts, their sales team, and revenue.

11
Customer Accounts view
Step #11: Customer Accounts view

Before downloading, If you want to review the data points you will be downloading. Click the three dots again and select "Show as Table."

12
Check datapoints(columns) for the current visual. Click on three dots (...)
Step #12: Check datapoints(columns) for the current visual. Click on three dots (...)

13
Click on "Show as a table"
Step #13: Click on "Show as a table"

14
This table will show you exactly what data you are accessing. Customer name, sales revenue, and sales team for 2025 ore selected time period. After verifying the datapoints click on "Back to report" option.
Step #14: This table will show you exactly what data you are accessing. Customer name, sales revenue, and sales team for 2025 ore selected time period. After verifying the datapoints click on "Back to report" option.

15
Click on three dots again to export the data
Step #15: Click on three dots again to export the data
16
Click on "Export data"
Step #16: Click on "Export data"
17
Select "Summarized data"
Step #17: Select "Summarized data"

18
choose ".csv (30,000 - row max )"
Step #18: choose ".csv (30,000 - row max )"
19
Click on "Export"
Step #19: Click on "Export"

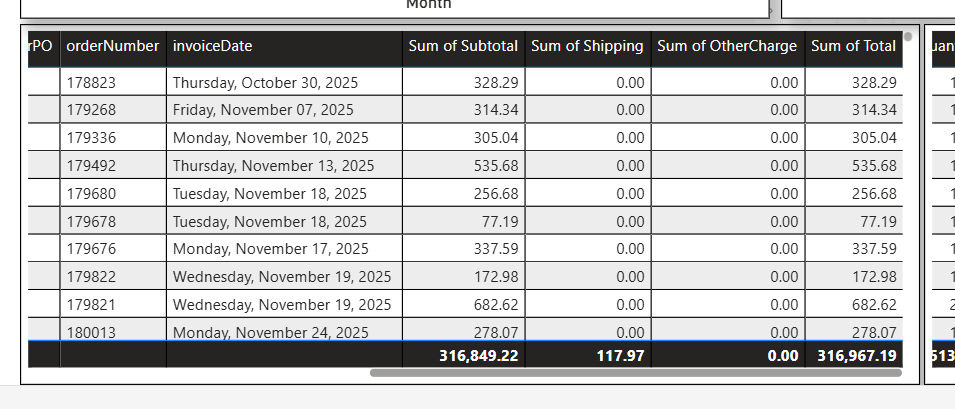
To download all invoices for 2025

20
Access the third view/ table
Step #20: Access the third view/ table

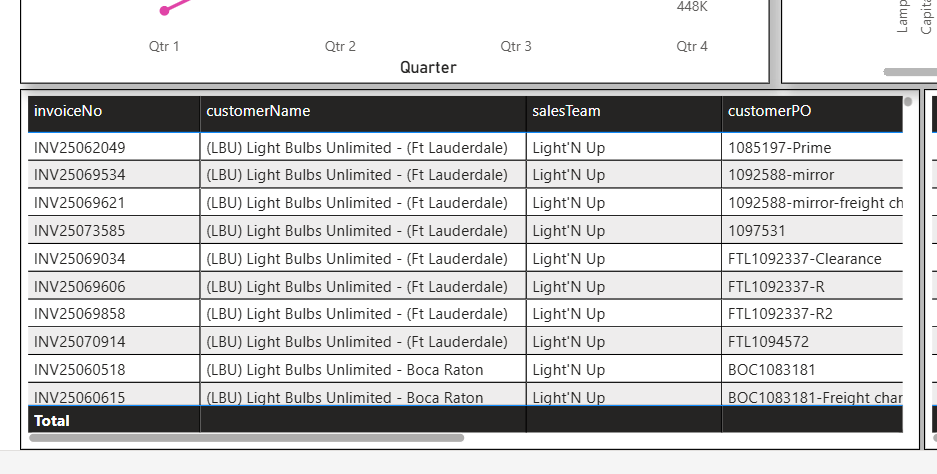
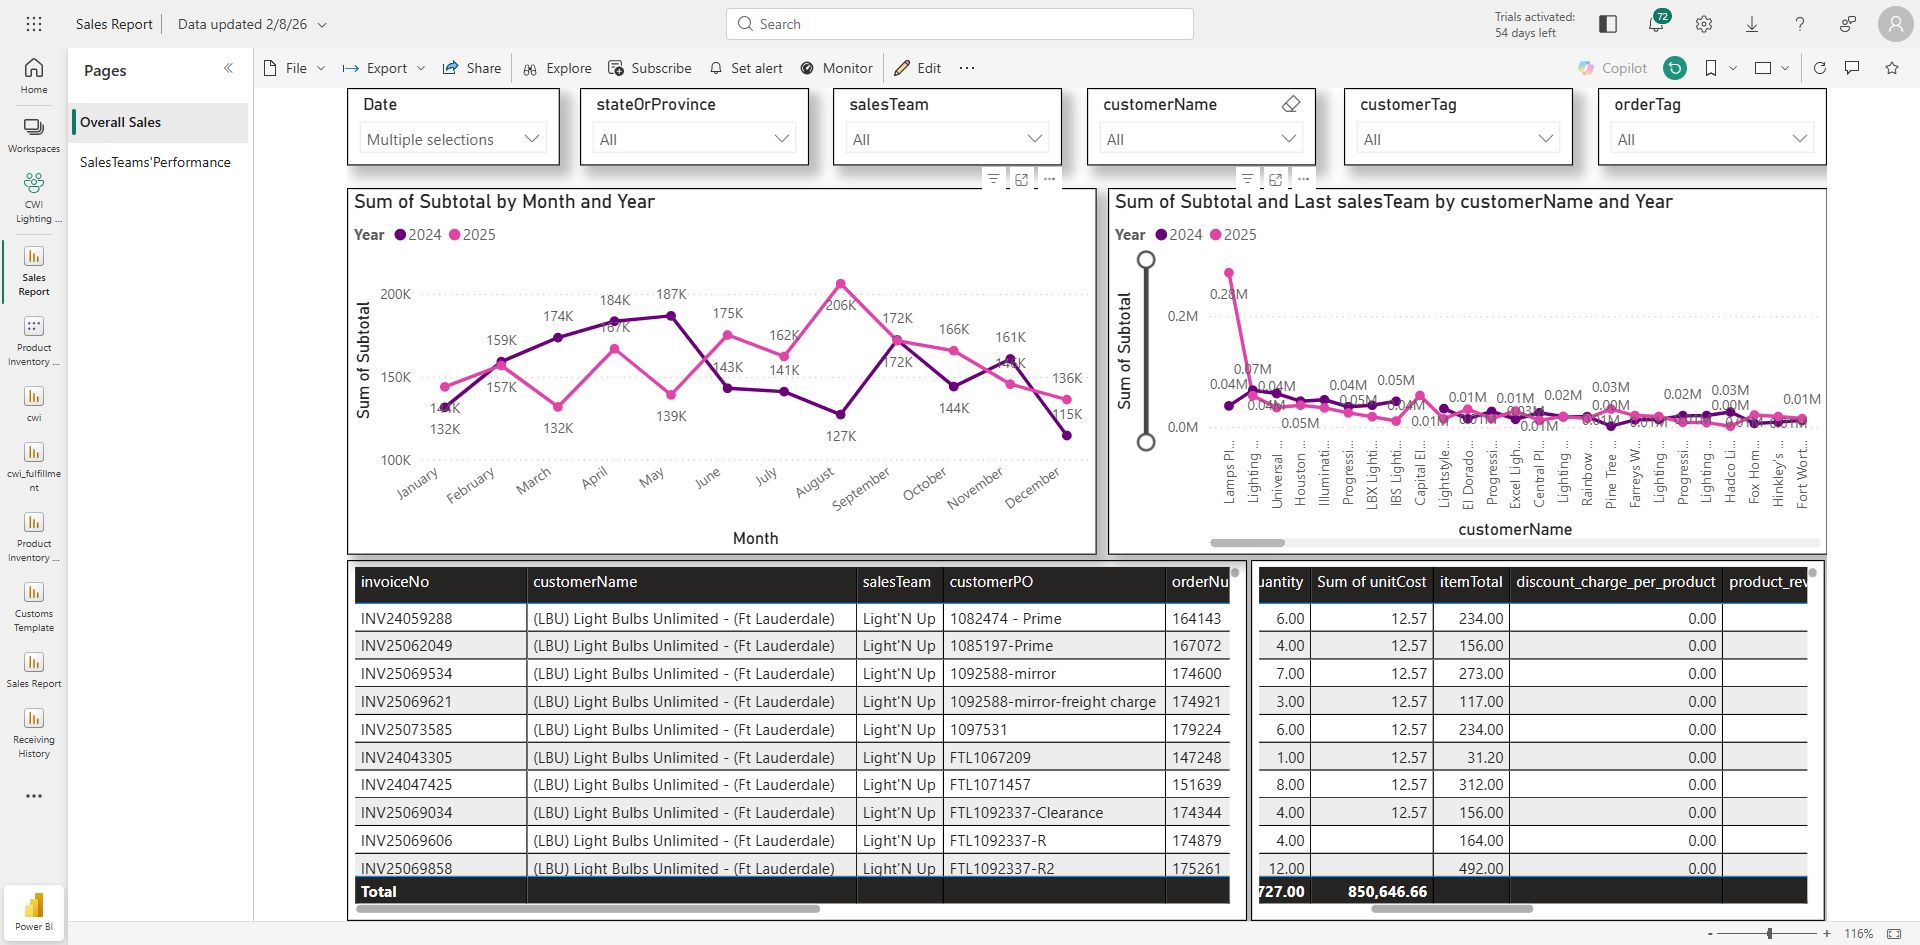
This view contains all the detailed information. The invoice number, customer name, sales team, PO, and revenue split.

21
Click on three dots , then click on "Export data" and click export option for selected Data with current layout option
Step #21: Click on three dots , then click on "Export data" and click export option for selected Data with current layout option

To view sales revenue at the product level, access the fourth visual that displays product codes for each invoice, along with their quantities, applied discounts, and costs.

22
Go to the fourth visual/ table to access and download the product level data for the selected filters
Step #22: Go to the fourth visual/ table to access and download the product level data for the selected filters

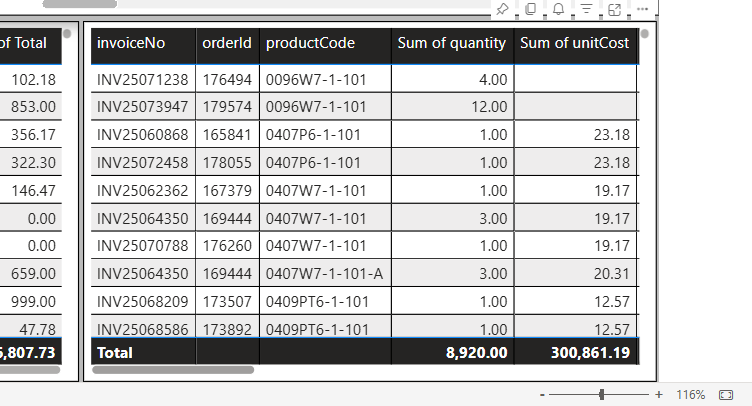
If you want to filter this information for a specific sales team or account, you can use the filters. Let's say you want to view this information for Walker and Willis Group.

23
Go to salesTeam slicer, SELECT OR TYPE Walker and Willis Group
Step #23: Go to salesTeam slicer, SELECT OR TYPE Walker and Willis Group

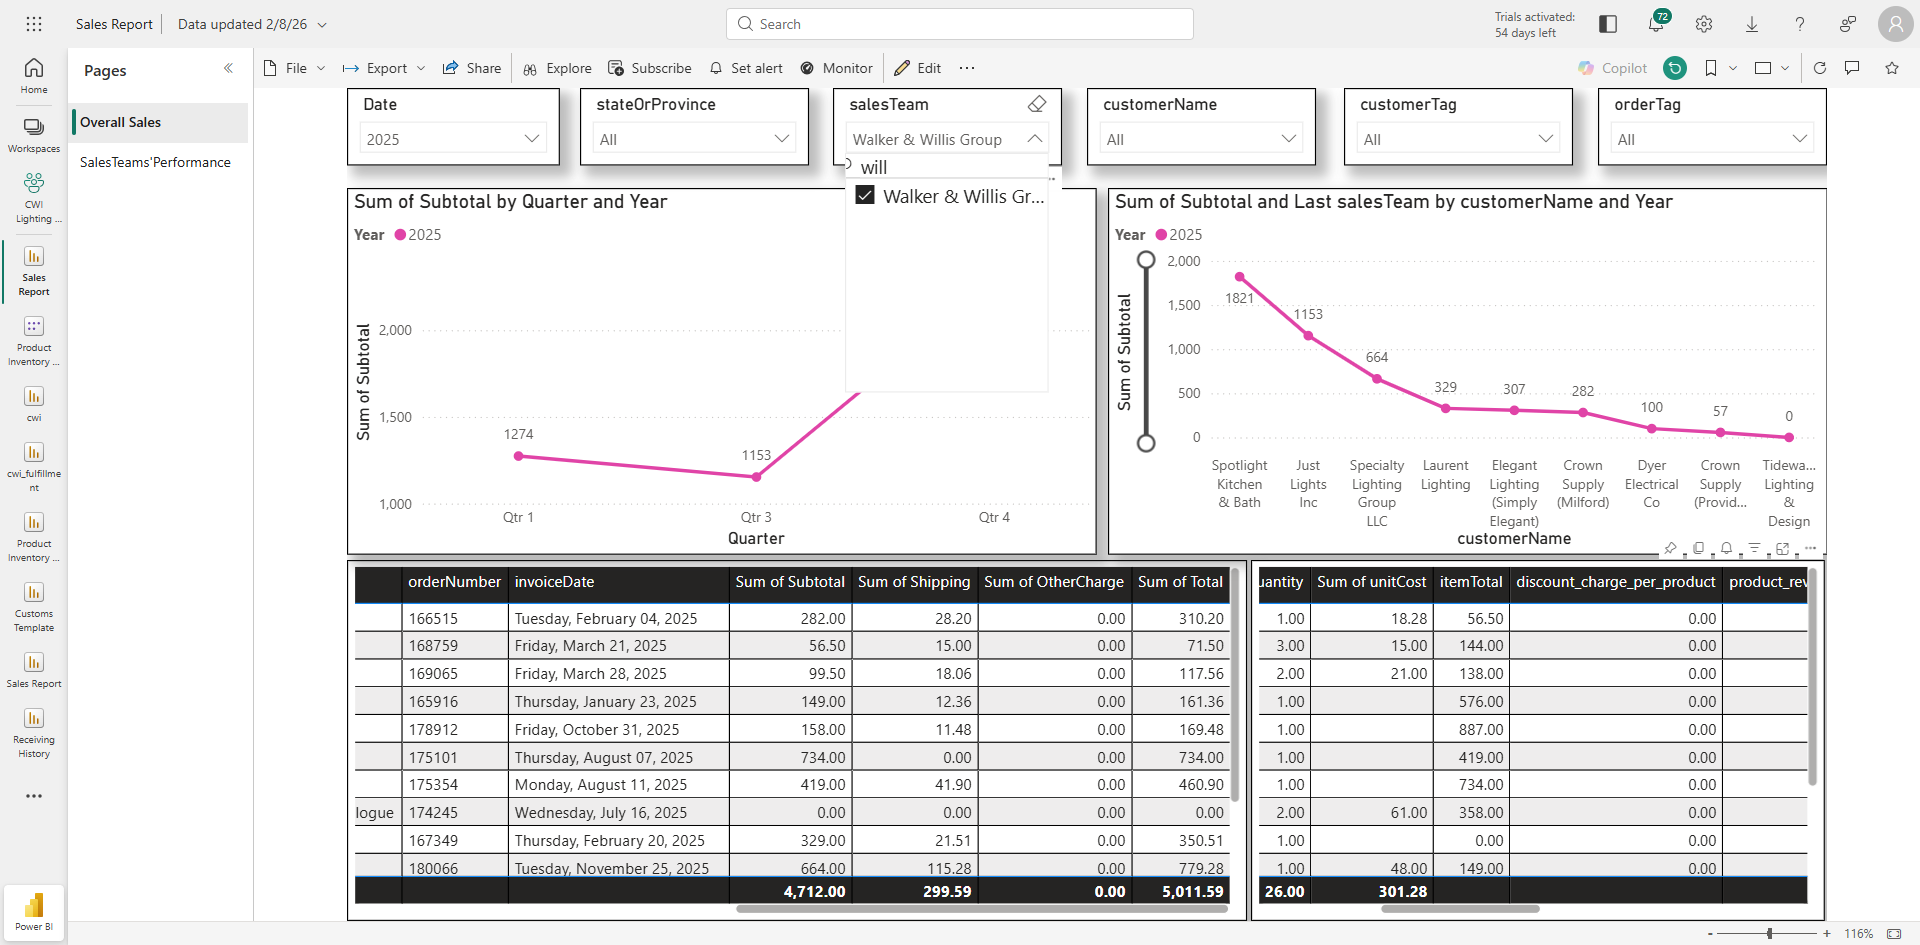
You can also download the information by clicking the three dots, selecting "Export data," choosing CSV, and then downloading invoices from the third visual.

You can also access this information for two consecutive years.

24
Select required years
Step #24: Select required years

25
Choose 2024, 2025
Step #25: Choose 2024, 2025

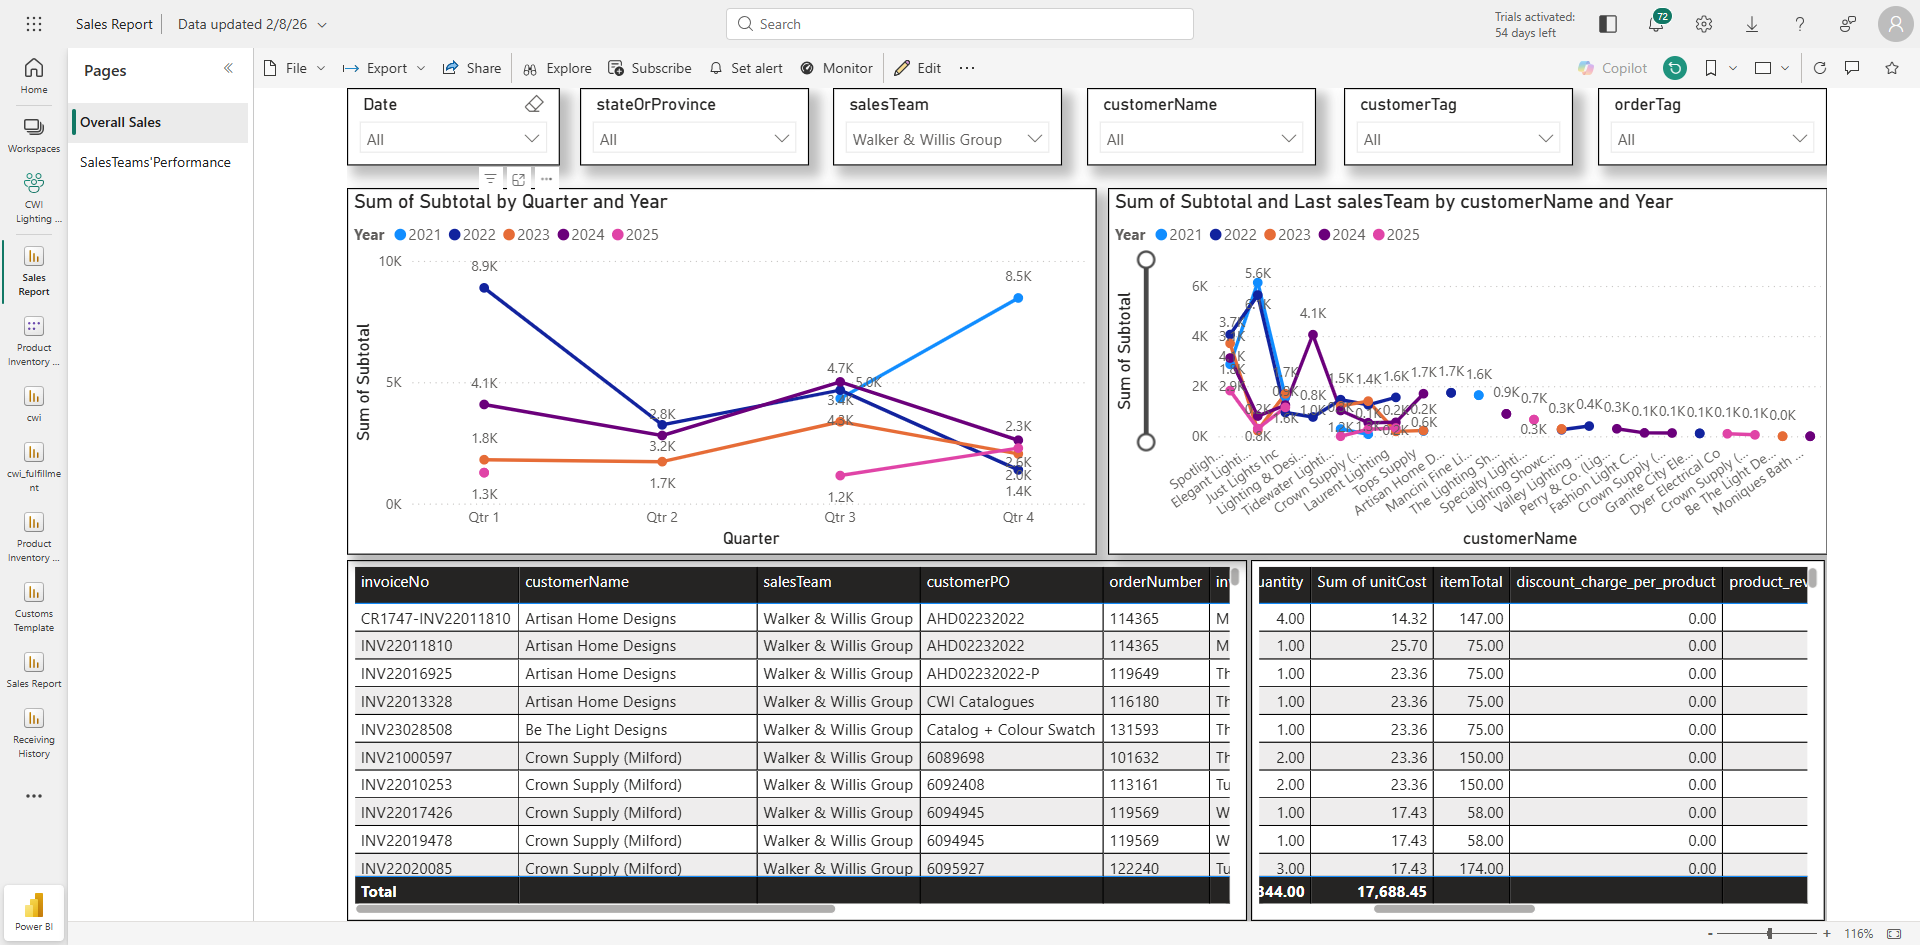
This shows the quarterly data for these two years.

26
You can also drill down to view the month-by-month details by clicking the Drill down or downwards arrow.
Step #26: You can also drill down to view the month-by-month details by clicking the Drill down or downwards arrow.

Download this information. Currently, I have selected Walker and Wills, so it only displays information for them. I can clear this filter to view the 2024 and 2025 sales revenue for all accounts.

27
Clear selection to see overall sales revenue for 2024 and 2025
Step #27: Clear selection to see overall sales revenue for 2024 and 2025

Similarly, I can filter this for a specific customer account. I will go to the customer name slicer.

28
Go to customerName slicer and Select or type the customer account of your choice. Here I am showing example for Lamps Plus Inc. (online)
Step #28: Go to customerName slicer and Select or type the customer account of your choice. Here I am showing example for Lamps Plus Inc. (online)

Type Lamps Plus . It will show all the available Lamps Plus accounts. select all or the required account.

29
Click on "Lamps Plus Inc.(Online)"
Step #29: Click on "Lamps Plus Inc.(Online)"

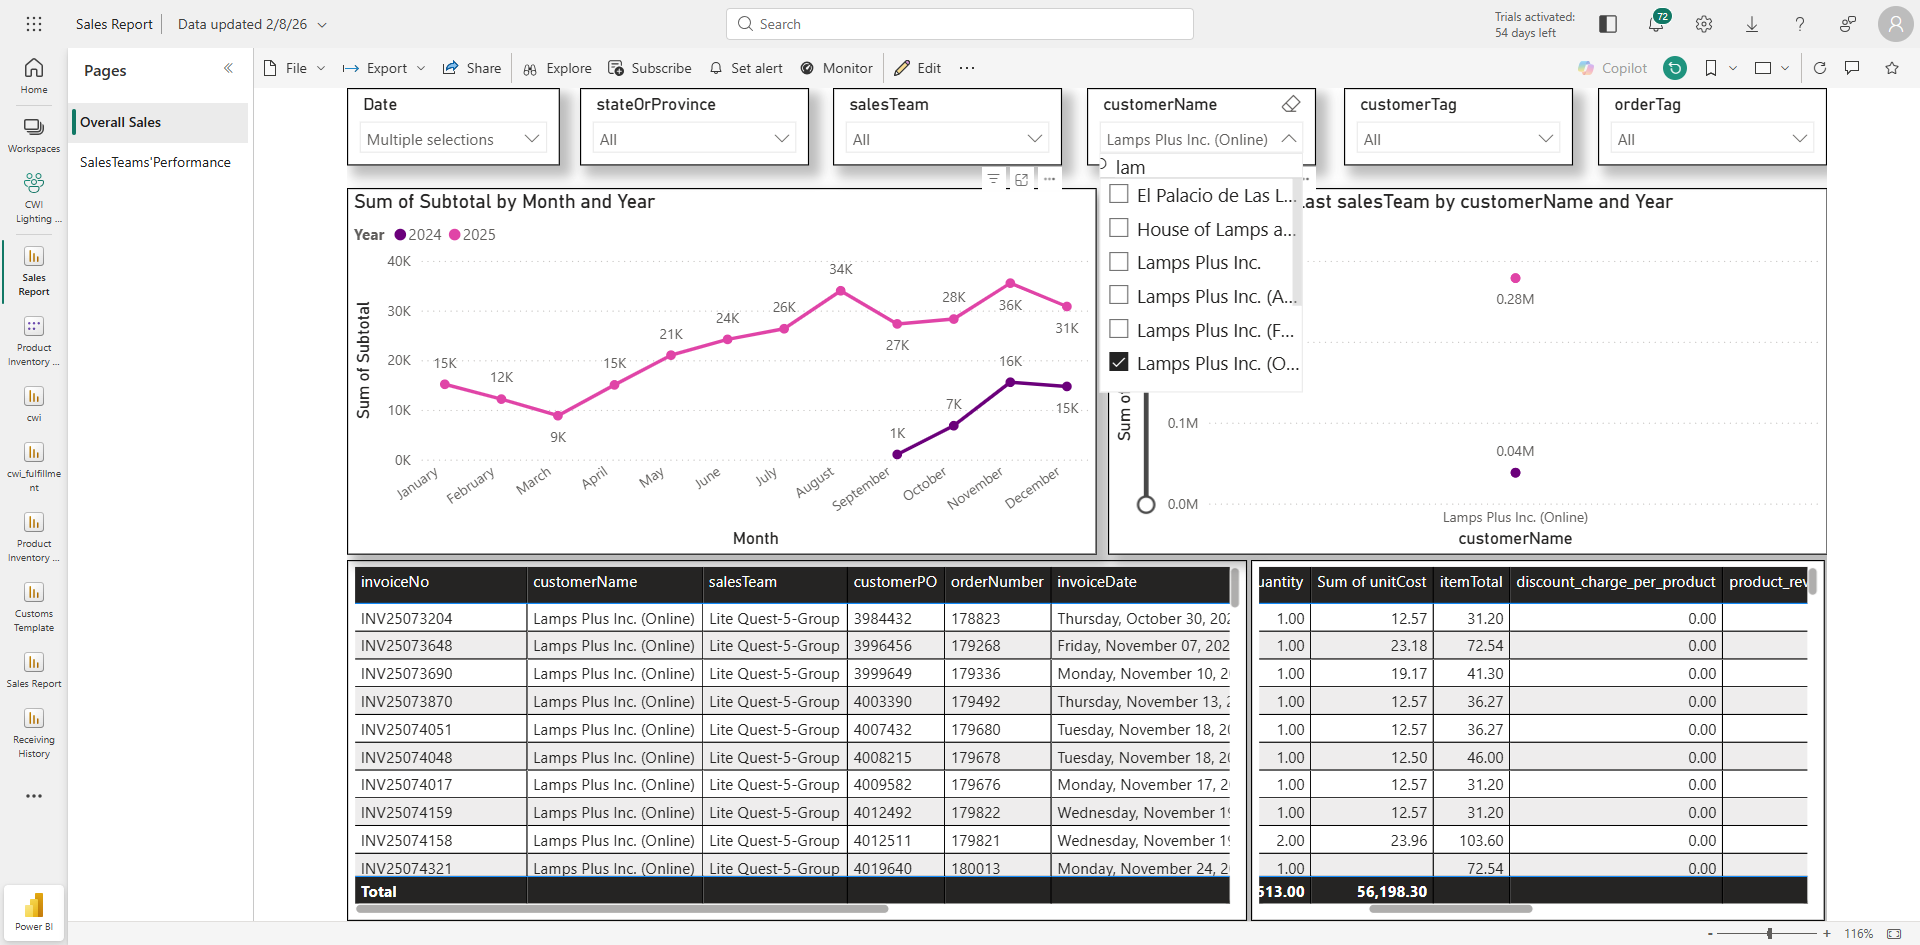
See their month-on-month revenue for 2024 and 2025 in the first visual/line chart. If you want to download their invoices for 2024 and 2025, you can go to the third visual.

30
Click the three dots on the table and download the data.
Step #30: Click the three dots  on the table and download the data.

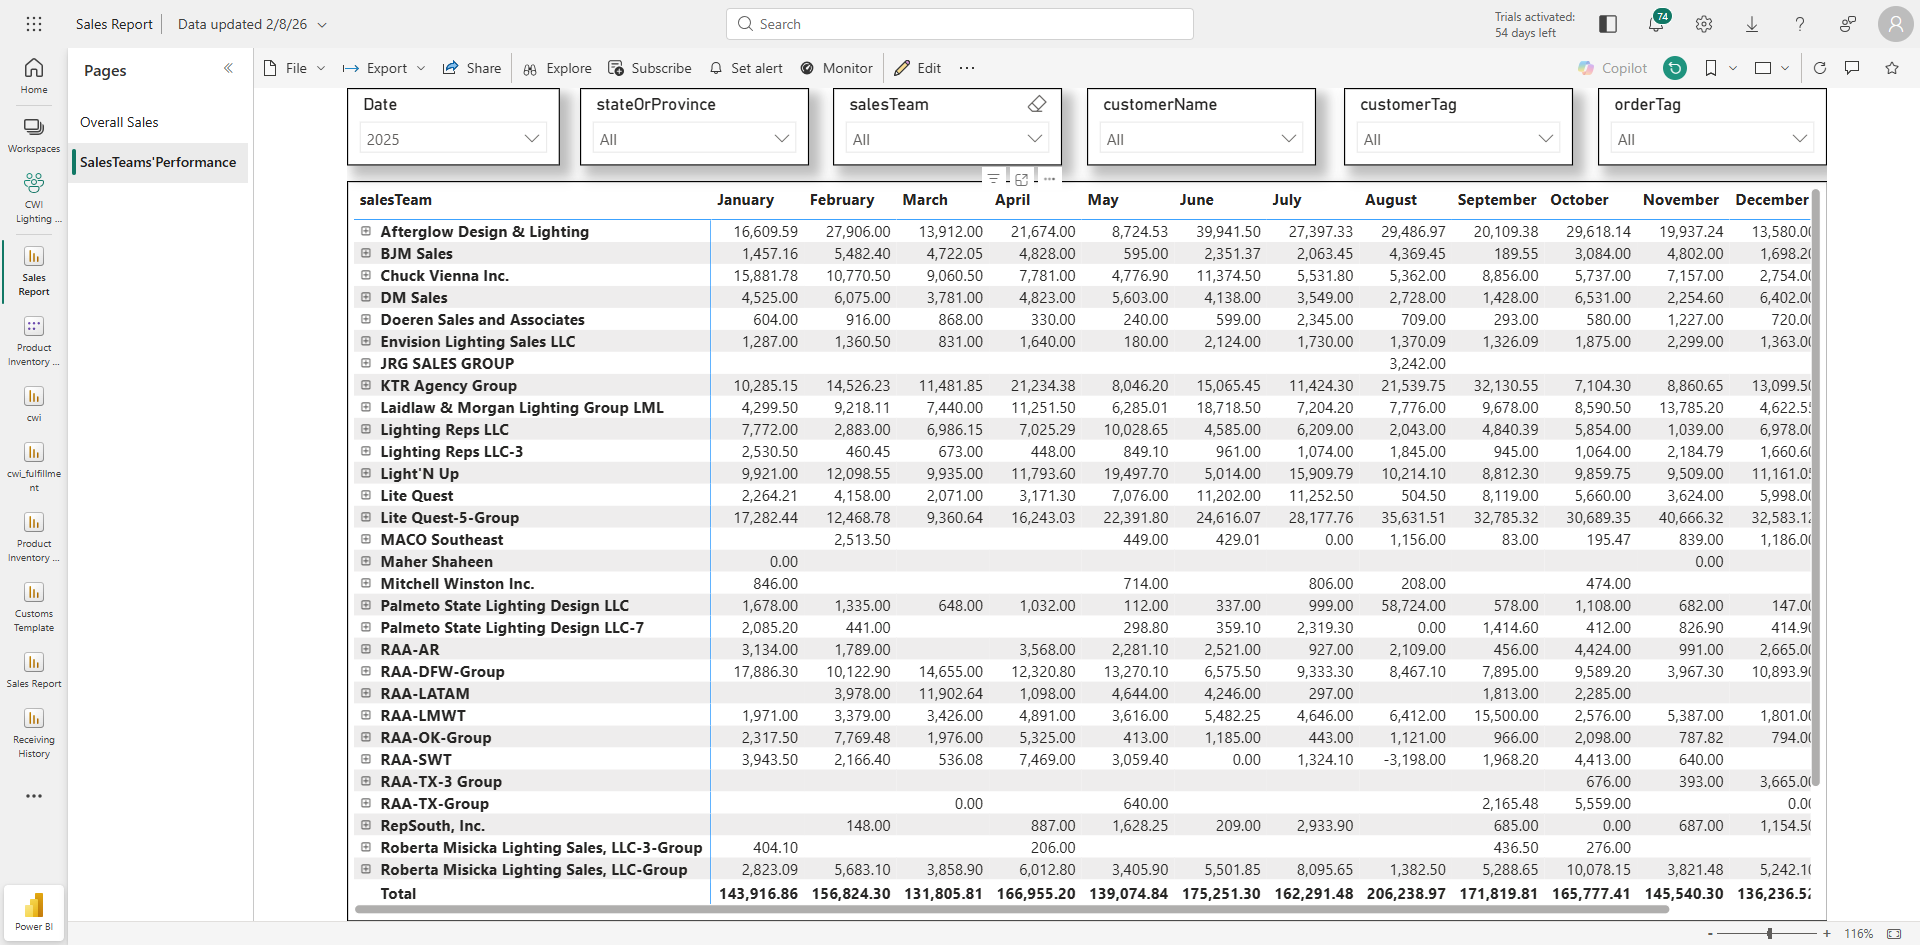
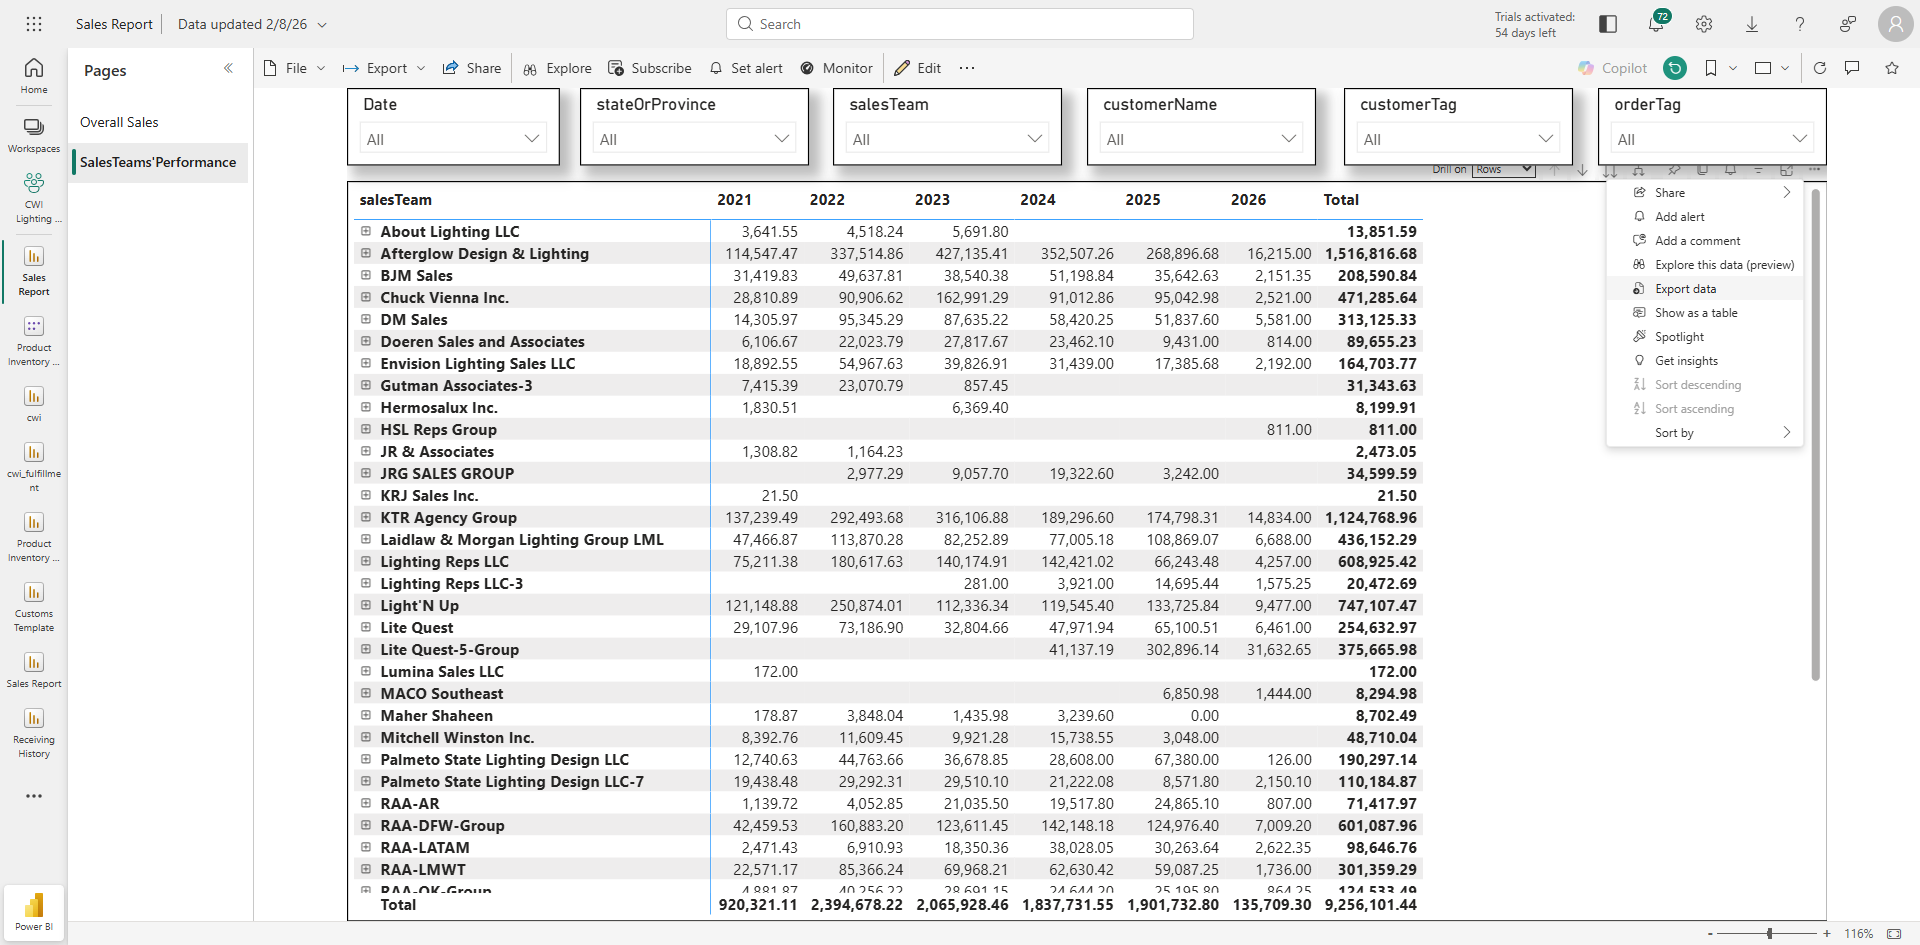
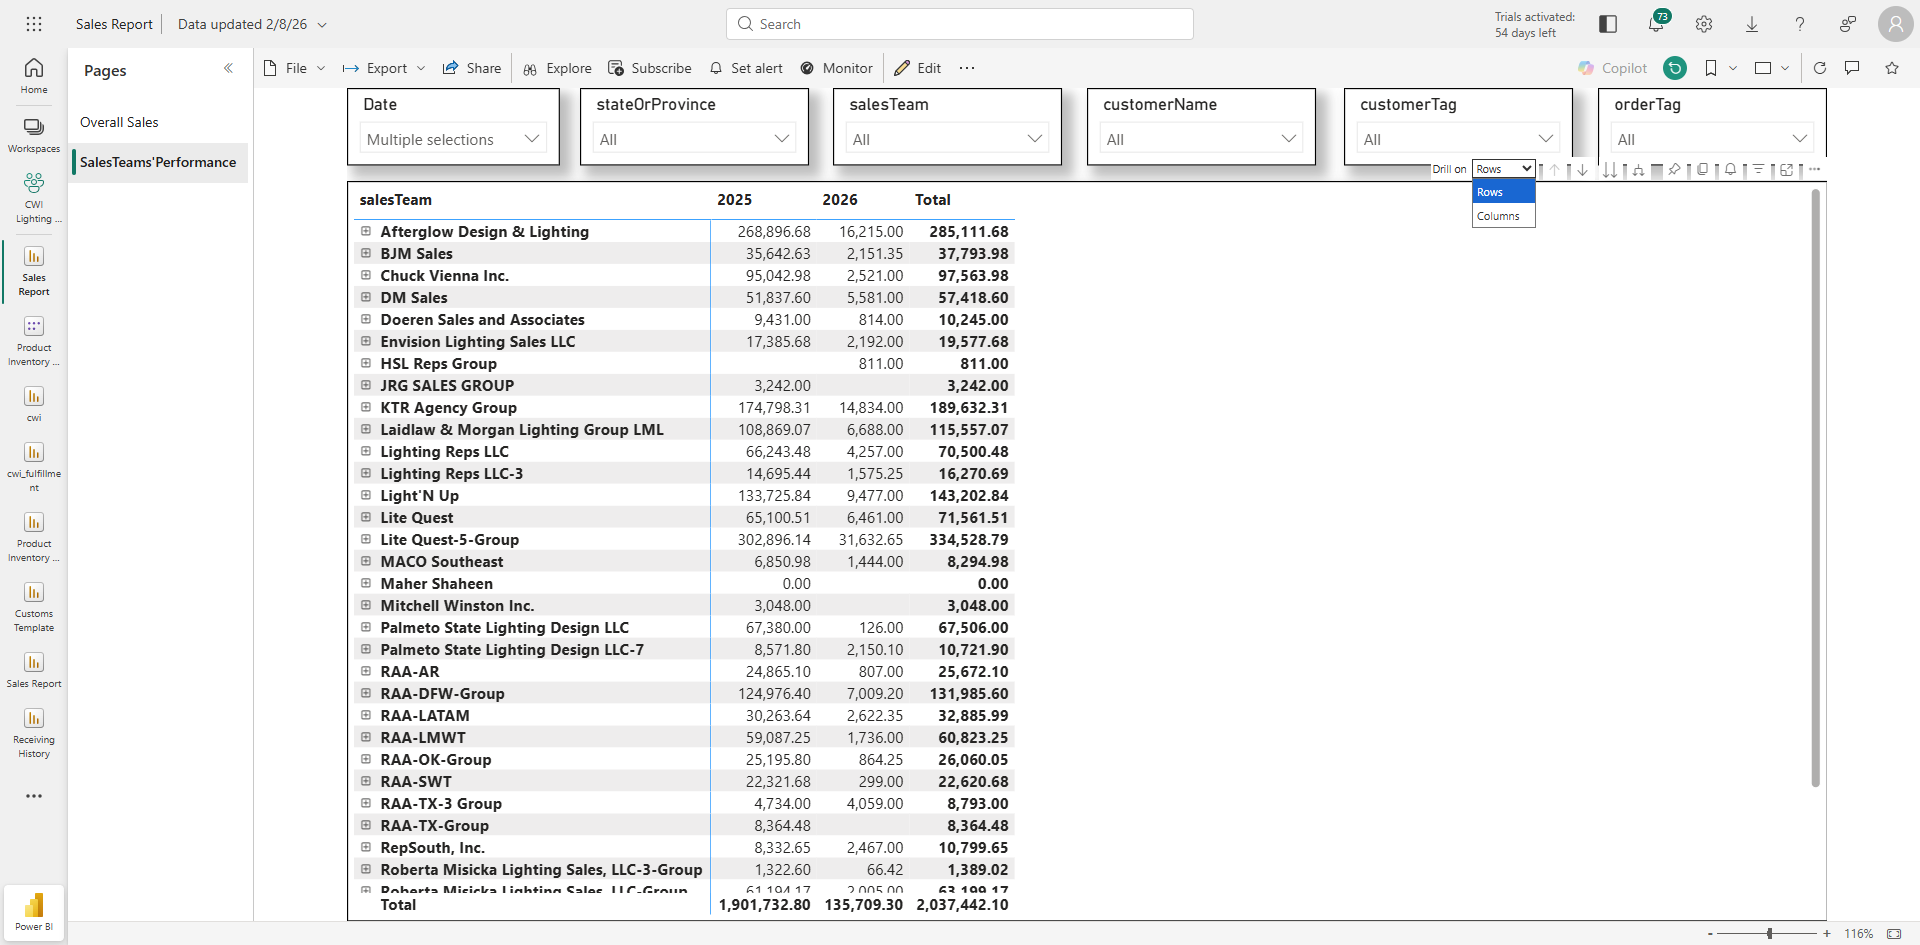
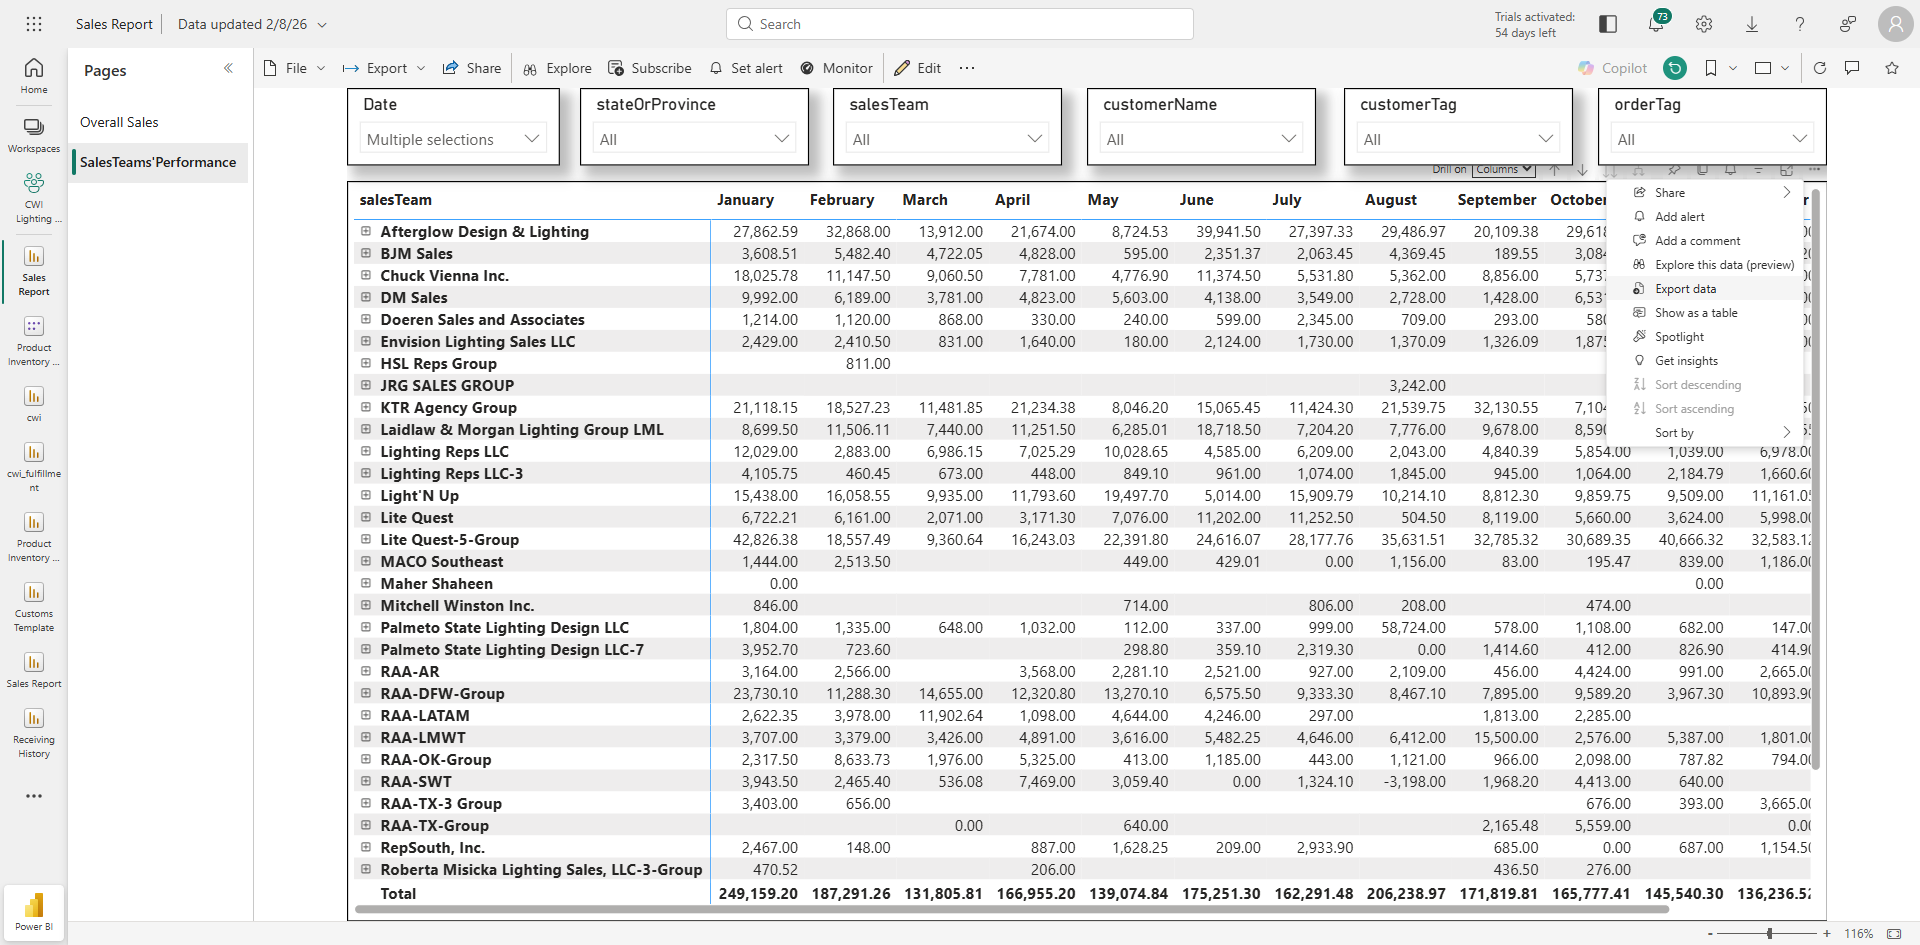
For easier access of sales team data go to the second view "SalesTeams'Performance, this section is dedicated entirely to the sales team.

31
Click on "Sales Teams'Performance"
Step #31: Click on "Sales Teams'Performance"

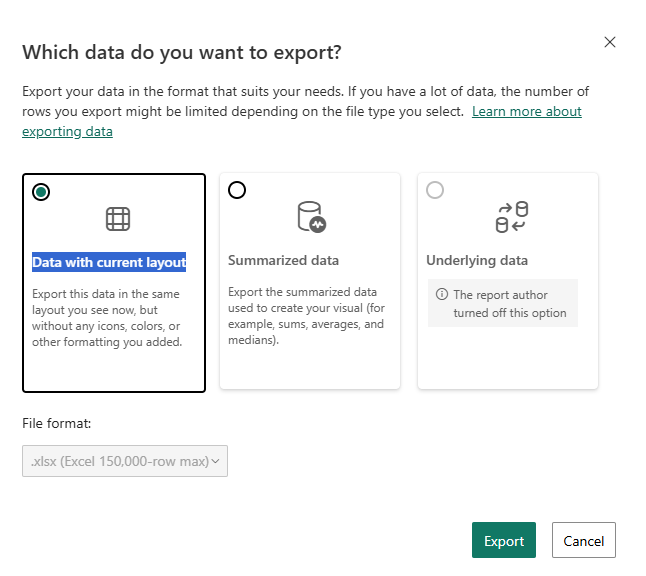
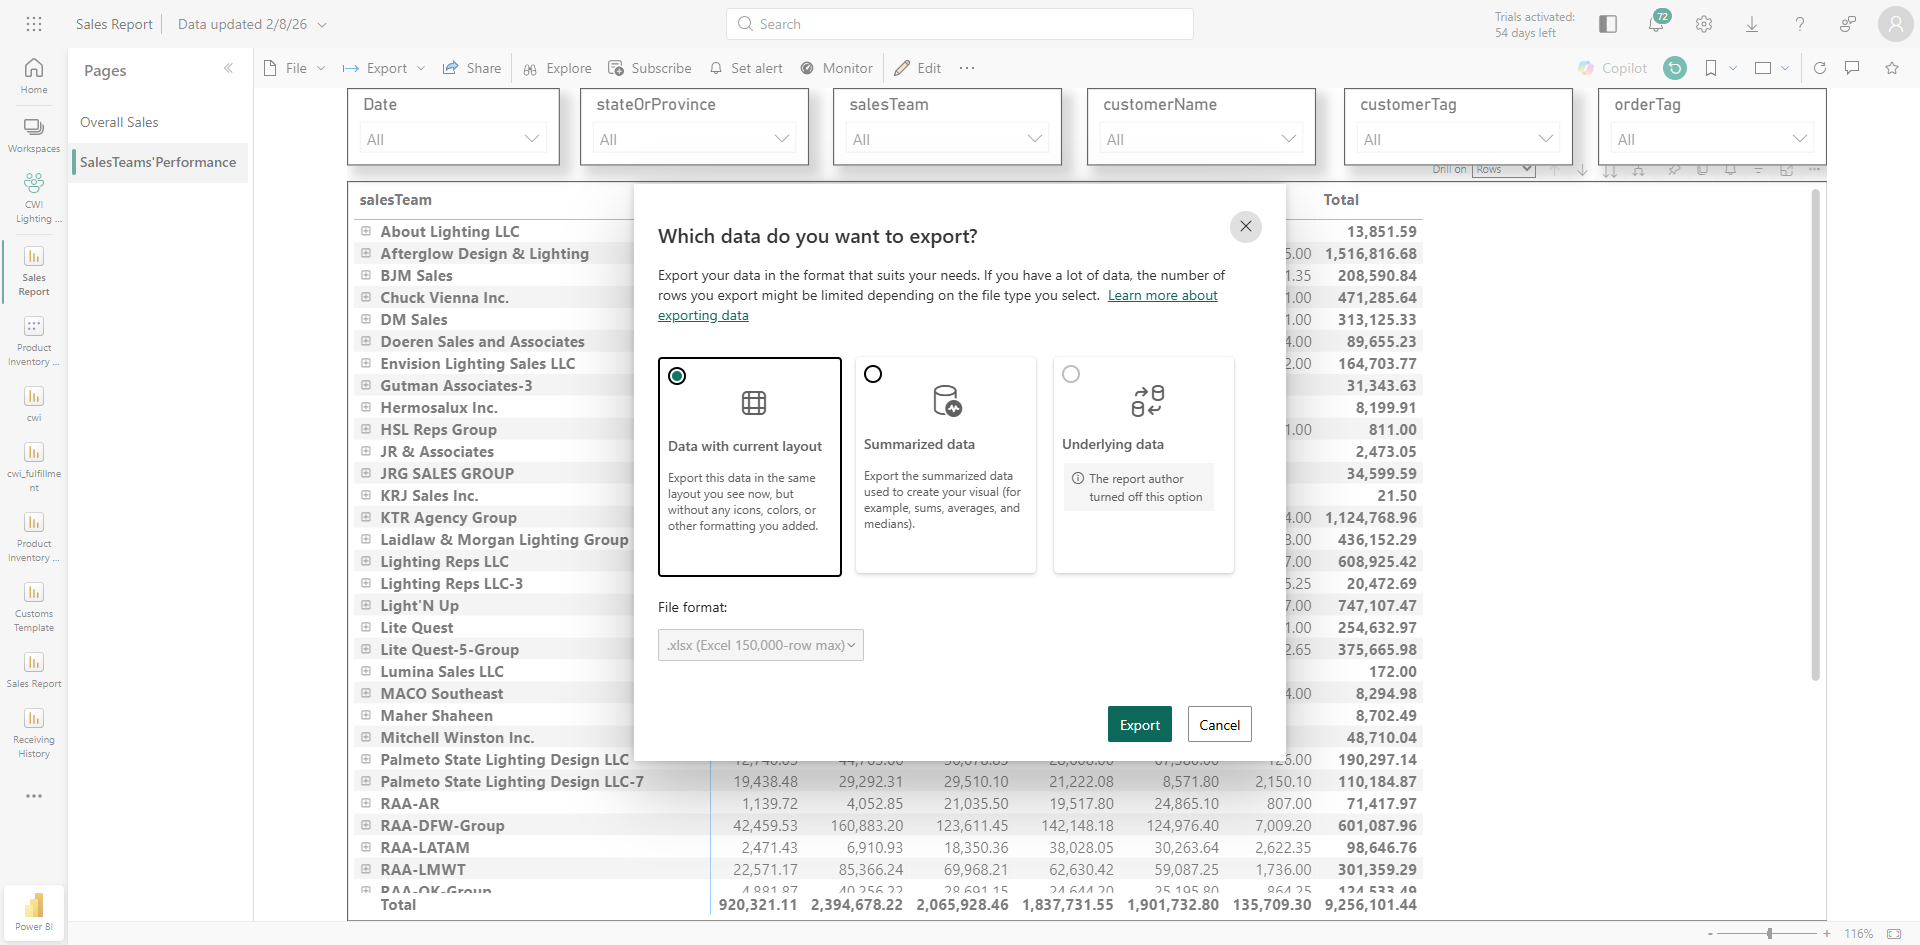
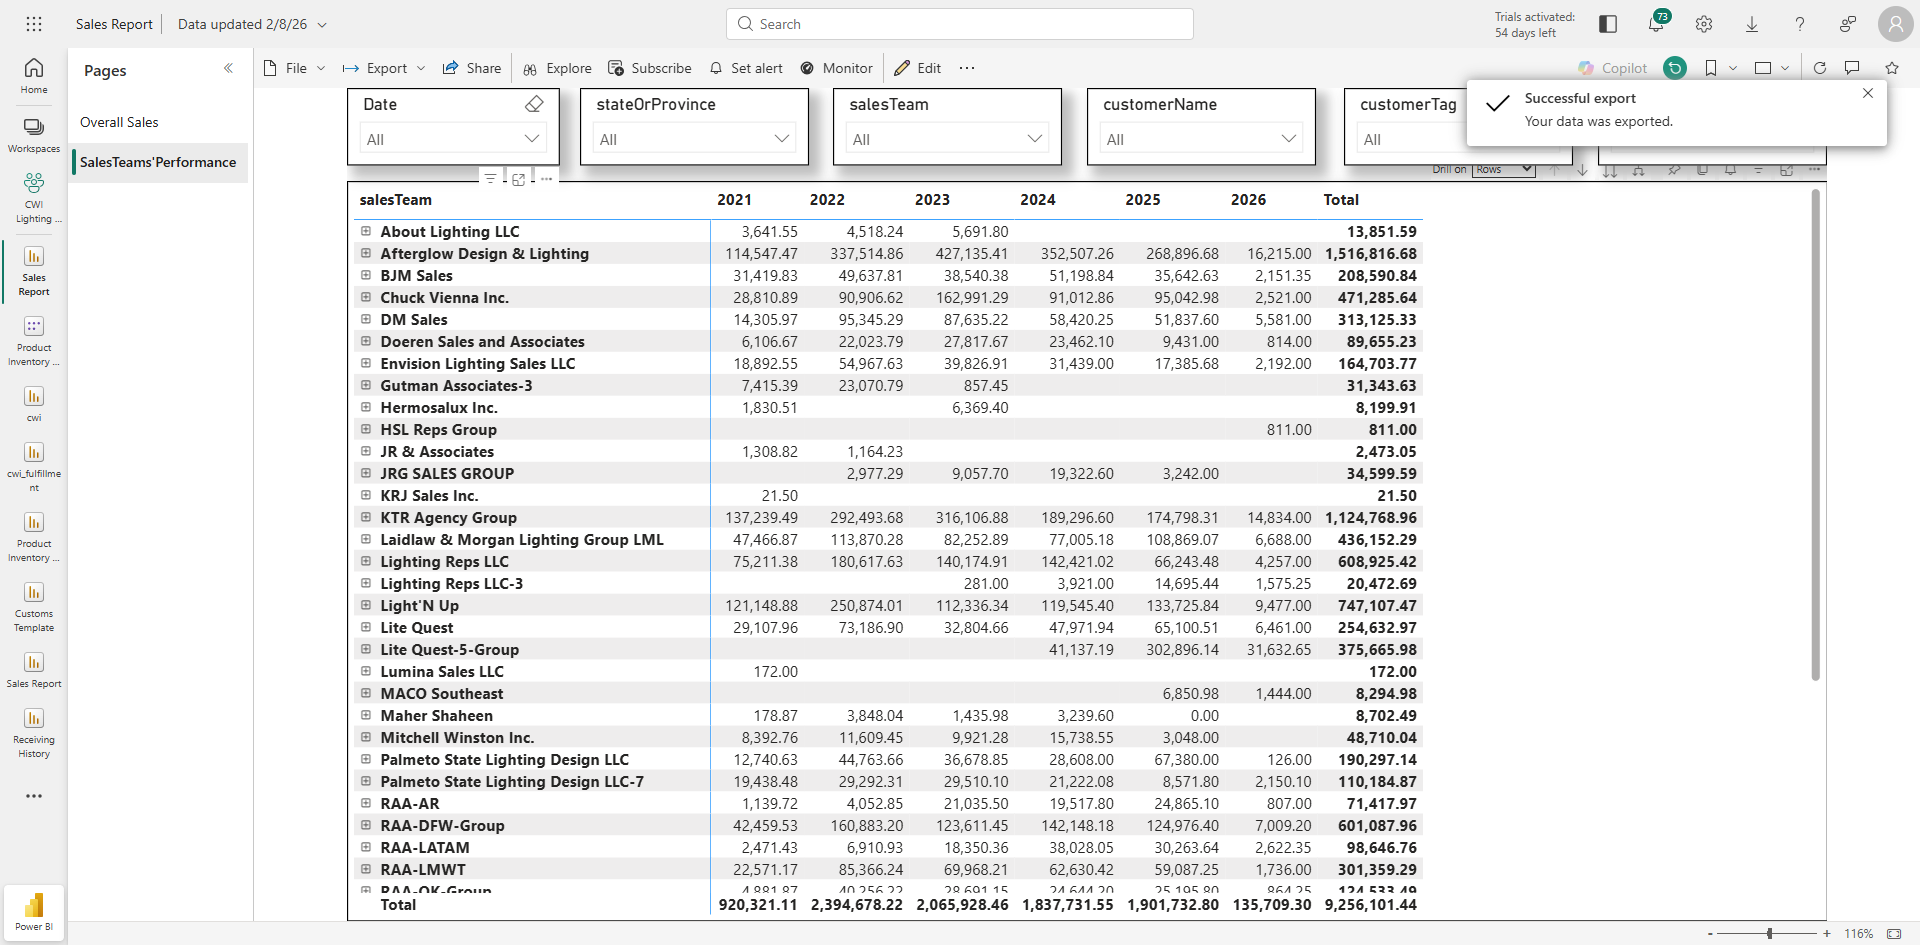
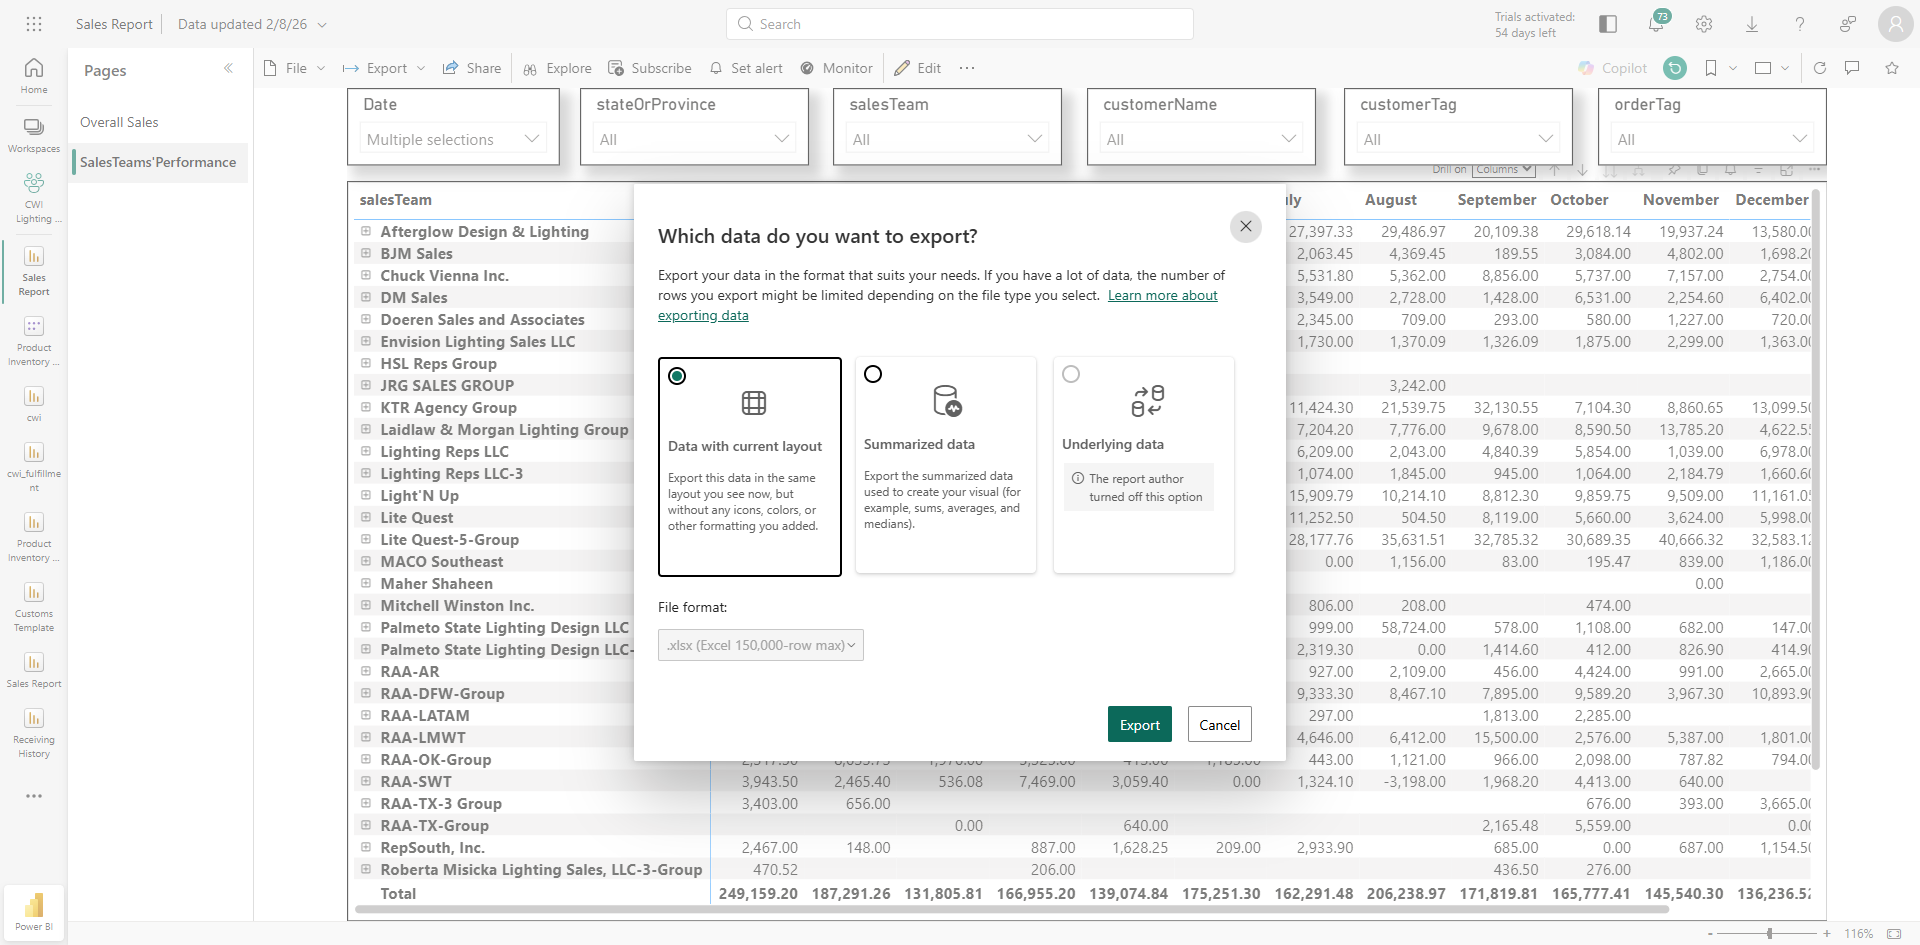
To download the sales revenue for all sales teams across all years, click the three dots, select "Export data," choose "Data with current layout," and then click "Export."

32
Click the three dots, select "Export data"
Step #32: Click the three dots, select "Export data"
33
Choose "Data with current layout," and then click "Export."
Step #33: Choose "Data with current layout," and then click "Export."

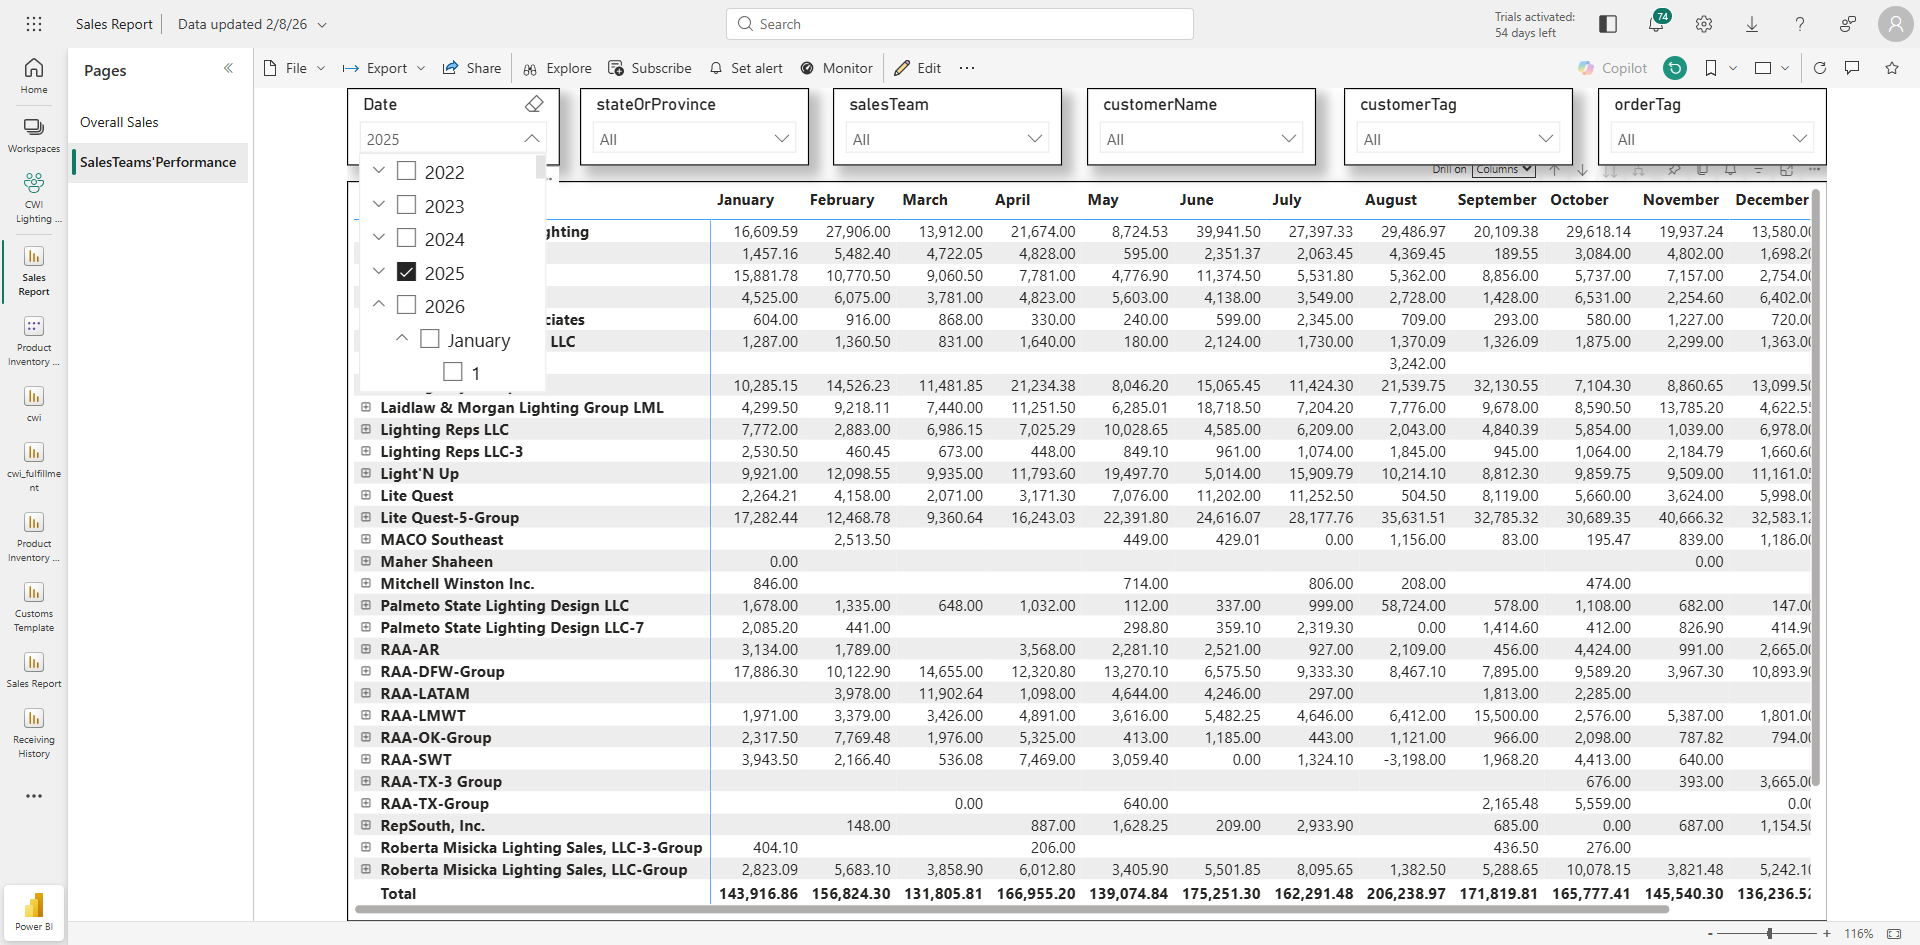
If you want to download data for just two years, 2025 and 2026, at the month-on-month level

34
Go to "Date" slicer
Step #34: Go to "Date" slicer
35
Select year 2025, 2026
Step #35: Select year 2025, 2026
36
Click on any white space, all available options will appear
Step #36: Click on any white space, all available options will appear
37
On the "Drill on" option choose Columns as we are drilling down on the time period
Step #37: On the "Drill on" option choose Columns as we are drilling down on the time period
38
Click on Drill down option (two downward arrows)
Step #38: Click on Drill down option (two downward arrows)

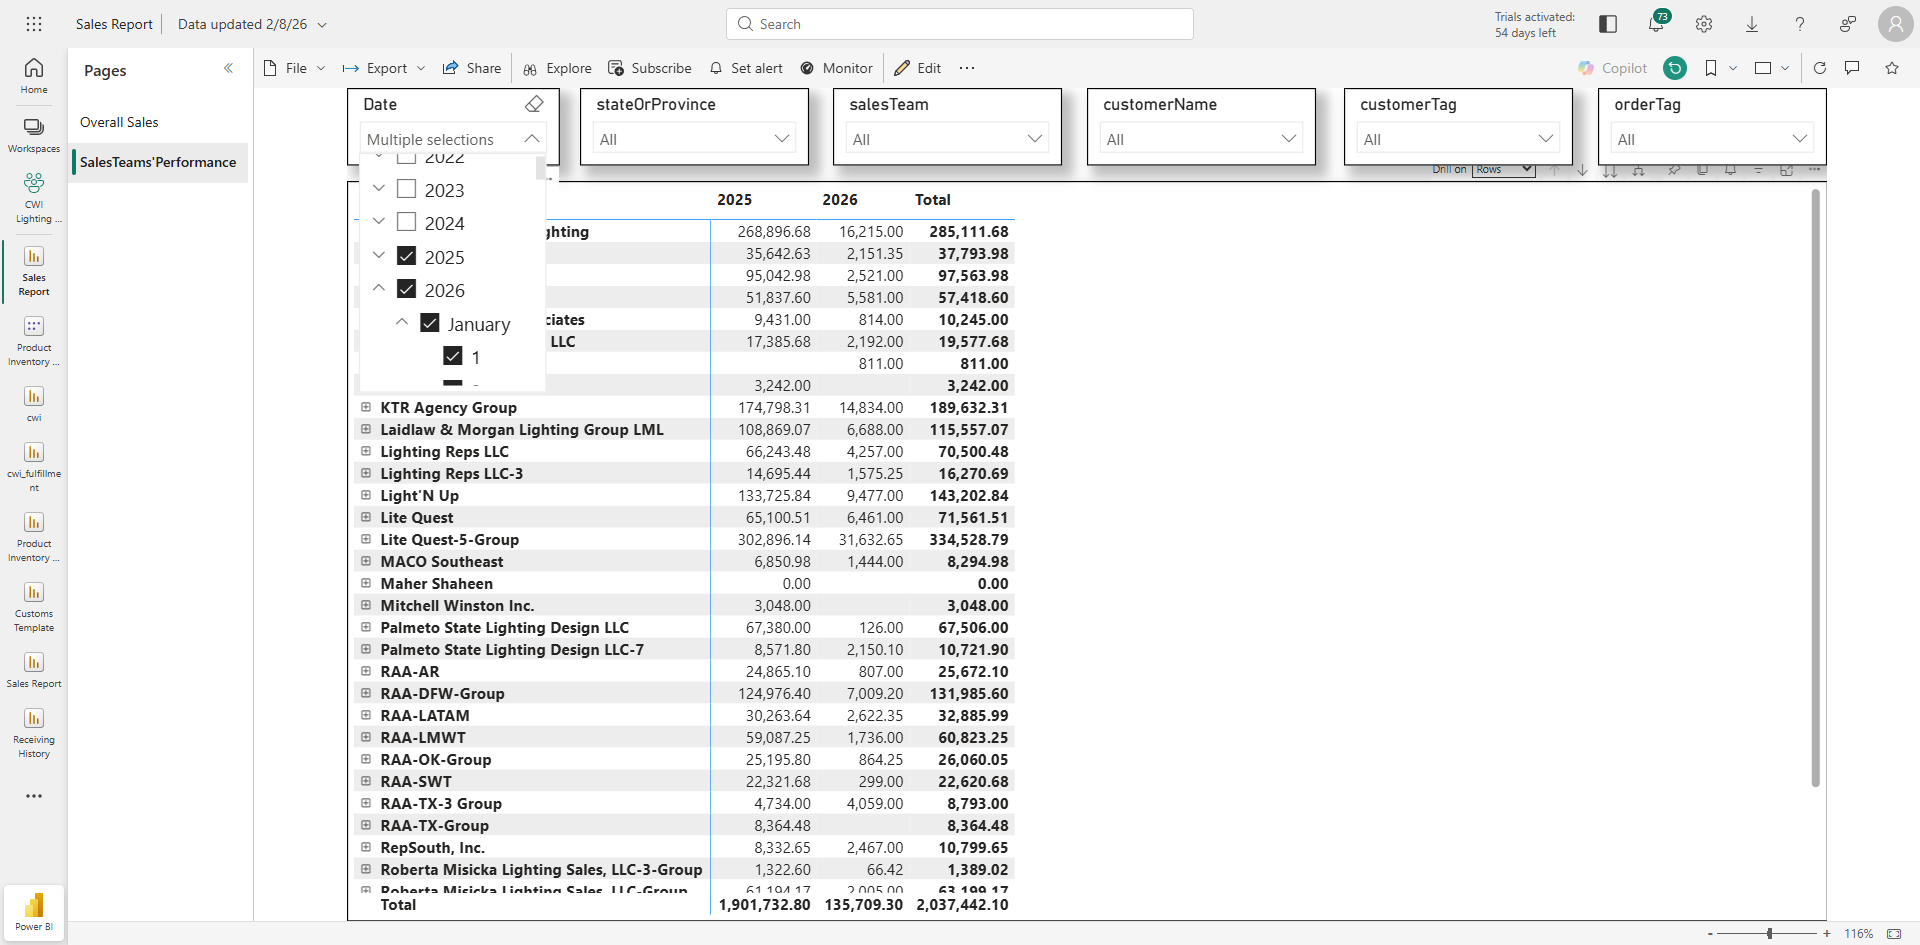
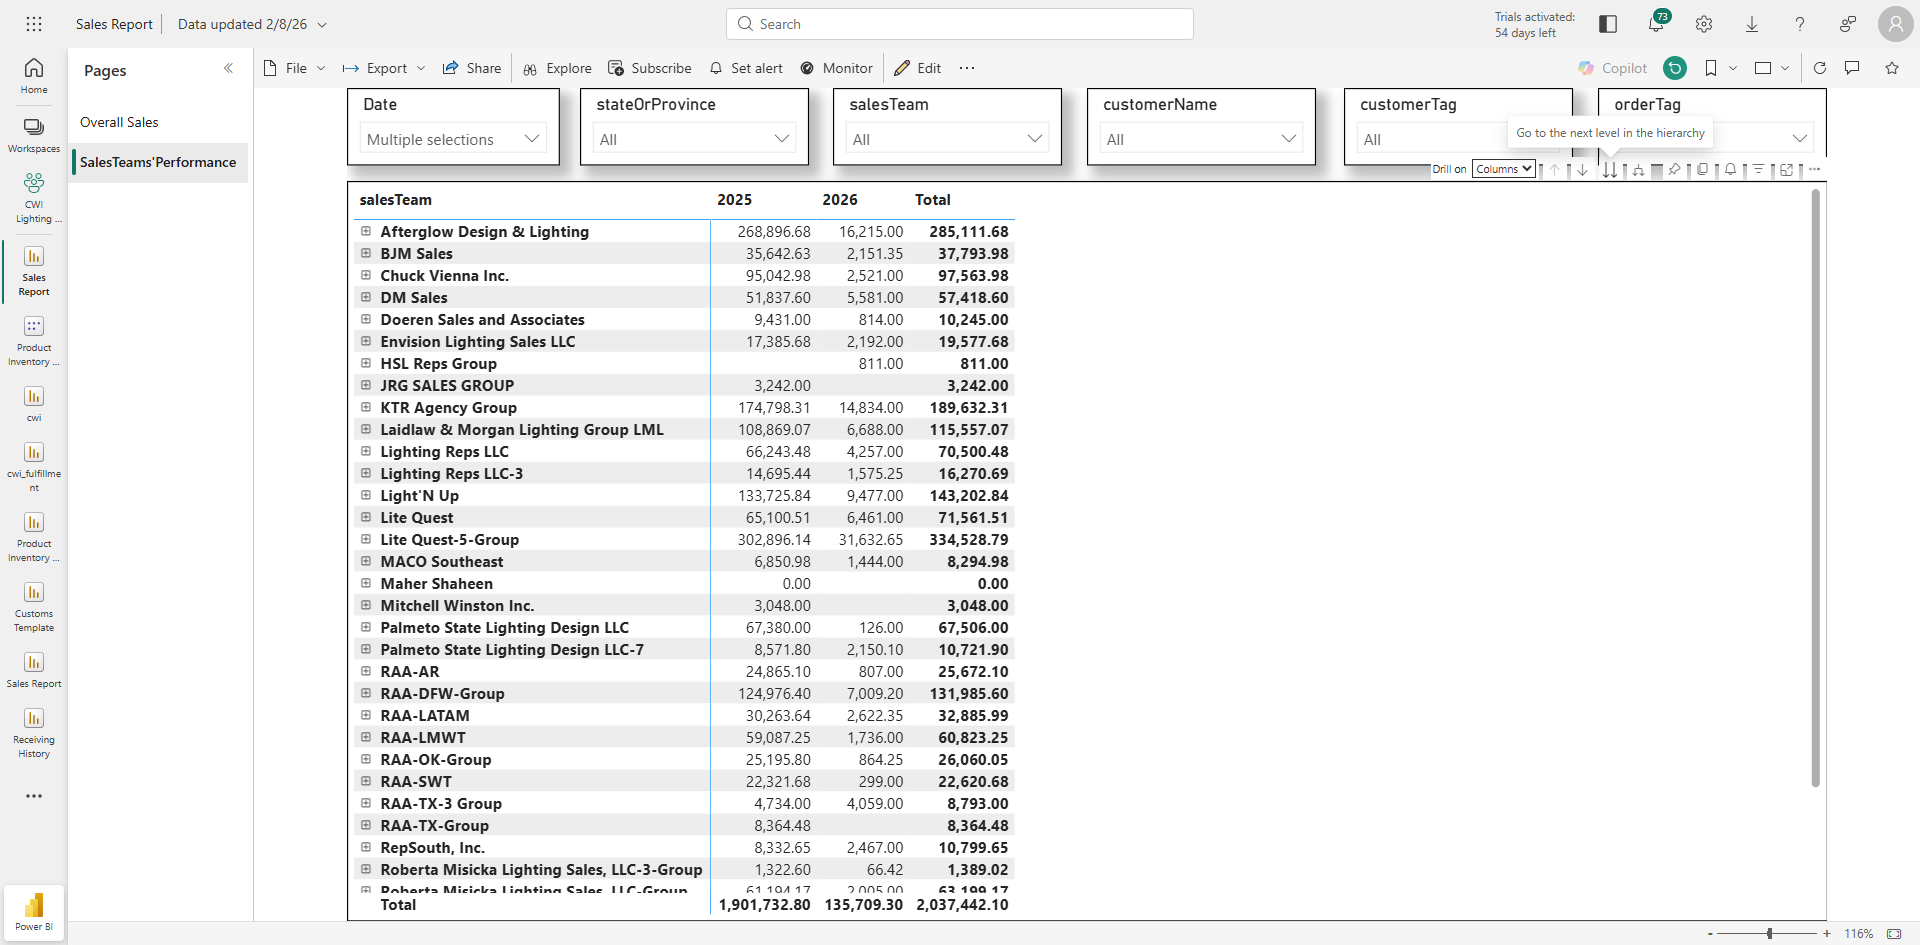
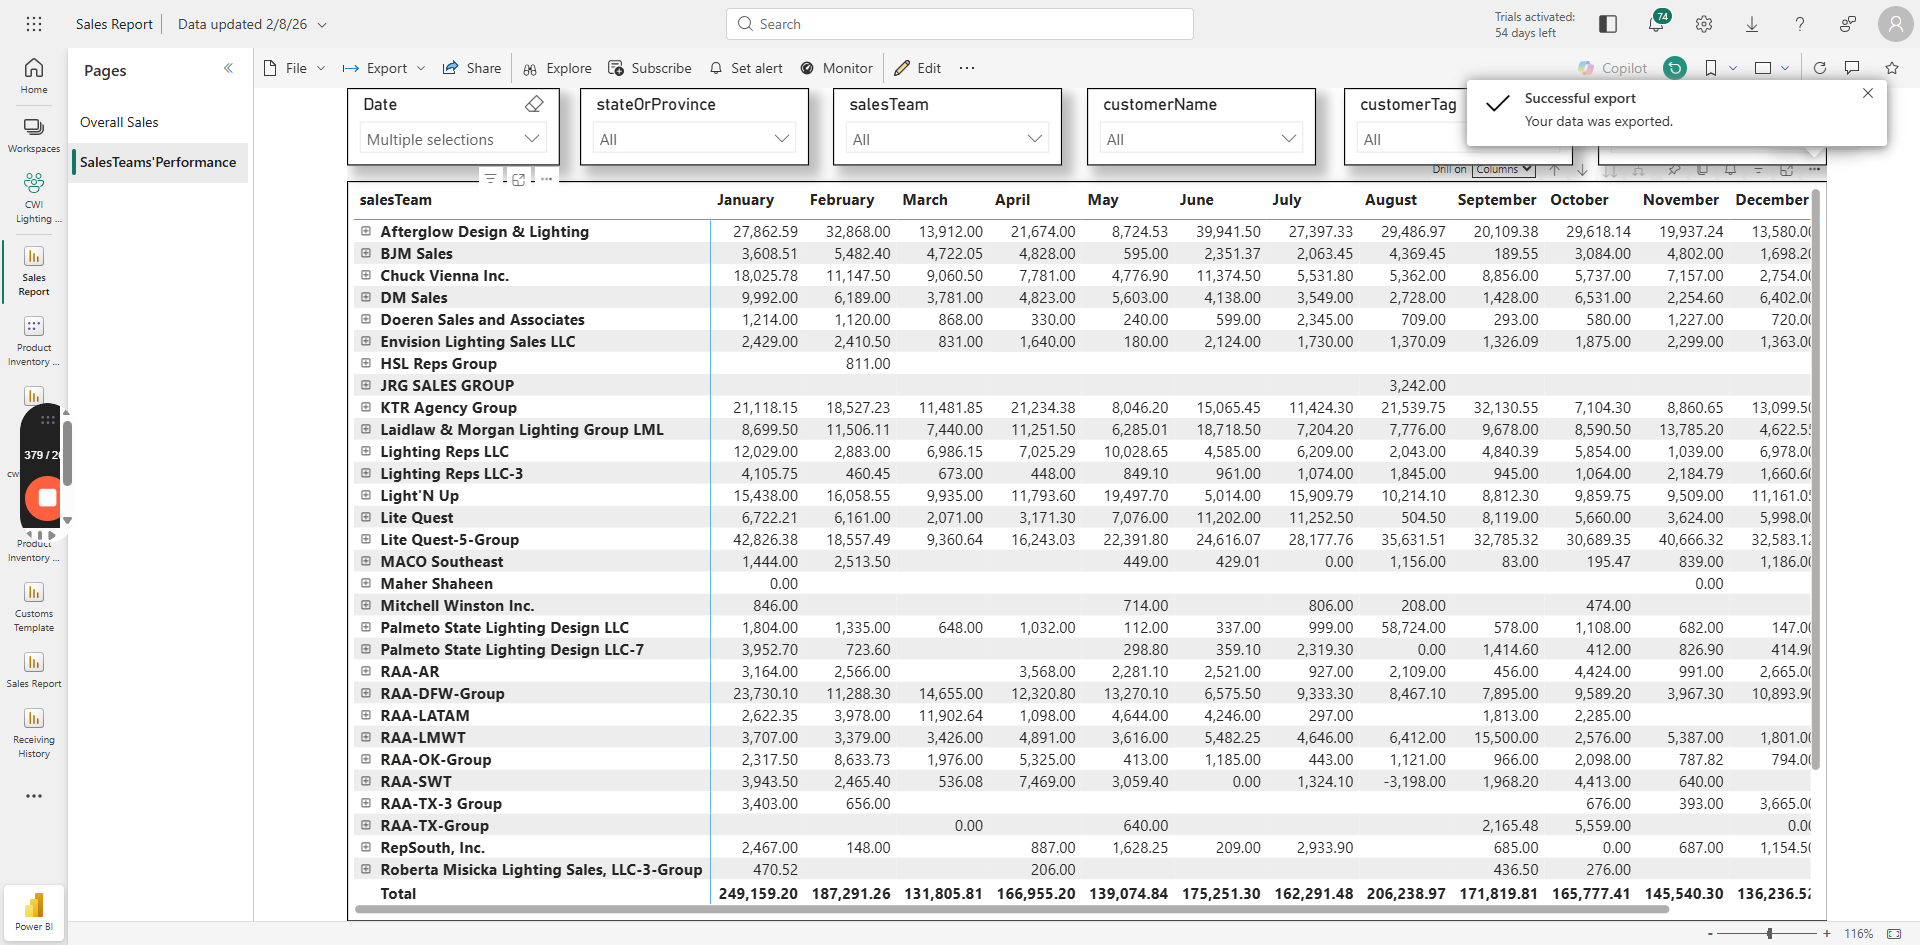
This will display the month-on-month sales revenue for the entire sales team. Now click the three dots again

39
Click on three dots (...)
Step #39: Click on three dots (...)
40
Select "Export Data",
Step #40: Select "Export Data",
41
Choose "Data with Current Layout," and click "Export."
Step #41: Choose "Data with Current Layout," and click "Export."

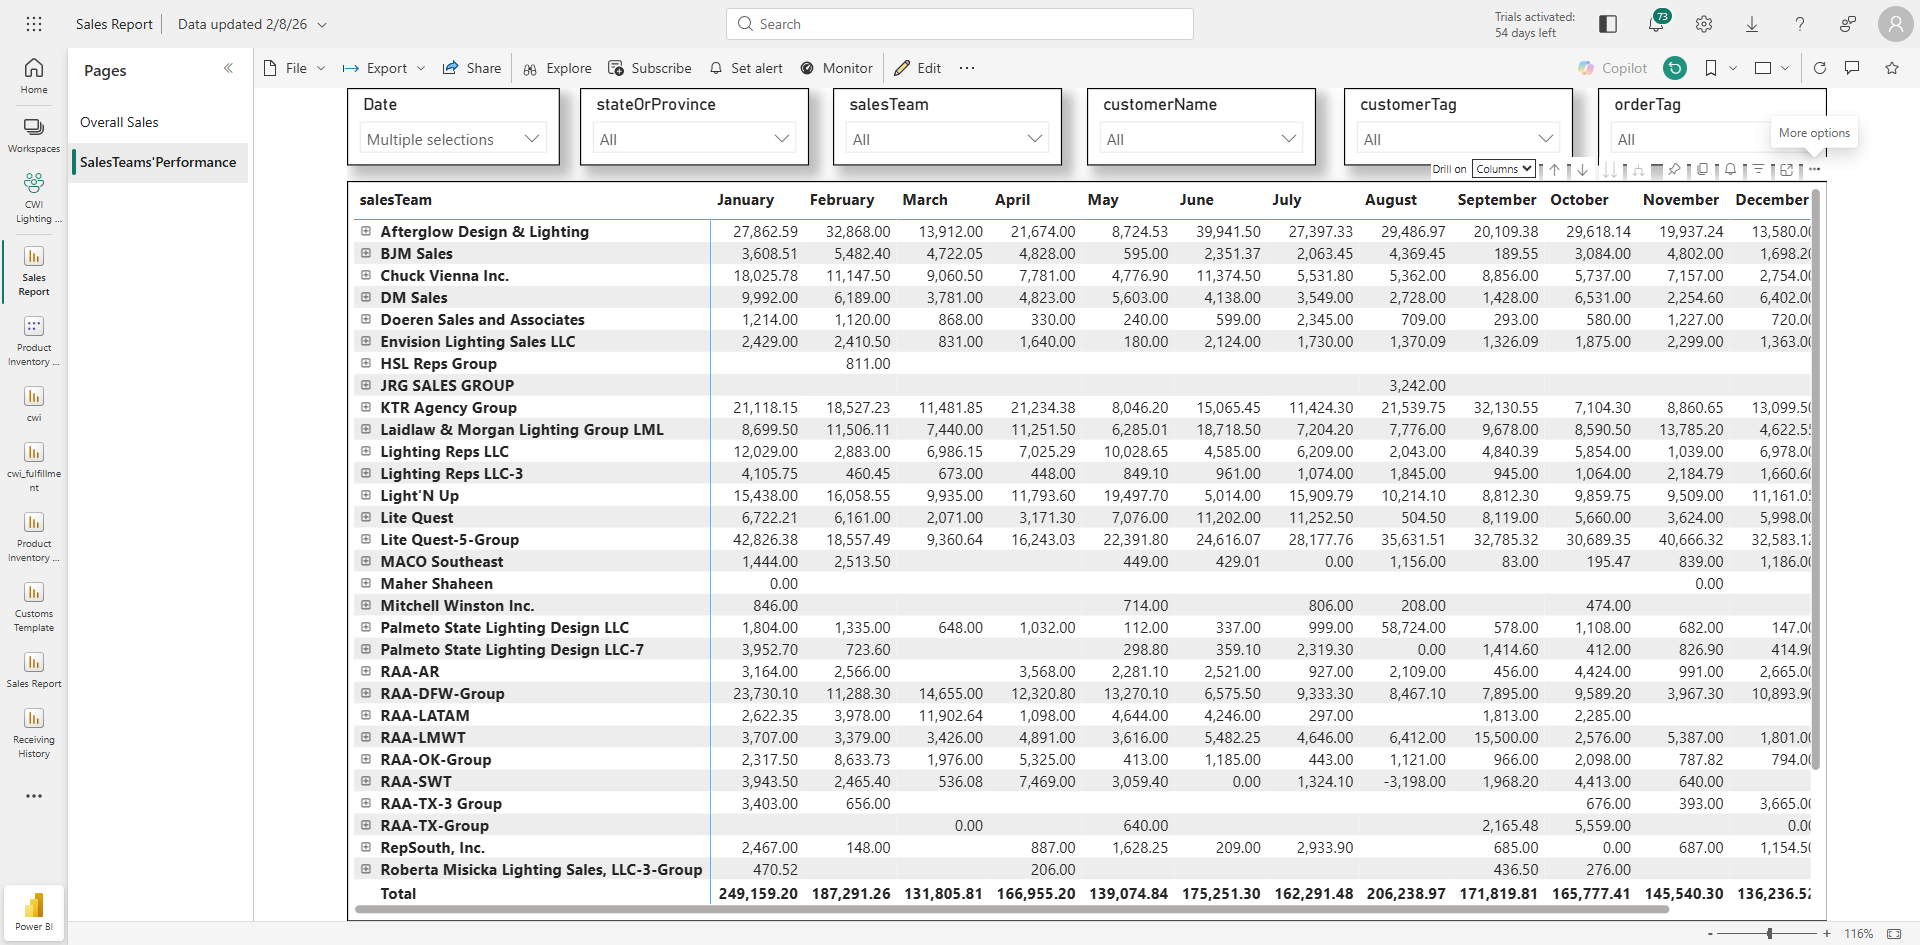
This will show the month-on-month revenue for these sales teams for 2025 and 2026.

42
Select Date
Step #42: Select Date

You can also select a specific year or month in this view also.

43
Select 2025 or any other year or month of your choice.
Step #43: Select 2025 or any other year or month of your choice.

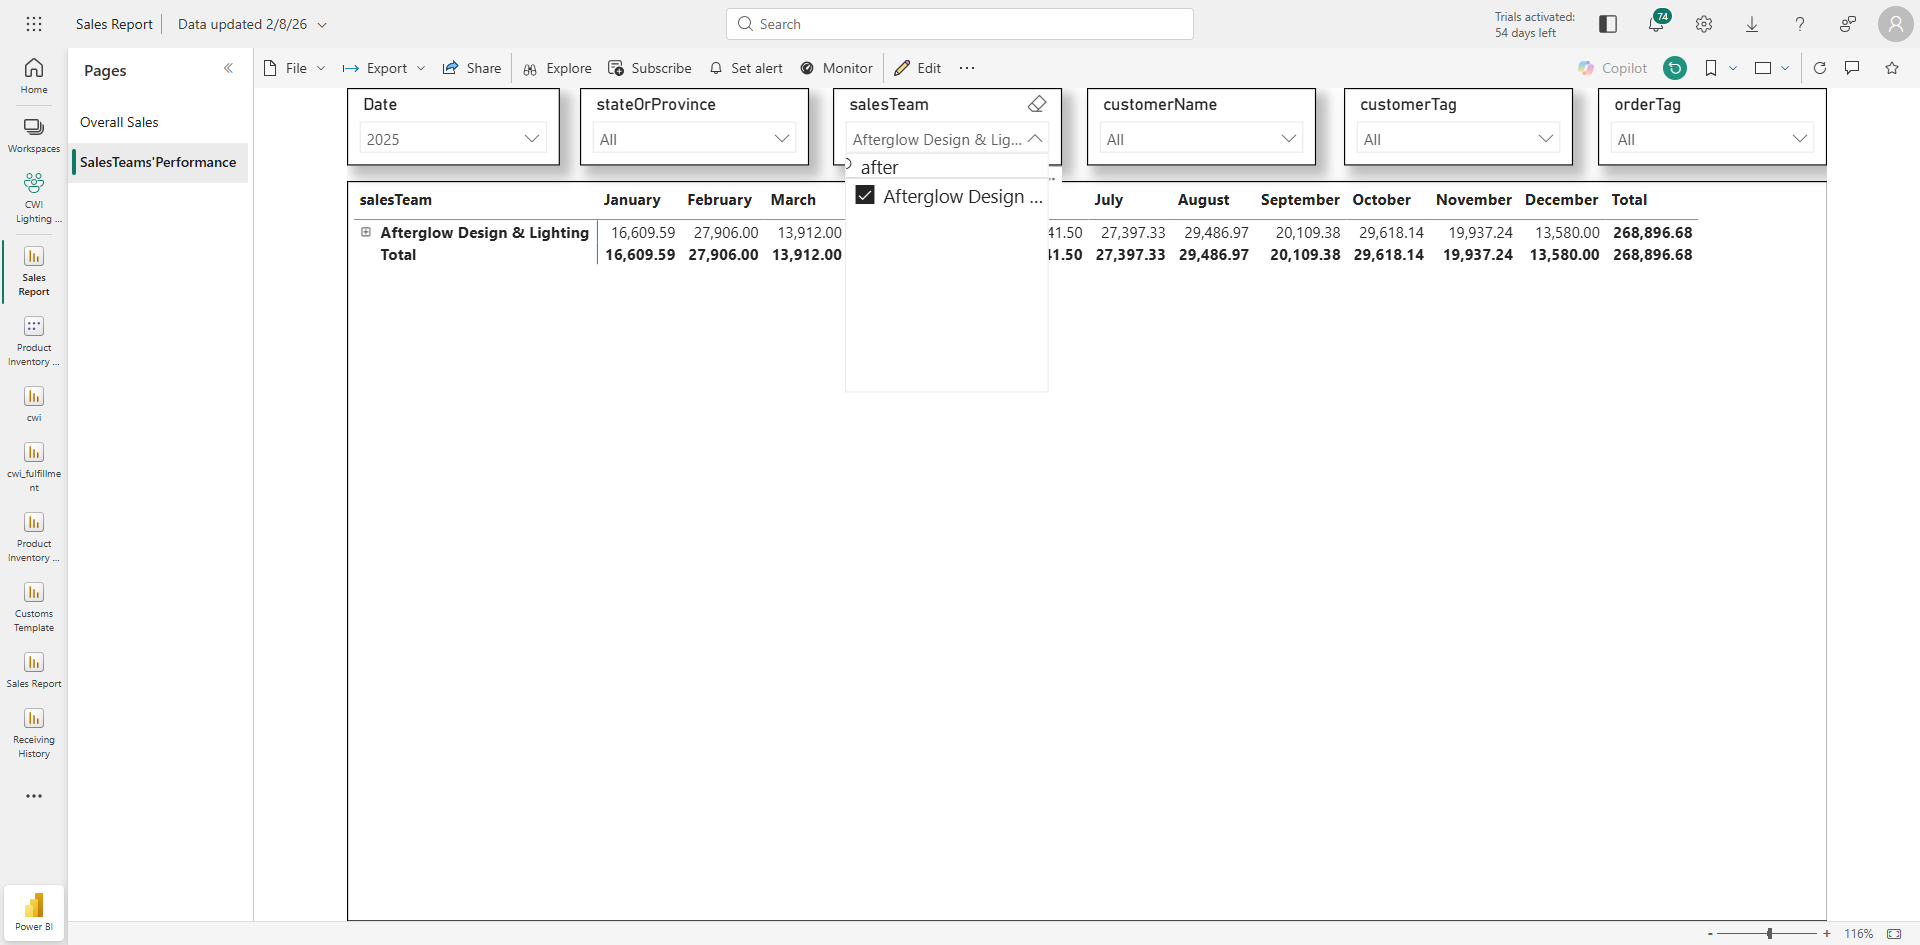
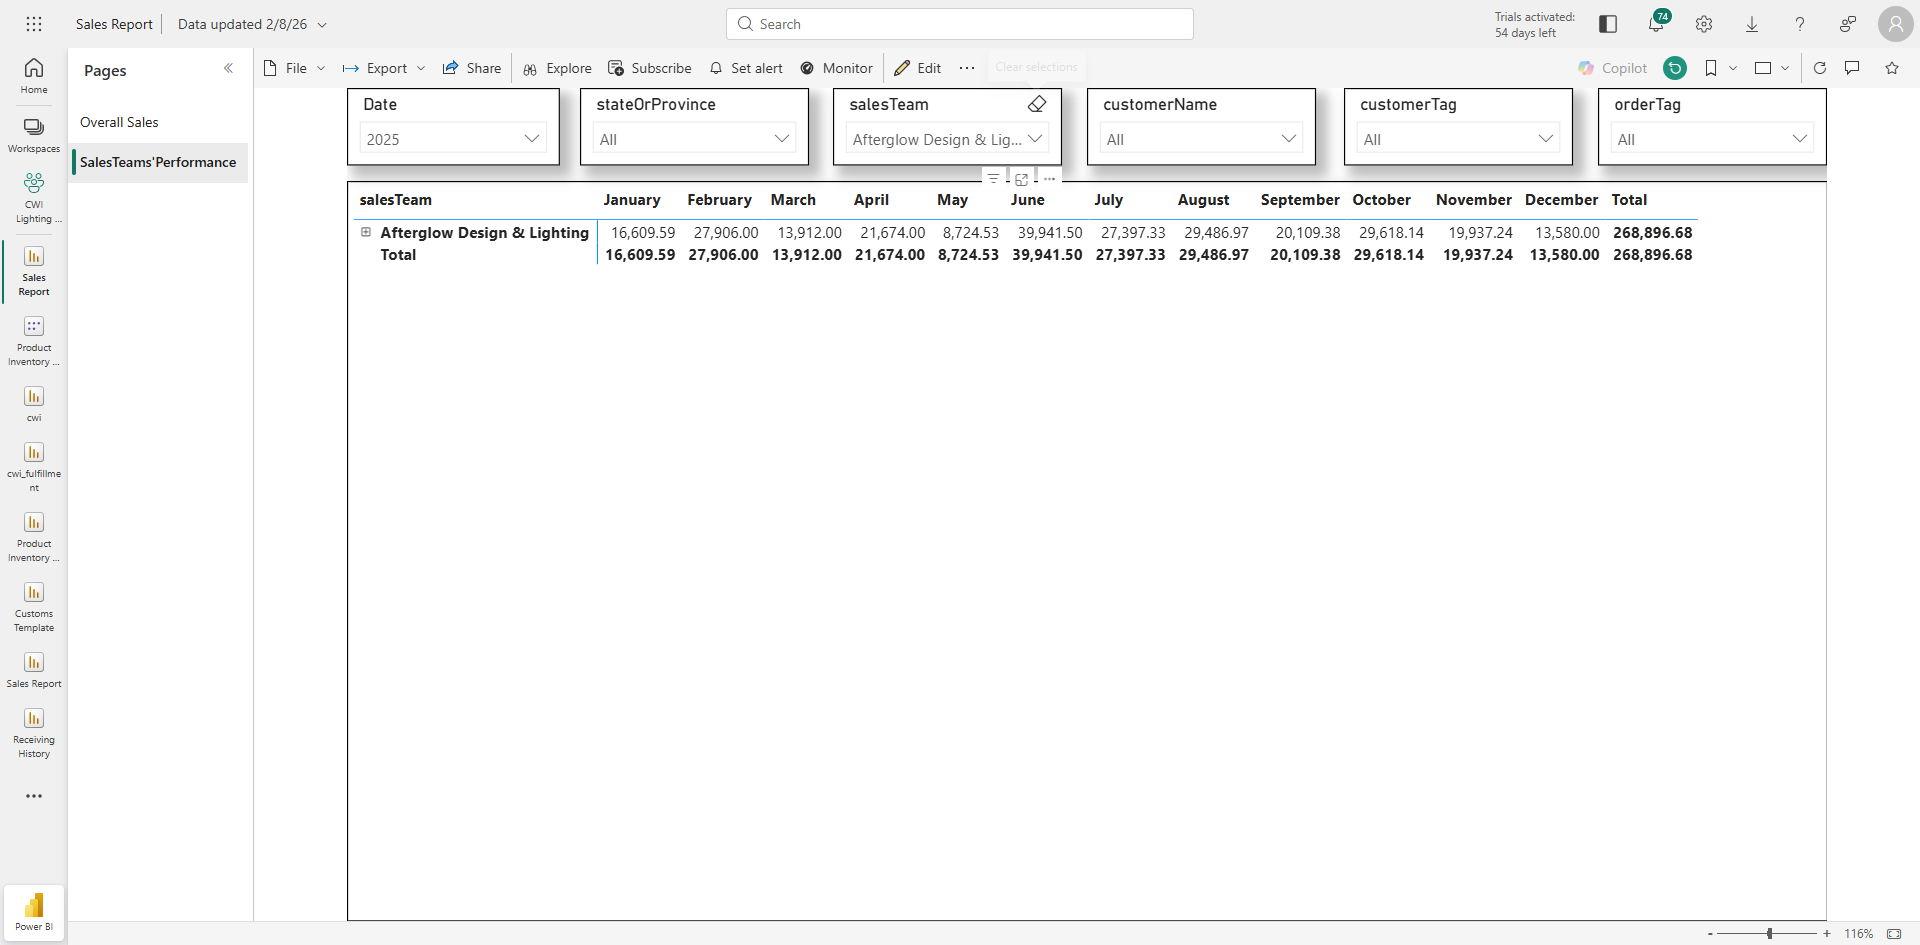
Here, you can also apply the filter at sales team level if you want to select this sales revenue for a specific sales team.

44
Go to Sales Team slicer
Step #44: Go to Sales Team slicer
45
Select or type the required sales team name
Step #45: Select or type the required sales team name

46
Here I am taking Afterglow as an example
Step #46: Here I am taking Afterglow as an example
47
Then clear the filter if you want to see overall revenue.
Step #47: Then clear the filter if you want to see overall revenue.
Slicers/Filters can be used to filter data at time period, customer accounts, invoices or product level as per requirement and then further required visual data can be downloaded by clicking the thee dots on the visual (...). You will see these three dots as soon as you will hover over the required visual.
Power BI Sales Report: Step-by-Step Guide