
Tracking Daily Launch Stats for Ignite Your Narrative Masterclass and StoryPro
Monitor daily sales, email stats, and sales page performance for the Ignite Your Narrative Masterclass and StoryPro during the extended launch phase.
In this guide, we'll learn how to track and update daily sales and email statistics during the launch phase of the Ignite Your Narrative Masterclass. This process involves using various tools such as Google Sheets, ThriveCart, ConvertKit, and Lucky Orange to gather and record data. By following these steps, you will ensure accurate tracking of sales, email performance, and website analytics, which are crucial for evaluating the success of the launch.
Let's get started
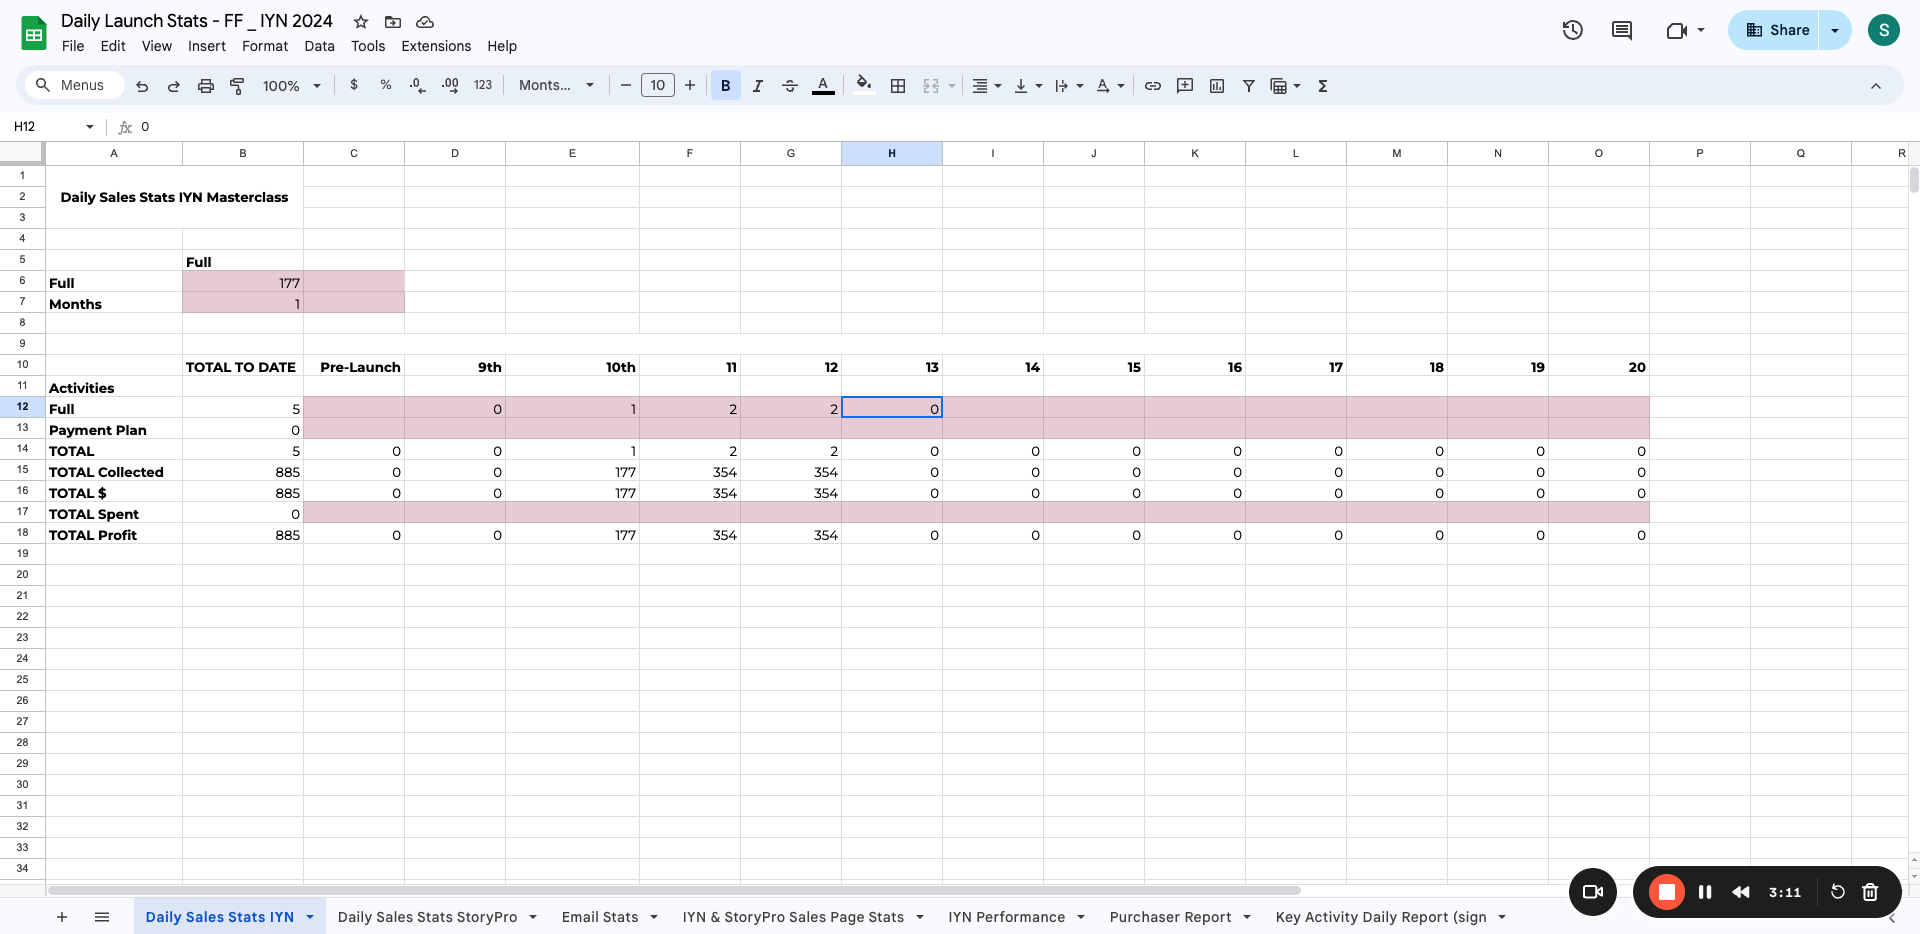
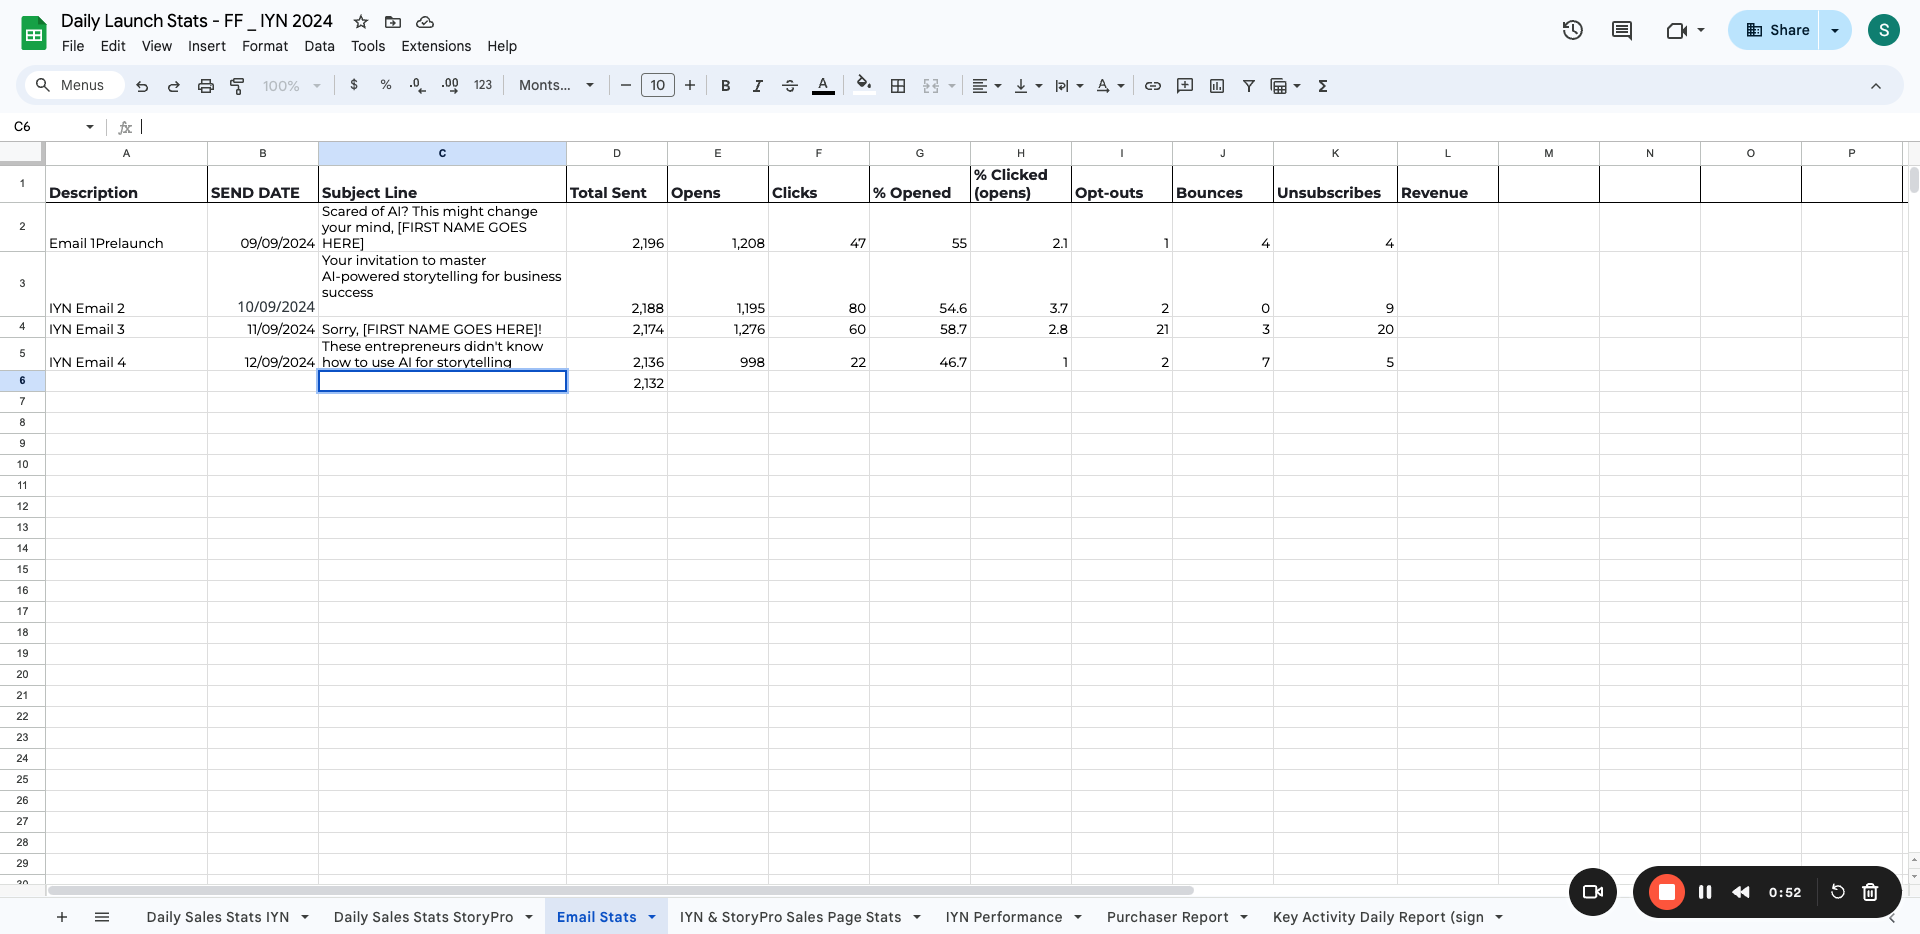
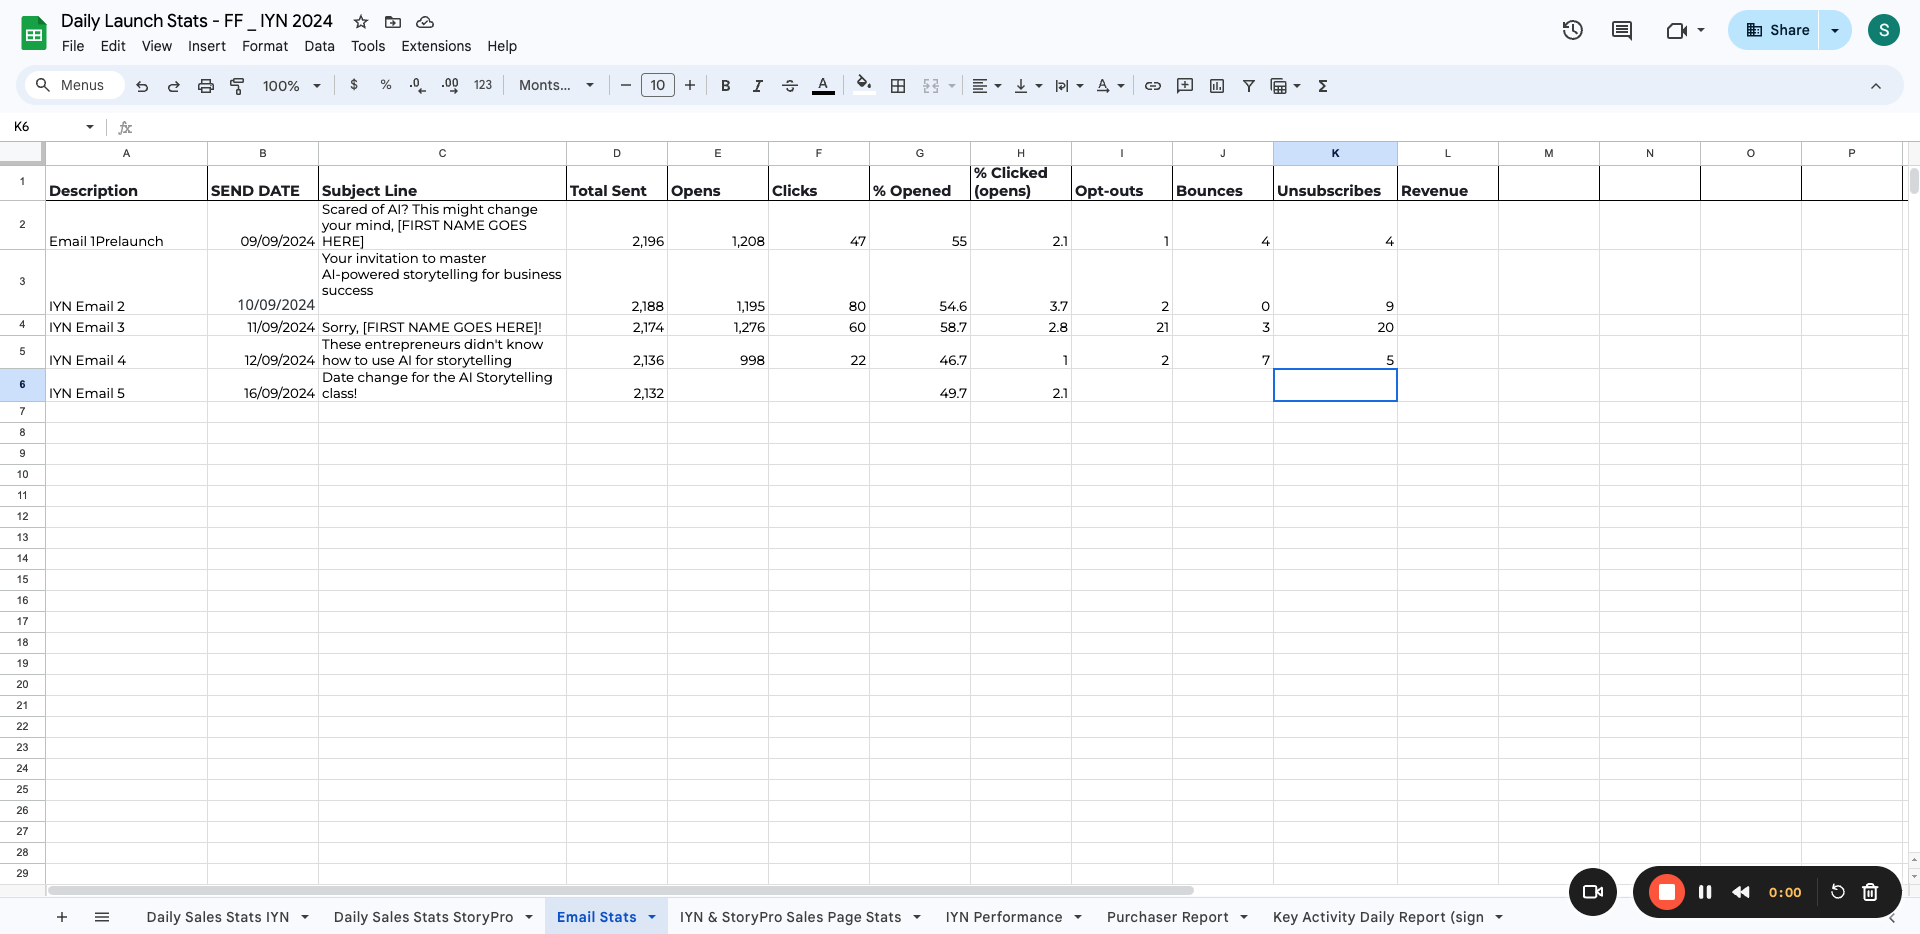
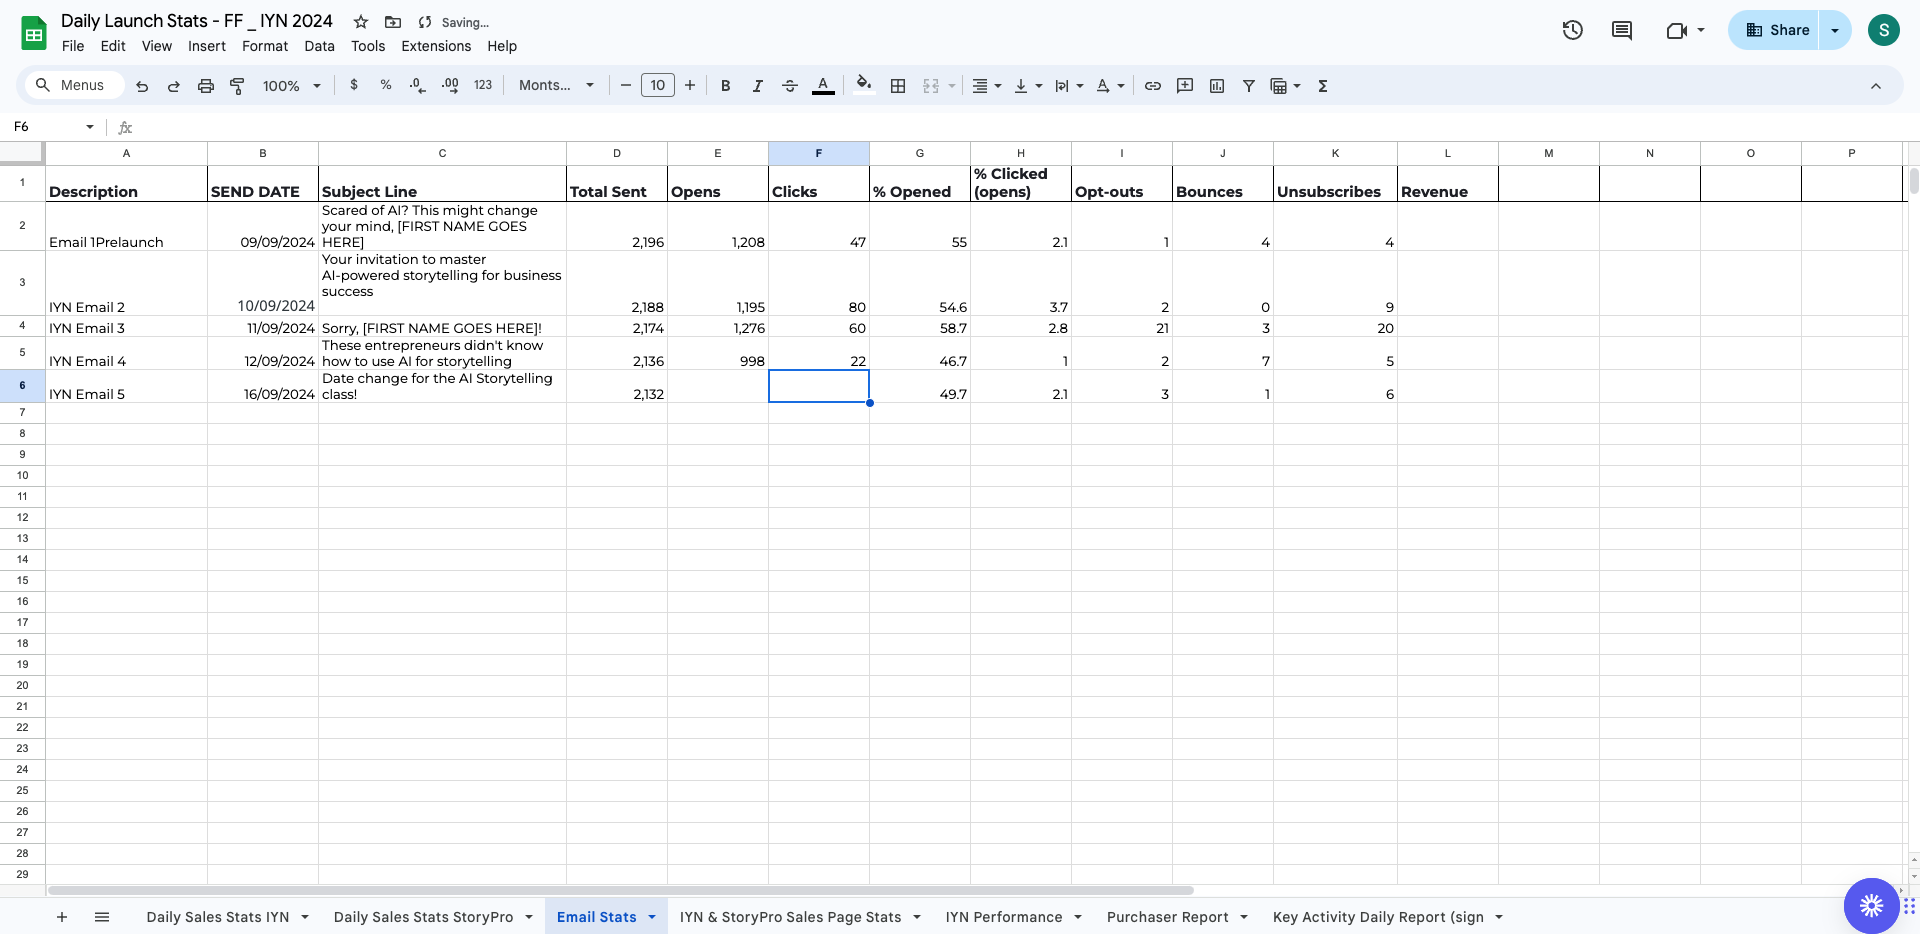
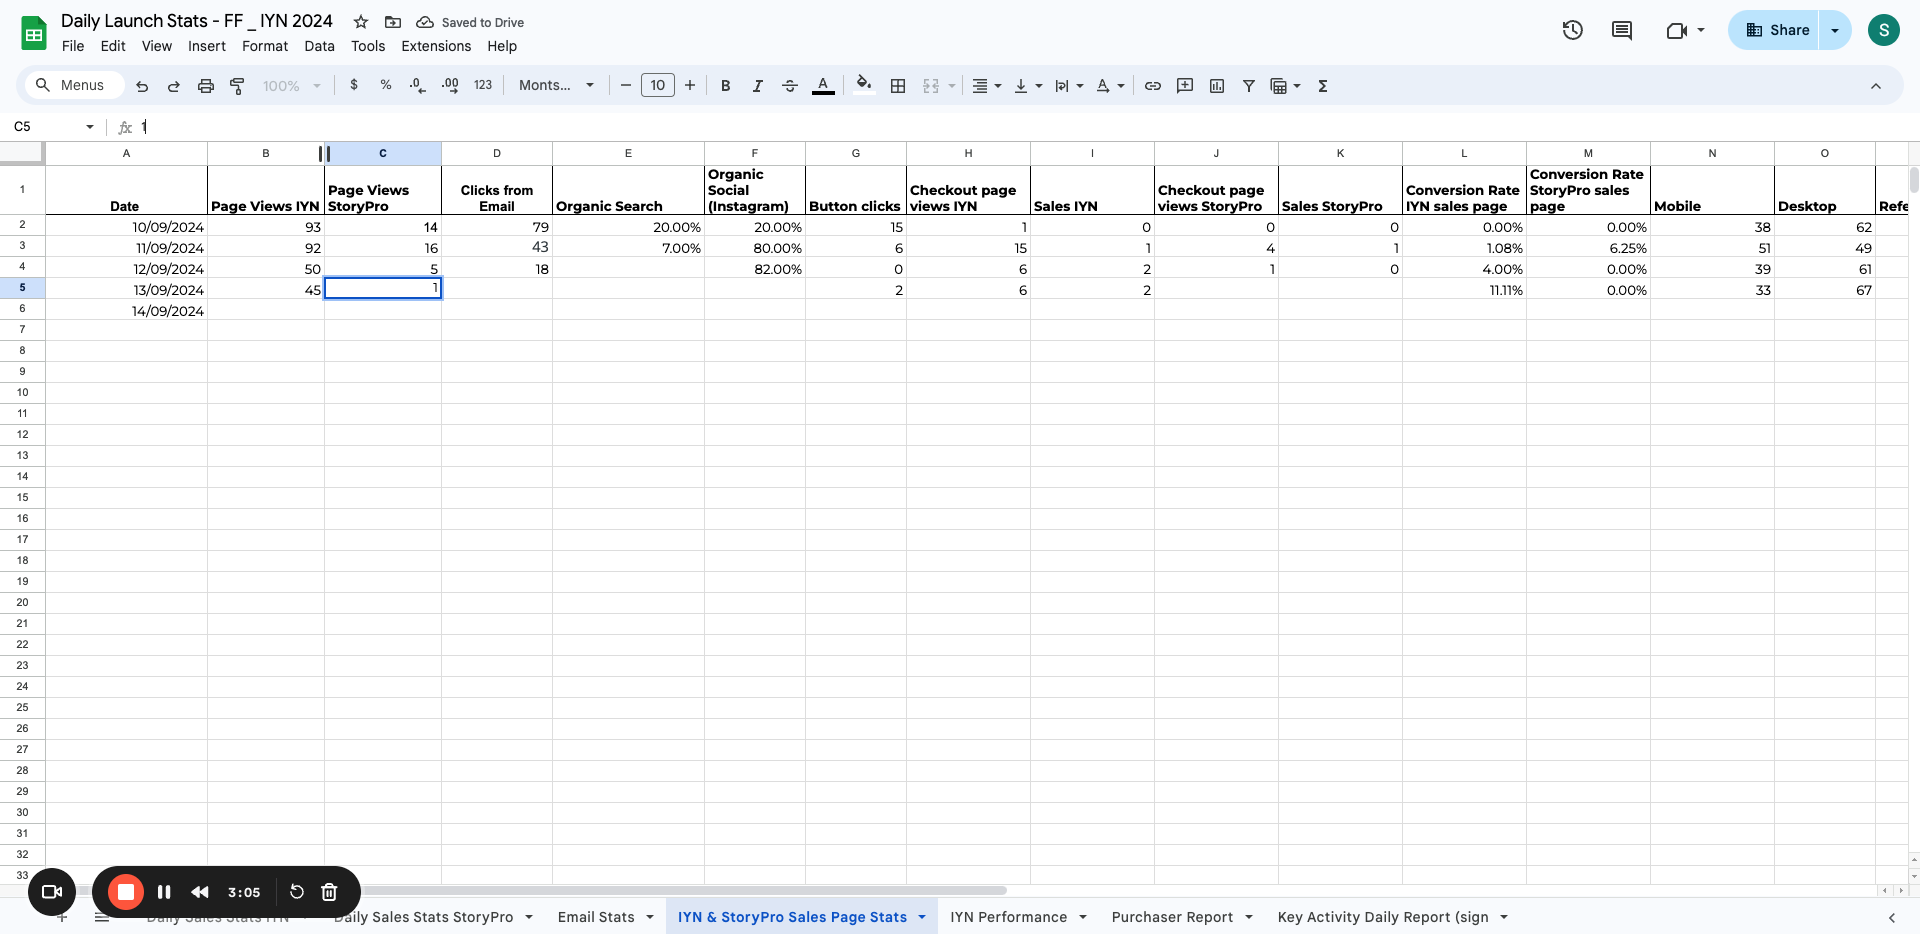
These are the launch stats. We are tracking this daily during the launch phase.
This is a stretched launch phase, so it will be a longer process. On the first tab, we need to track all the daily sales for the Ignite Your Narrative Masterclass.
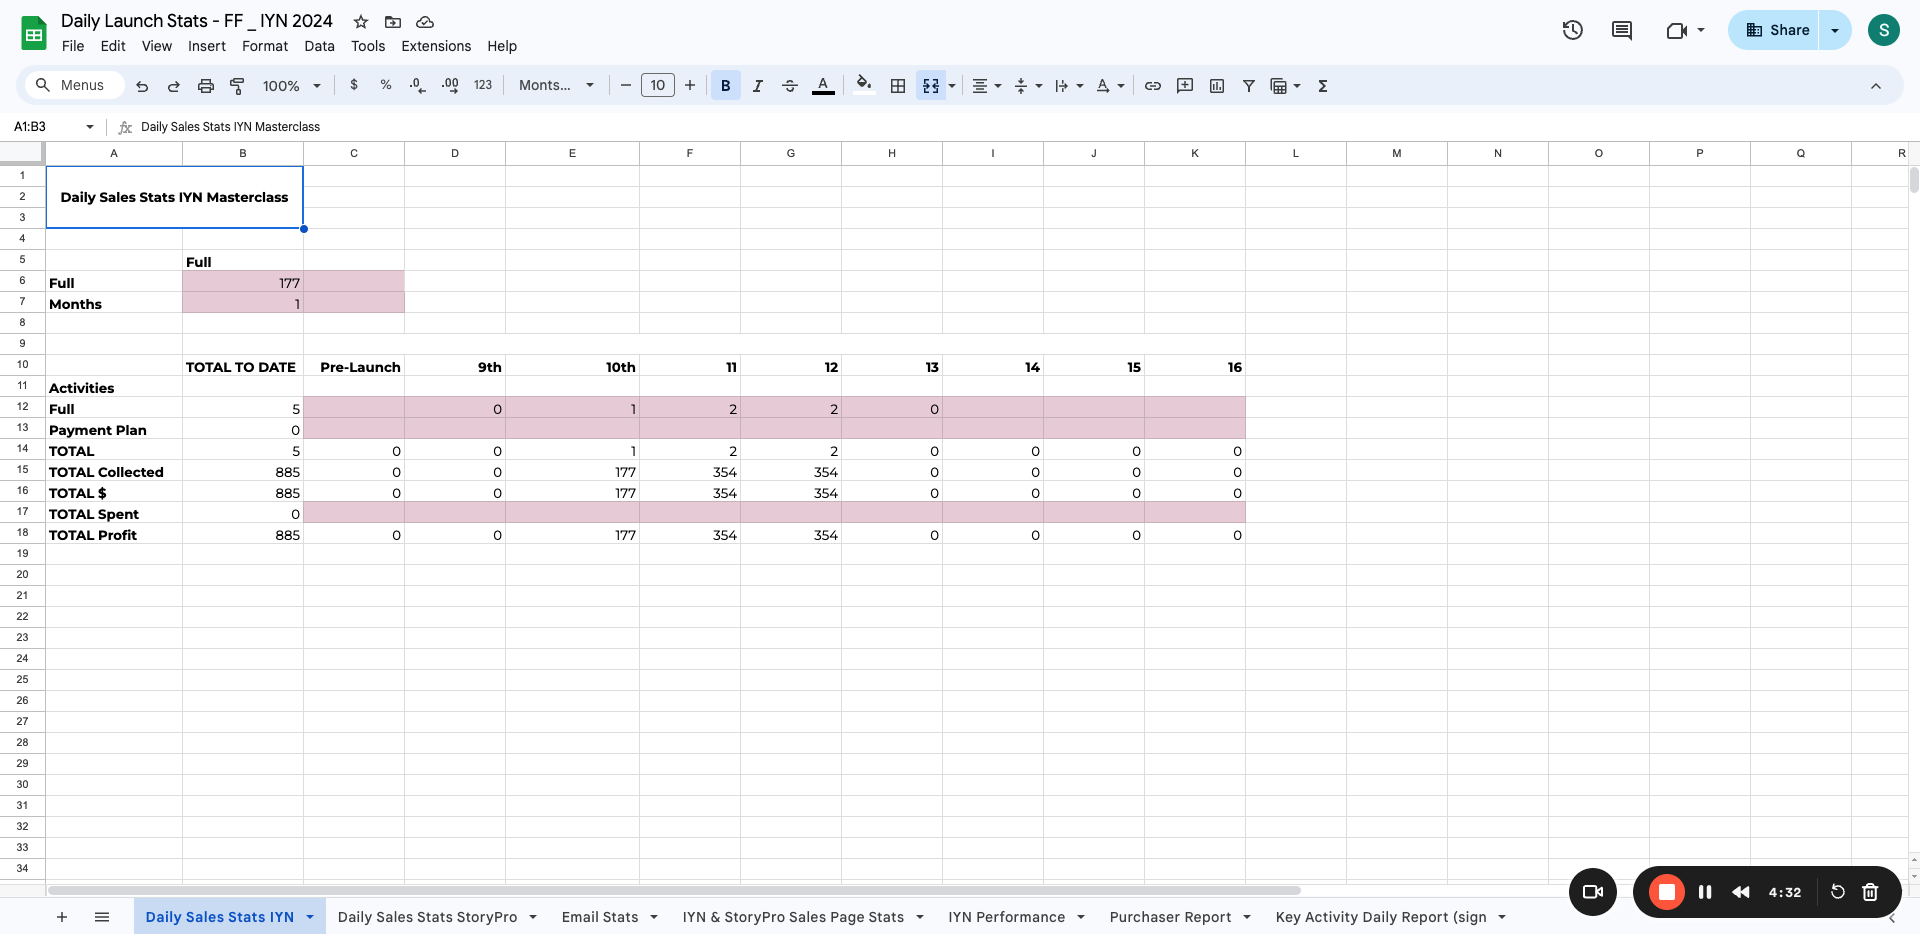
We need to add more dates here.
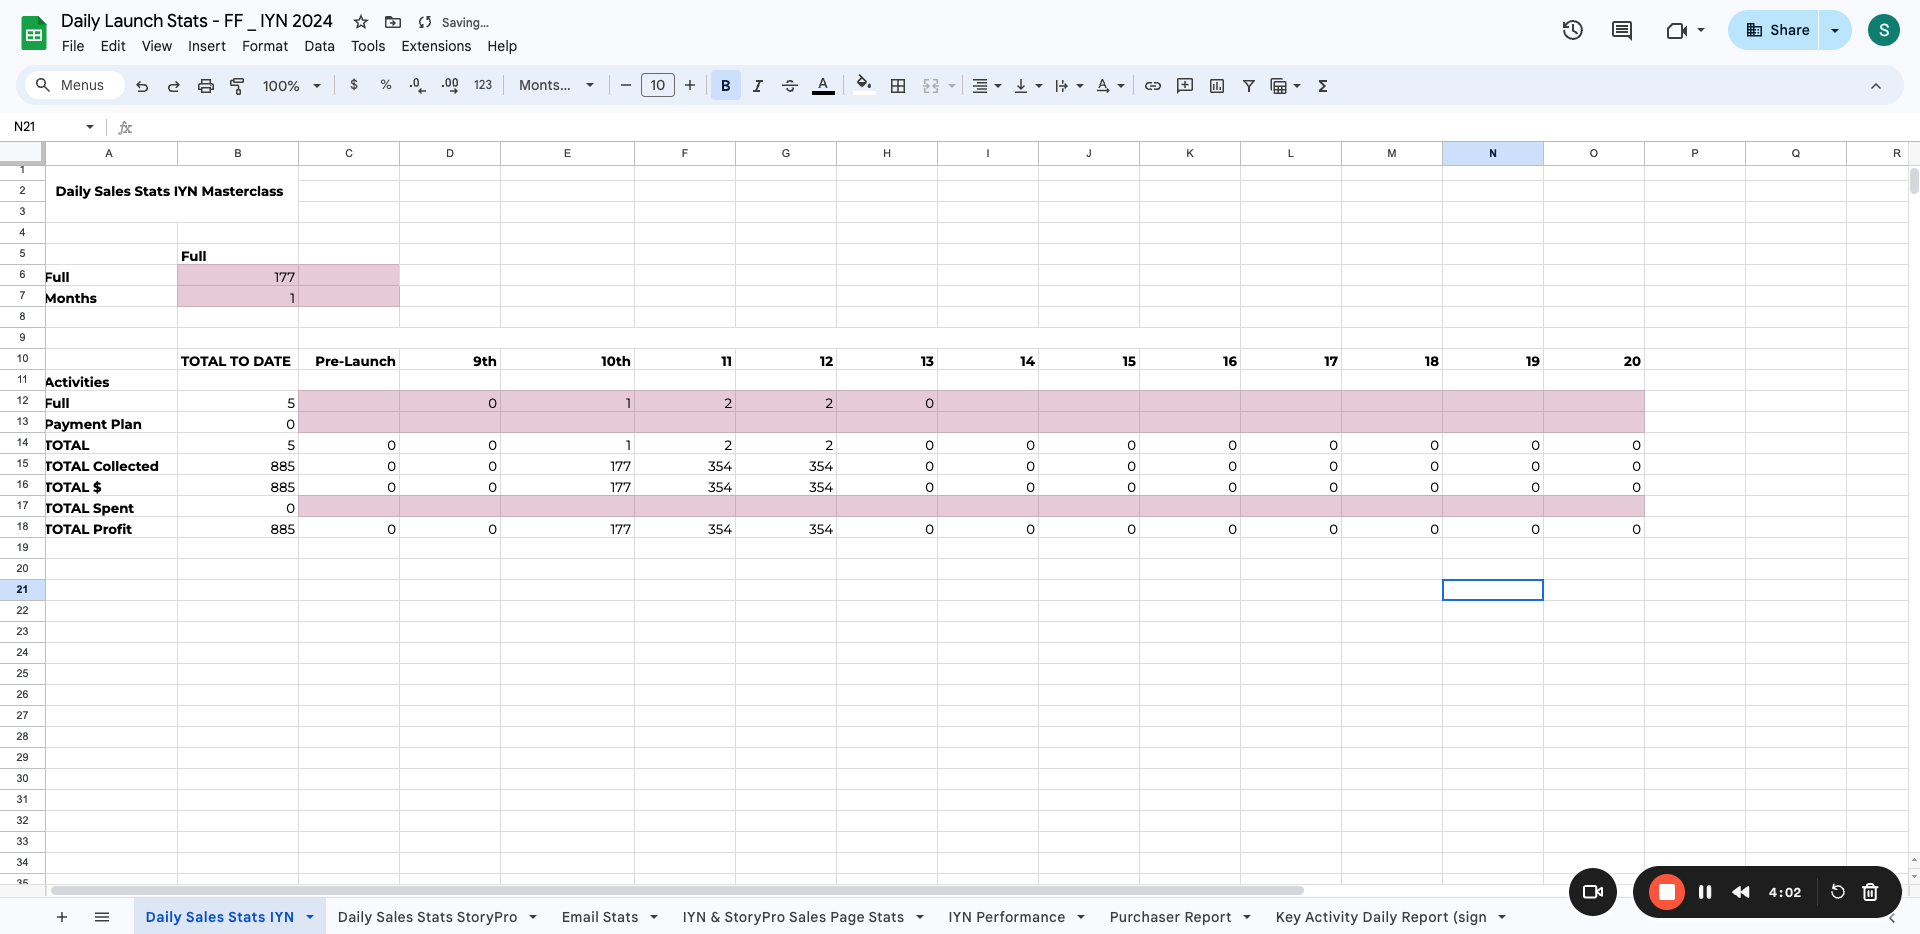
Columns here: 17, 18, 19, 20, and so on.
If you need more columns, simply add them.
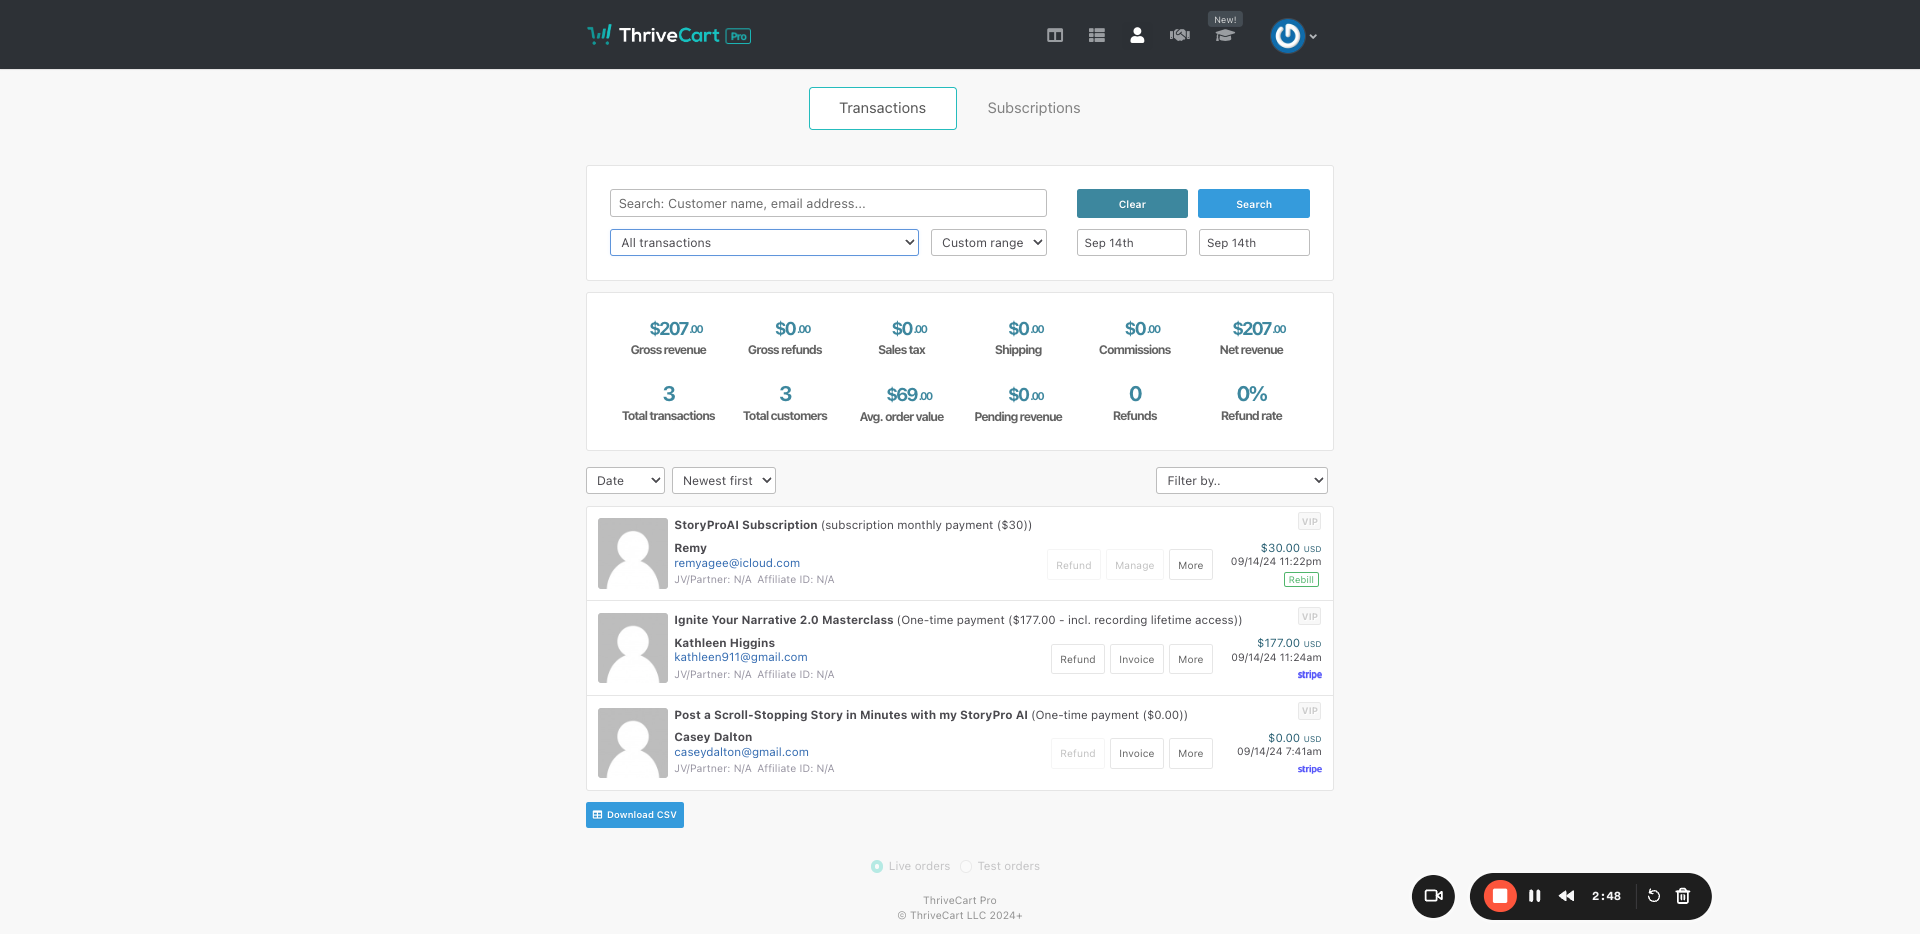
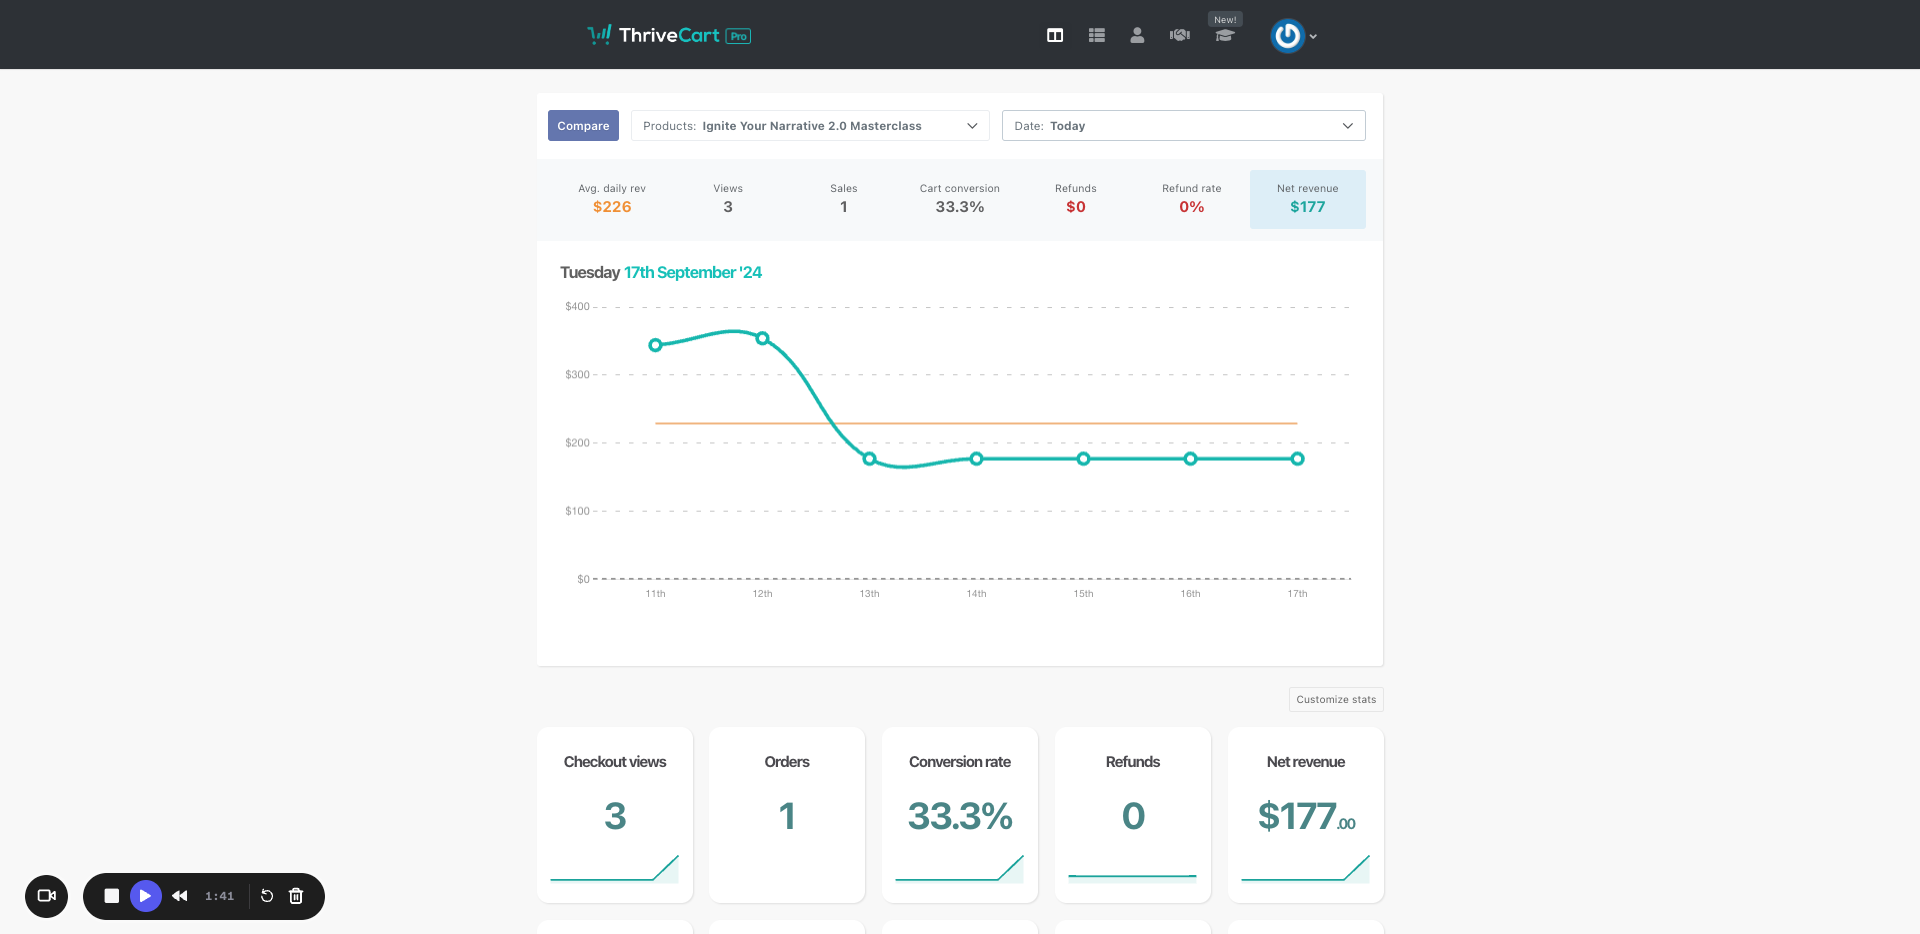
Go to Thrivecart and click on Transactions.
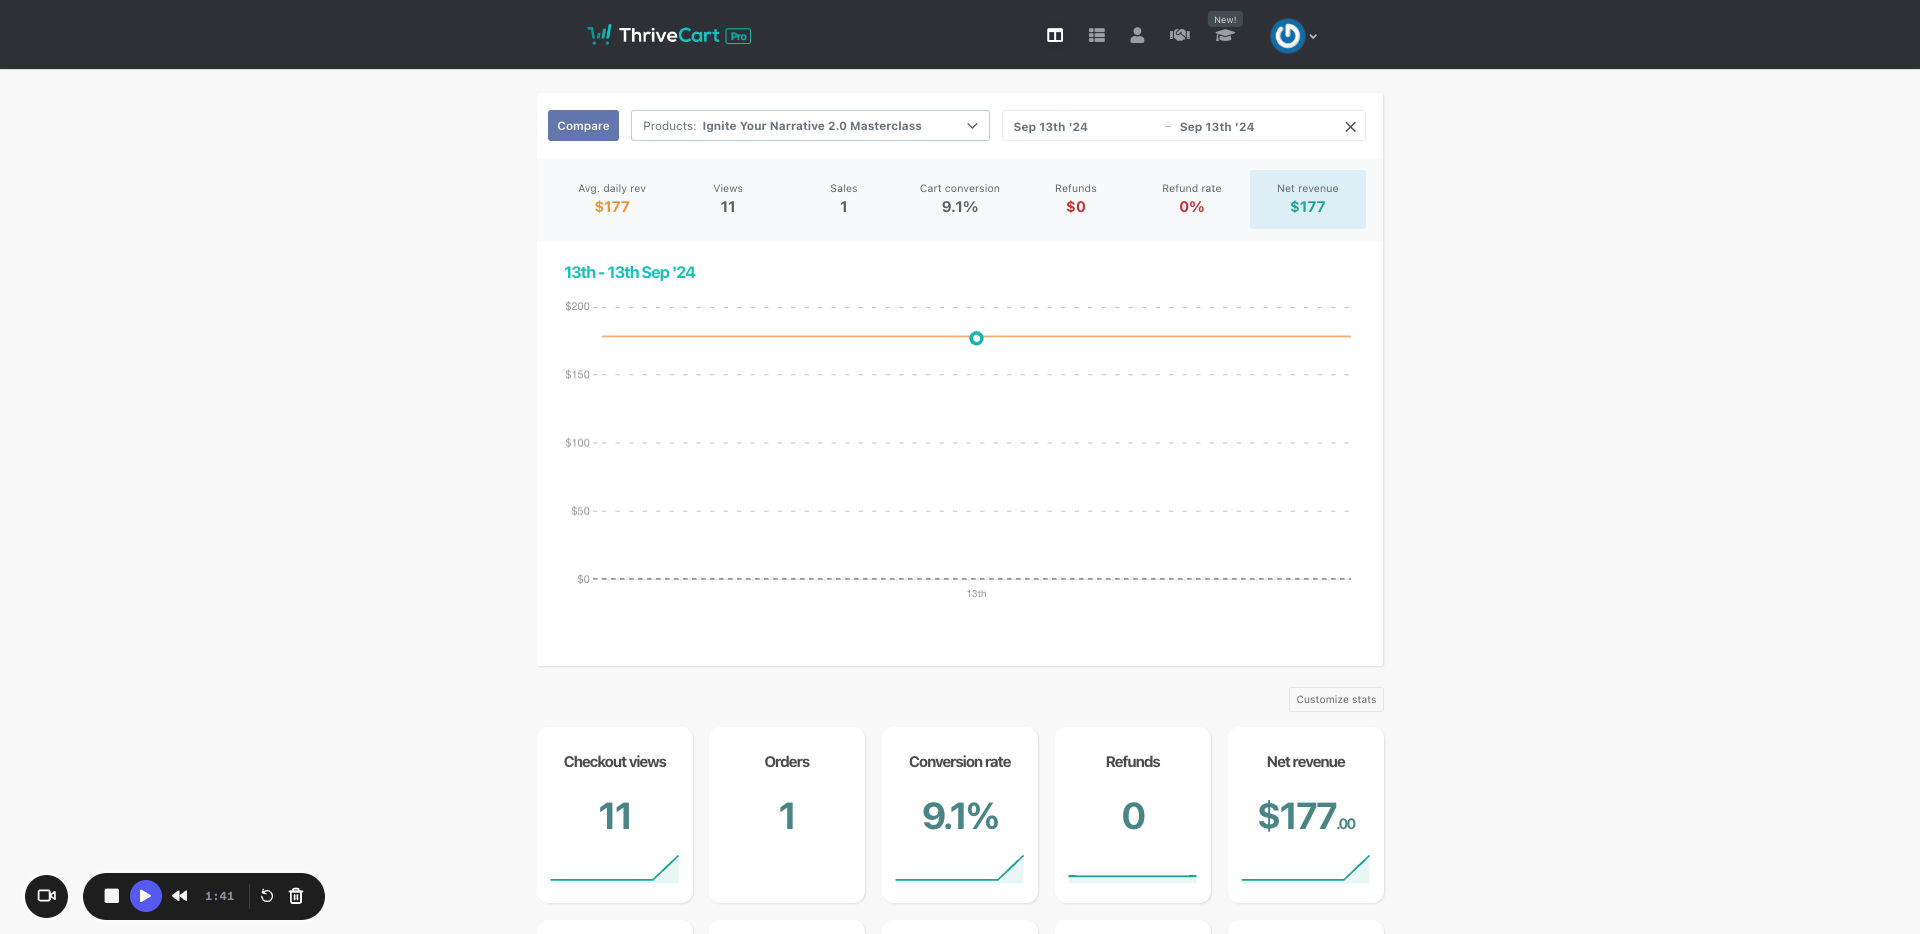
We are now looking for the sales stats for the 13th. Go to Custom Range and double-click on it to display only those stats.

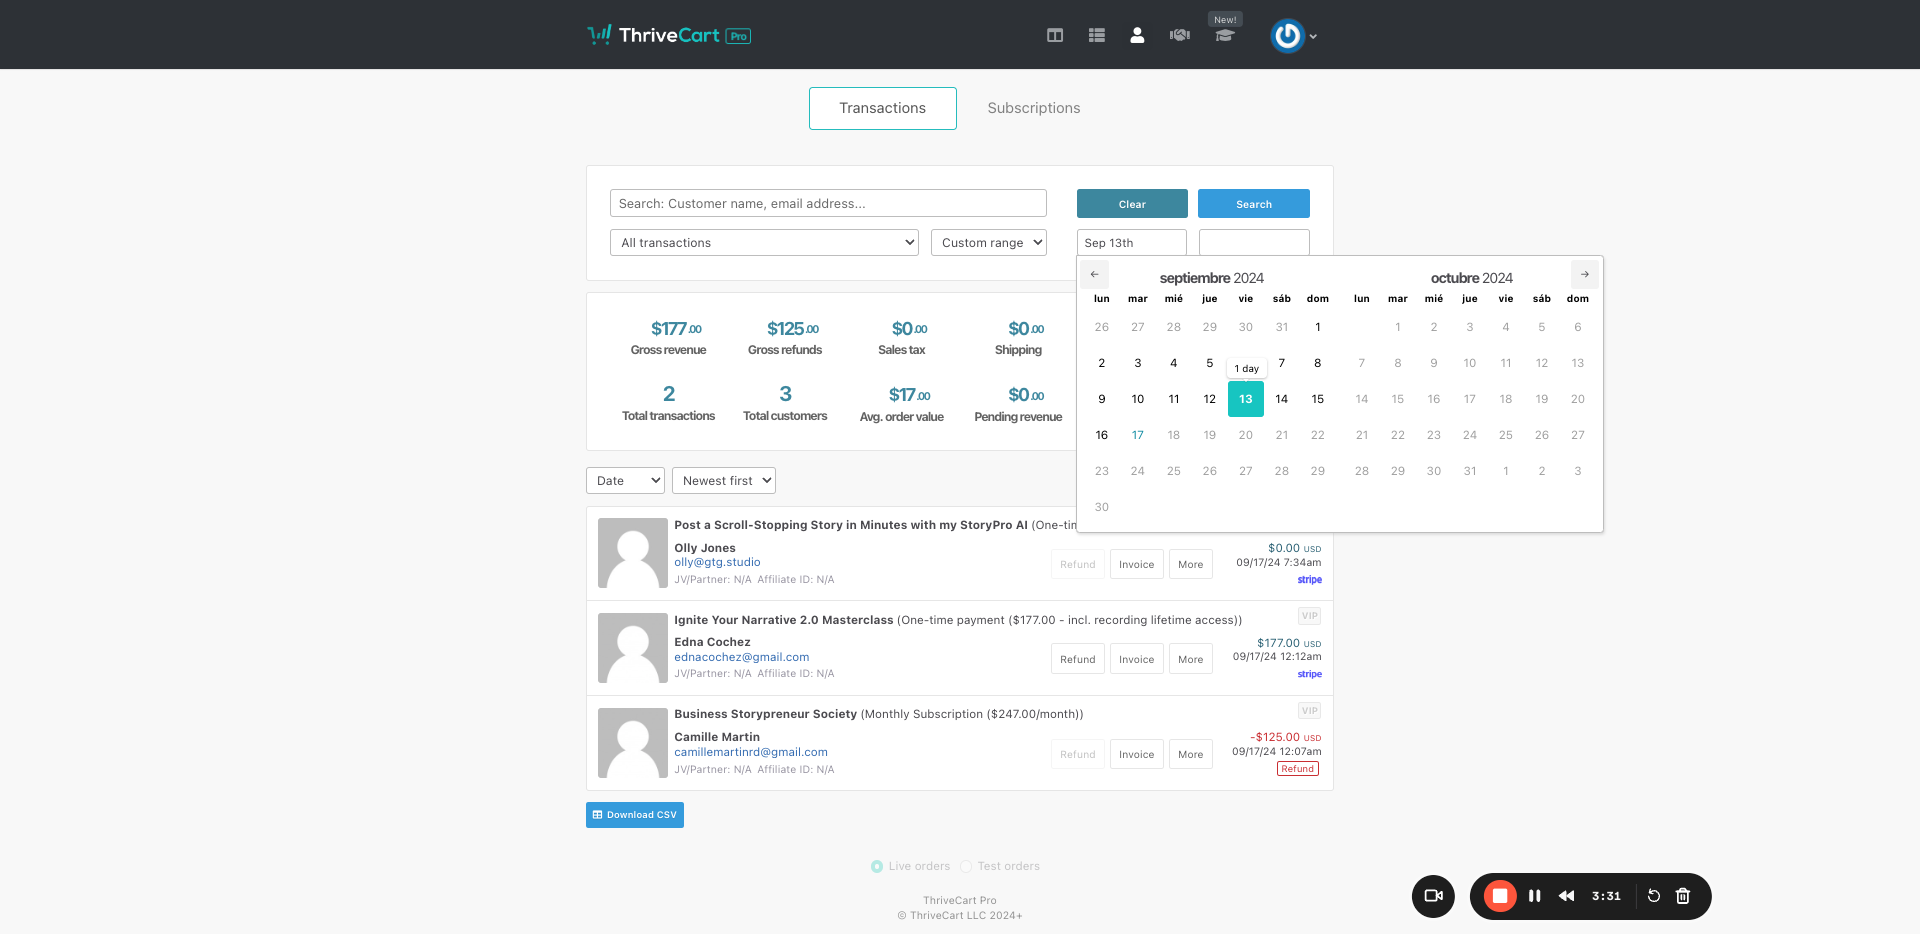
We have one sale for the Ignite Your Narrative Masterclass one-time payment. Going back to the 13th, we see this sale, and that's it.
Now, do the same for all the other days. Go back and look for the 14th.
We have a sale for Ignite Your Narrative. You can also choose products here without looking at all of them.

That's easier: one sale for the 14th.
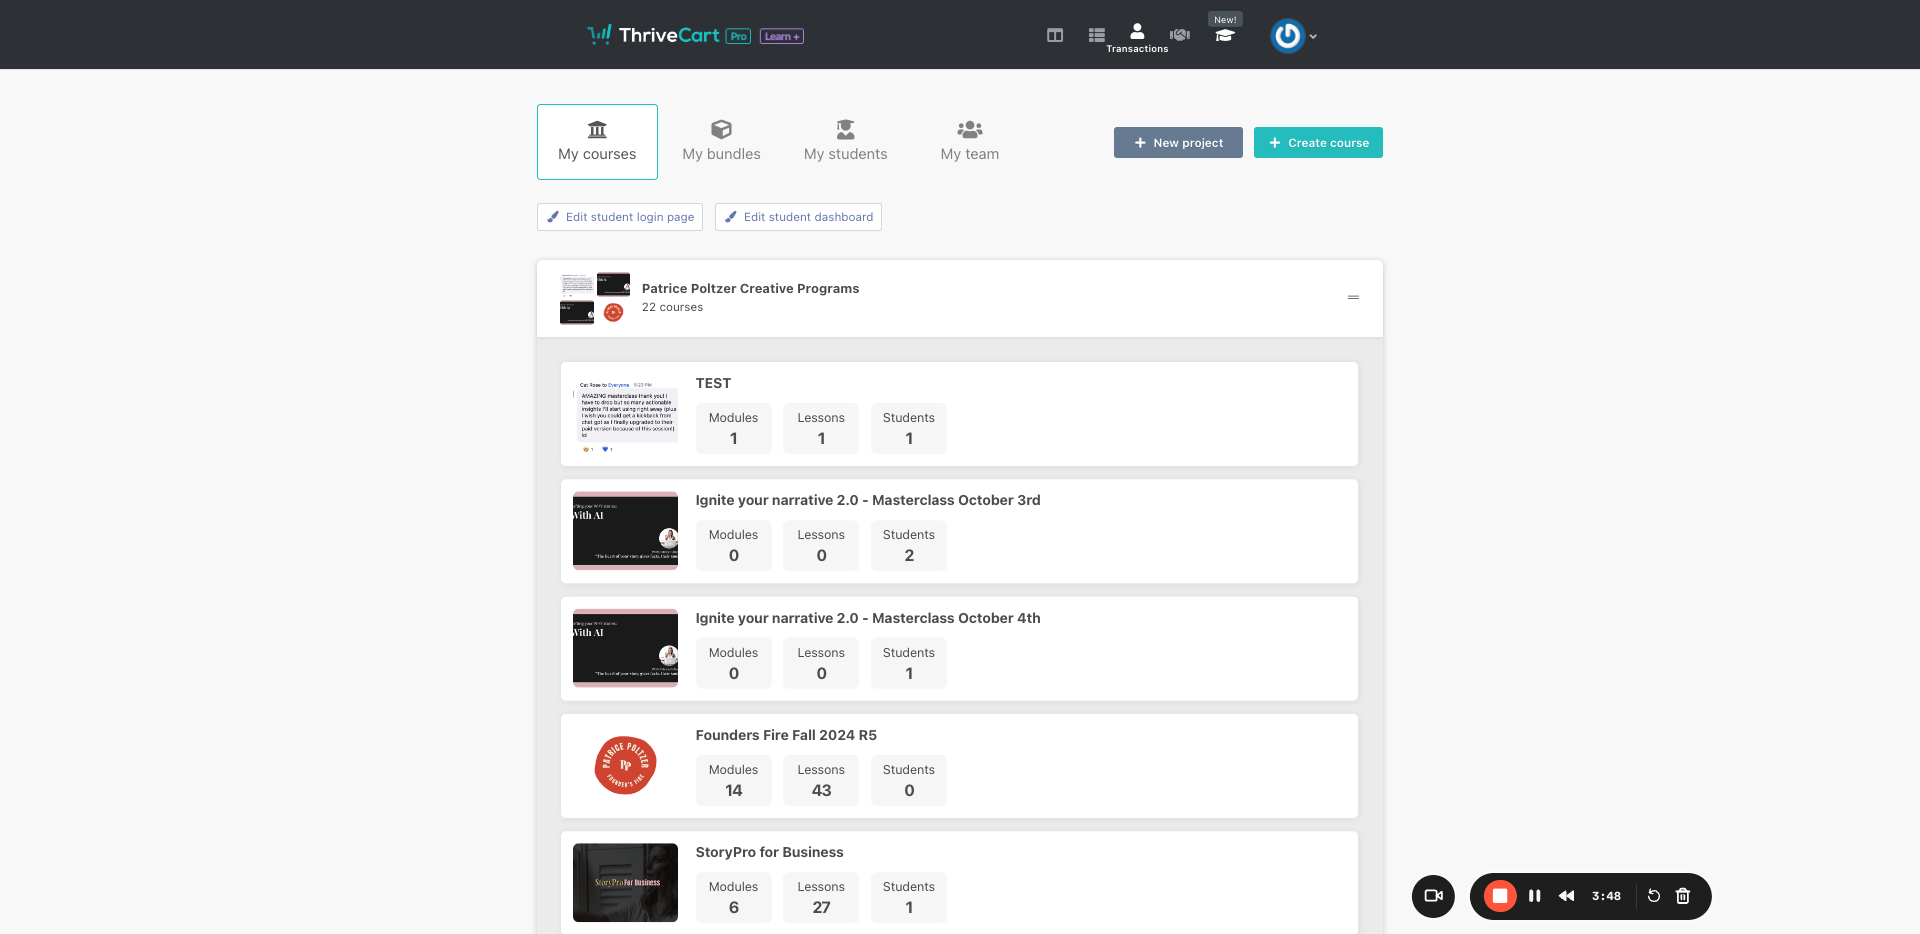
Once you're done, go to the next tab and update all the sales for StoryPro.
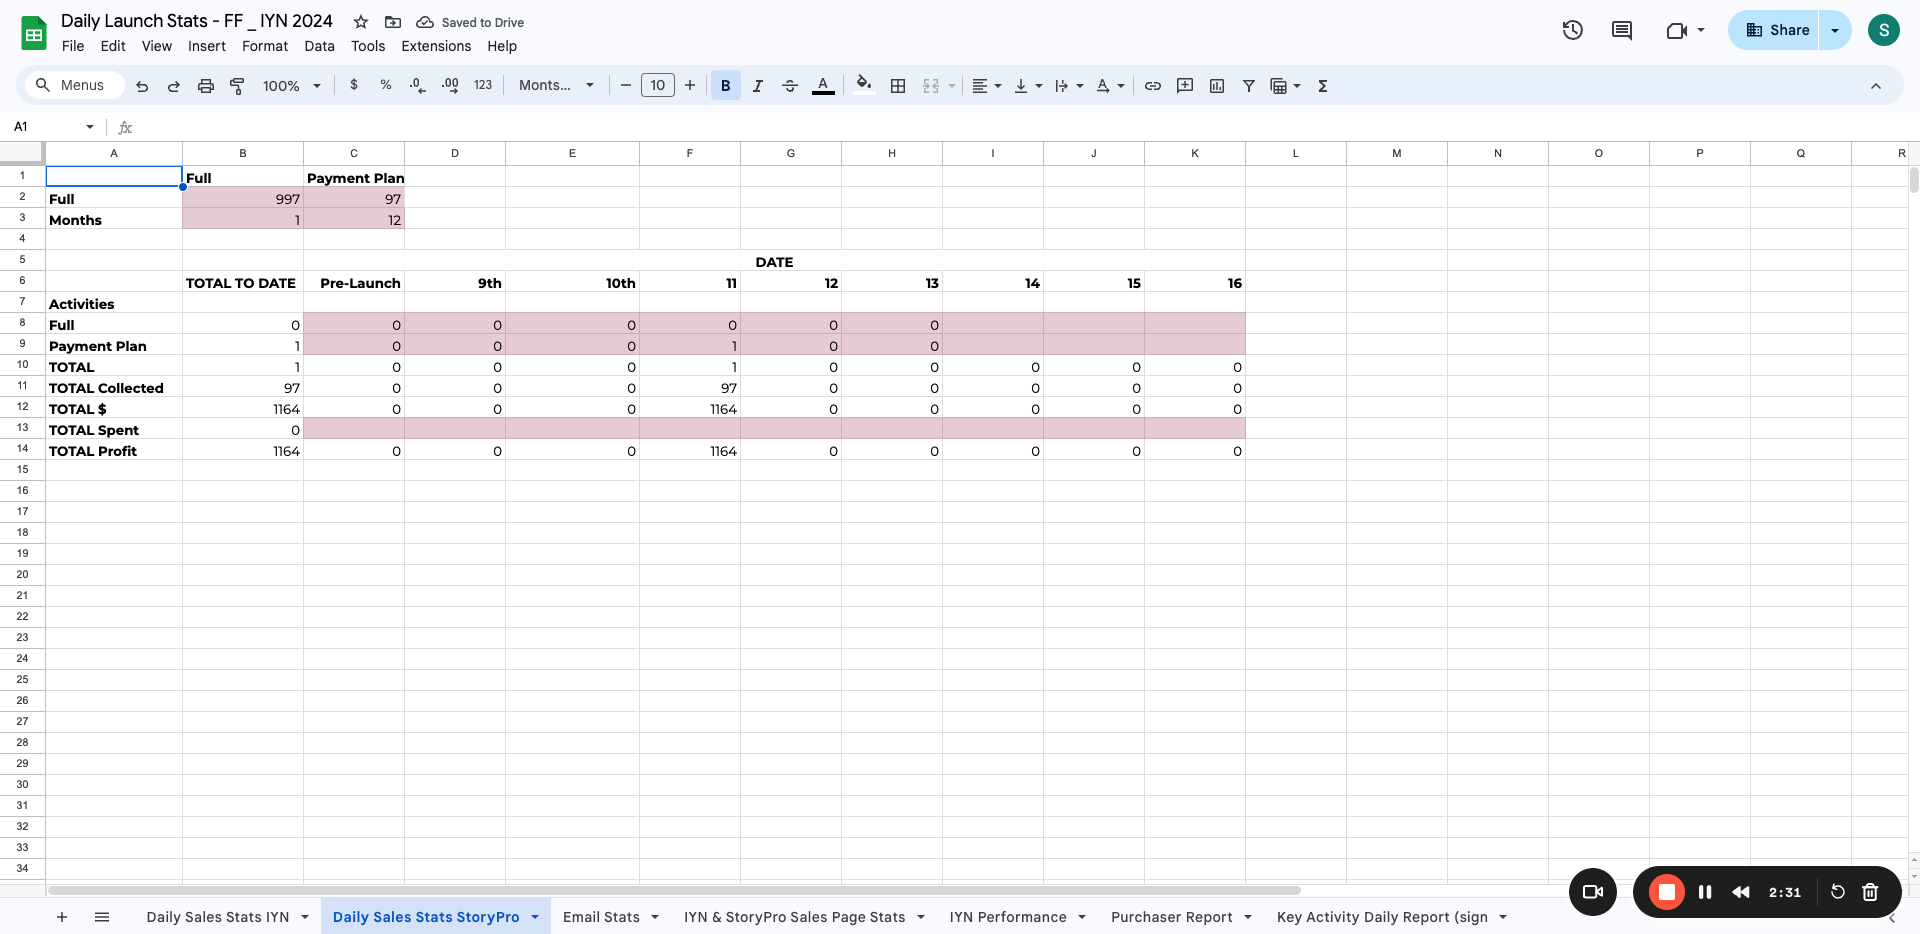
StoryPro for Business is the one you should choose. Select the top option, StoryPro for Business. Repeat this process daily and keep it updated.
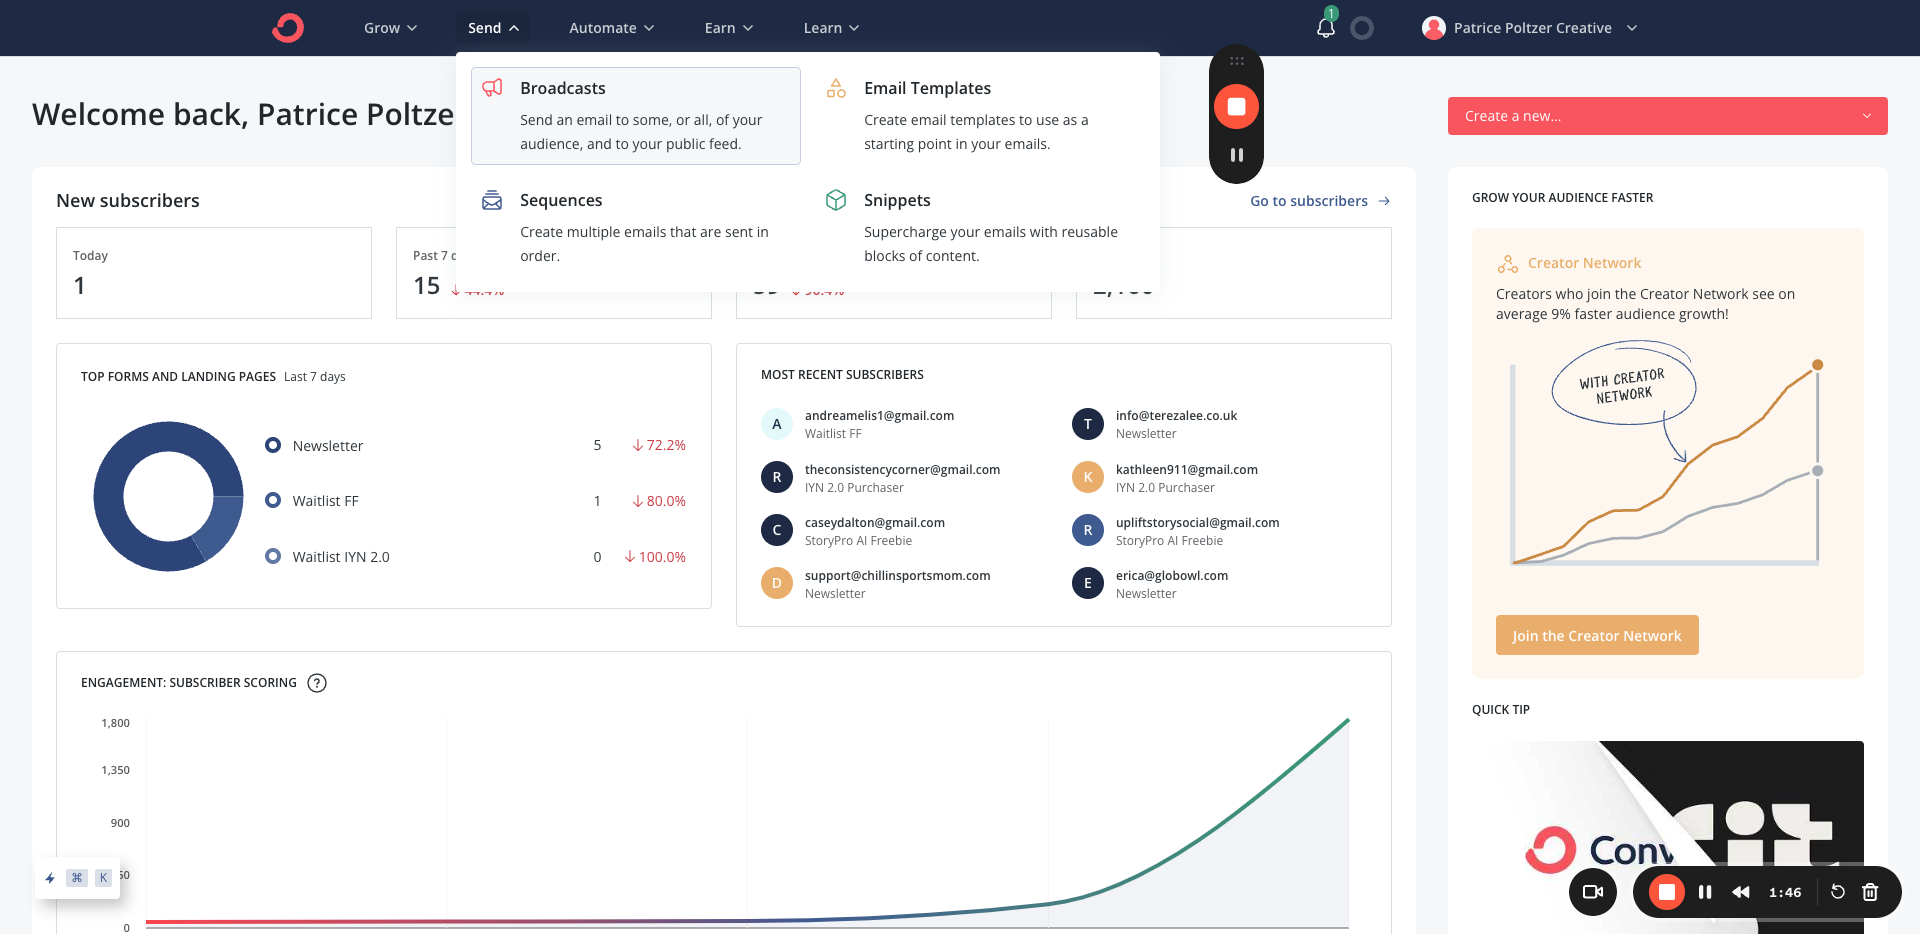
Then, when you're done, continue with email stats.

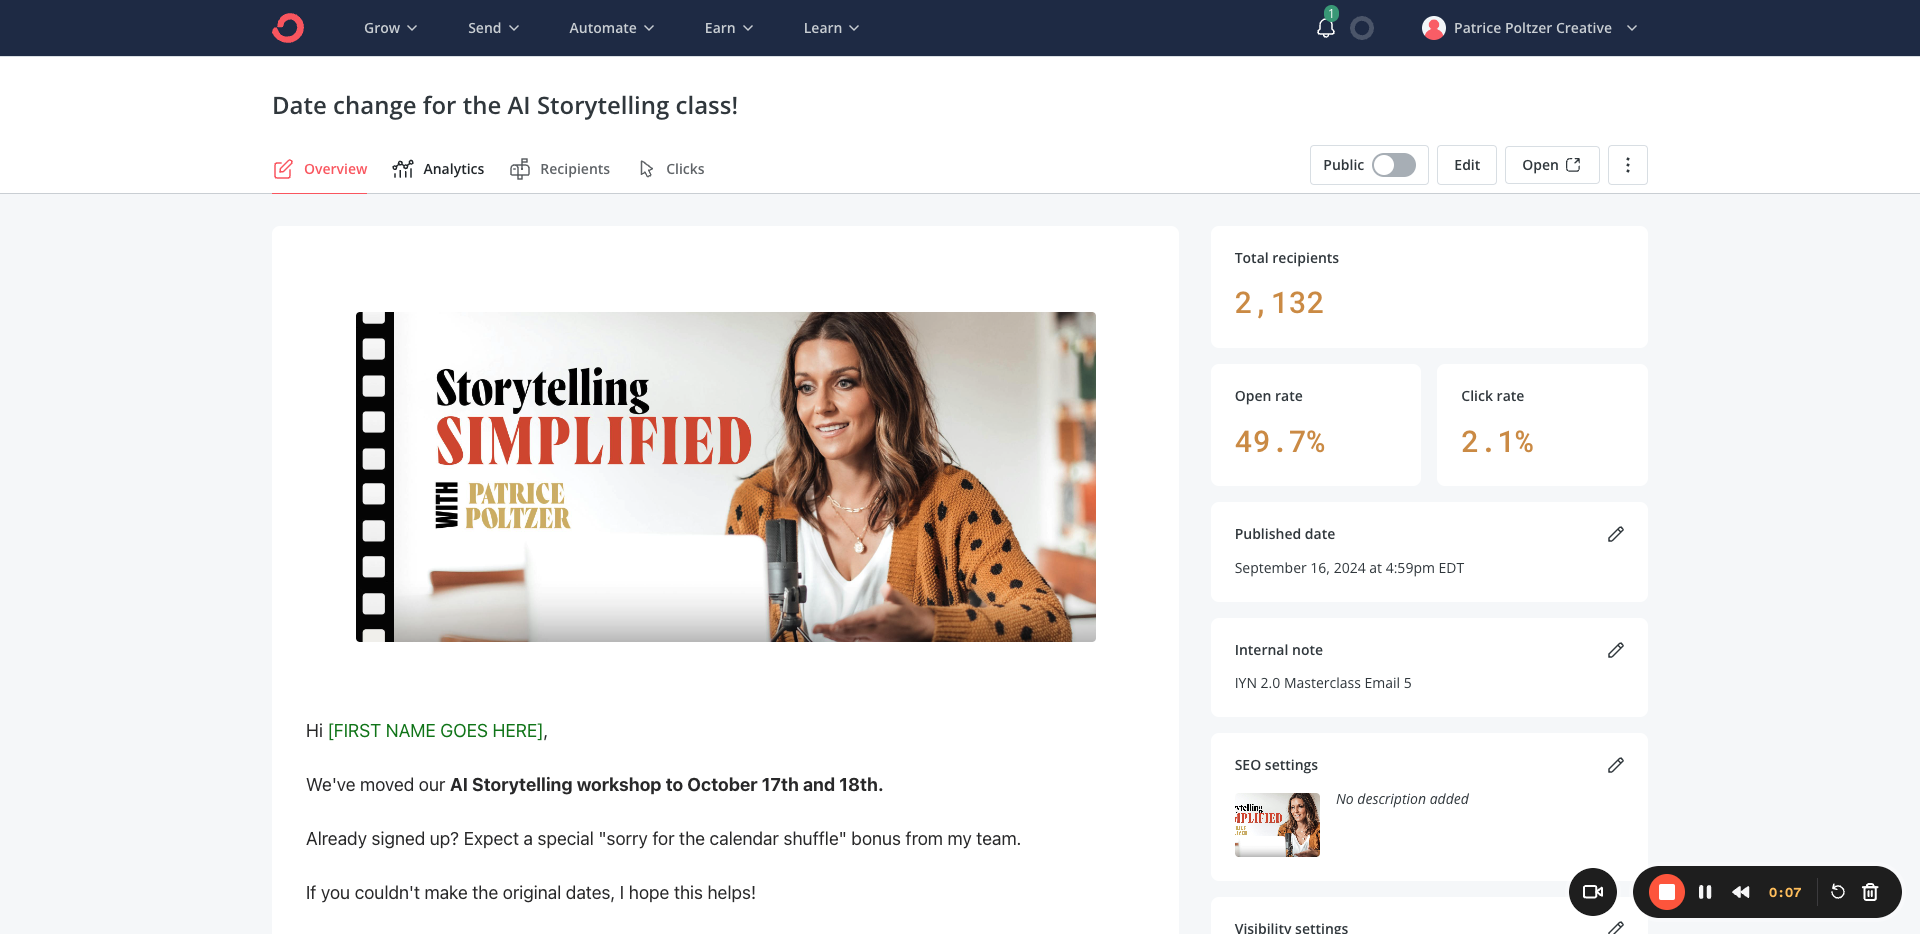
This is self-explanatory. You need to go to ConvertKit, then to Broadcasts, and finally to Published.
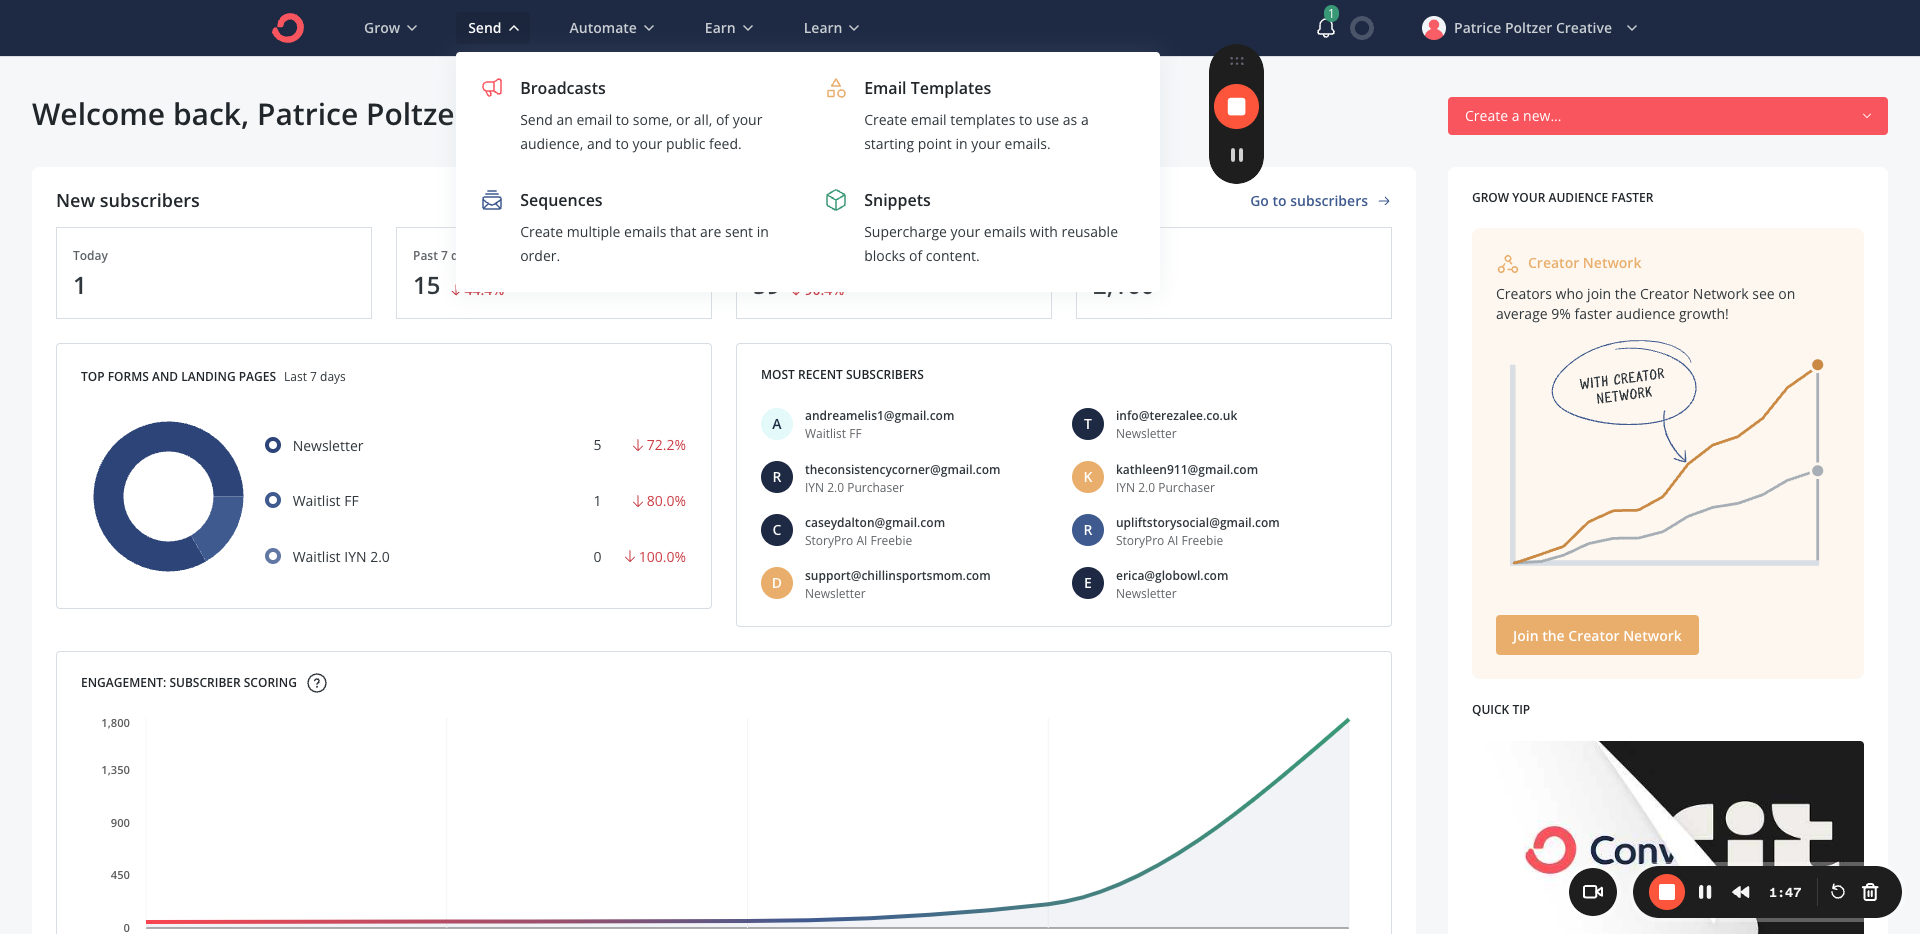
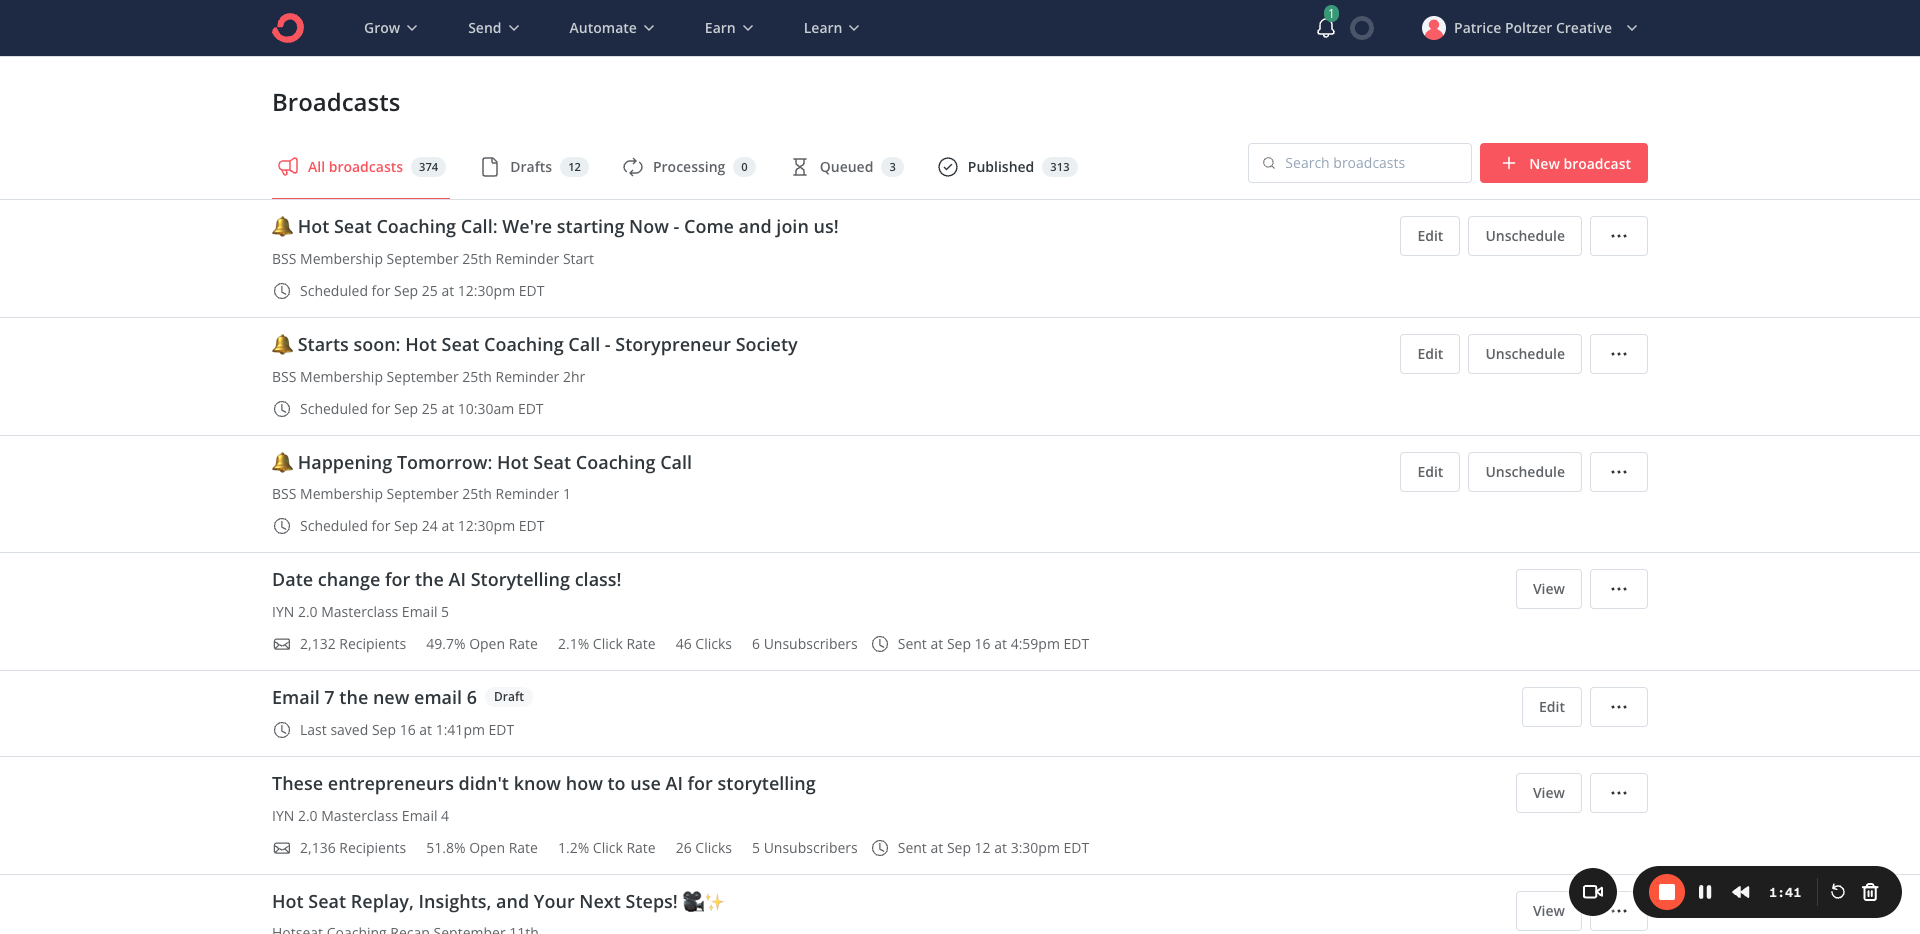
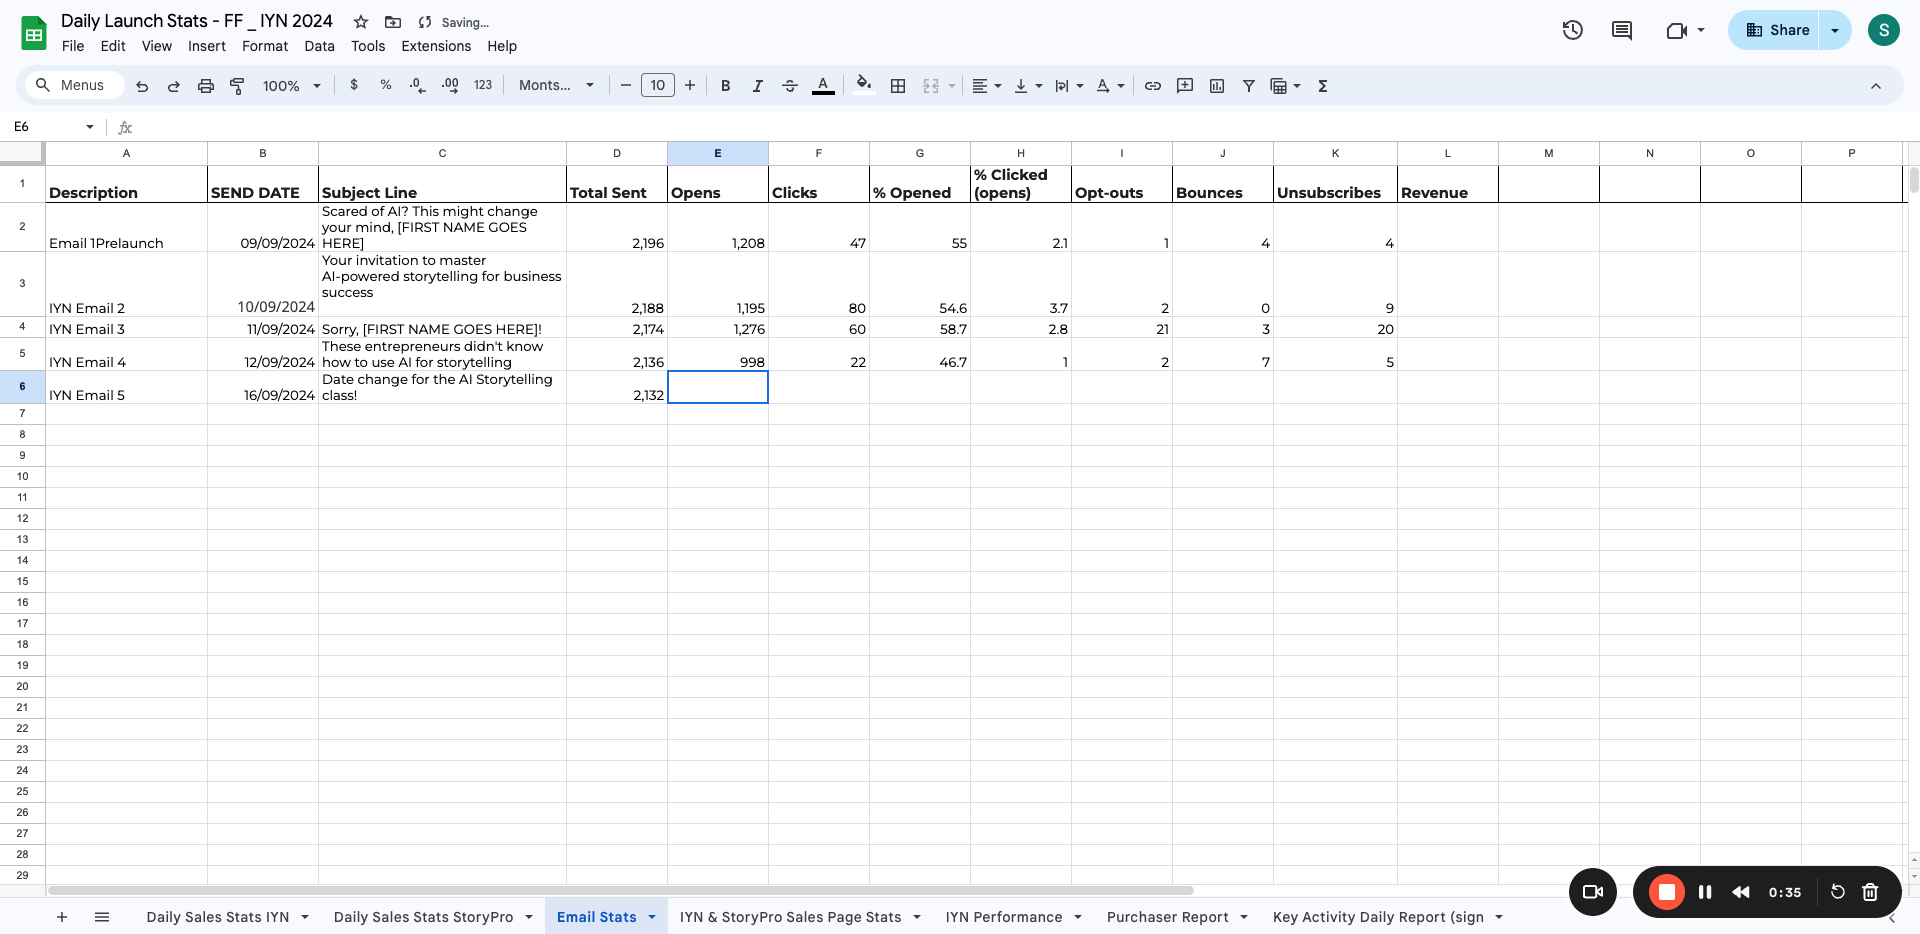
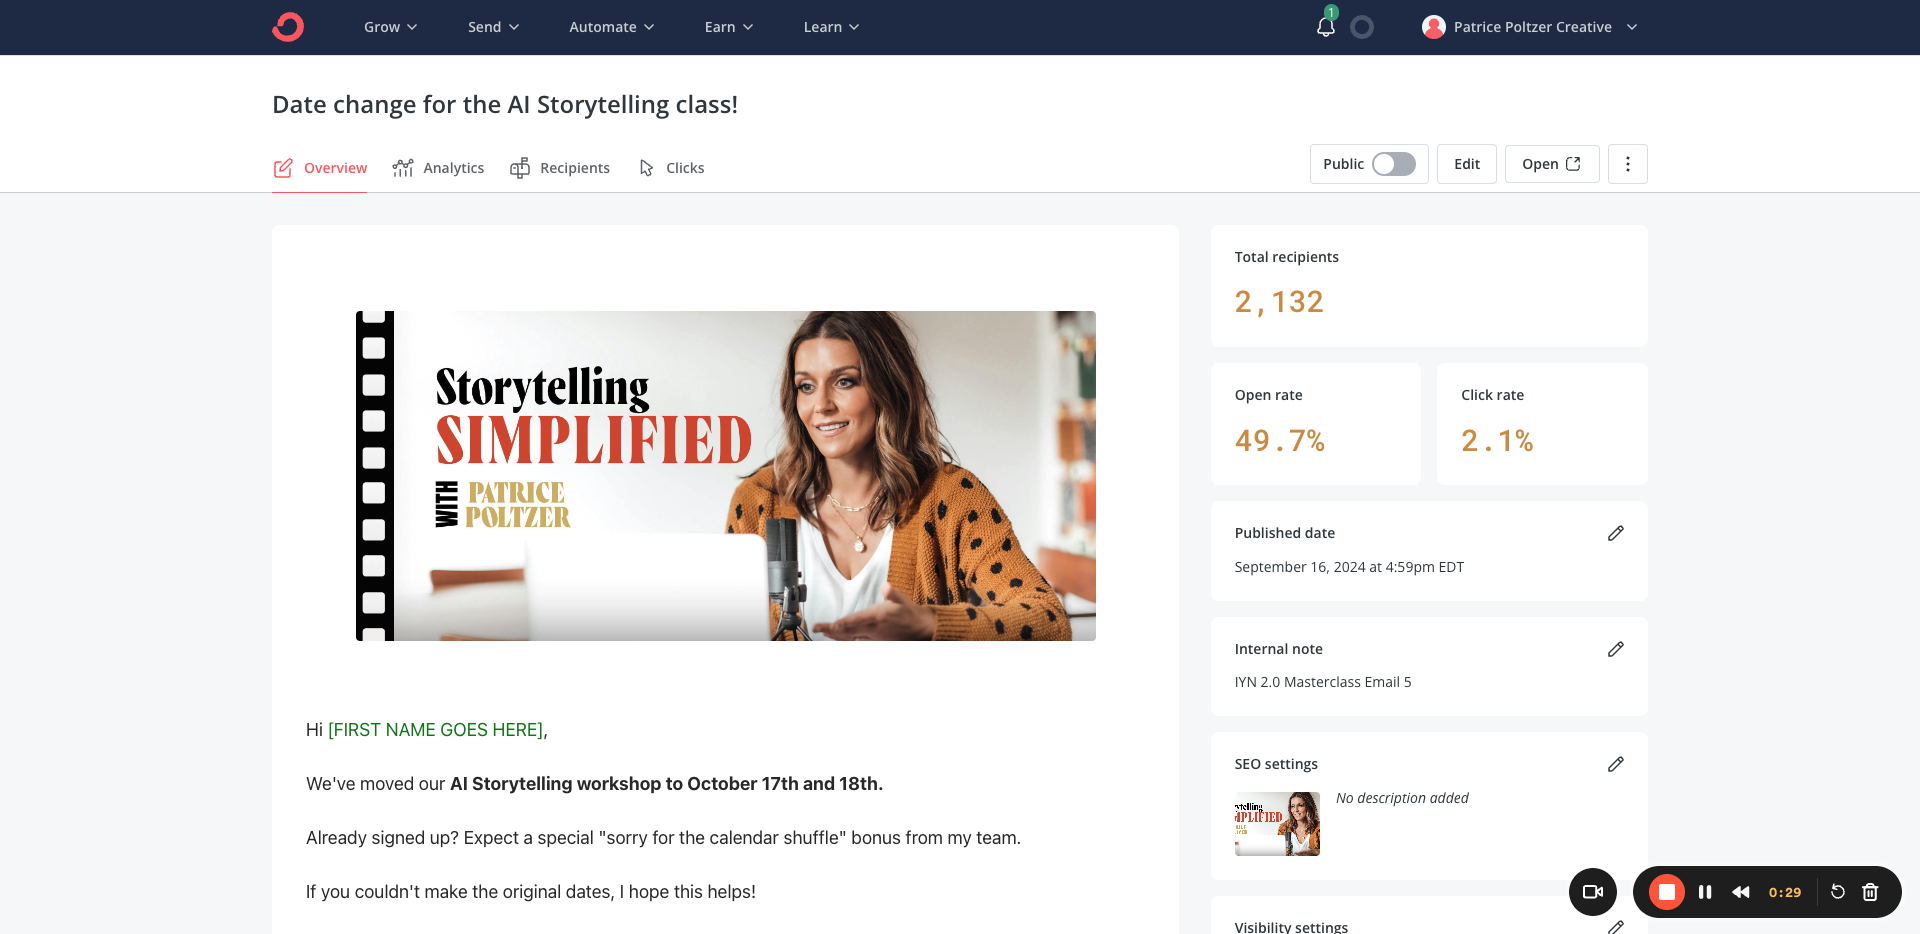
Locate the next email, in this case "Ignite Your Narrative Email 5." Click on the email to view the first metrics. Copy the recipient's number and add it to the total send.
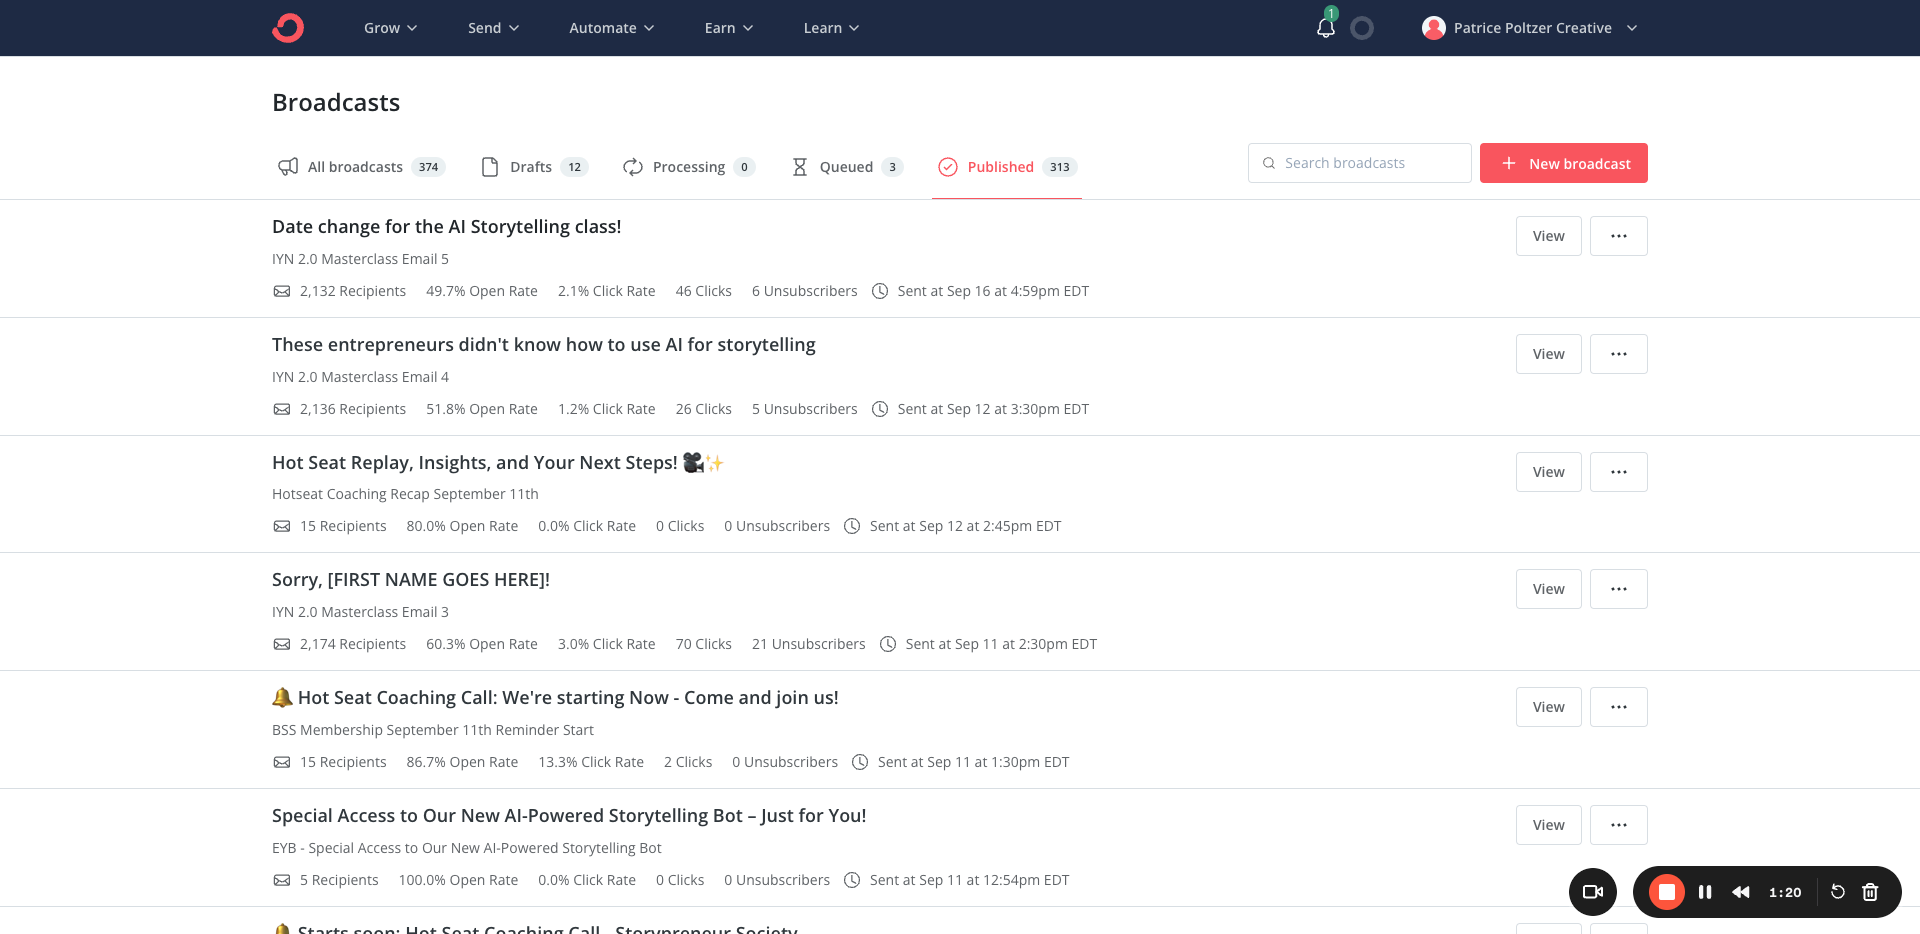

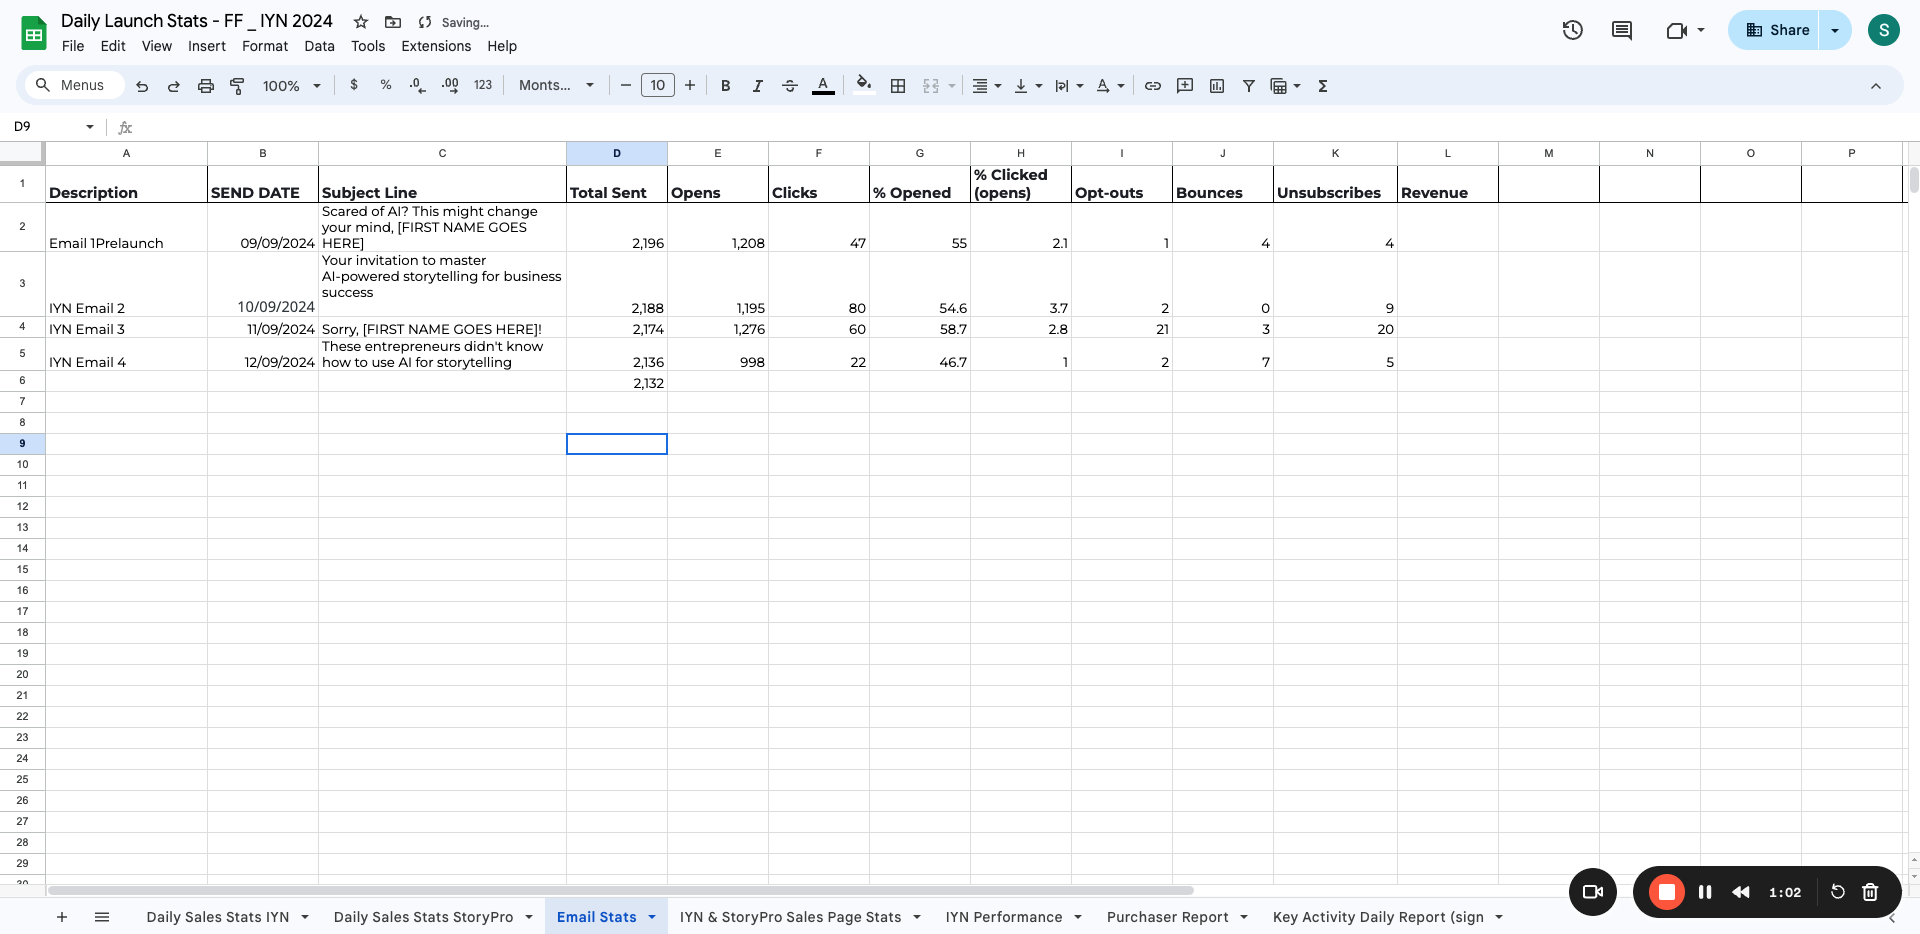
Copy the subject line and the date. Send the email, and also copy and paste it here. This is email 5.


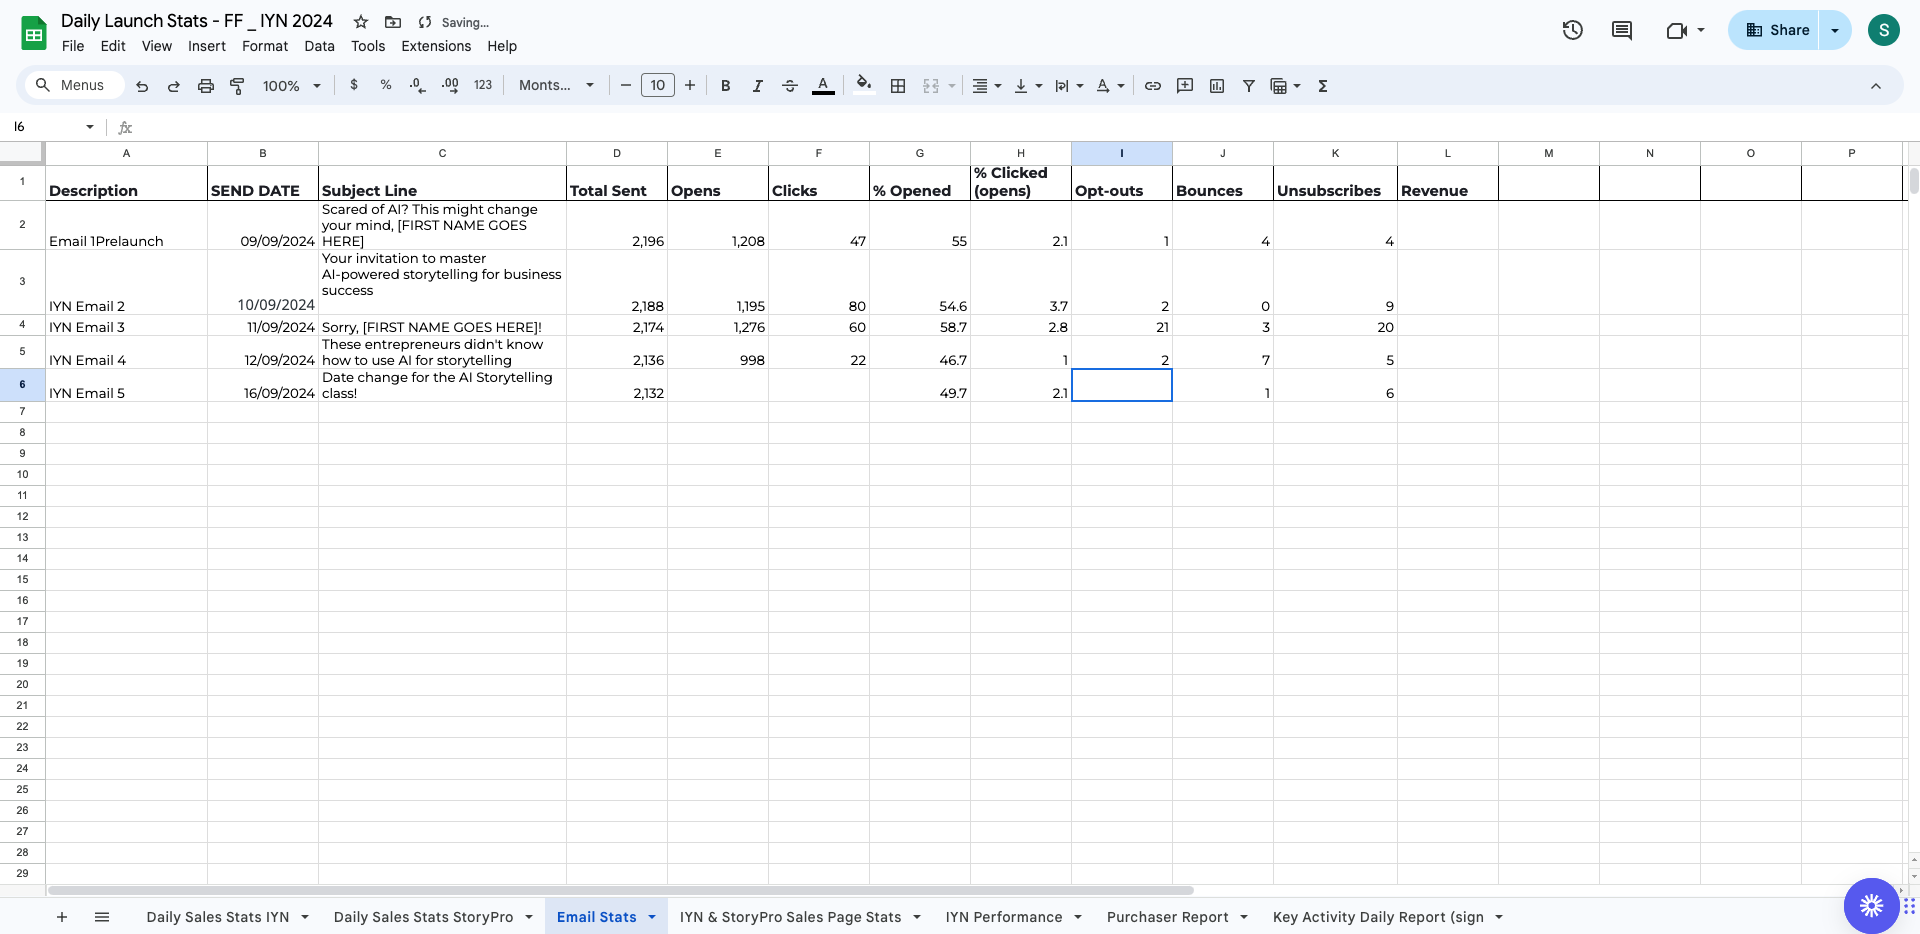
Now, let's discuss opens, clicks, open rate, and click rate.
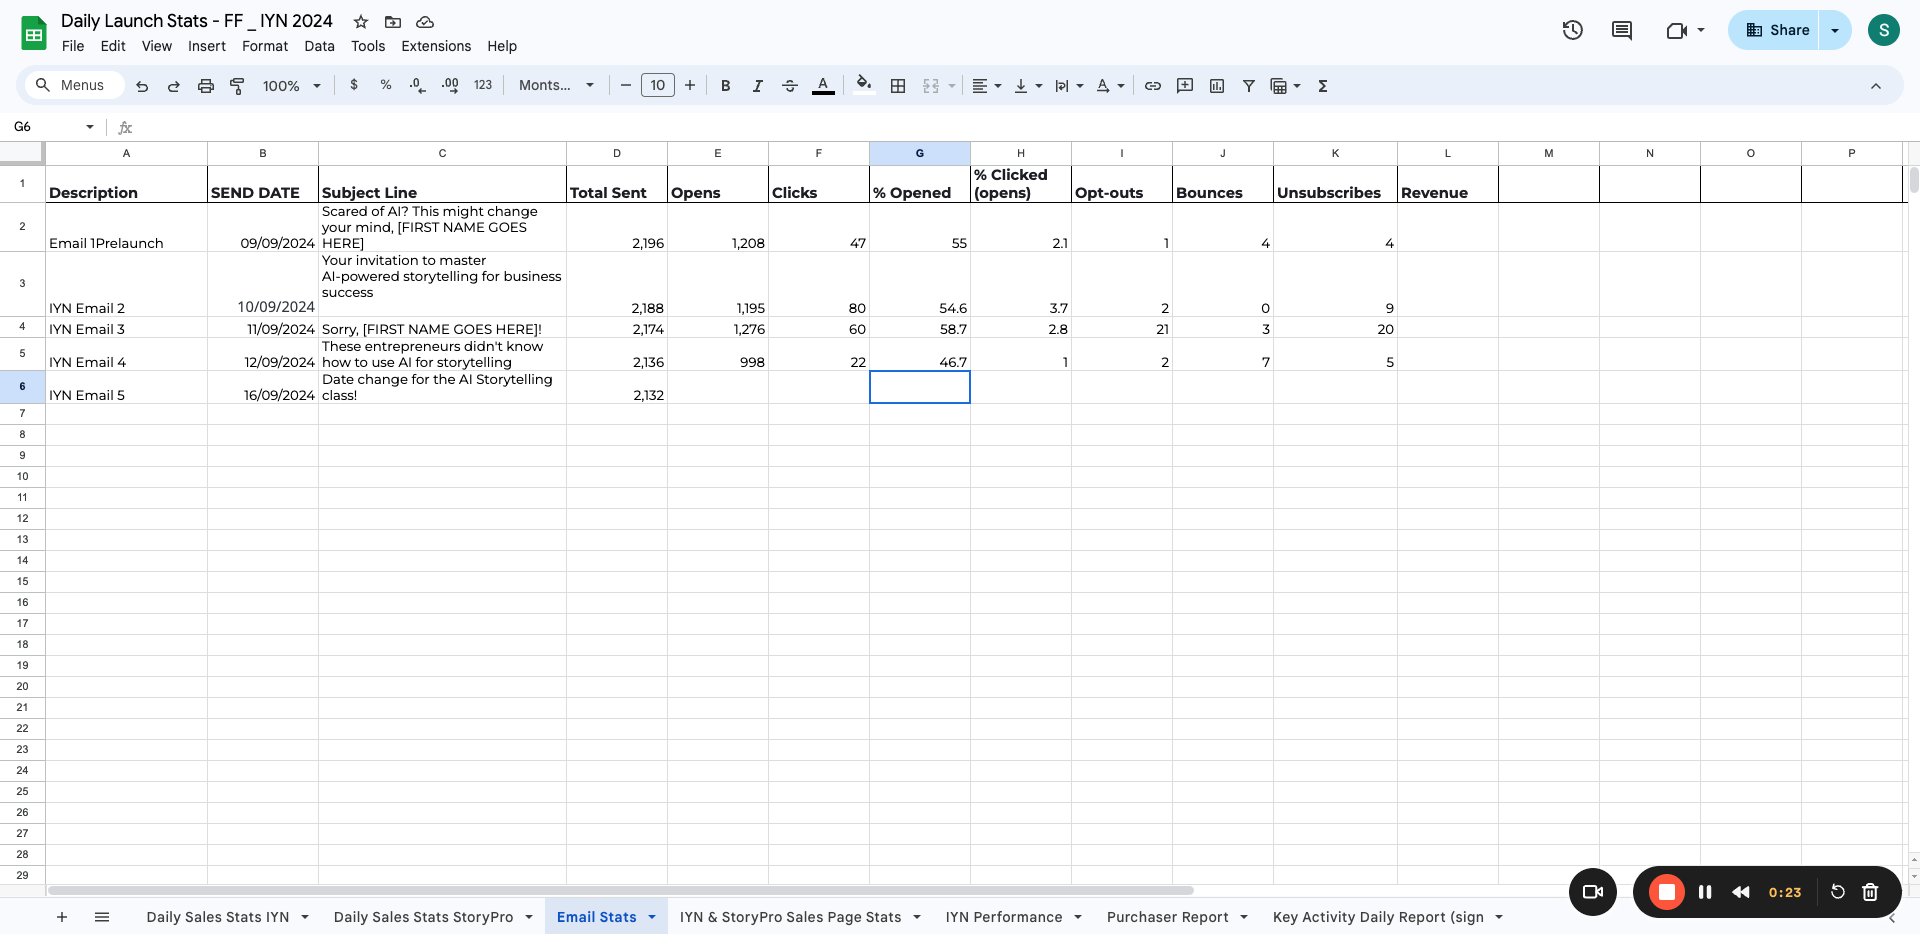
repeat with the click rate

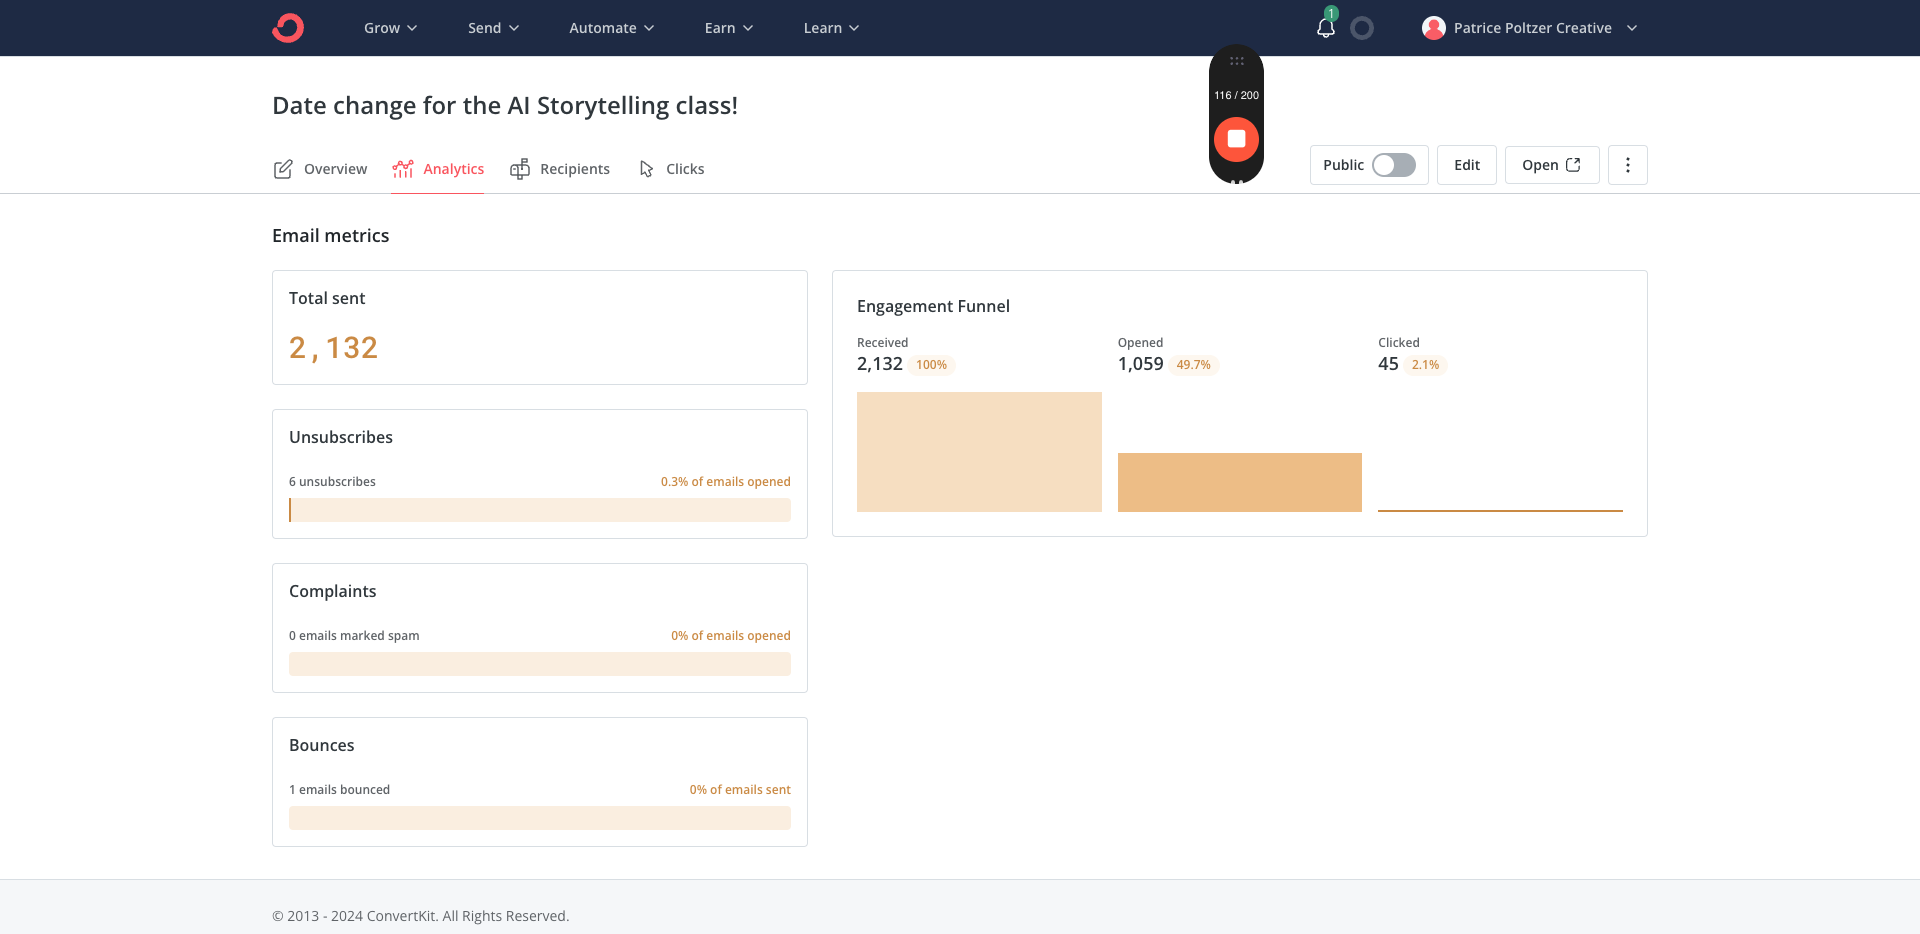
Alright, now we want to go to Analytics. You can see here that six people unsubscribed. We have one email that bounced.
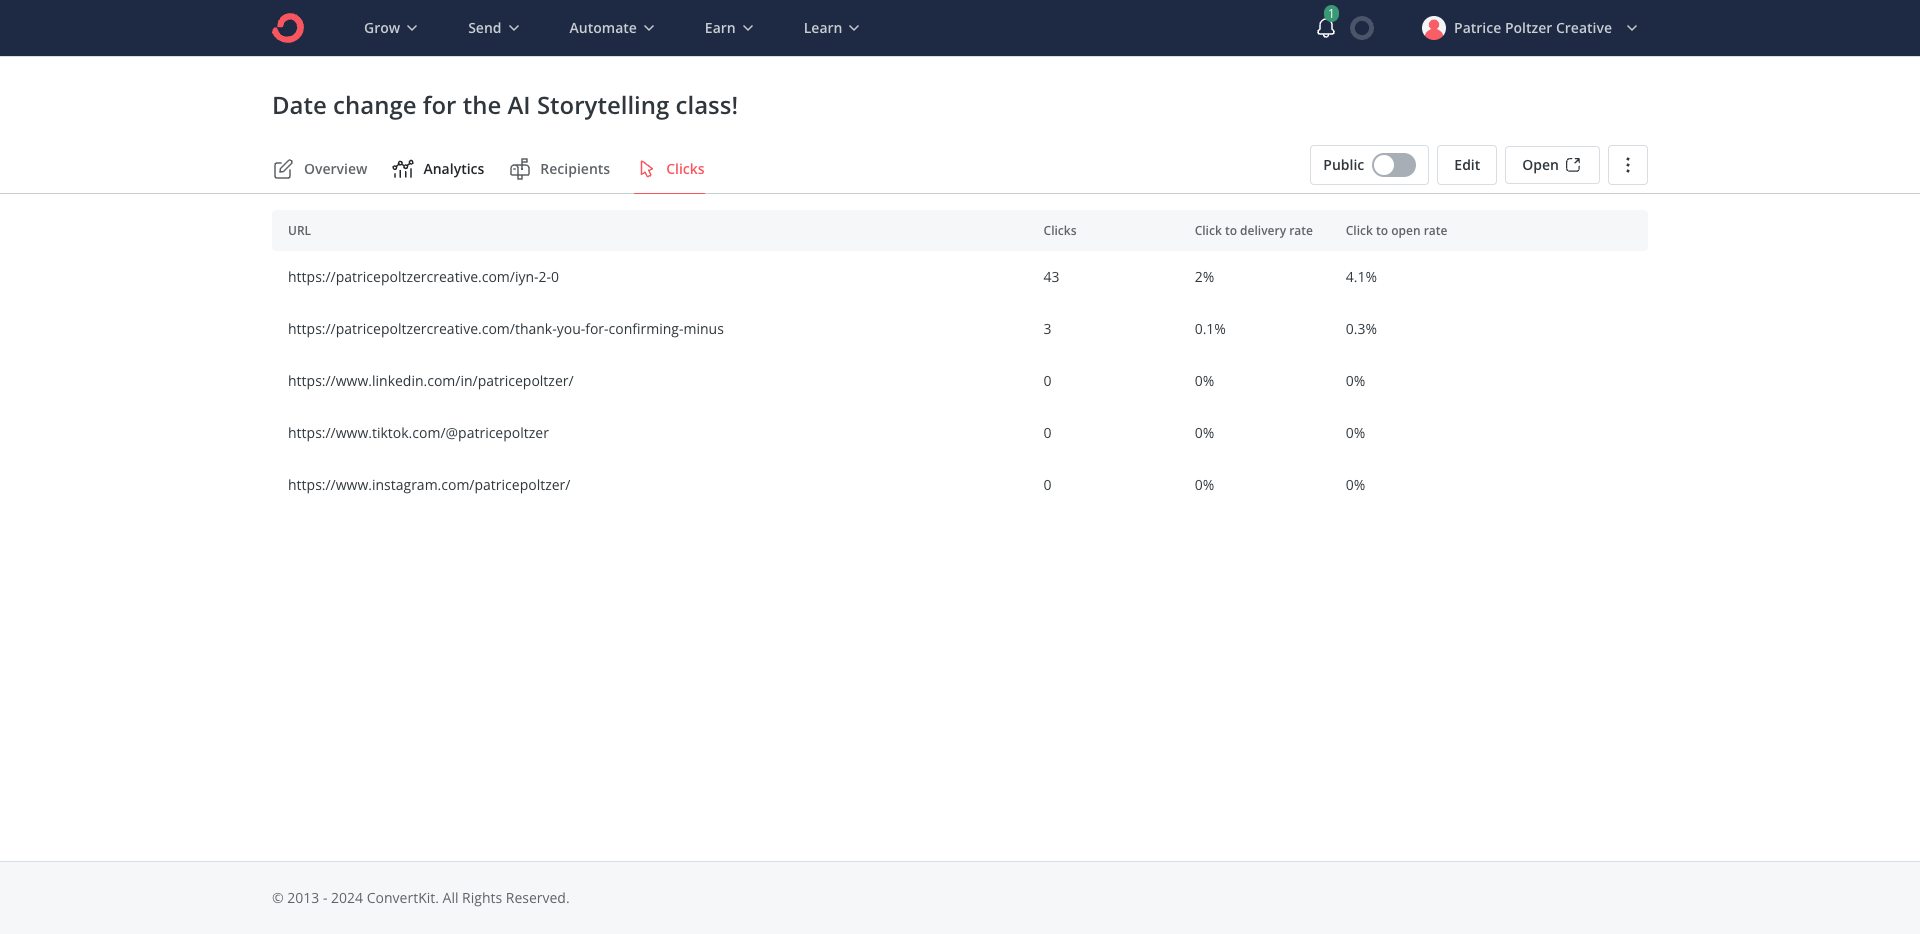
Did we have any opt-outs? We can check by clicking on "Clicks."
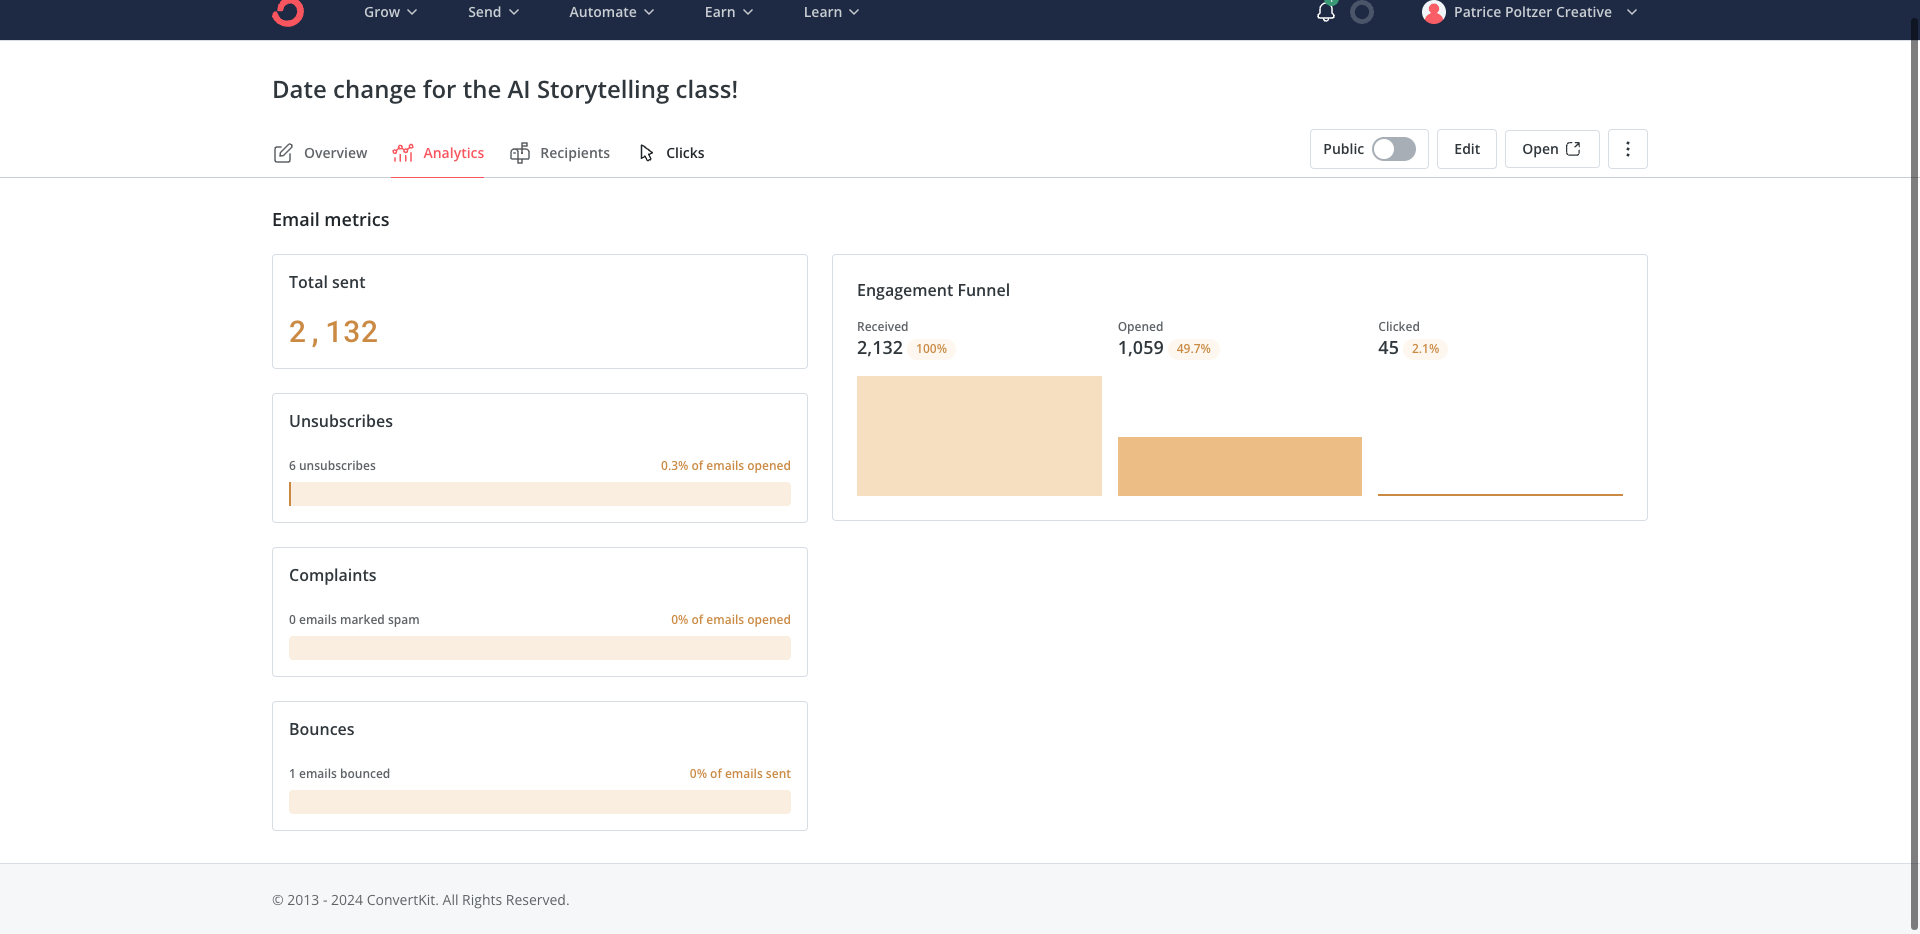
Here, you can see that three people chose to opt out.
The total number of clicks is 43 for Ignite Your Narrative.
That's it for the email part. Now, let's move on to the sales page stats.
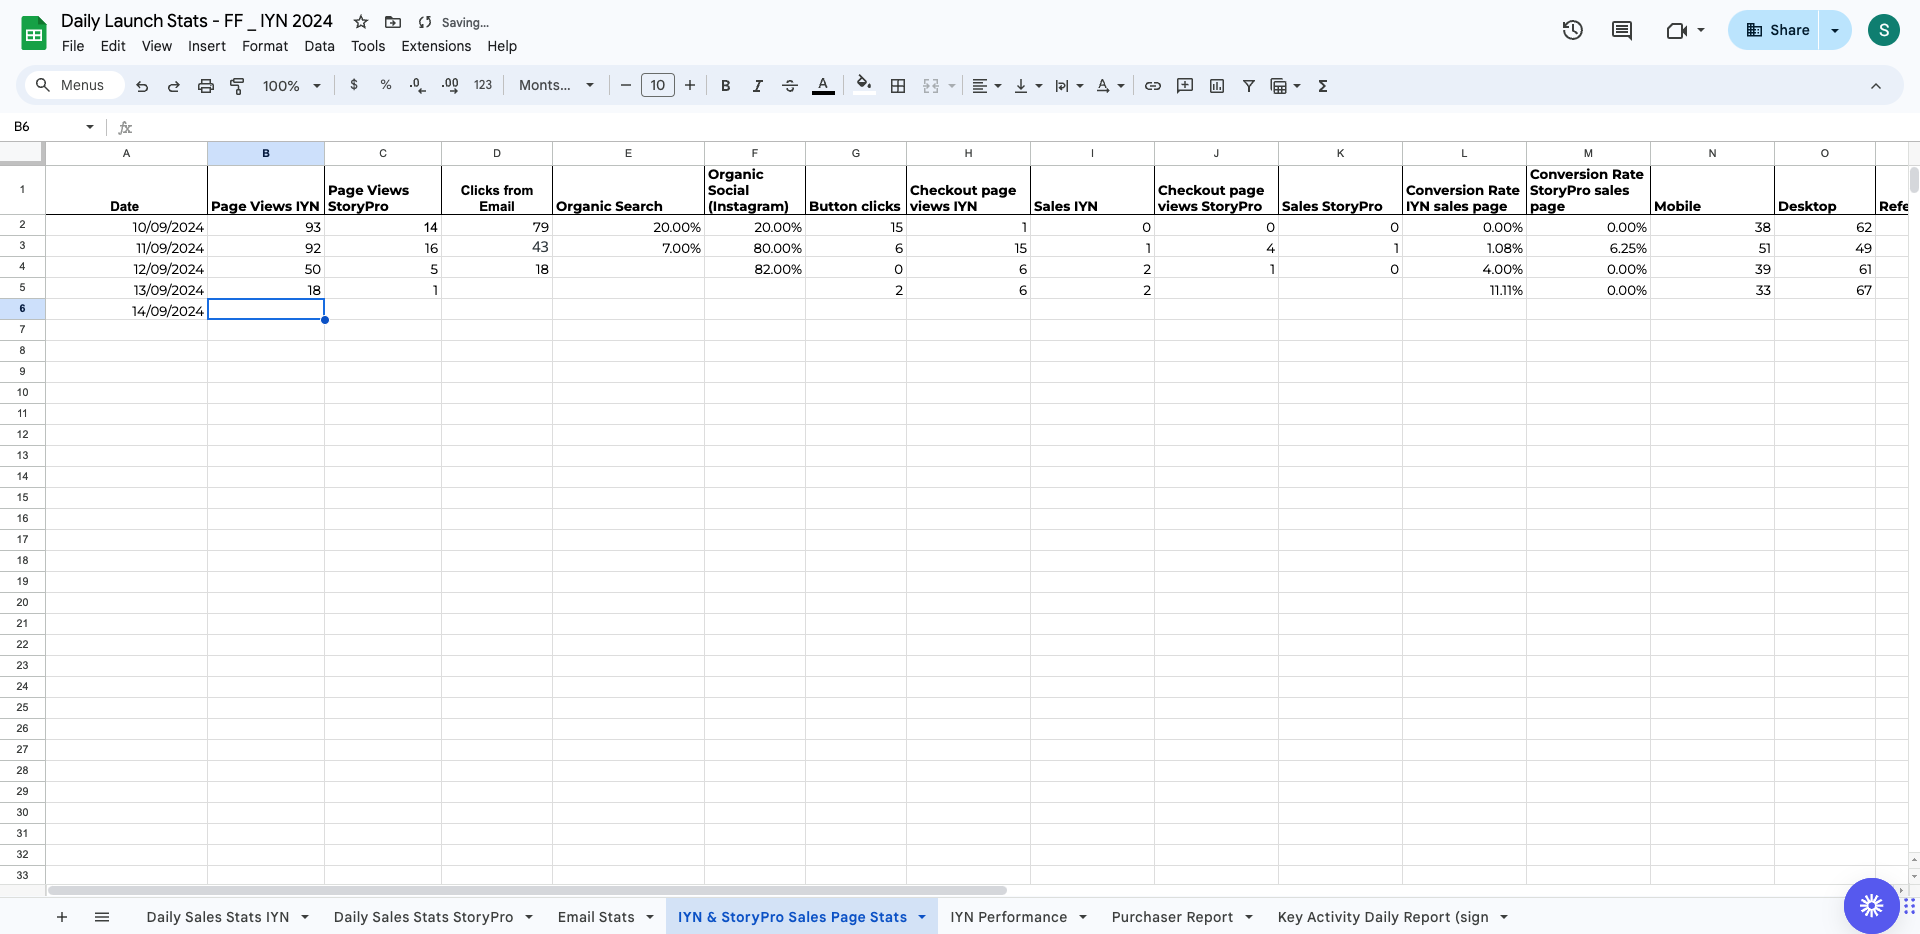
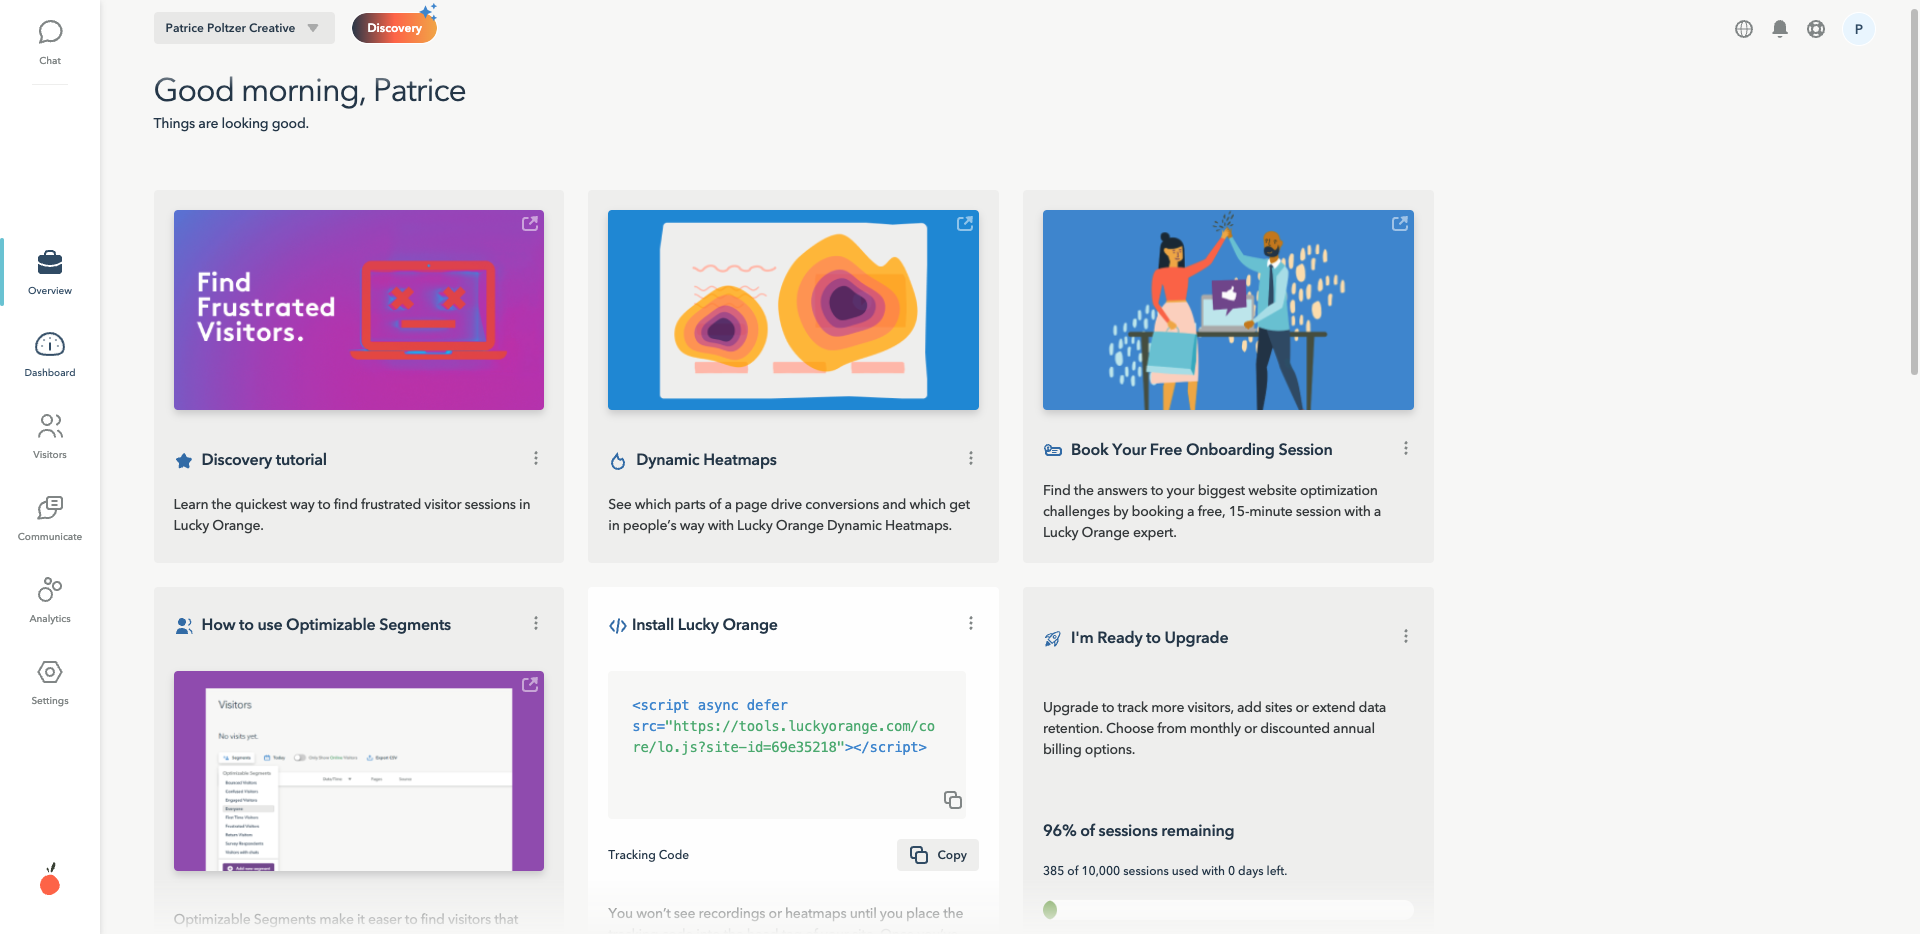
This includes Ignite Your Narrative and StoryPro. For that, you need to go to Lucky Orange.
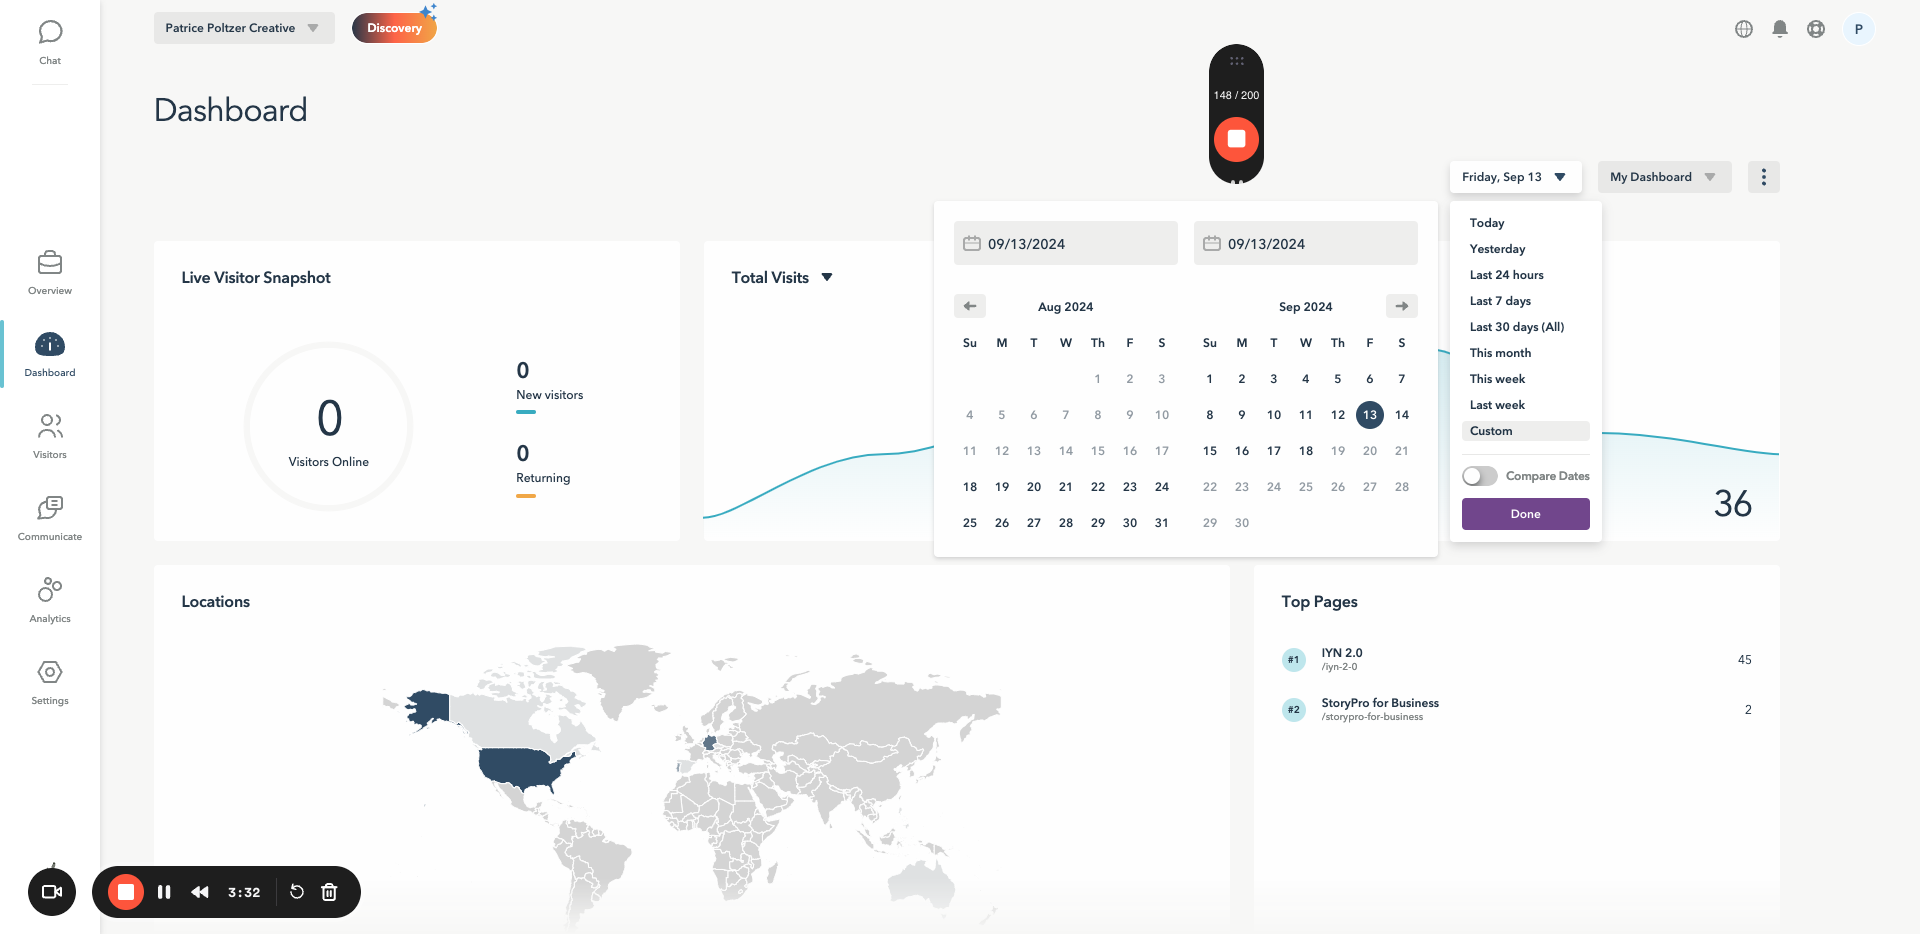
When you log in, you will see this overview. Then, you can go to the dashboard. Here, you have to choose the date.
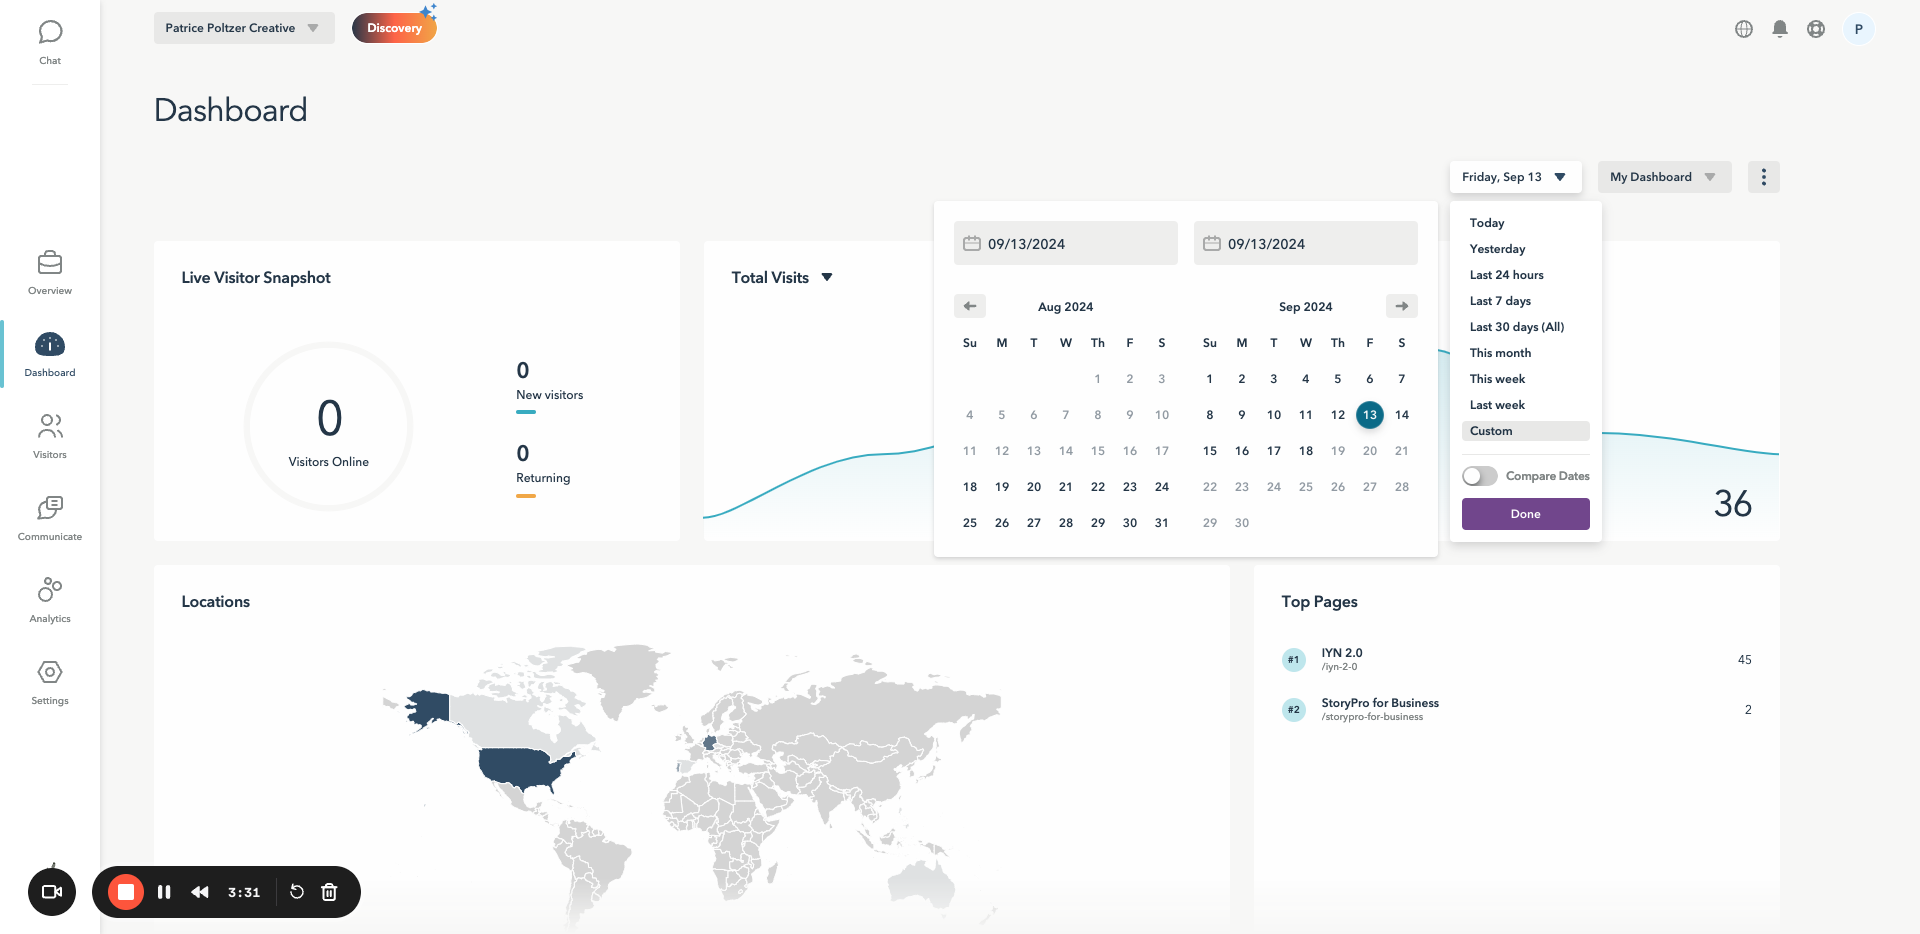
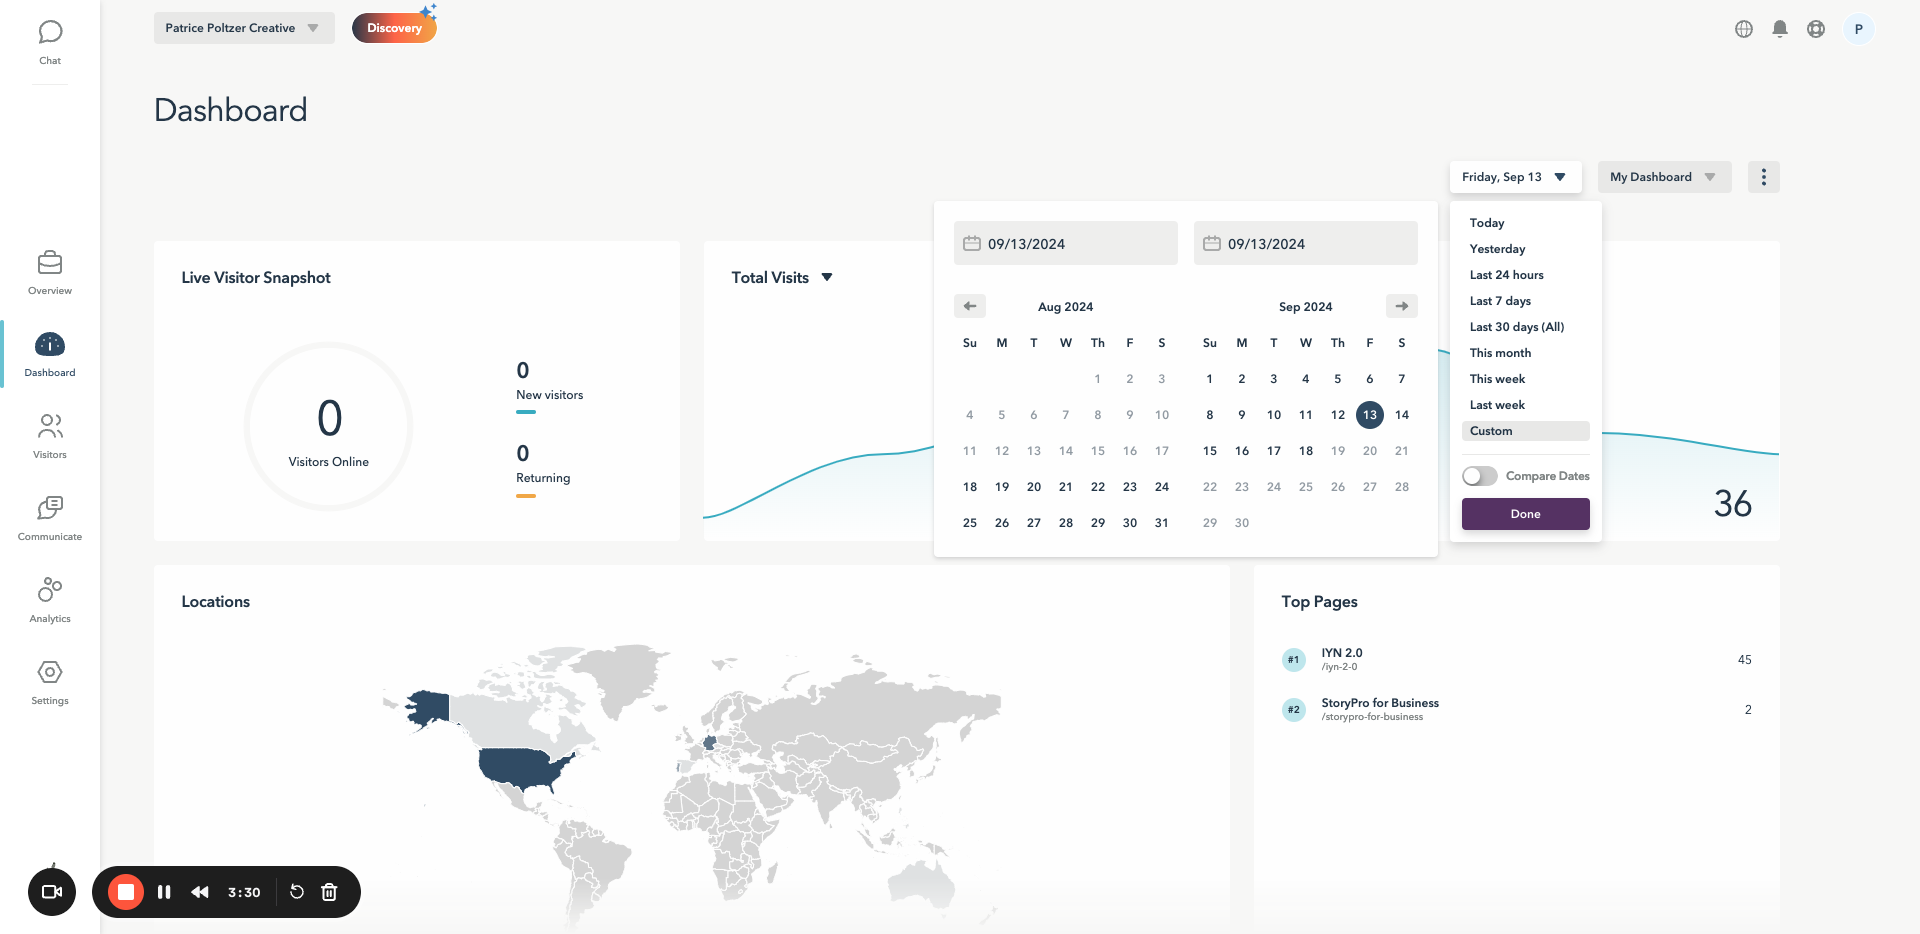
We need to go to the dashboard, choose the custom date, and then we will see the data we want. For page visits, we have 45 for Imaginative on the 13th and two for StoryPro for business. We can also see where these visitors come from. Most are from Facebook and LinkedIn, so social media in general. None are from email, which is interesting. You can find this information in the social media section.
Then you have desktop and mobile, which we also add here on the right. The next thing we want to know is the checkout page views and the conversion rate of the sales page.
Insert the data you see in the google sheet
It automatically calculates the conversion rate for each of the sales pages. You can get this on Lucky Orange.
Next Go to ThriveCart Dashboard
Continue with the Social Media data