
Troubleshooting Dejardin IFA Spreadsheet Issues
Explore the common issues with Dejardin IFA spreadsheets and learn how to replicate and resolve these bugs effectively.
In this guide, we'll learn how to replicate and identify issues within the Dejardin IFA spreadsheet. The objective is to understand the discrepancies in the net annual premium calculations, particularly when switching between primary and reduced examples. By creating new cases and importing the Dejardin whole life product, we aim to pinpoint the source of incorrect values and report them for further investigation. This process will help ensure that the spreadsheet reflects accurate data for financial analysis.
Let's get started
Alright, we will replicate the incorrect Dejardin IFA spreadsheet issues.
Currently, there seem to be a few issues with Desjardins.
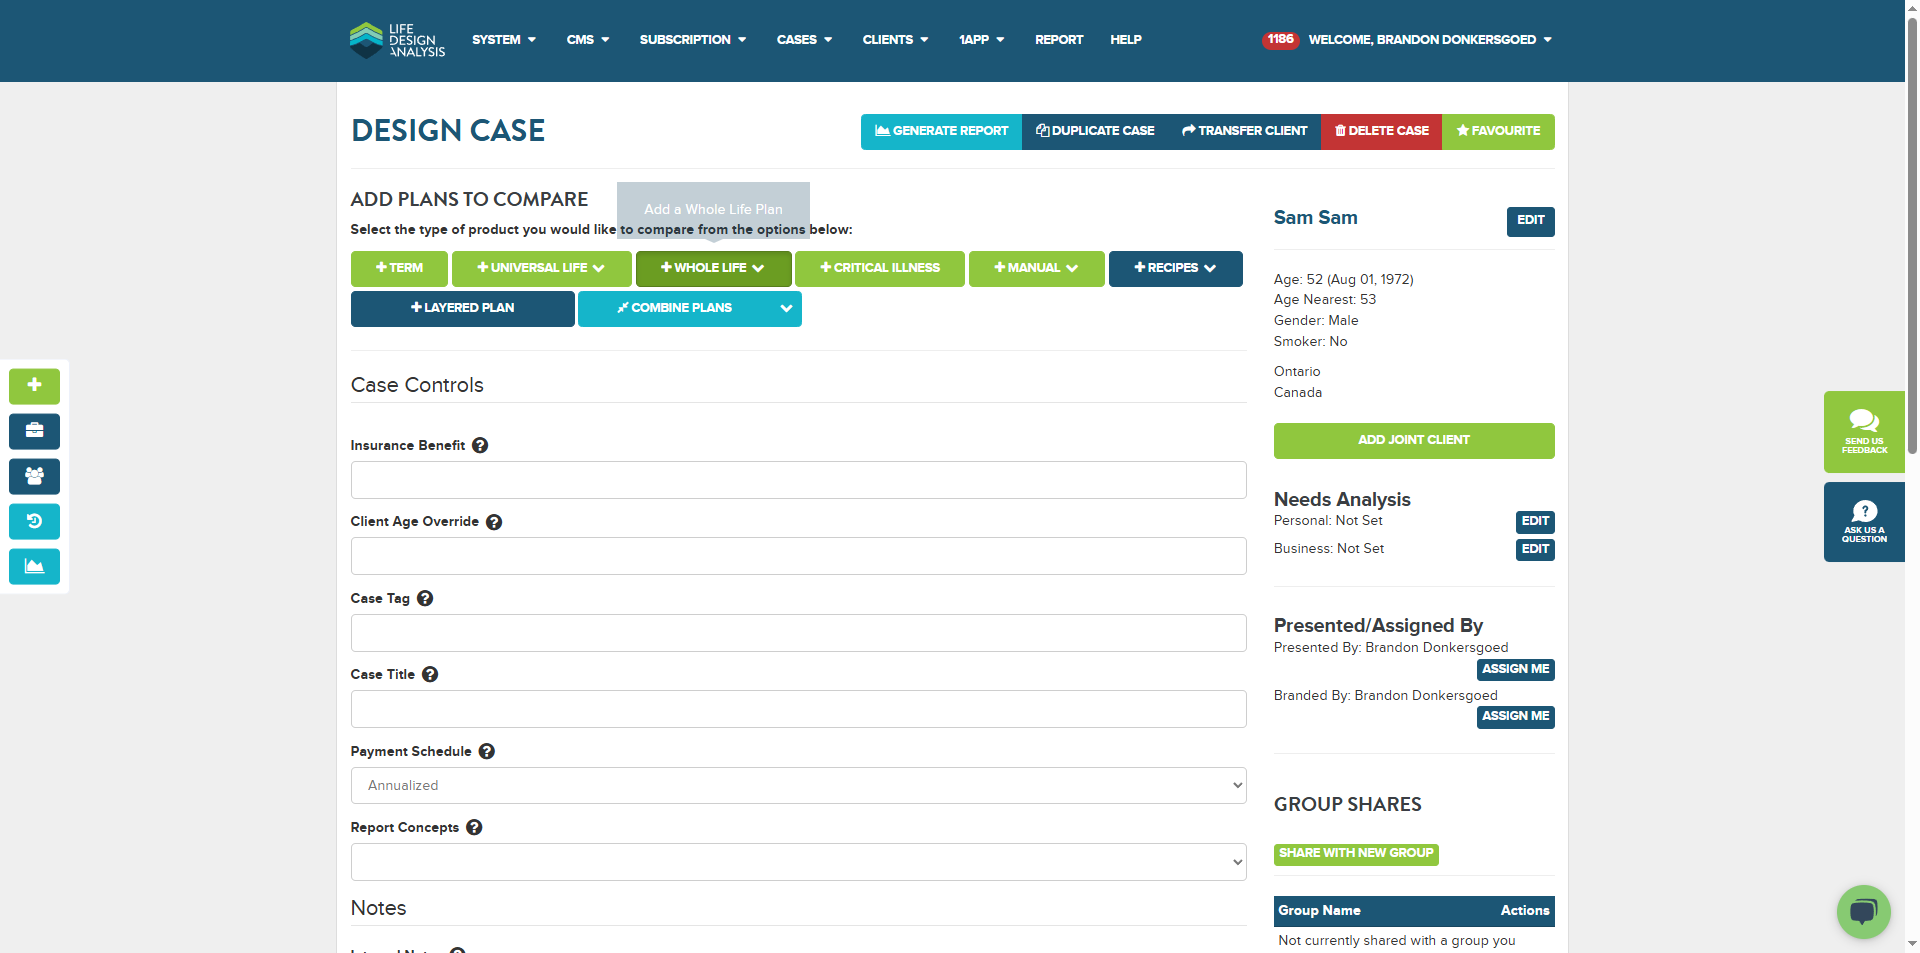
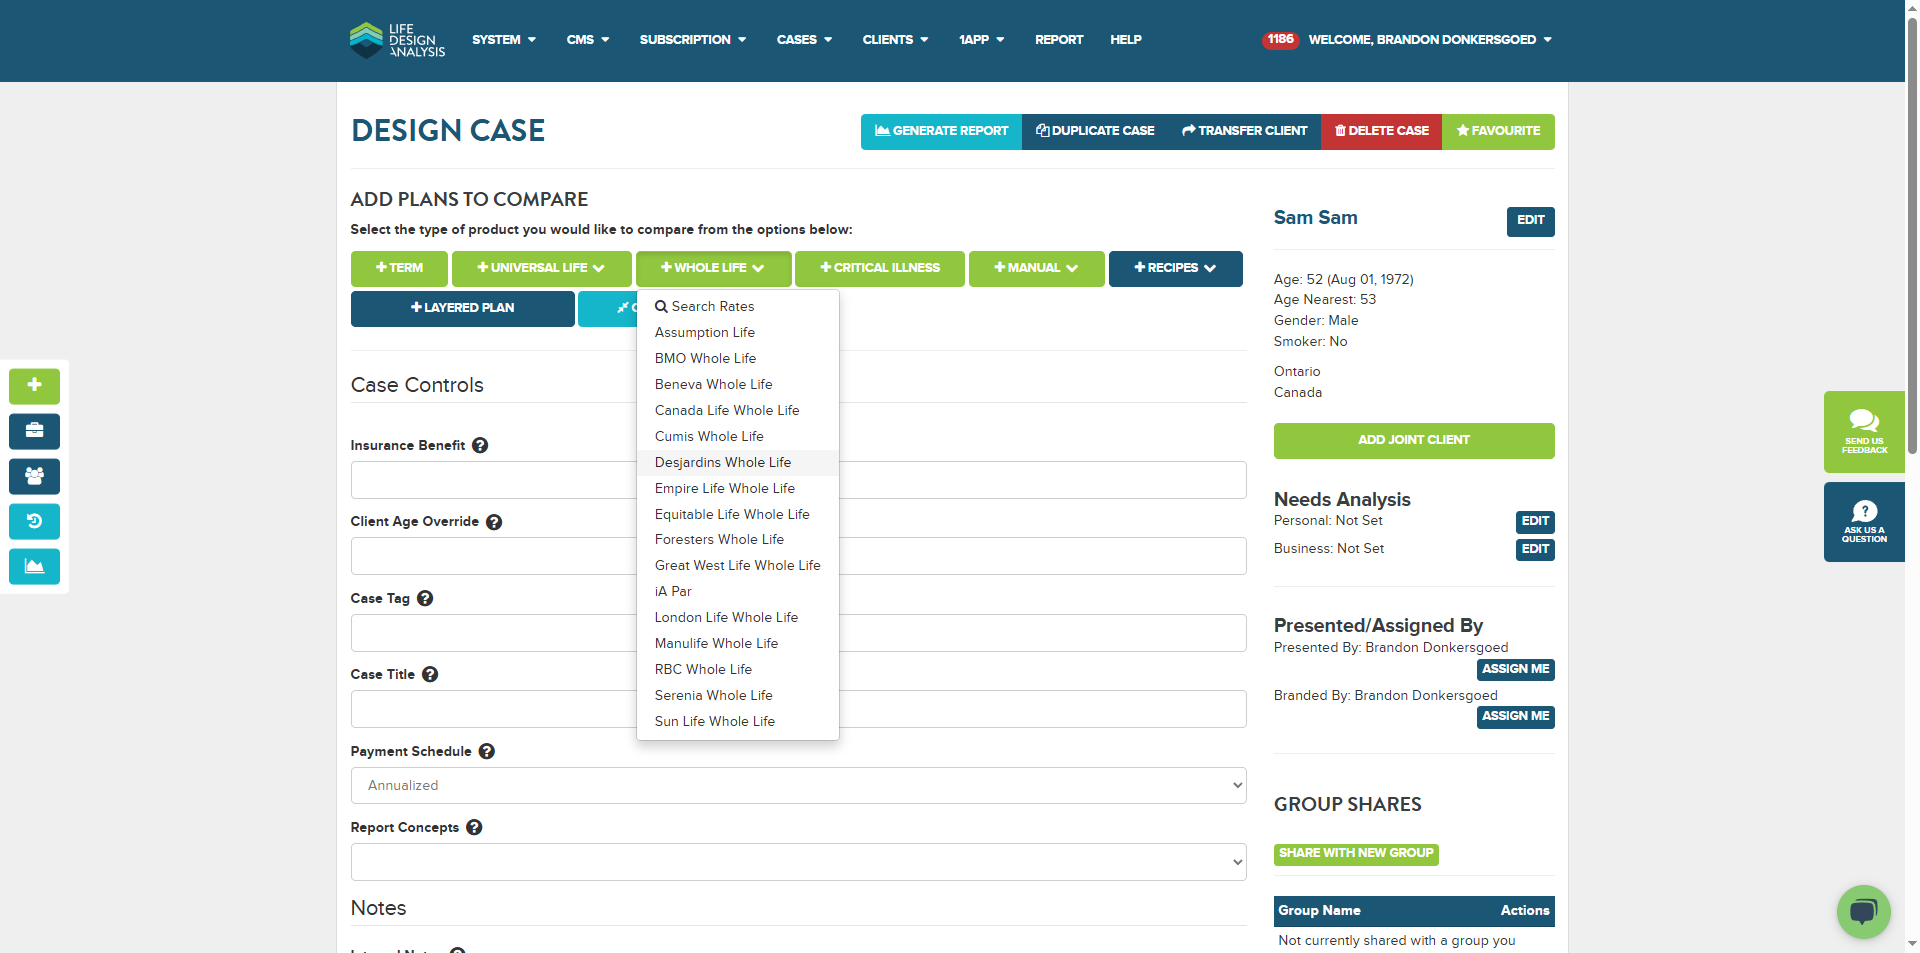

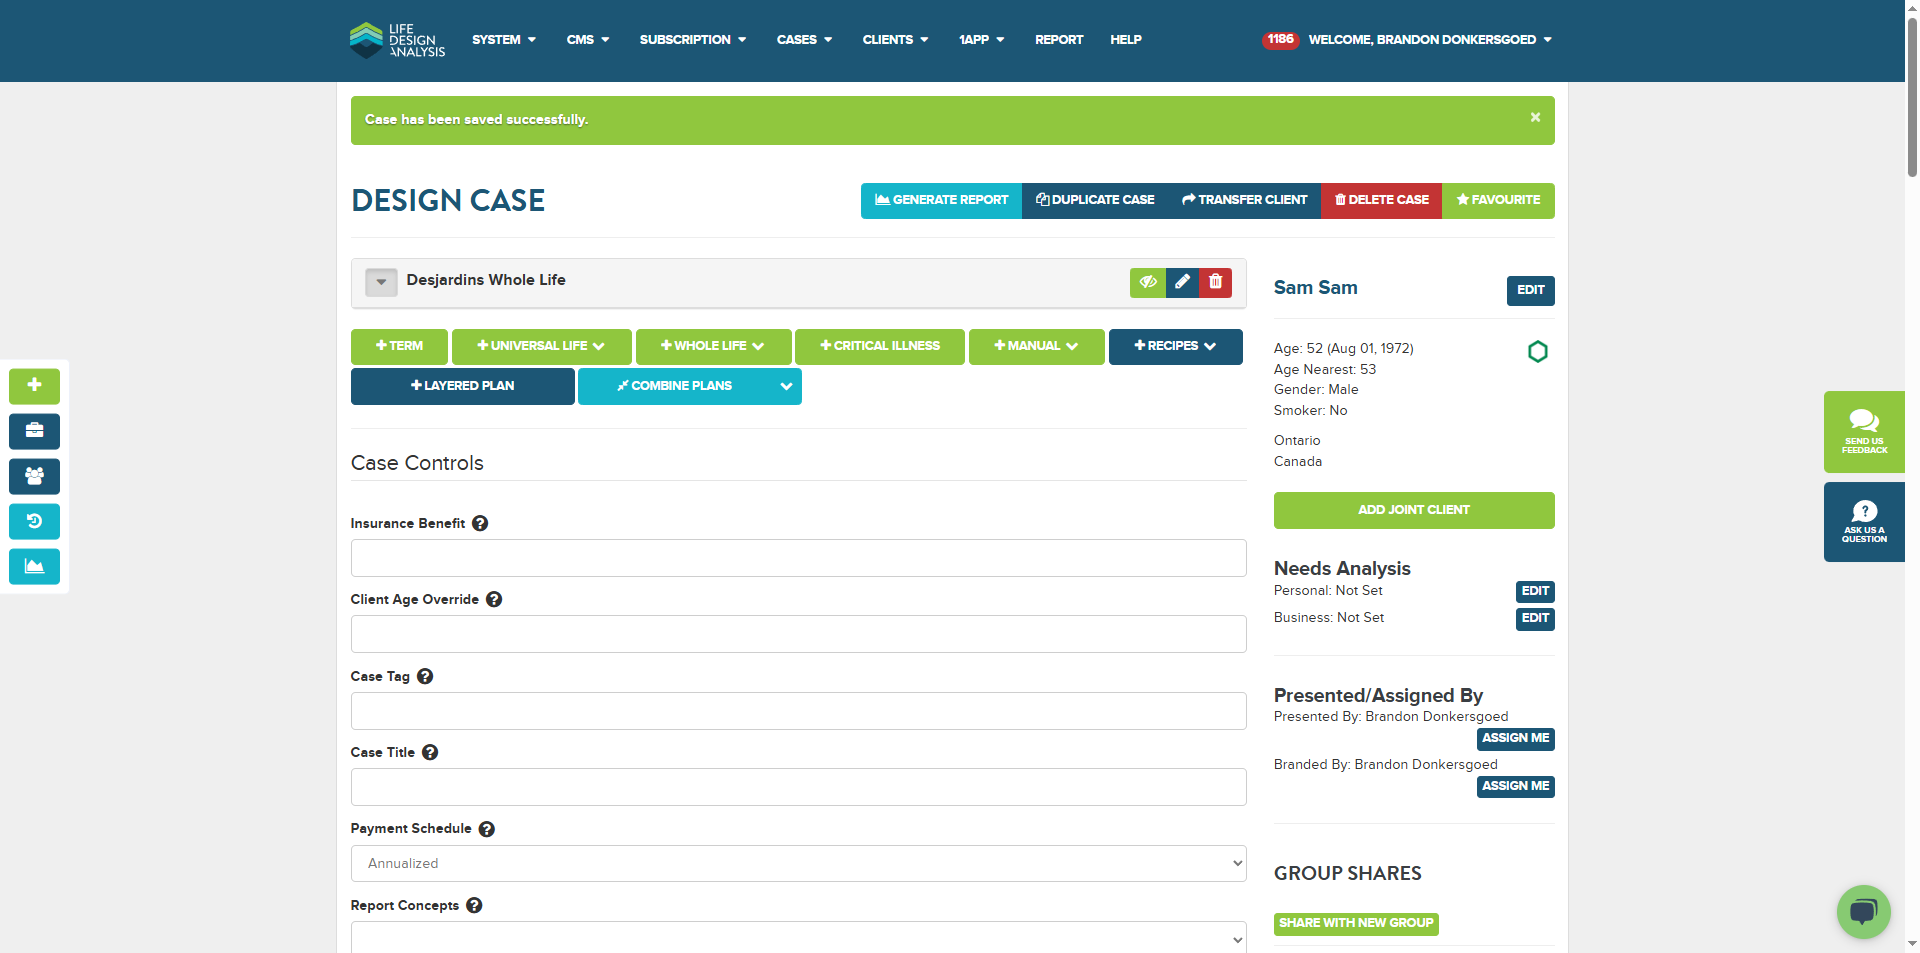
You can do this either from a new case on the side or through your client. I usually have many sample clients and create a new one. You could also use an existing case. The important part is adding the Dejardin whole life product. Even if we push an update, if the case was created a week ago, it will retain the original values imported for the whole life. So, you need to import a new product to test it.
Alright, we have the import spreadsheet file ready.
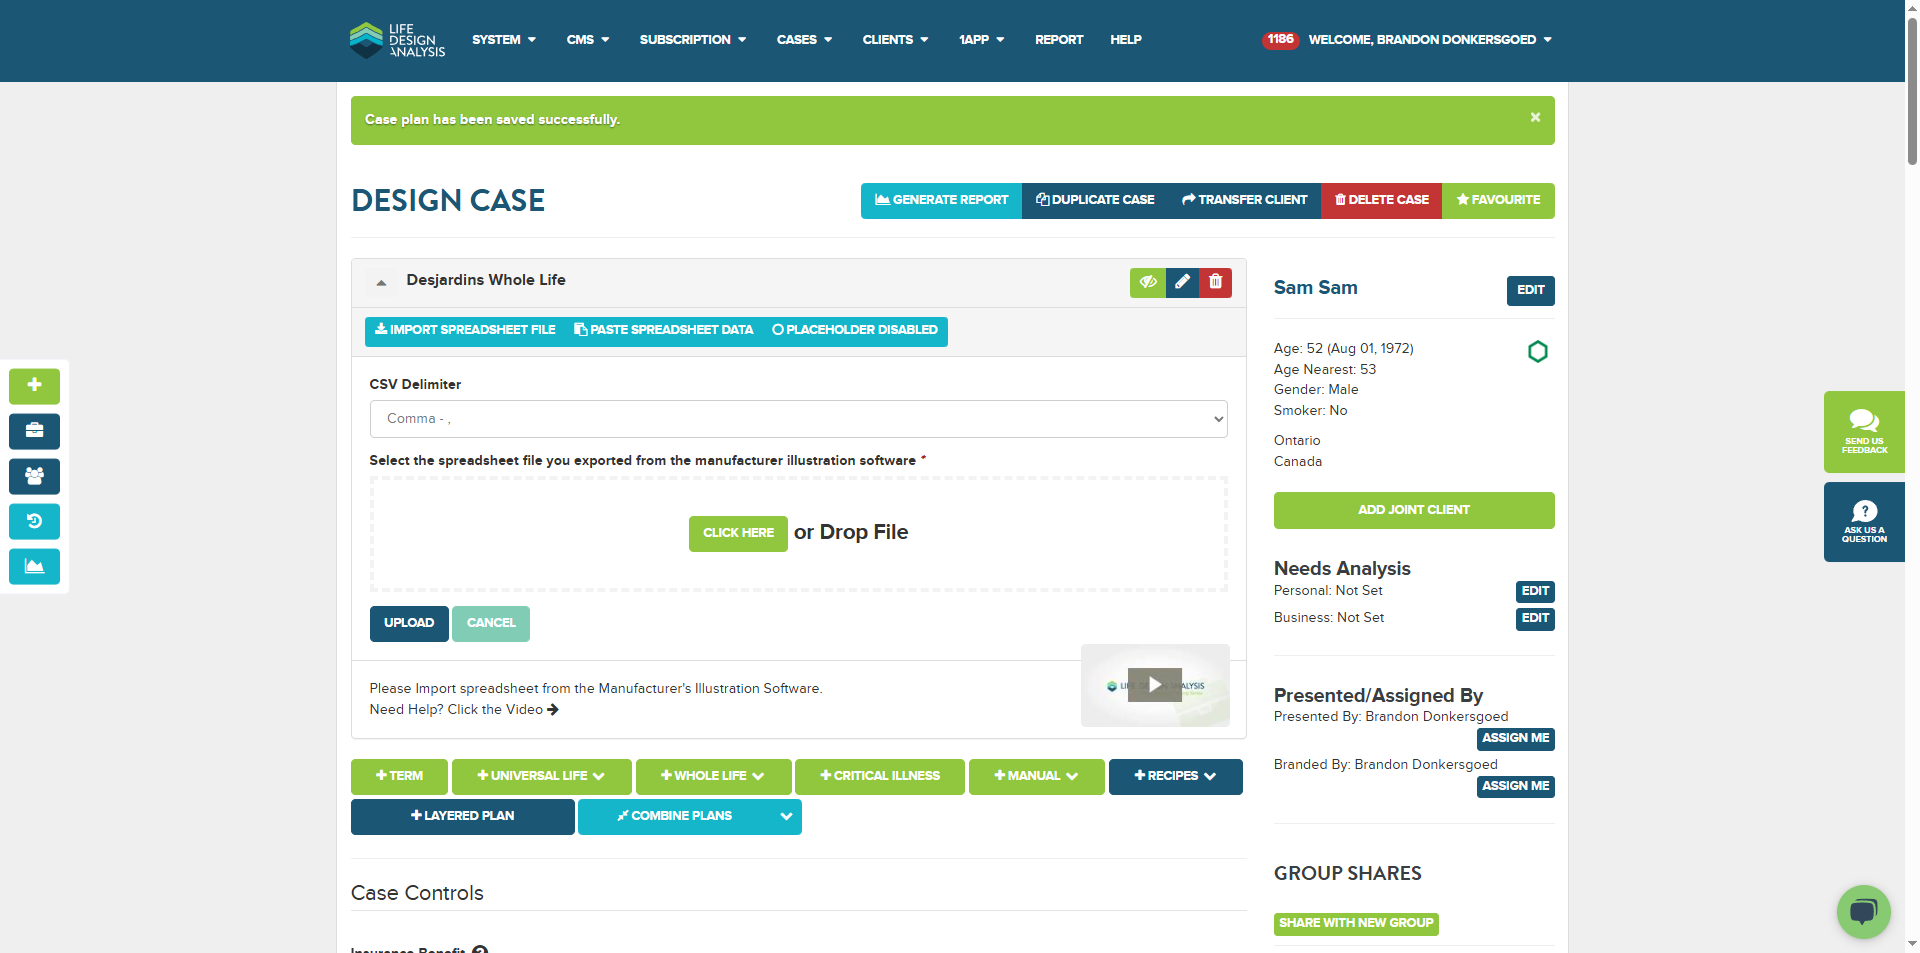
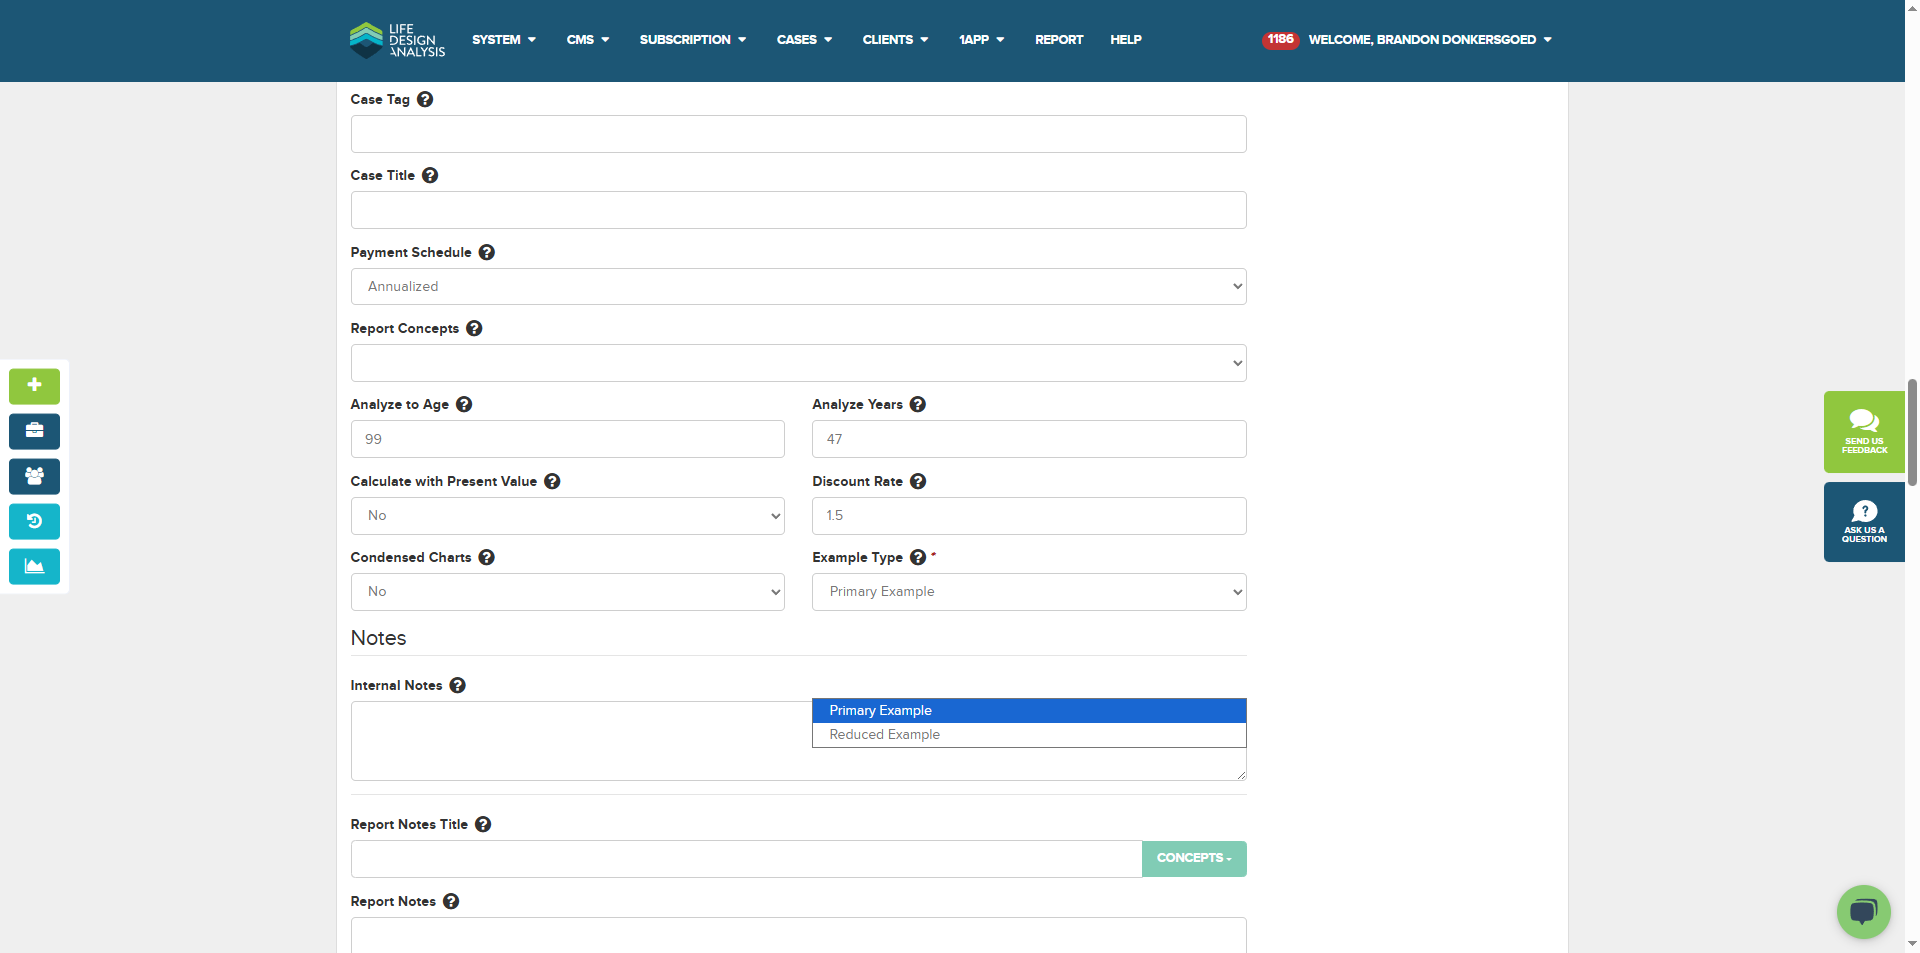
I'm going to click there, click there, and click there to import the file. The advisor or ticket reported that this issue occurred in the reduced example, but we've already noticed problems in the primary example.

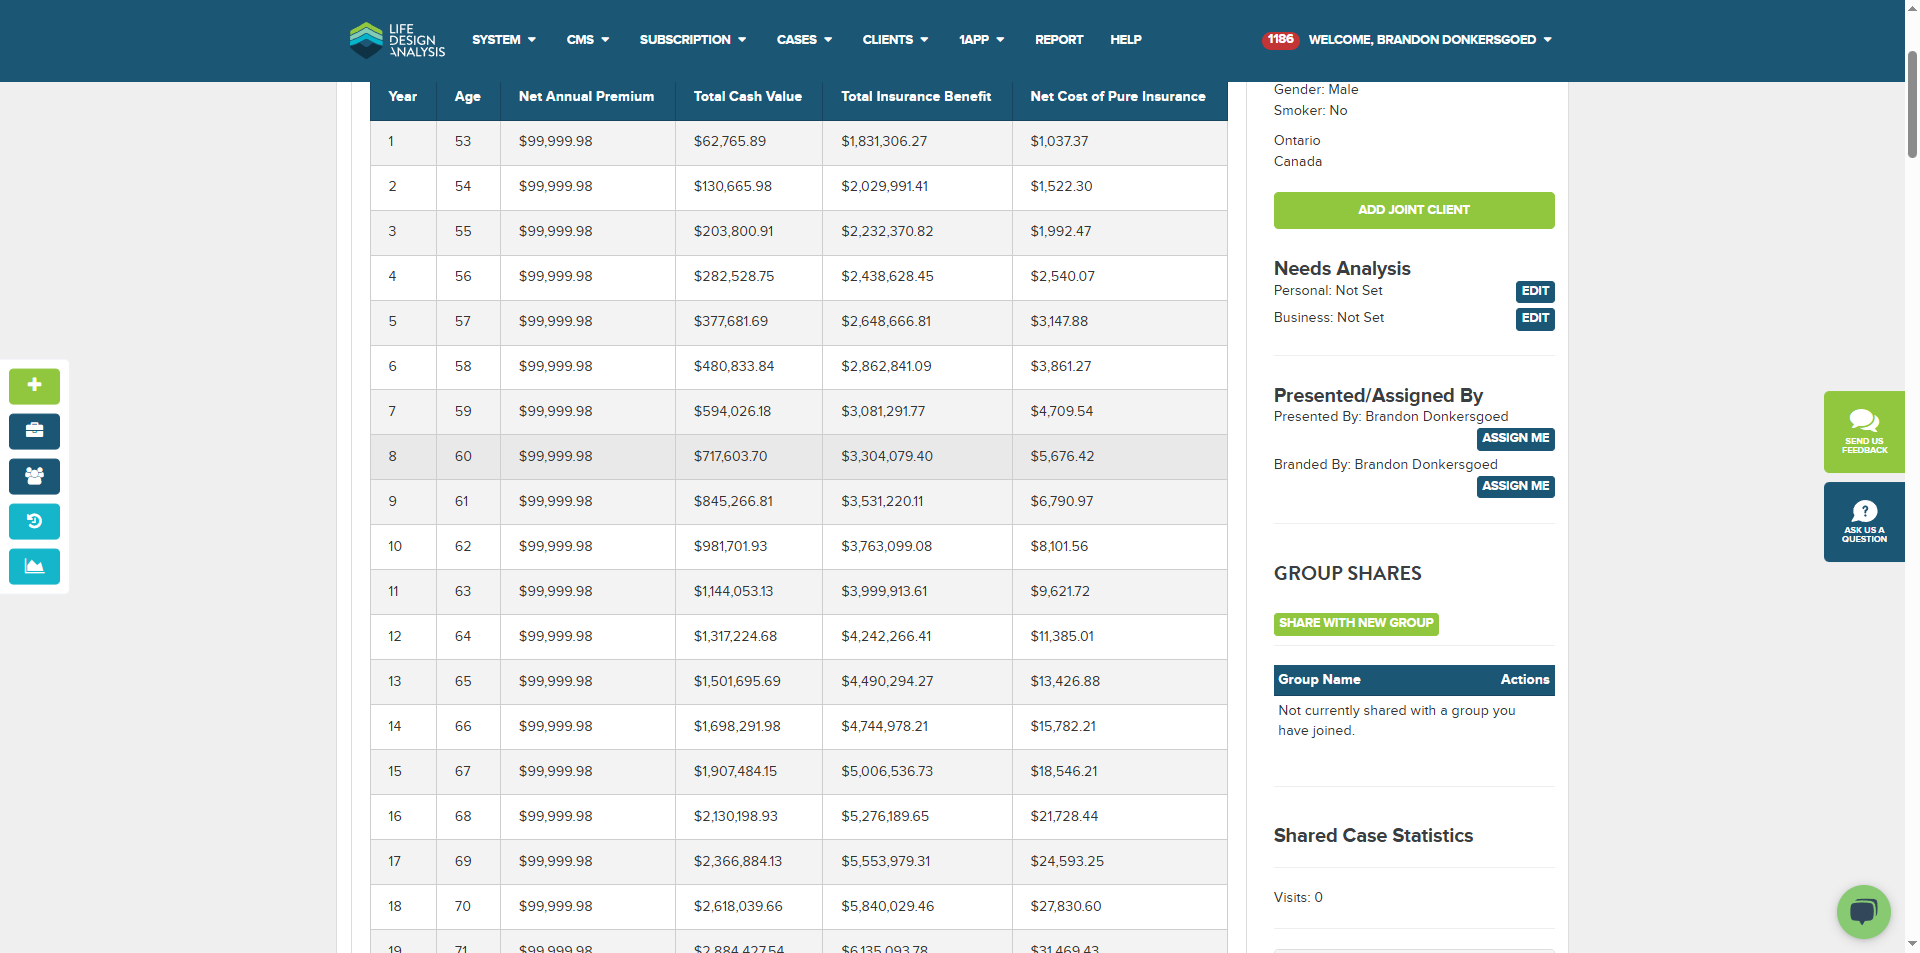
As you can see, the net annual premium stops after 20 years. In the spreadsheet, if we look at the current tab, it should be reduced by half after 20 years and continue until the end of its life cycle. Even if it used a different column, it should have been 60,000 or down to 38,000. There aren't any columns that reach 99,000 and then stop. Something unusual is happening there. Ideally, it should be using column H.
That's just the net premium paid by the client. I'm going to check the premium offset. There aren't many ways this shows 99,000 down to zero, but that's what happened here.

Wait a minute. It has now been saved successfully.
We will review the values and notice that the reduced net annual premium is $0, which is incorrect. By examining the spreadsheet again, we can check the reduced minus 1% offset. You might also have looked at the reduced minus 1%. Honestly, I'm not sure what the difference between these two is. The premium should be the same in this case because it uses the same header for both, so there shouldn't be a difference.
I don't know why it's taking zero. We will report that as a bug.