
Understanding the Portfolio Screen: Asset Allocation and Investment Tracking
Explore the new Portfolio screen, showcasing asset class allocation, investment details, and dynamic features for a comprehensive investment overview.
The Portfolio screen displays the assets that users have invested in, categorized by asset class. It includes detailed information such as total values, composition percentages, and a dynamic pie chart for visual representation.
We will also explore how to interact with the static assets and understand the basic suggestions provided by the AI. Additionally, we'll discuss the potential for dynamic elements and the integration of plugins to enhance user experience.
Let's get started
OK. We have a new screen here called Portfolio. It has a number 1 next to it because the demo's story is that the portfolio has a message.
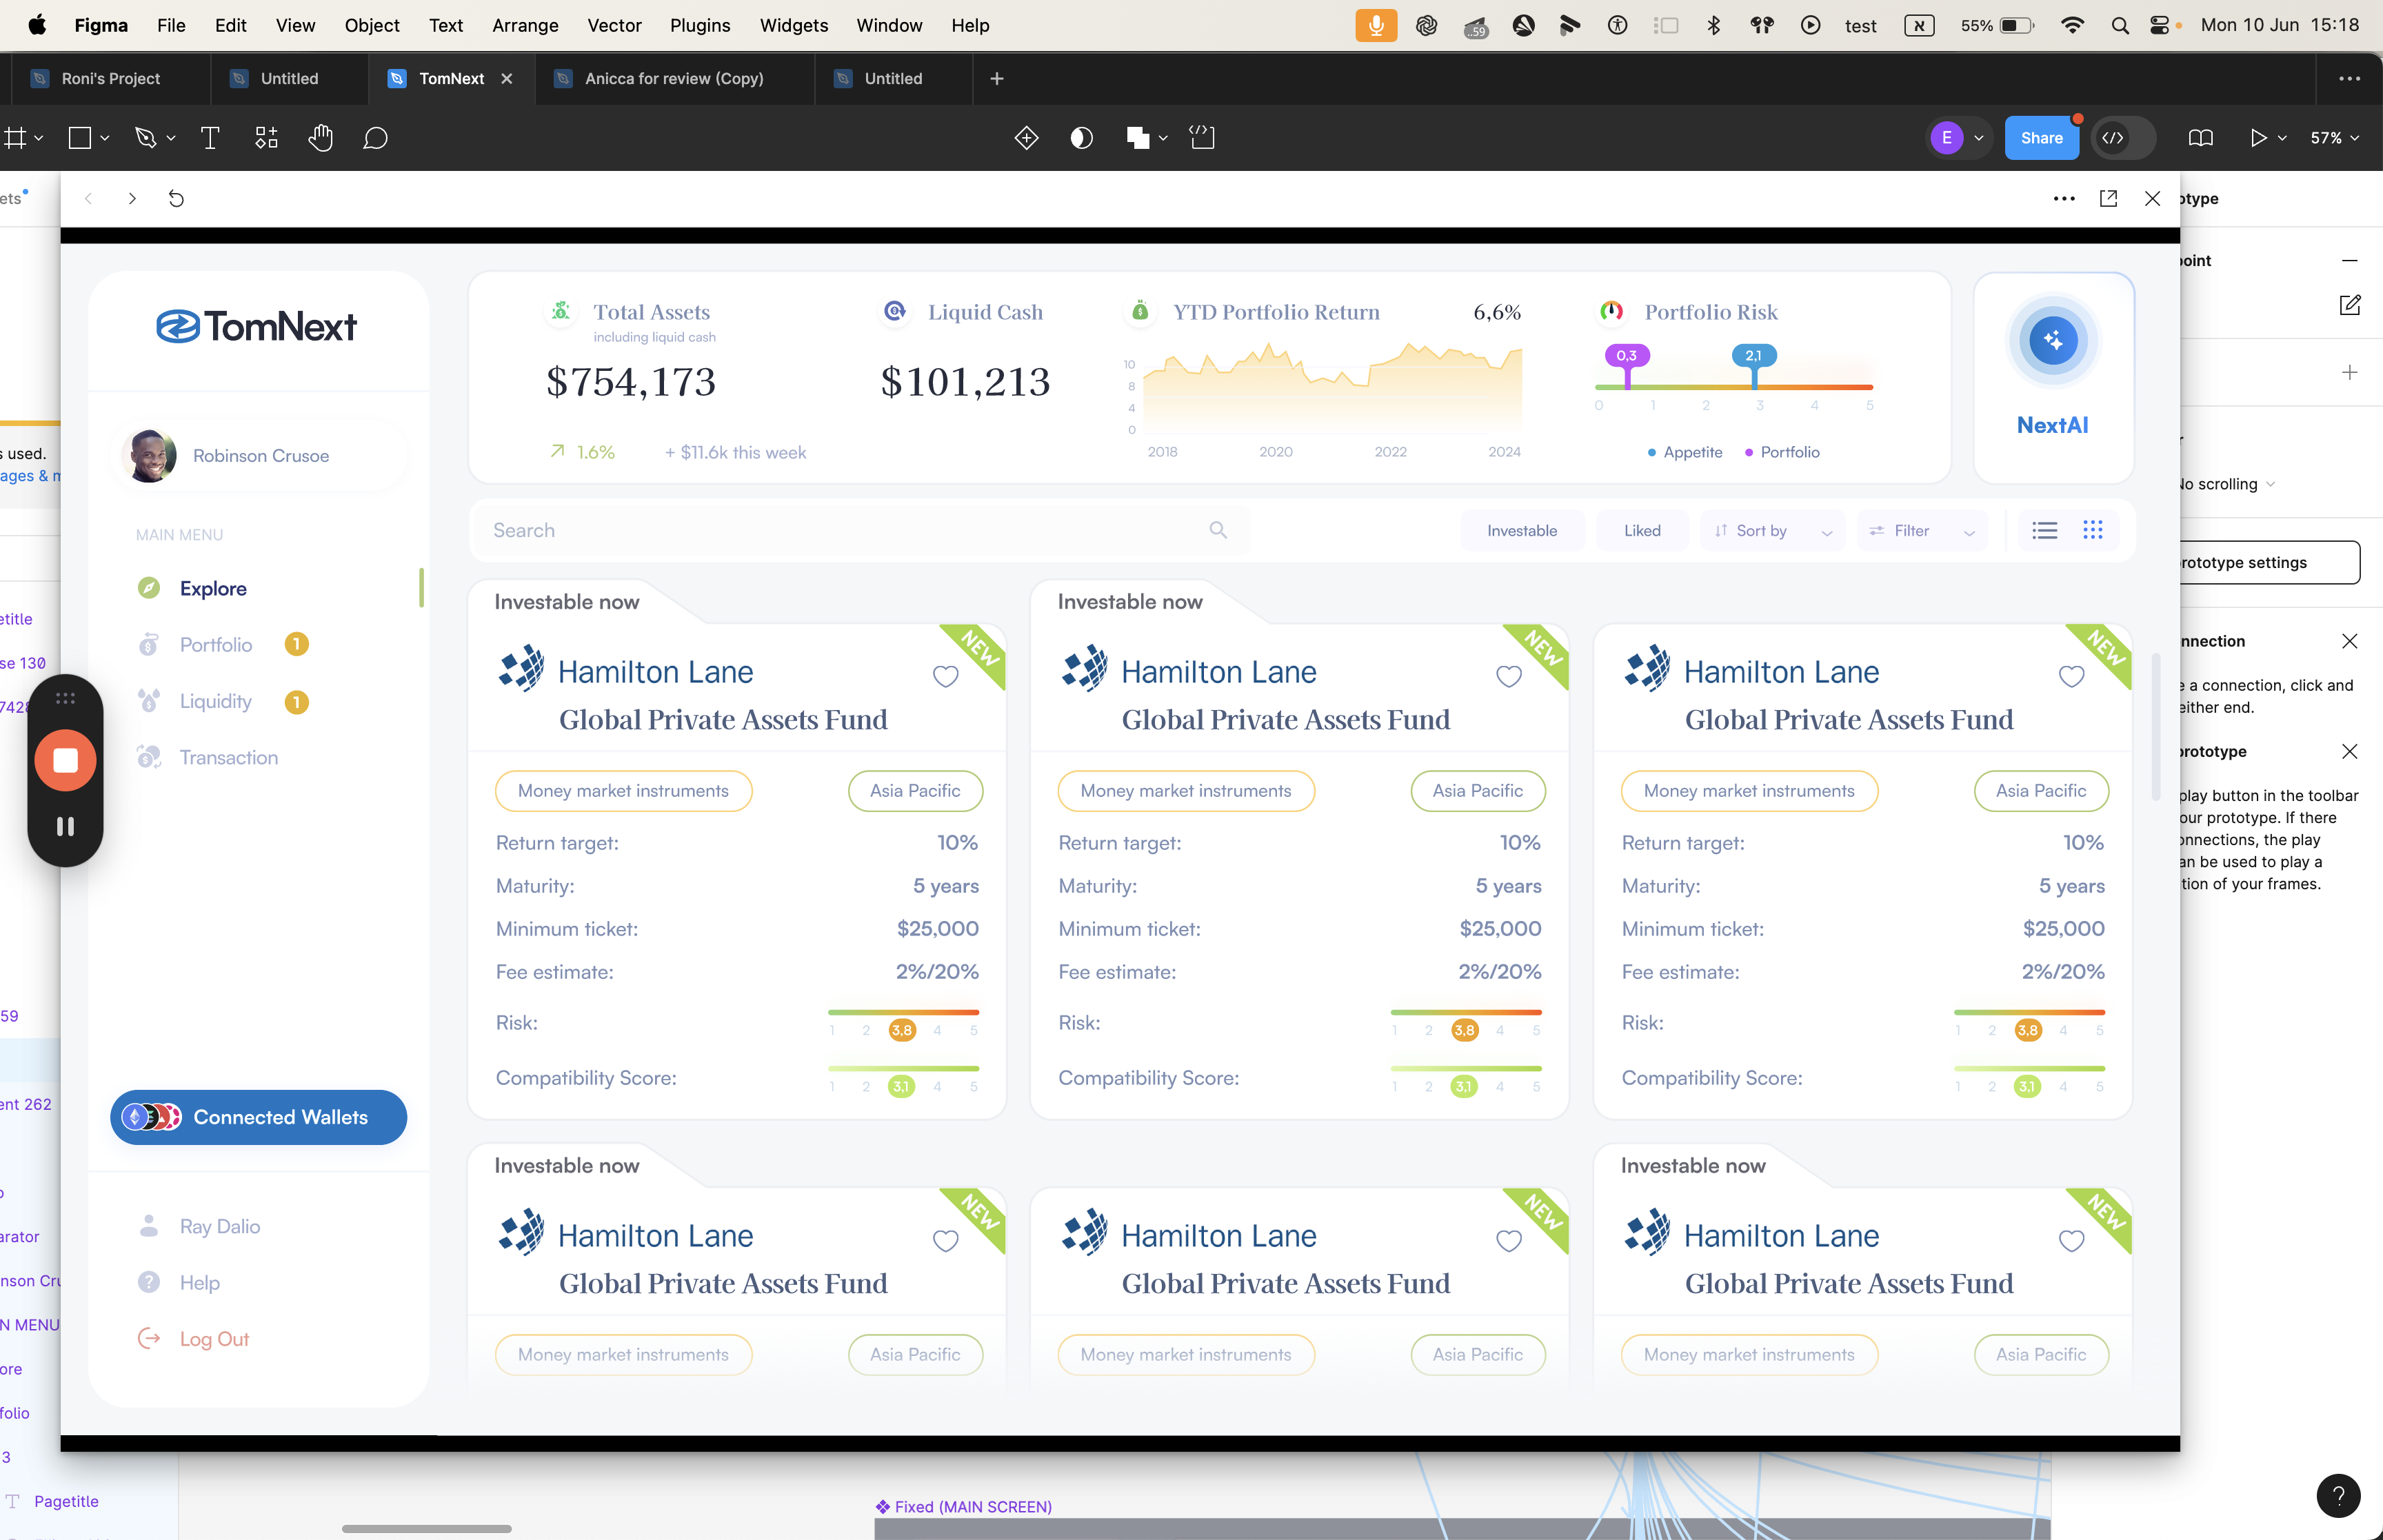
We go to the Portfolio screen. We see the asset class allocation and the asset class. The Portfolio screen shows the assets the user has invested in. You can see the assets they invested in. If you remember, you confirmed the investment on the confirmation screen. They invested in these assets.
Each asset belongs to a different asset category. This is also part of another screen. In the end, this page shows which assets have been invested in within the portfolio. At the top, you can see the asset class, total values, and composition percentages. Additionally, there is a pie chart. If there is a plug-in for a dynamic pie chart, that is great.
Let's make the whole process dynamic. Also, if you look at the AI here, it provides basic suggestions. These need to be integrated into the previous task, which involves different contexts. These suggestions will appear when the screen is opened. The number 1 here corresponds to the number 1 there, indicating a call to action for the user.
You can add the shine here to catch their eye. When they click this, it won't open the AI.

It opens a screen with an image at the top. If there's an easy plug-in, it can be implemented. Do some research and let me know the answers. These are static assets that will open when you press on them.

They will provide us with the assets here as well.
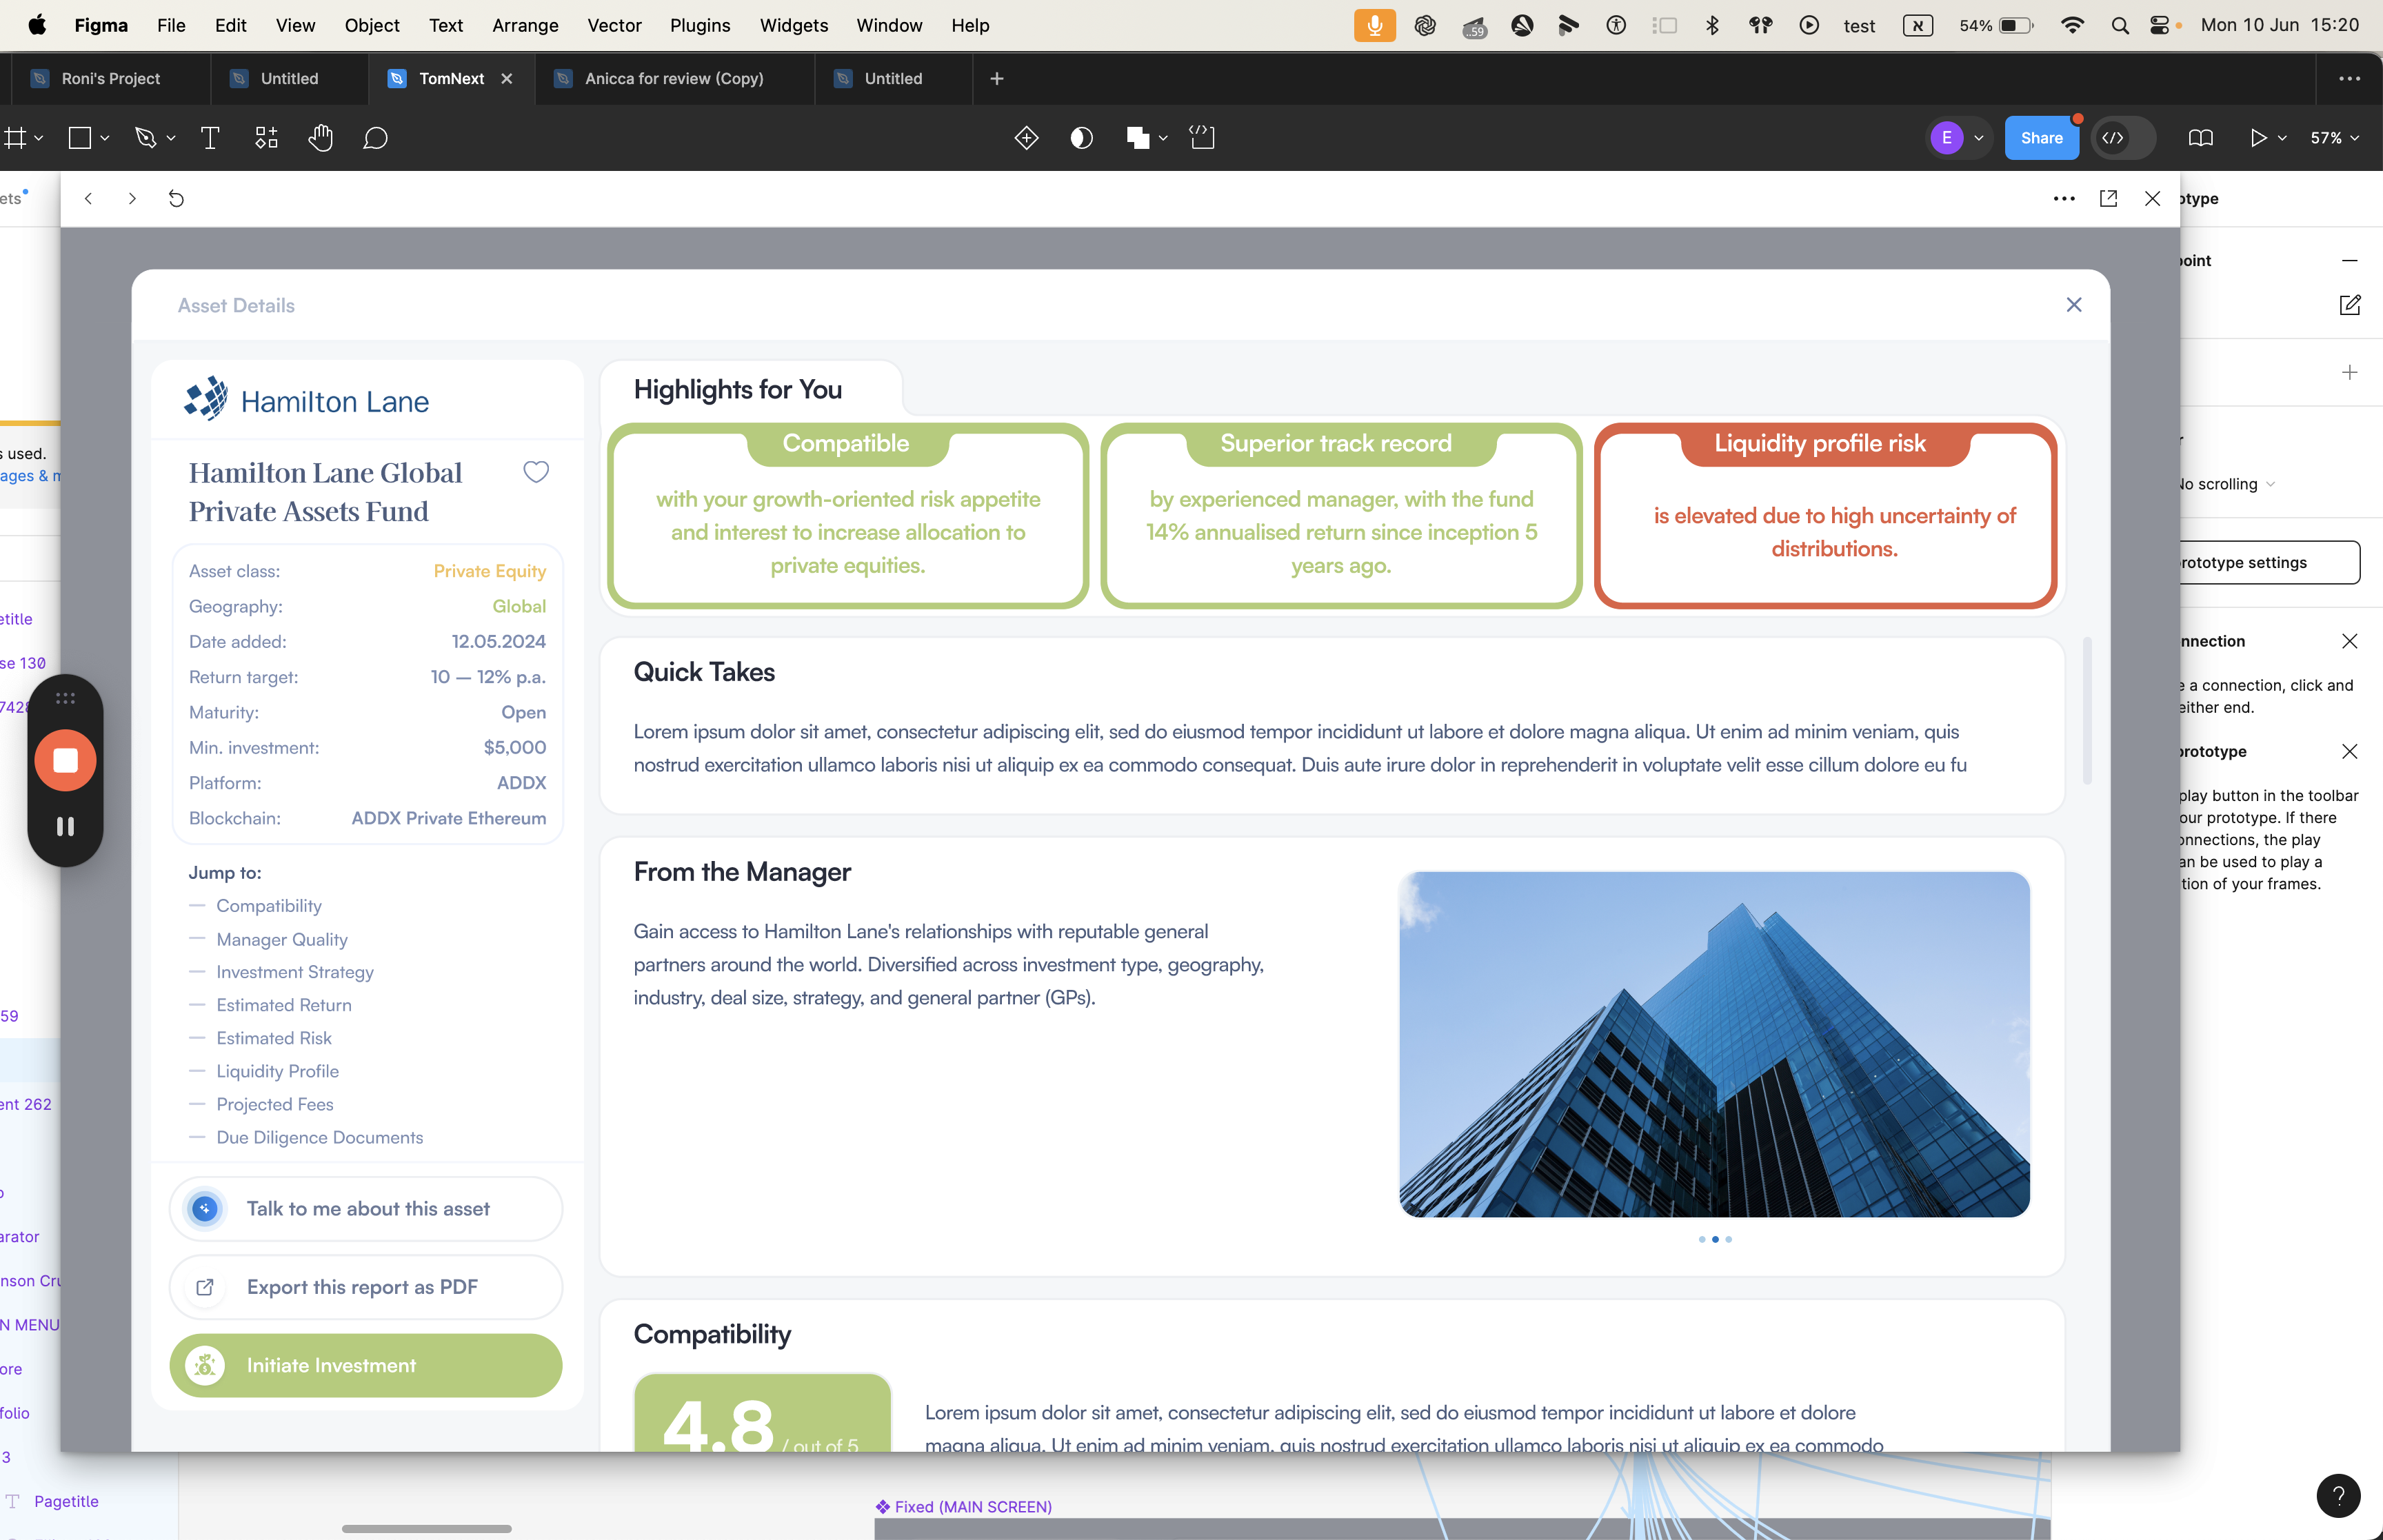


Open. This button does nothing.

This button doesn't do anything. I will send a link to the Figma.

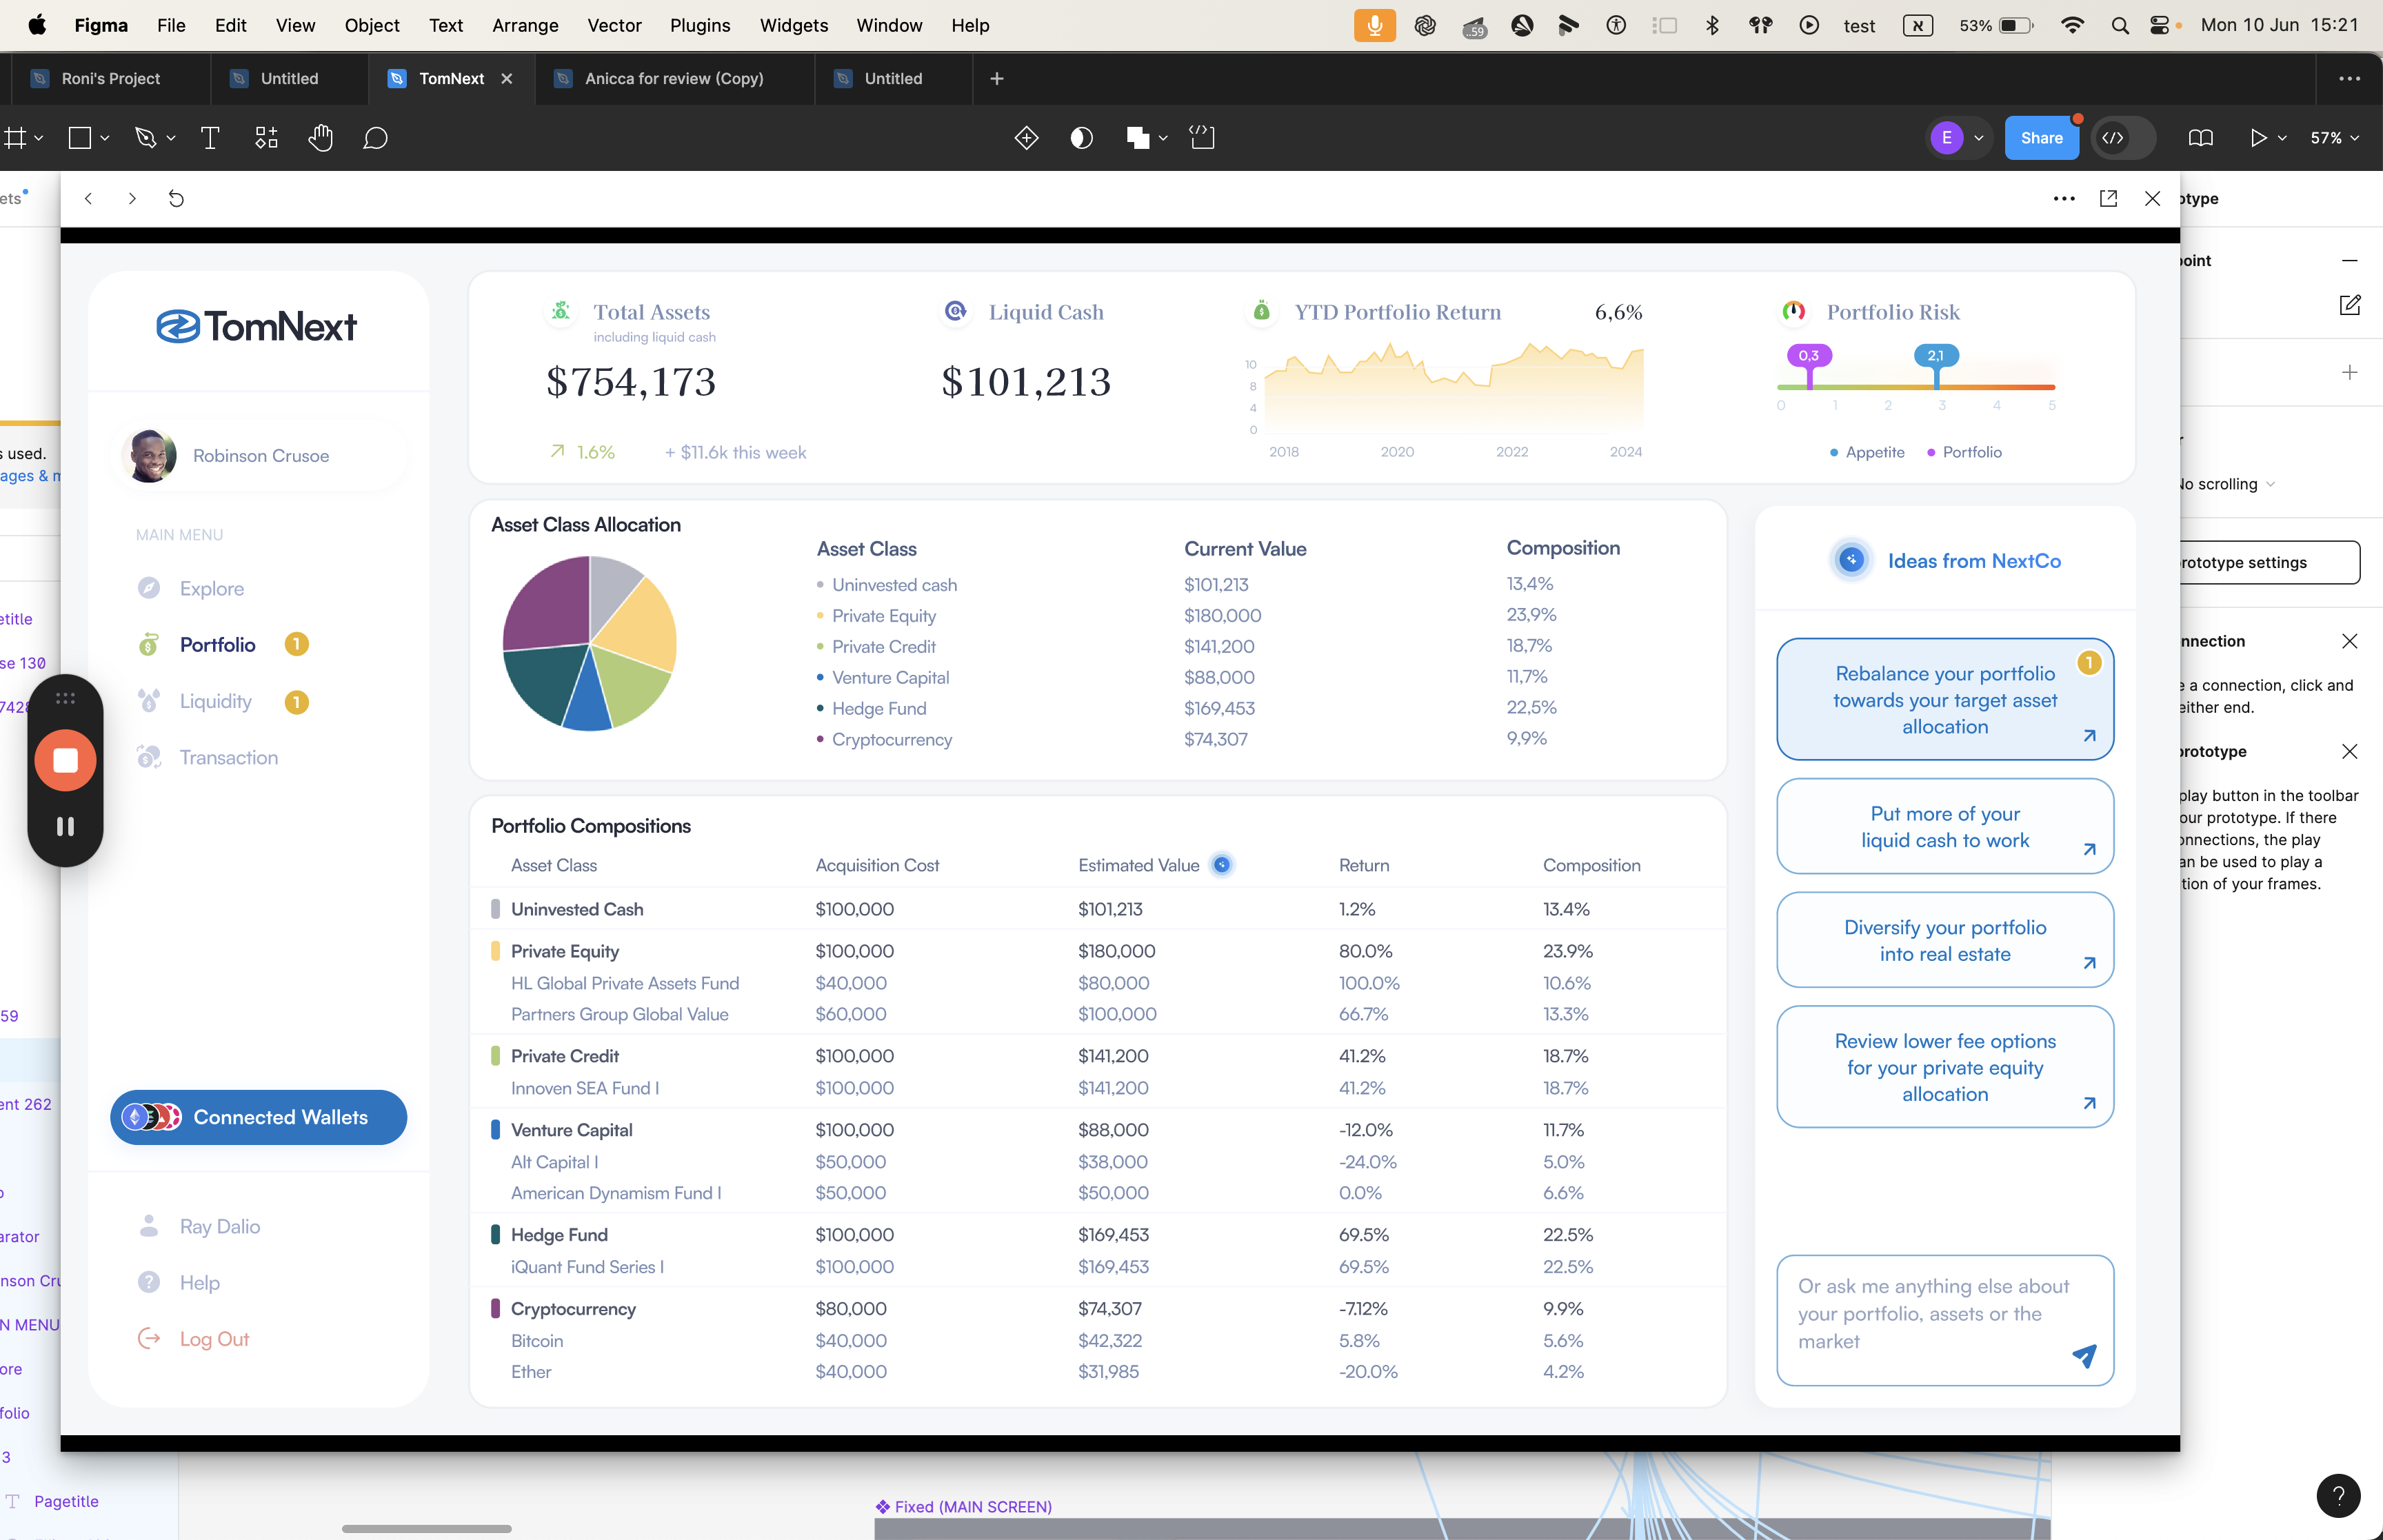
To reiterate, a portfolio includes all the assets a user has invested in. I suggest creating a table to track this information. Include fields for the purchase price, estimated value, and return, using data from the confirmation screen. Additionally, create a dashboard for users to edit, allowing them to add or remove investments. This way, new investments can be added, and old ones removed for the next demo.
Please let me know your thoughts on the dynamics of the demo.
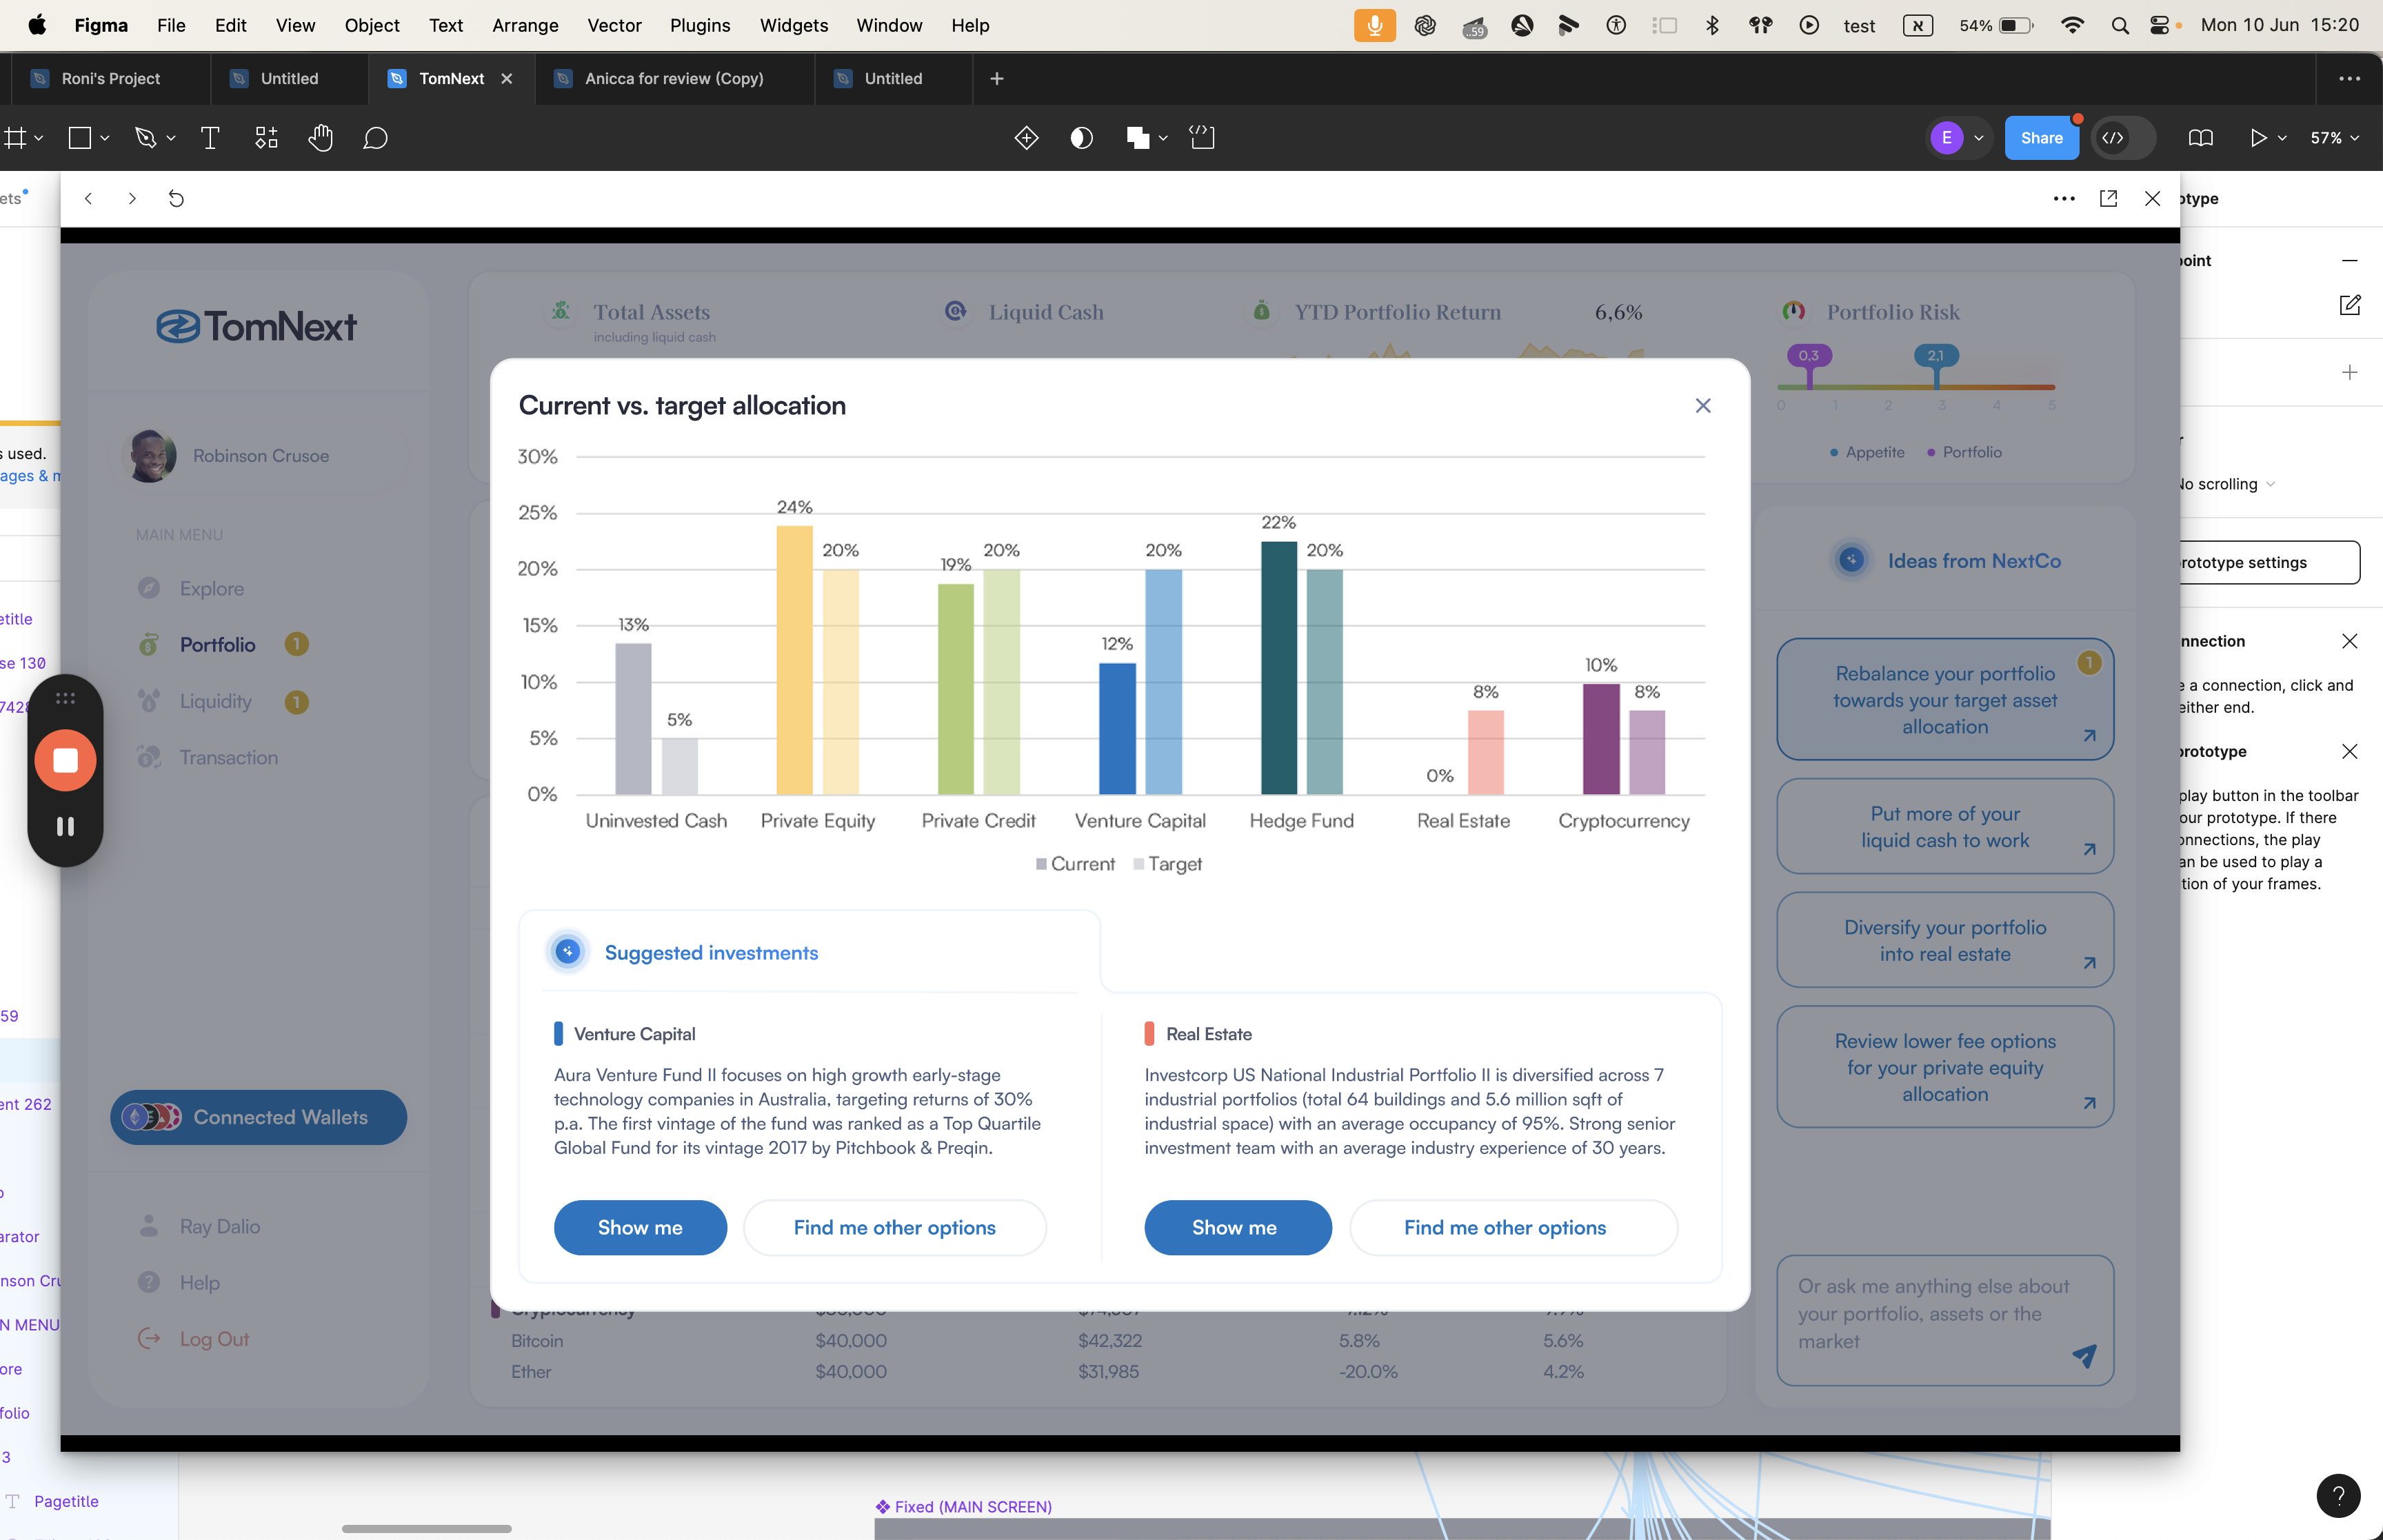
Can this also be dynamic? We currently show only the current state, while the target is static.
