Icon

Updating the Monthly CDFI Audit Report

Learn how to update the monthly CDFI audit report in Word by importing and formatting data from YTD audit exhibits in Excel.

By Eddy Kup

This guide demonstrates how to update the monthly CDFI (Community Development Financial Institution) audit summary report. Following these steps ensures your executive summary, data tables, and target market performance figures accurately reflect the latest monthly and year-to-date (YTD) lending data.

This workflow applies to reporting analysts or compliance officers responsible for generating internal audit reports. It should be performed monthly once the latest loan production tests and workbook links in Excel are refreshed.

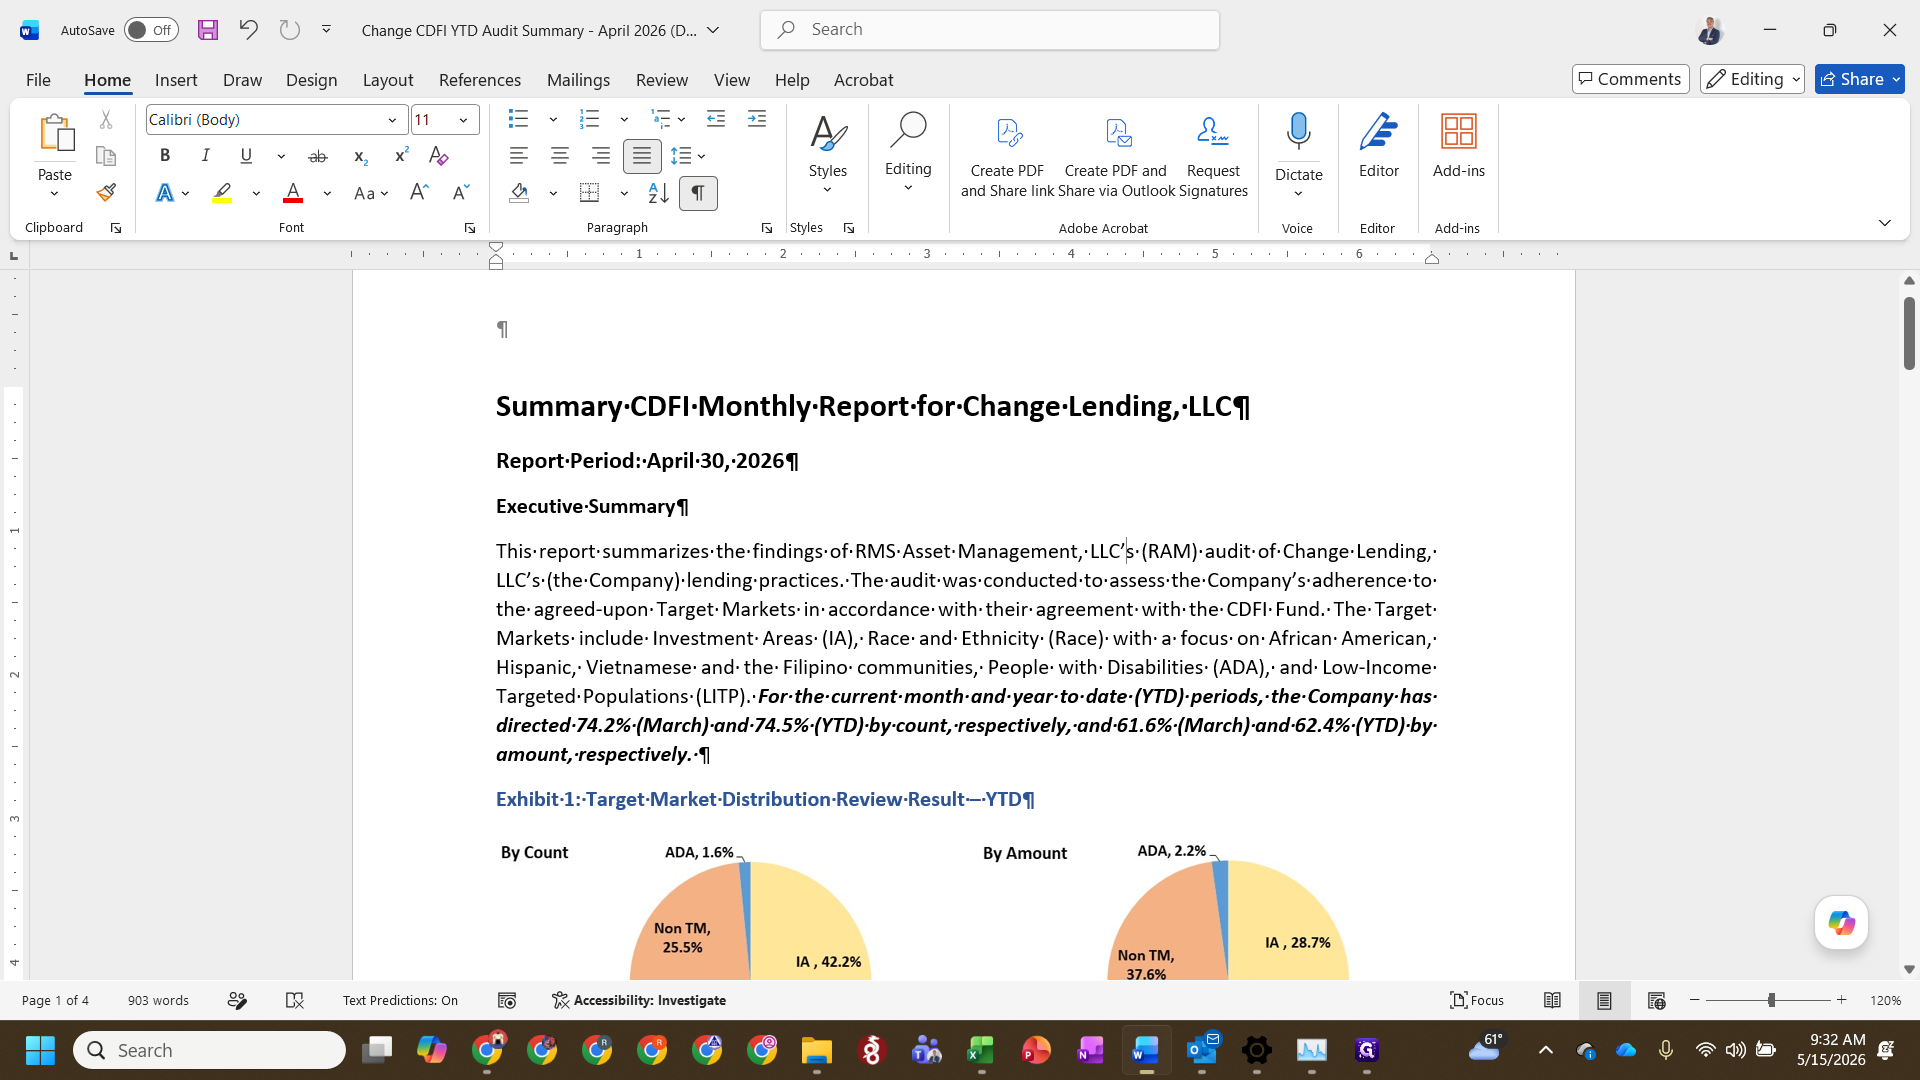
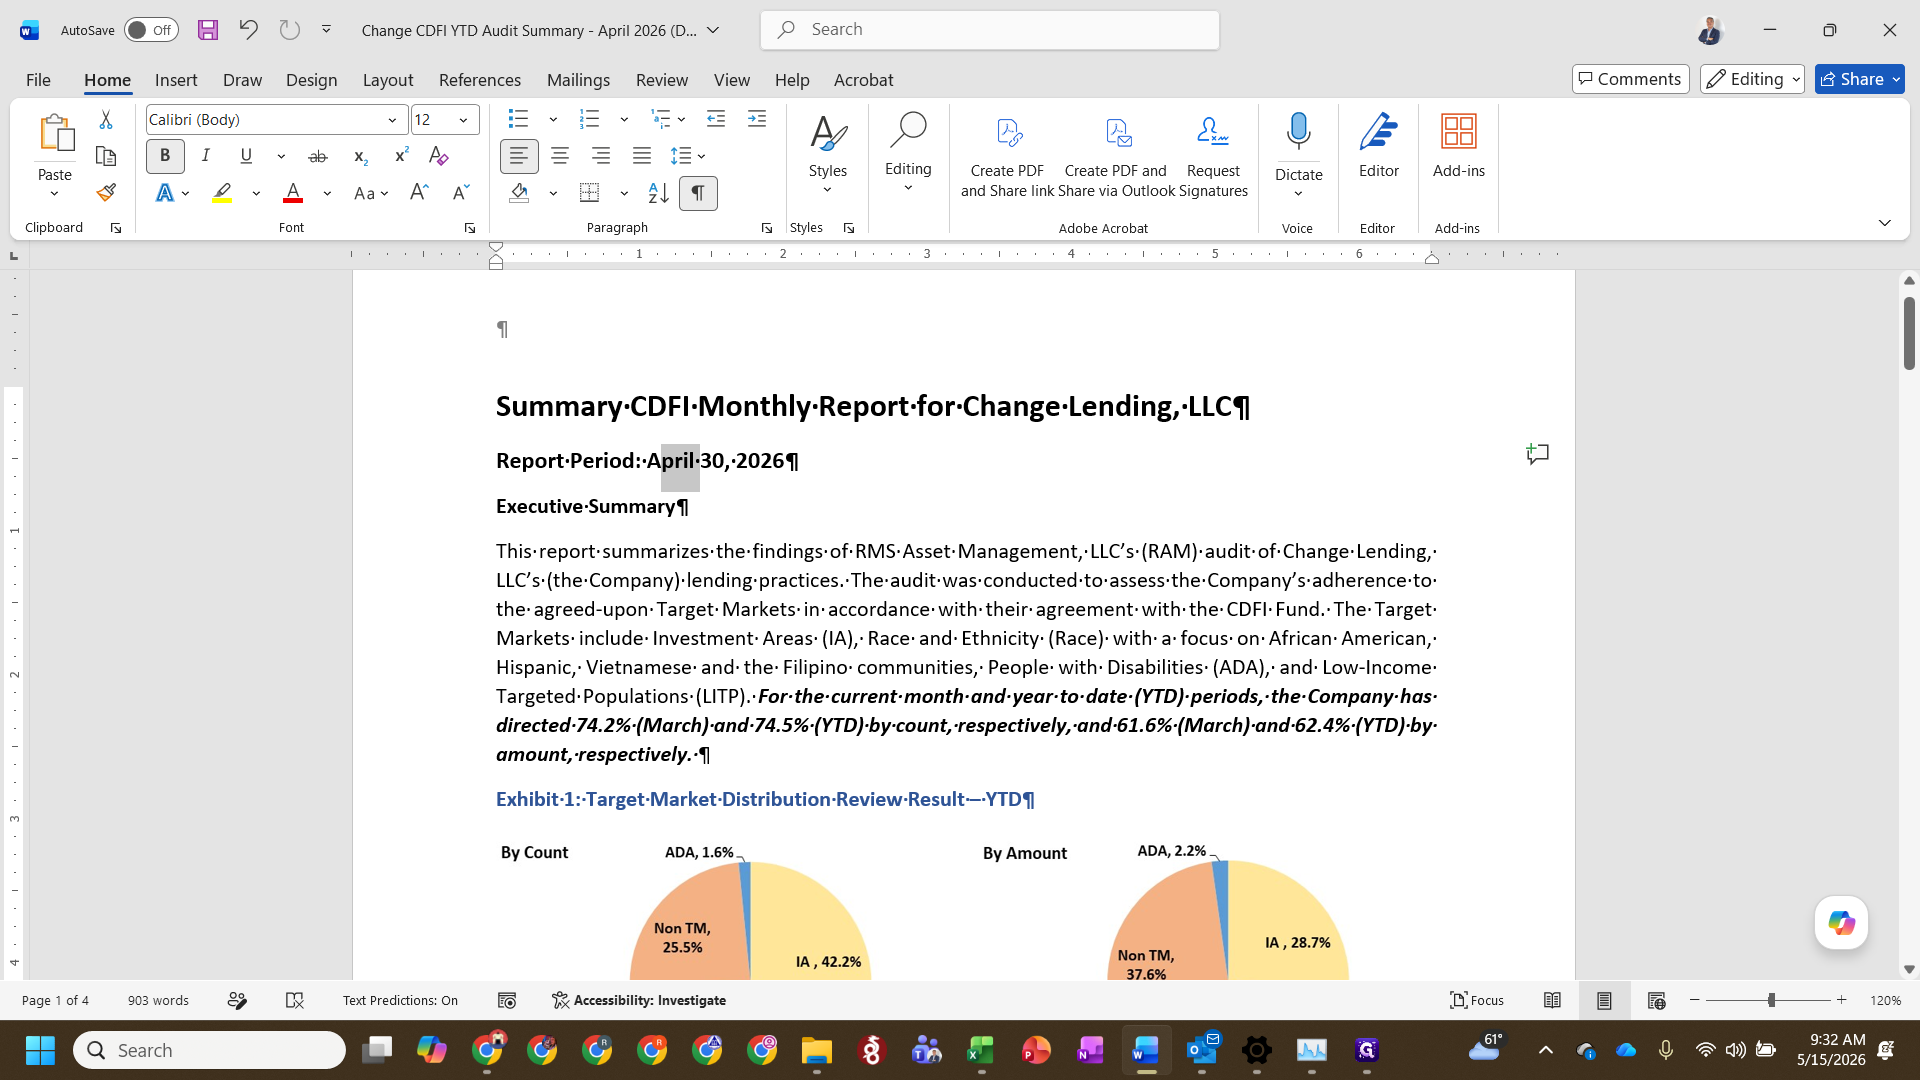
Update the Report Header

Before updating the numbers, ensure the document context reflects the correct reporting period.

1
Open the Word document for the monthly report (e.g., Summary CDFI Monthly Report).
Step #1: Open the Word document for the monthly report (e.g., Summary CDFI Monthly Report).
2
Locate the report date at the top of the document and change it to the current period end date, such as April 30, 2026.
Step #2: Locate the report date at the top of the document and change it to the current period end date, such as April 30, 2026.

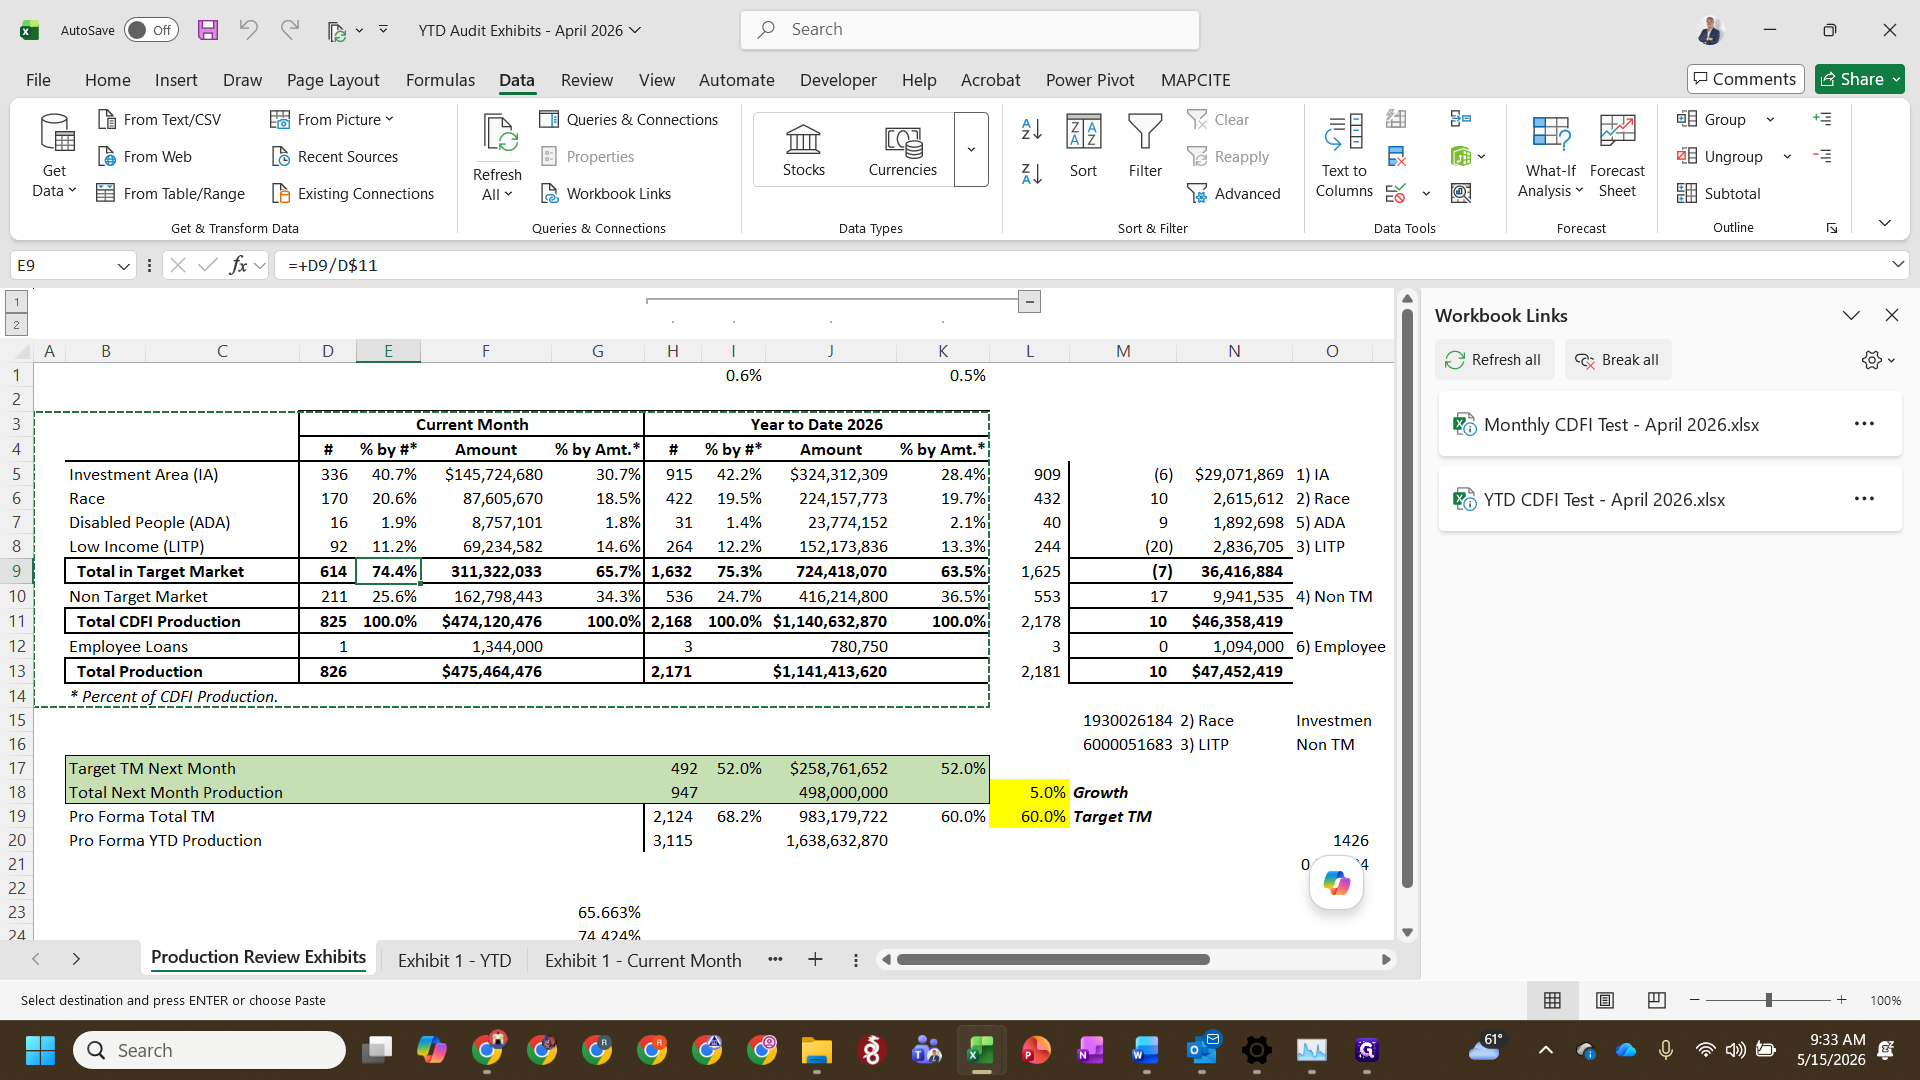
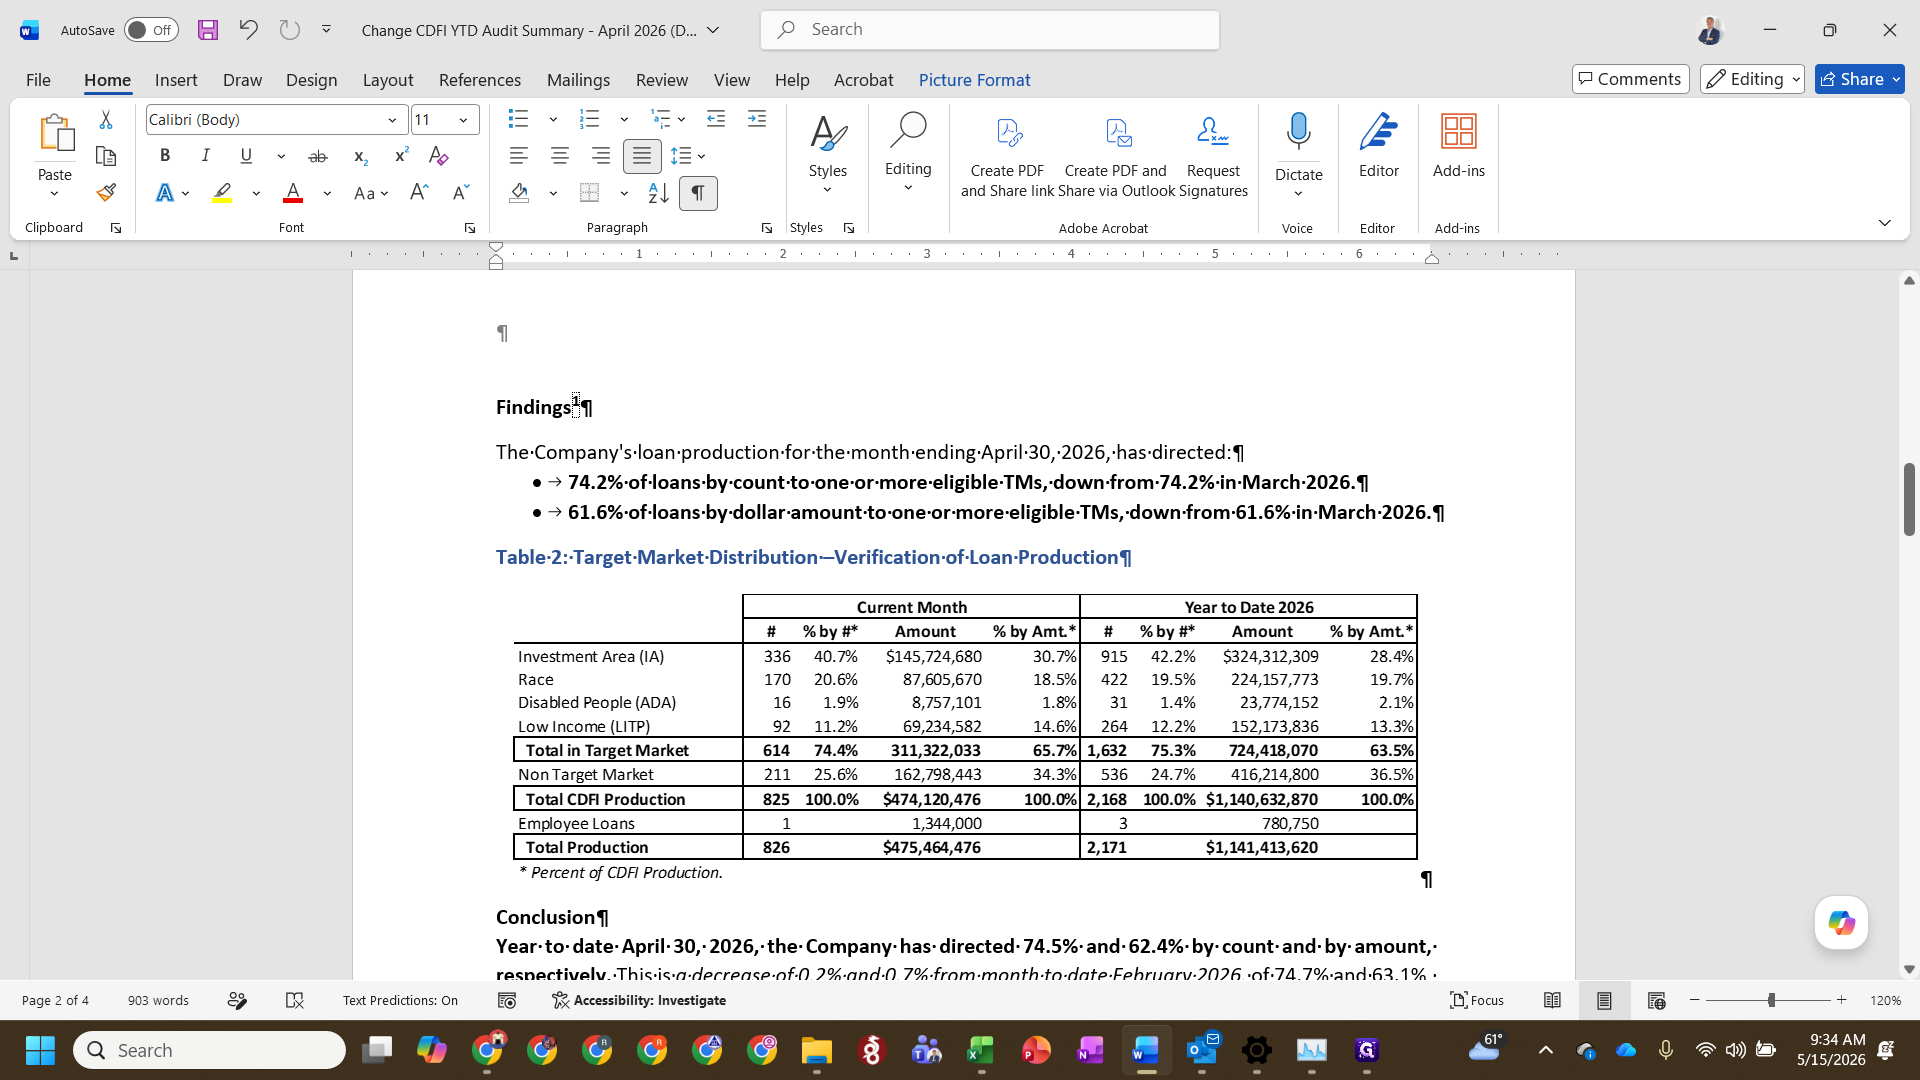
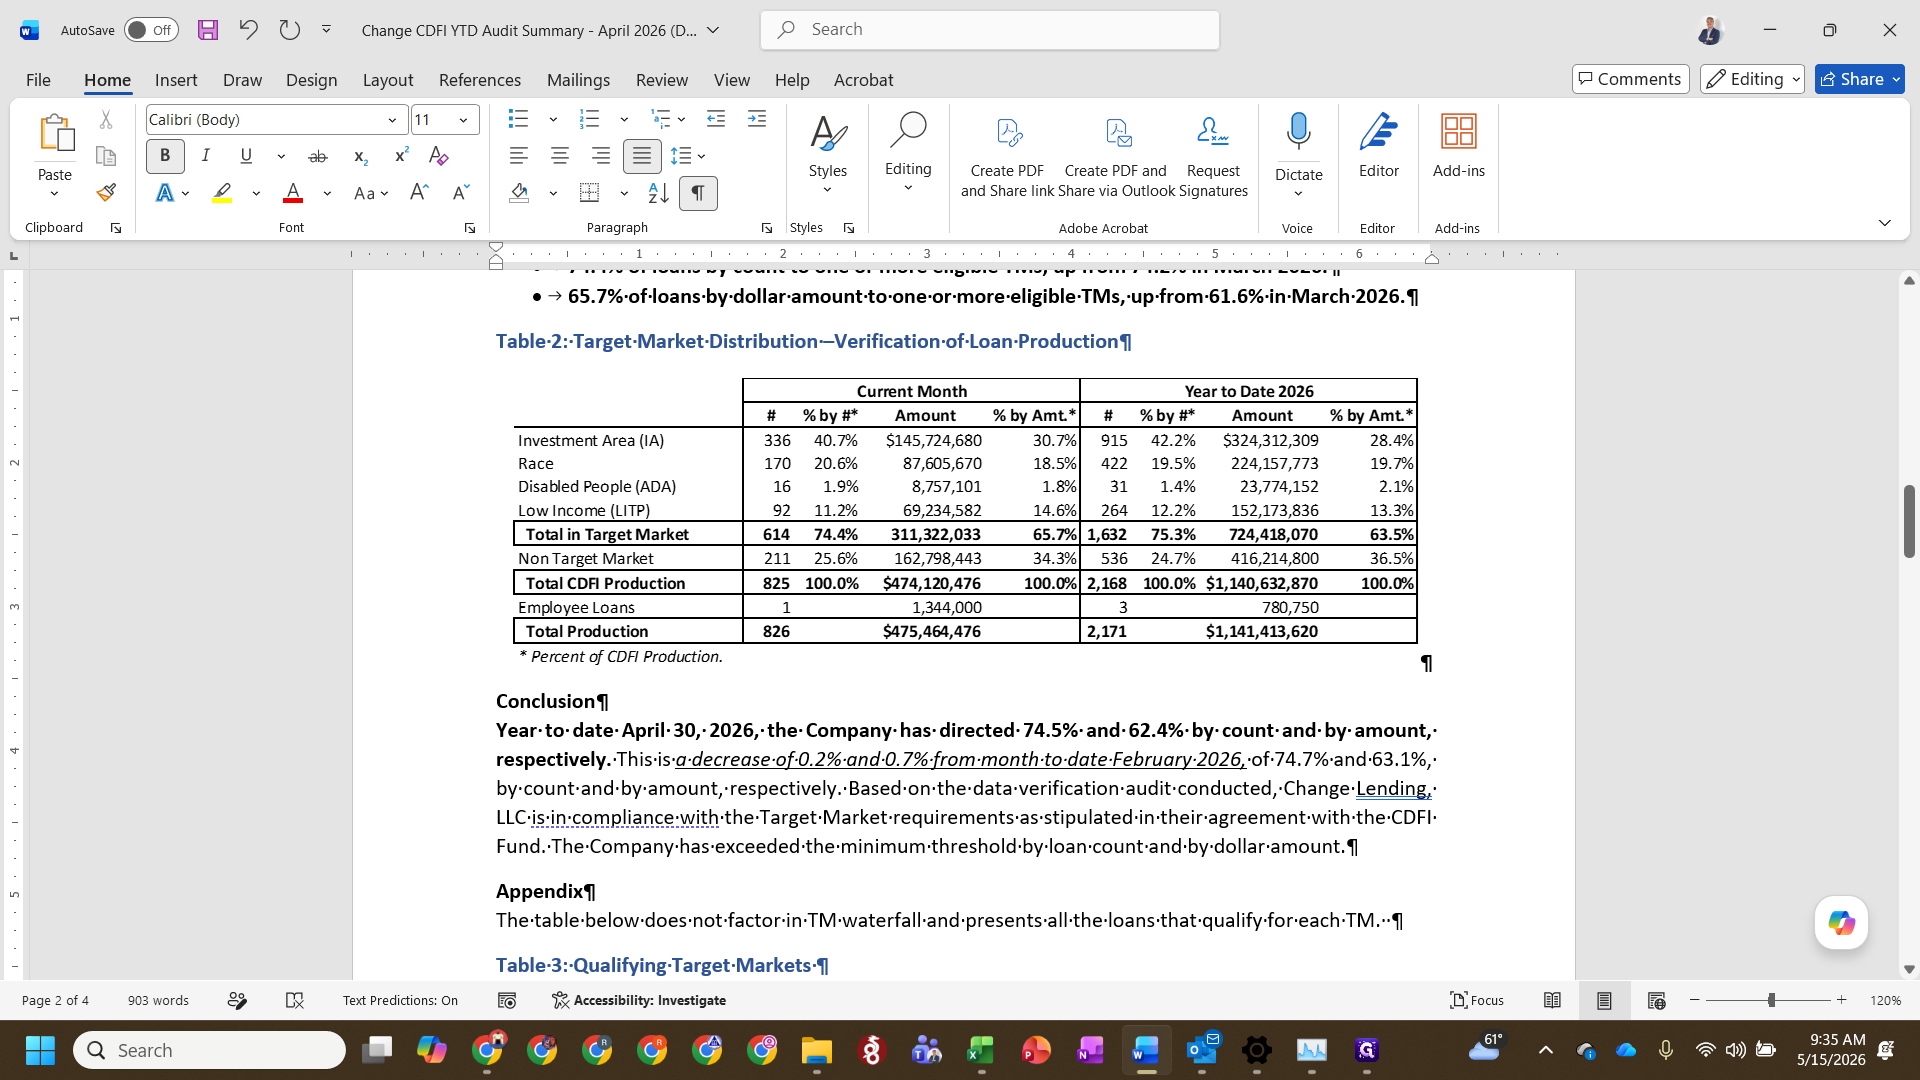
Insert Data Tables from Excel

The Word report relies on tables and charts generated in your master Excel workbook.

3
Open your YTD Audit Exhibits Excel workbook and verify the workbook links to the monthly and YTD tests are refreshed.
Step #3: Open your YTD Audit Exhibits Excel workbook and verify the workbook links to the monthly and YTD tests are refreshed.
4
Select the updated data table for the current month's audit exhibit and press Ctrl + C to copy.
5
Switch to the Word document, place your cursor where the old table is located, and use Paste Special (Alt + E, then S) to paste it as a Picture.
6
Select the pasted picture and click Crop from the floating format menu to trim any excess whitespace so the table fits cleanly within the page margins.
Step #6: Select the pasted picture and click Crop from the floating format menu to trim any excess whitespace so the table fits cleanly within the page margins.

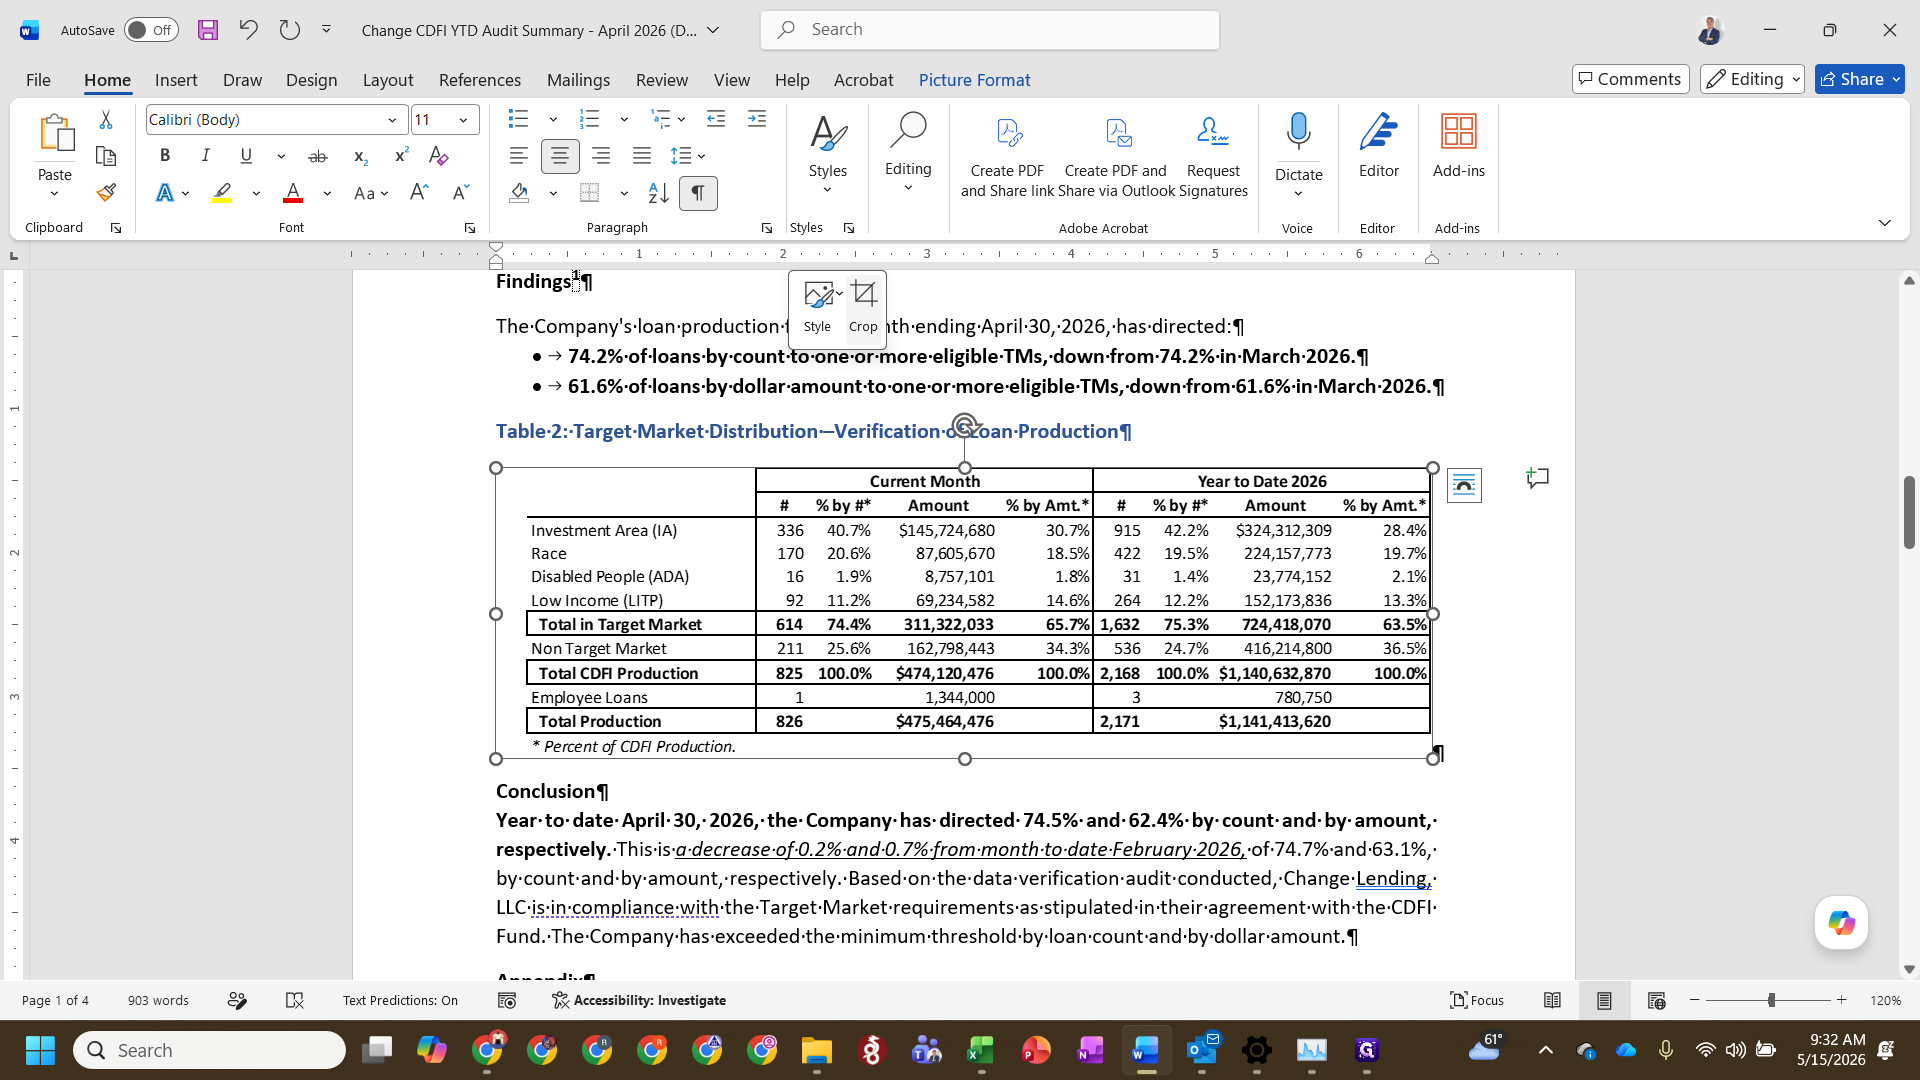
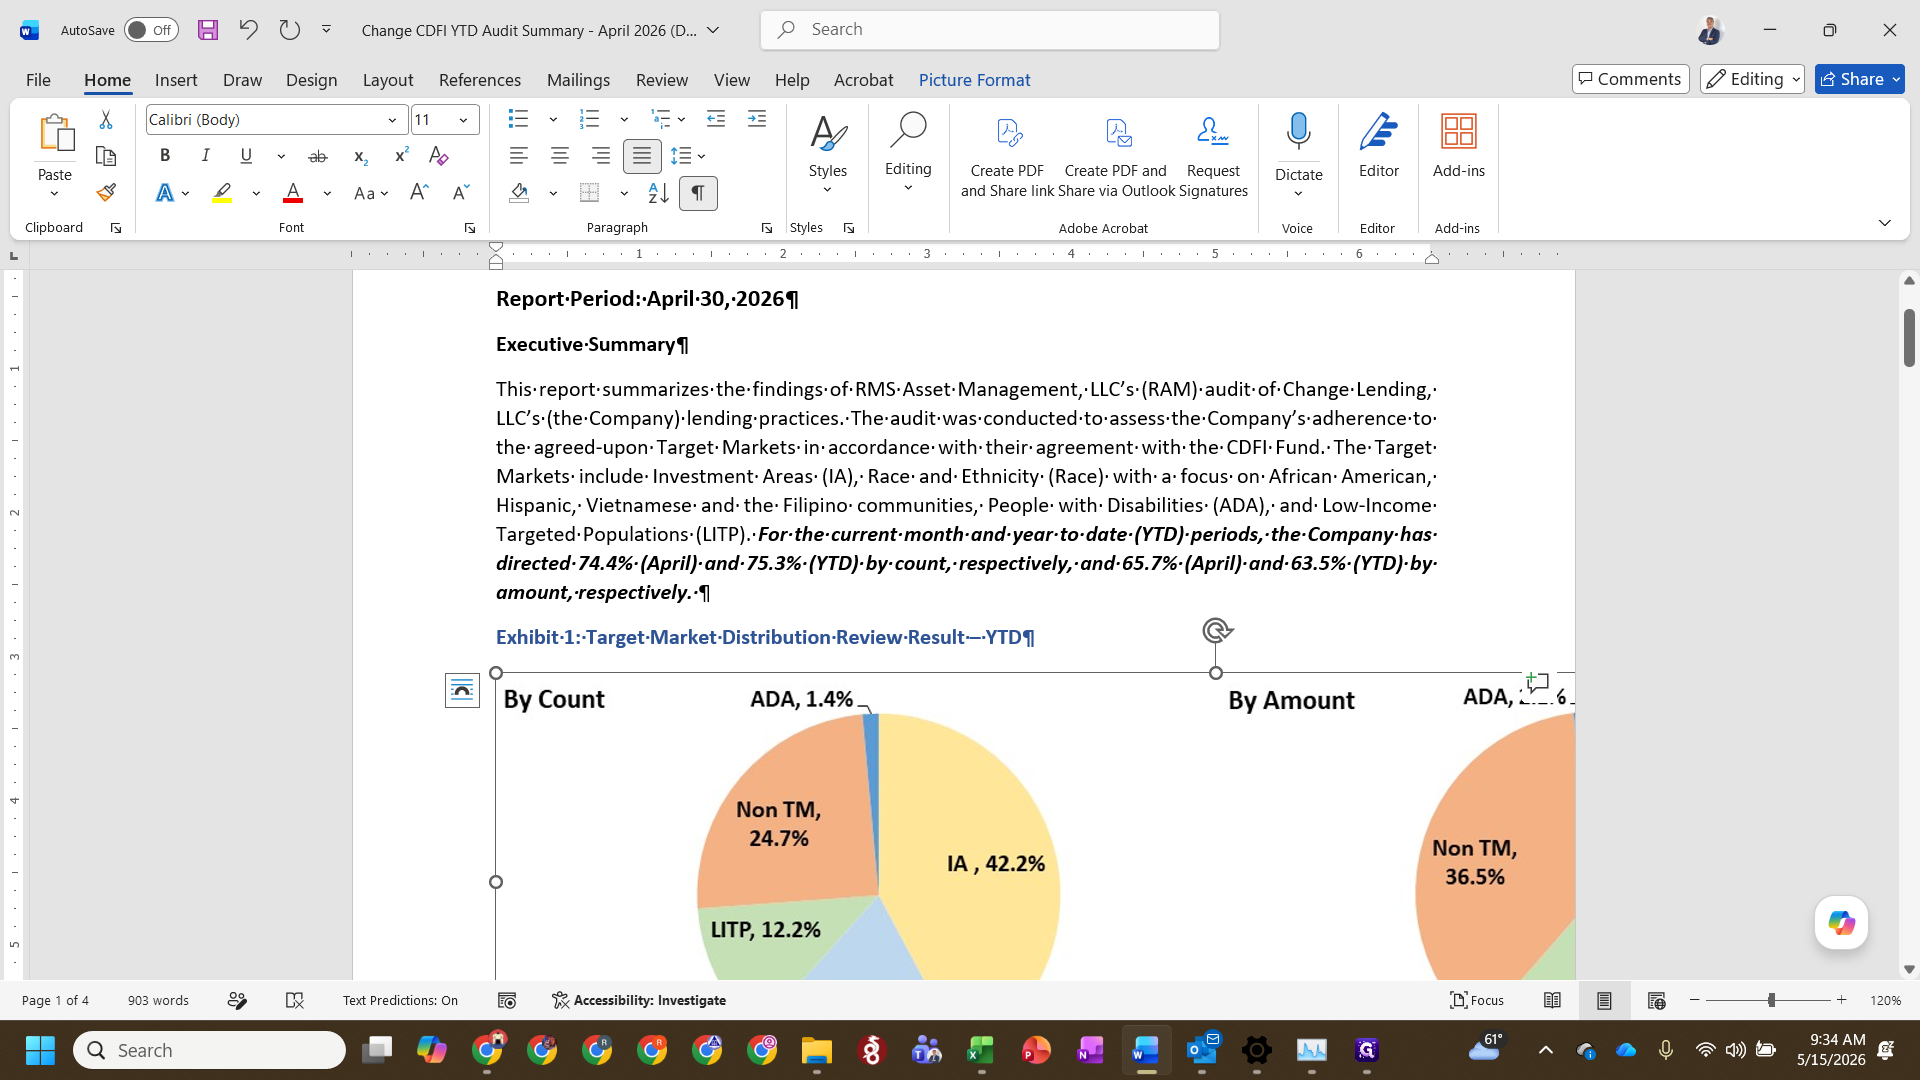
Insert Charts for Exhibit 1

7
Return to Excel and navigate to the Exhibit 1 - YTD tab.
Step #7: Return to Excel and navigate to the Exhibit 1 - YTD tab.
8
Select the pie charts (By Count and By Amount), holding Shift to select both if necessary, and press Ctrl + C.
9
In Word, delete the previous month's charts and paste the new charts as a Picture.
Step #9: In Word, delete the previous month's charts and paste the new charts as a Picture.
10
Drag the resize handles on the bounding box to scale the charts to an appropriate size.
Step #10: Drag the resize handles on the bounding box to scale the charts to an appropriate size.

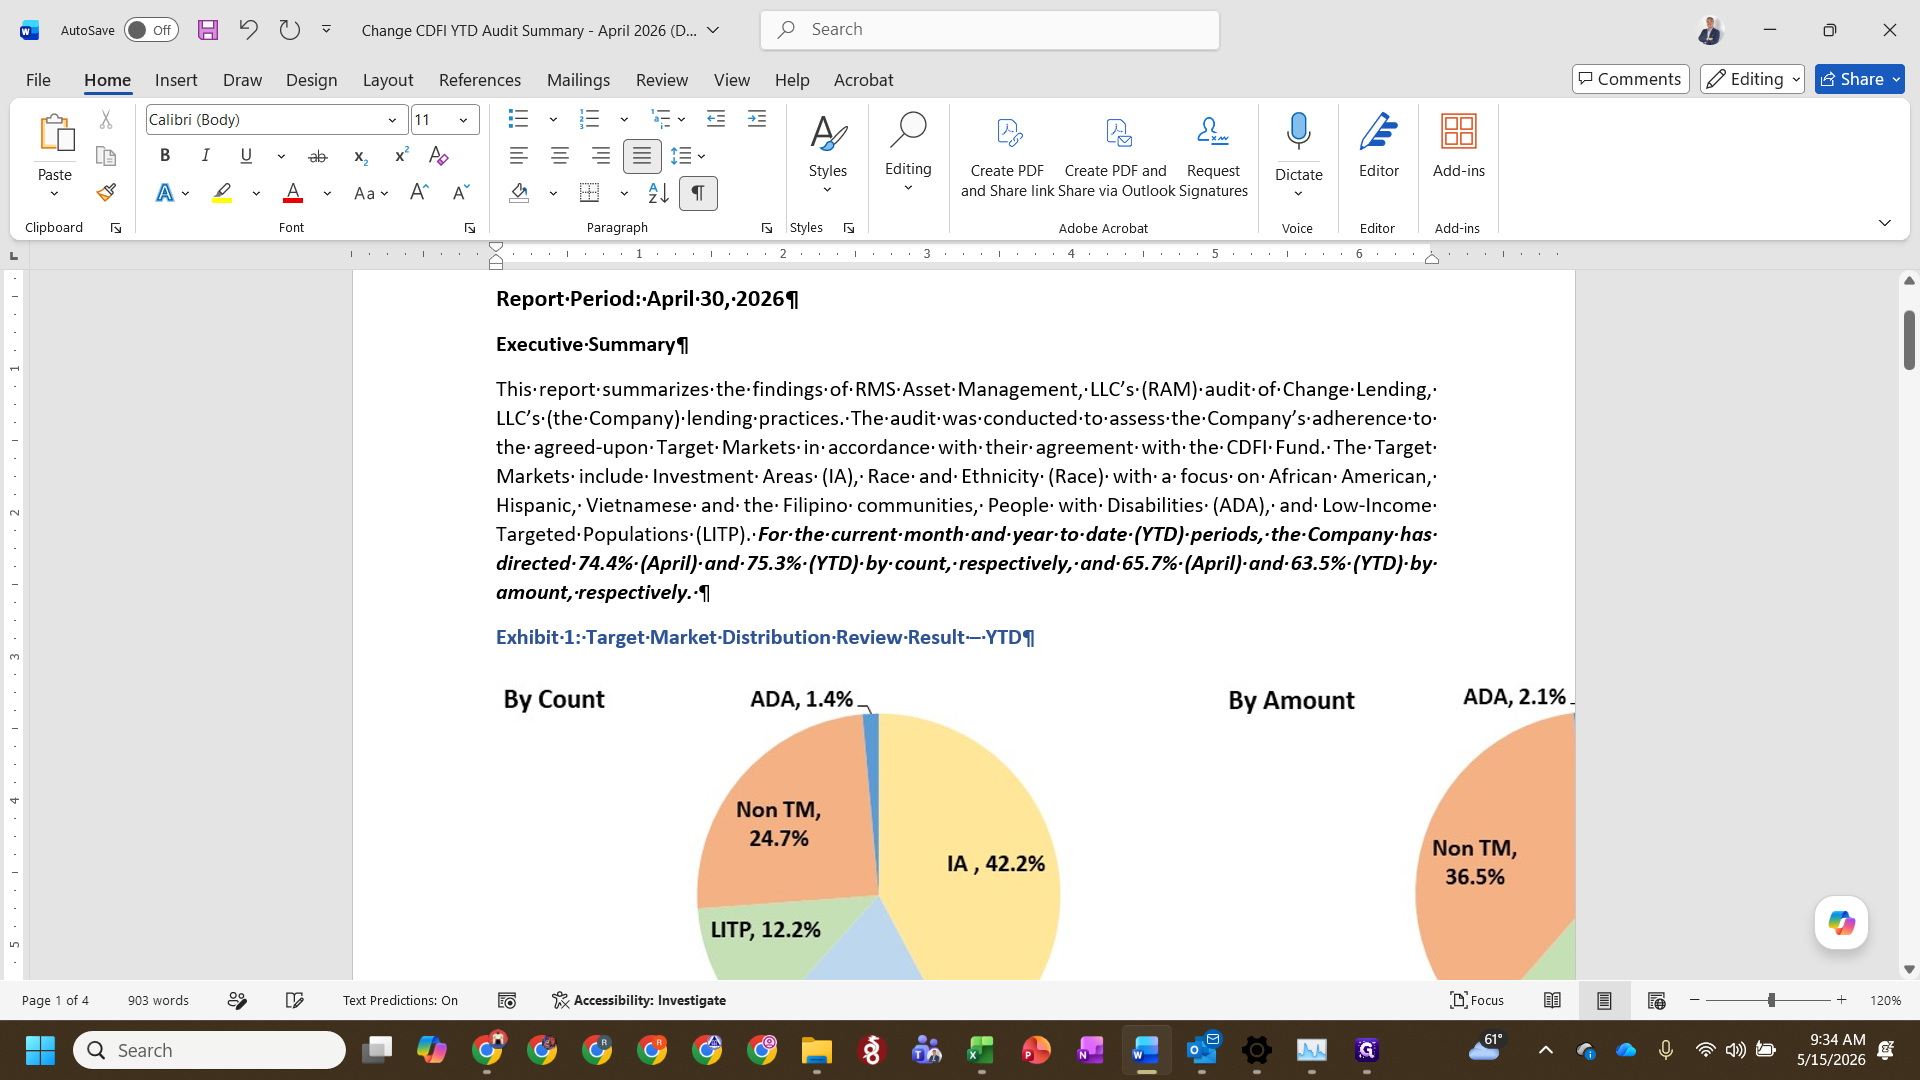
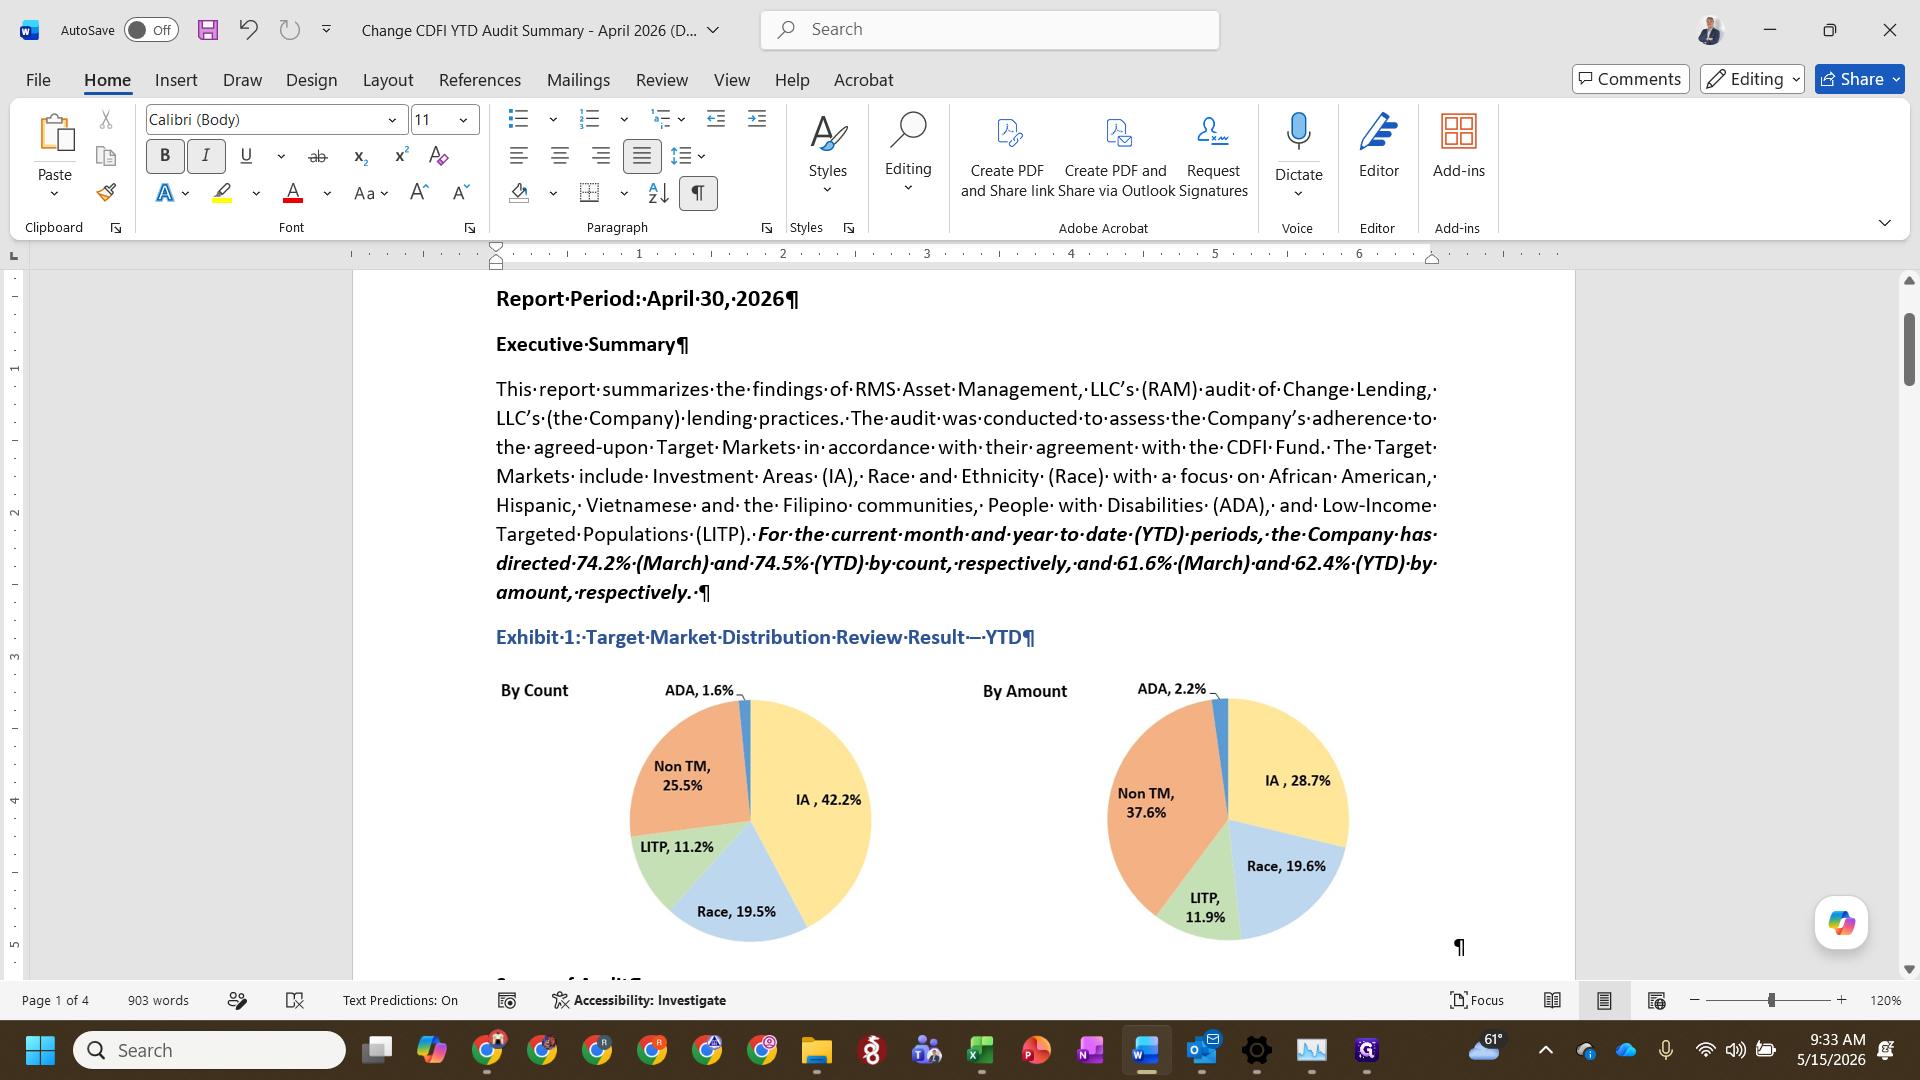
Update Executive Summary Narratives

The executive summary requires updating key percentages for count and amount to match your new exhibits.

11
In the Word document's Executive Summary section, update the performance metrics to reflect the current month. For example, update the current month count to 74.4% and amount to 65.7% based on your Excel data.
Step #11: In the Word document's Executive Summary section, update the performance metrics to reflect the current month. For example, update the current month count to 74.4% and amount to 65.7% based on your Excel data.
12
Update the year-to-date (YTD) figures in the same paragraph (e.g., 75.3% by count, 63.5% by amount).
Step #12: Update the year-to-date (YTD) figures in the same paragraph (e.g., 75.3% by count, 63.5% by amount).
13
Ensure any references to the previous month's name in the text are updated to the current reporting period (e.g., replacing "March" with "April").

Update Conclusion and MoM Changes

In the conclusion section, you must calculate and note the month-over-month variance manually.

14
Scroll down to the Findings and Conclusion section.
Step #14: Scroll down to the Findings and Conclusion section.
15
Update the YTD conclusion statements with the new metrics.
Step #15: Update the YTD conclusion statements with the new metrics.
16
Calculate the difference between the current month and the previous month. Update the text to state whether the metric was an increase or decrease and include the exact percentage change.
17
Verify that the comparison text explicitly states the correct previous month (e.g., "an increase of 0.8% from March").
18
Press Ctrl + S to save both your updated Word document and the Excel exhibit file.

FAQ

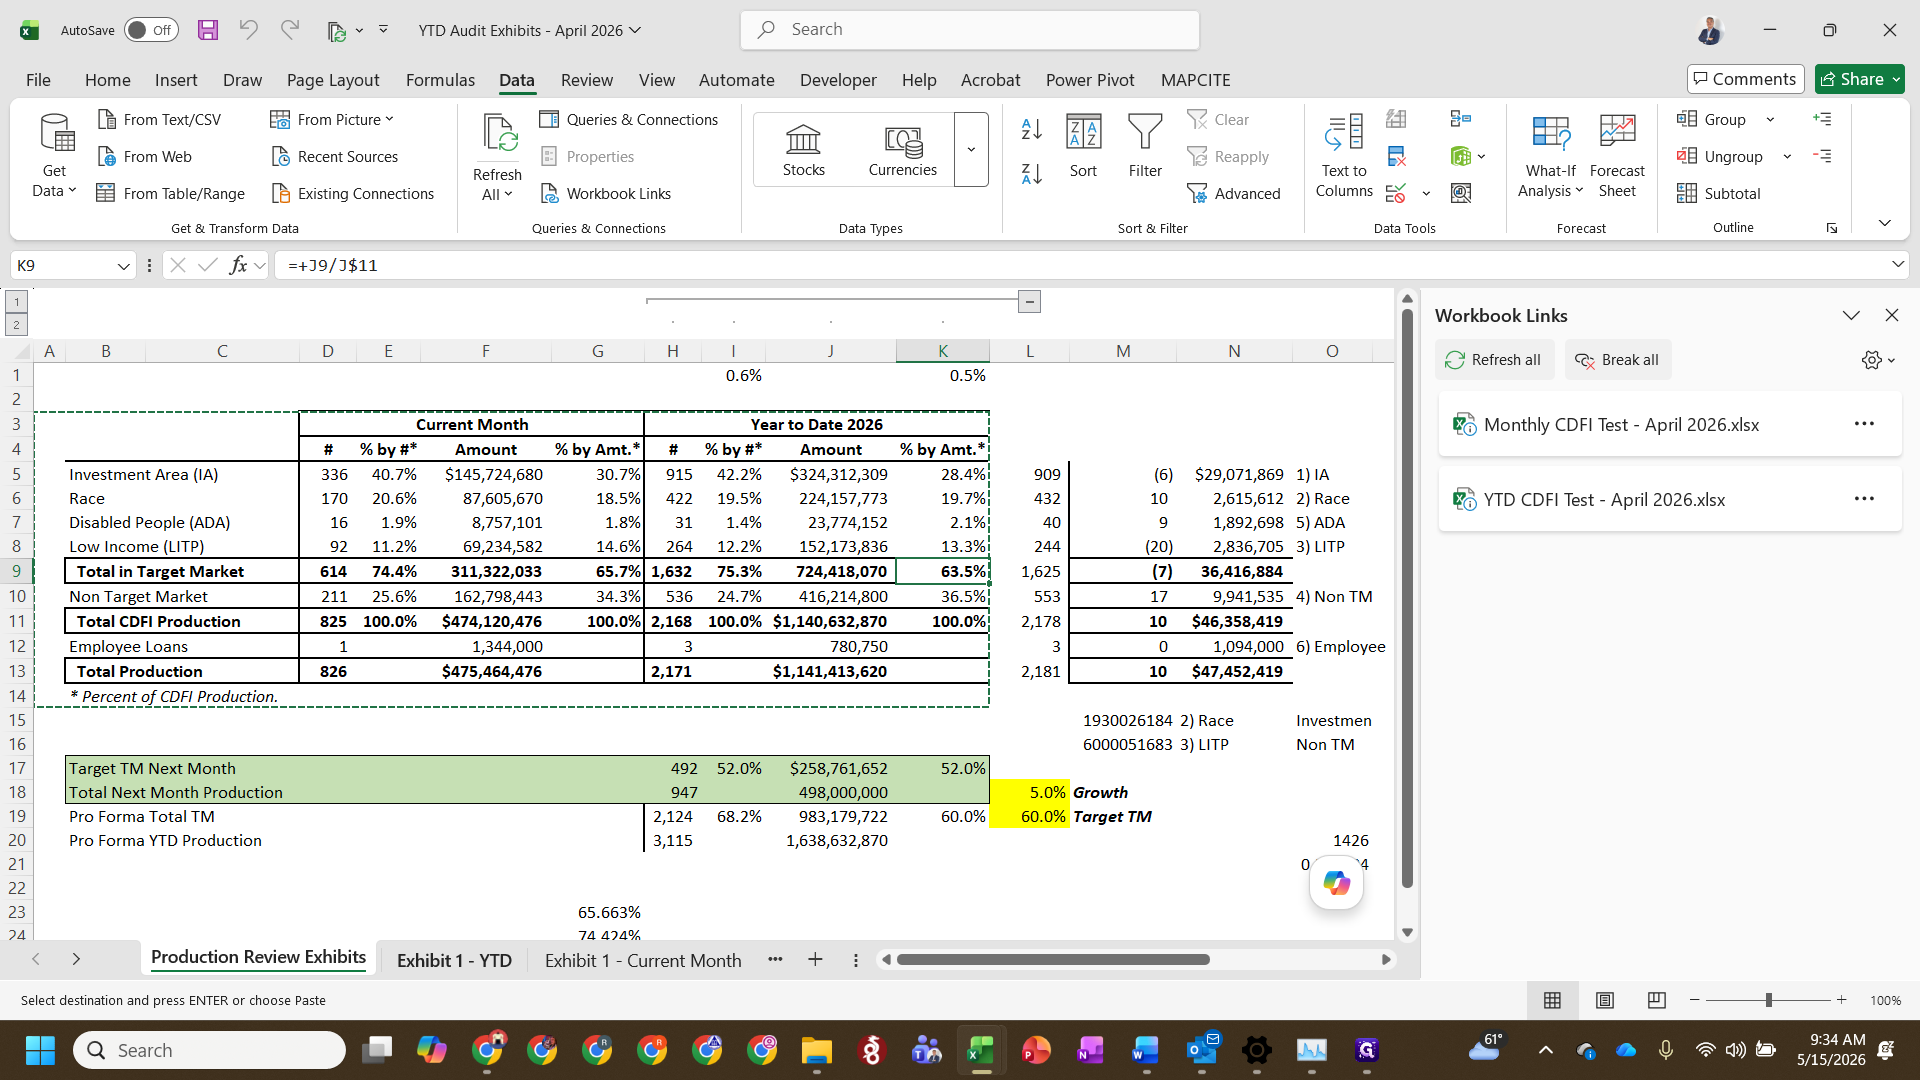
Q: What are the linked files in the Excel exhibit?

A: The main YTD audit exhibit workbook relies on linked files containing raw monthly and year-to-date loan data. Ensure you update those linked workbooks so the exhibits pull accurate data before you begin copying them into Word.

Glossary

Term

Definition

CDFI

Community Development Financial Institution, a specialized organization that provides financial services in low-income communities.

MoM

Month-over-Month, a measure of the change in a metric from one month to the previous one.

Target Market

The specific geographic areas or populations that a CDFI is certified to serve.

Updating the Monthly CDFI Audit Report