Learn how to refresh Excel report data, roll forward linked Strat files, and update tables and charts in the Starwood monthly Word document.
By Eddy Kup
This guide explains how to complete the second part of the Starwood monthly report update. It covers refreshing the Excel report data, rolling forward the linked files for the new month, and updating the final Word document with the latest tables and charts.
This process is designed for financial analysts or reporting team members responsible for generating the monthly Starwood Investor Reports. It should be performed immediately after the initial MIDT raw data has been imported.
Updating the Excel Data
1
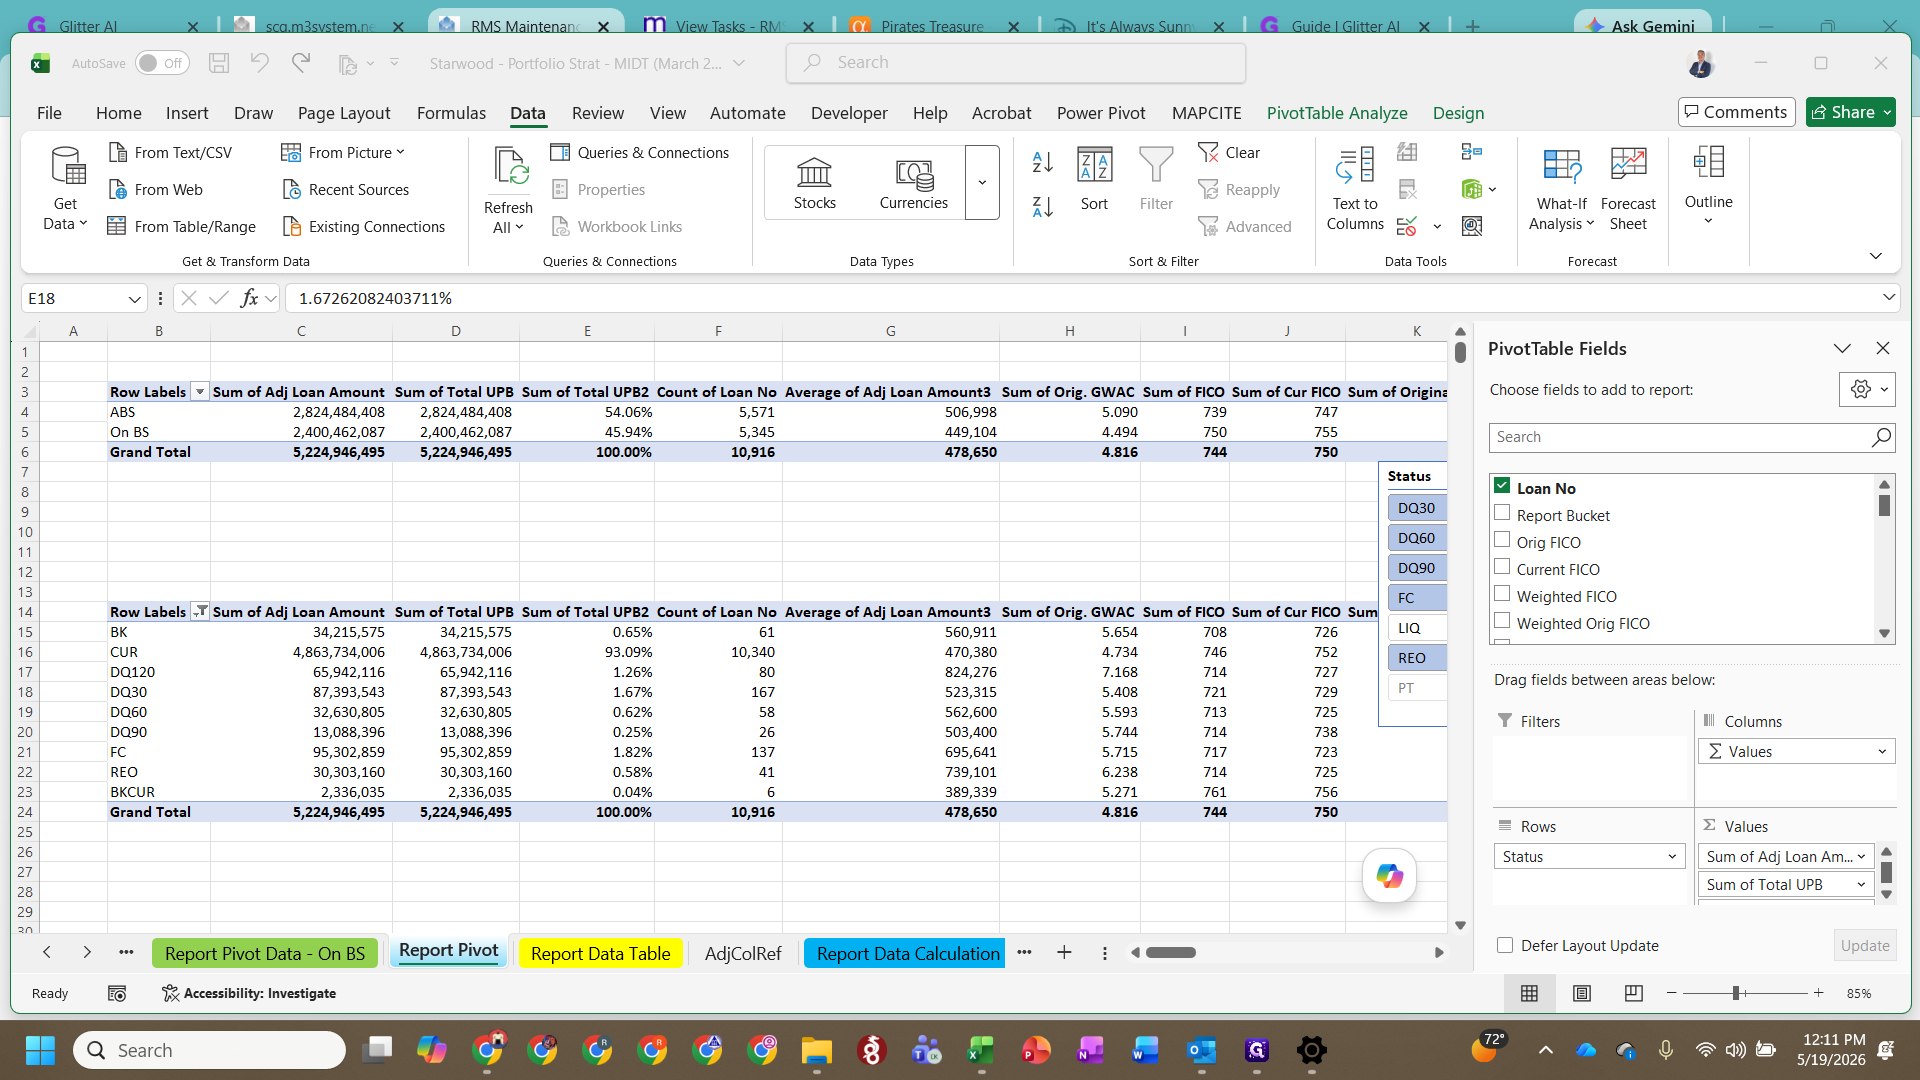
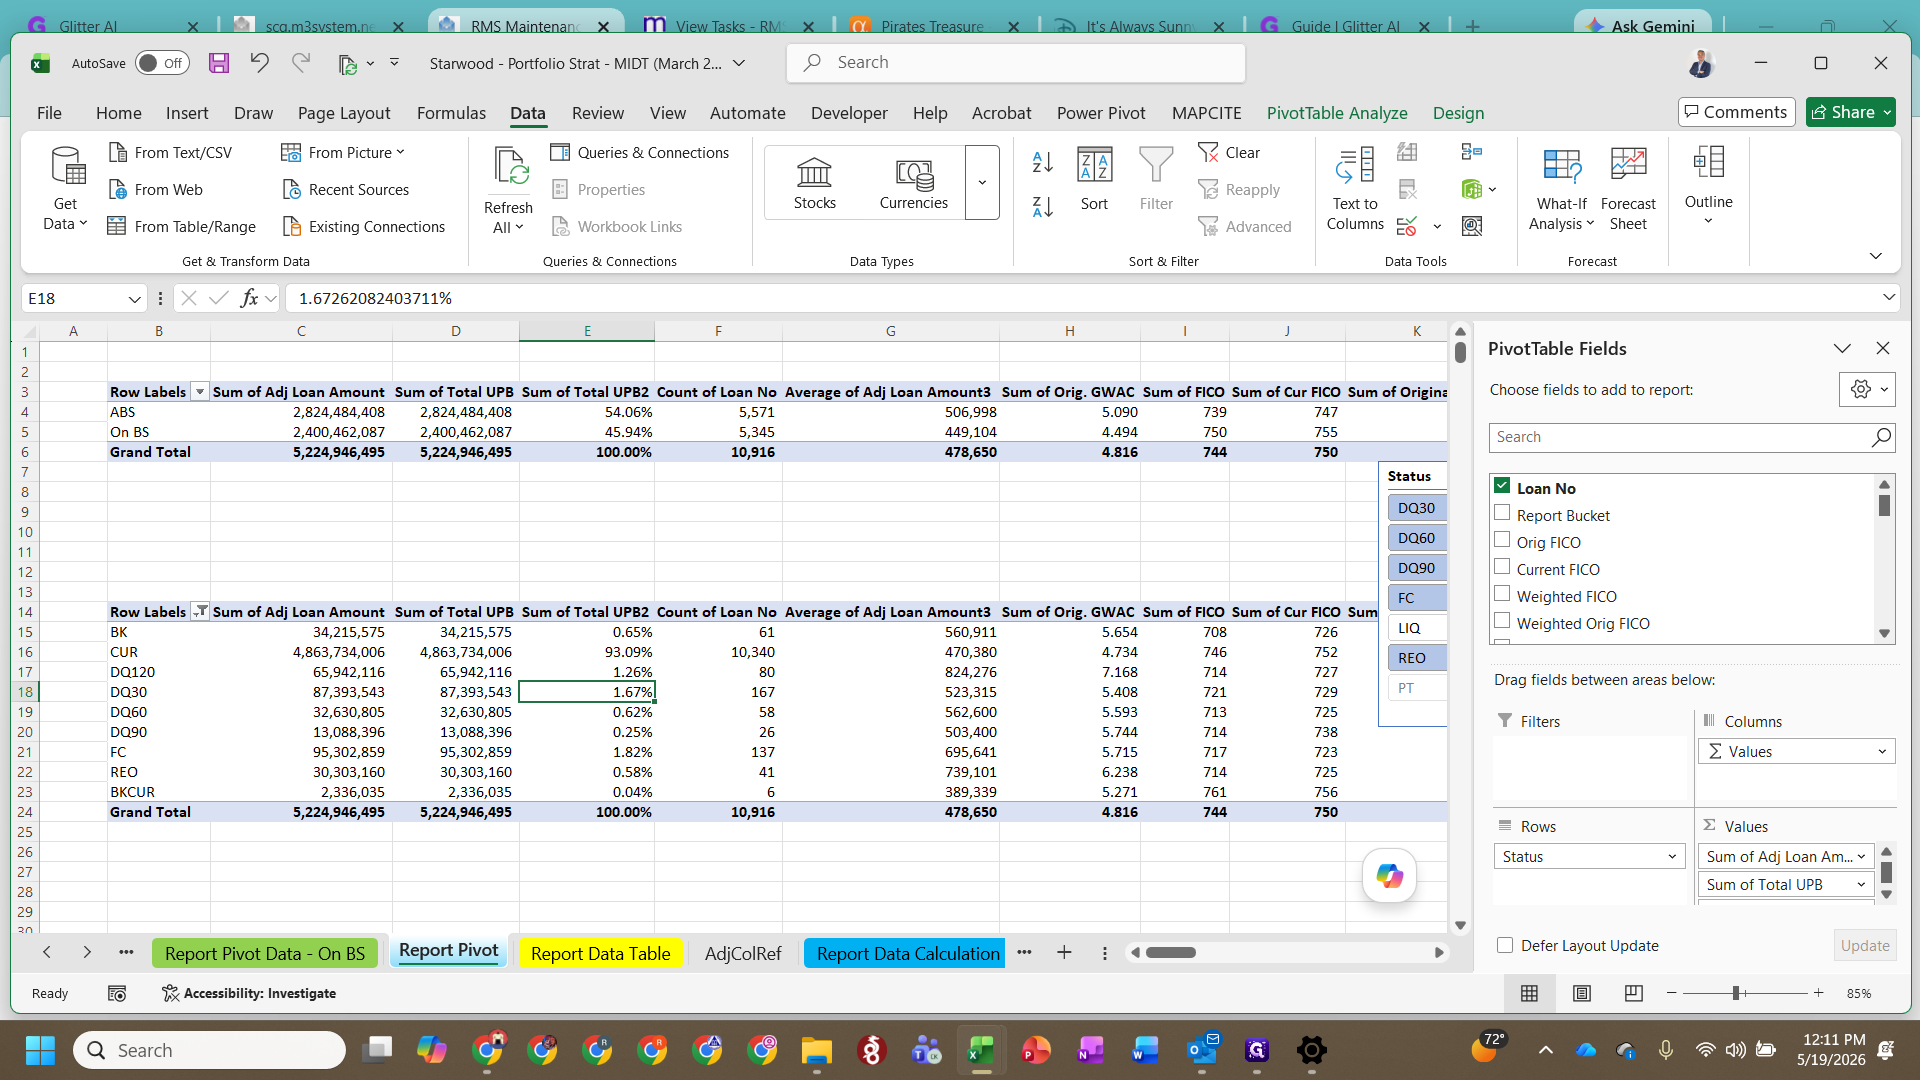
Open the Excel workbook and click on the Report Data Calculation tab.
2
Paste the raw MIDT data into the yellow input section, then refresh all data in the workbook.
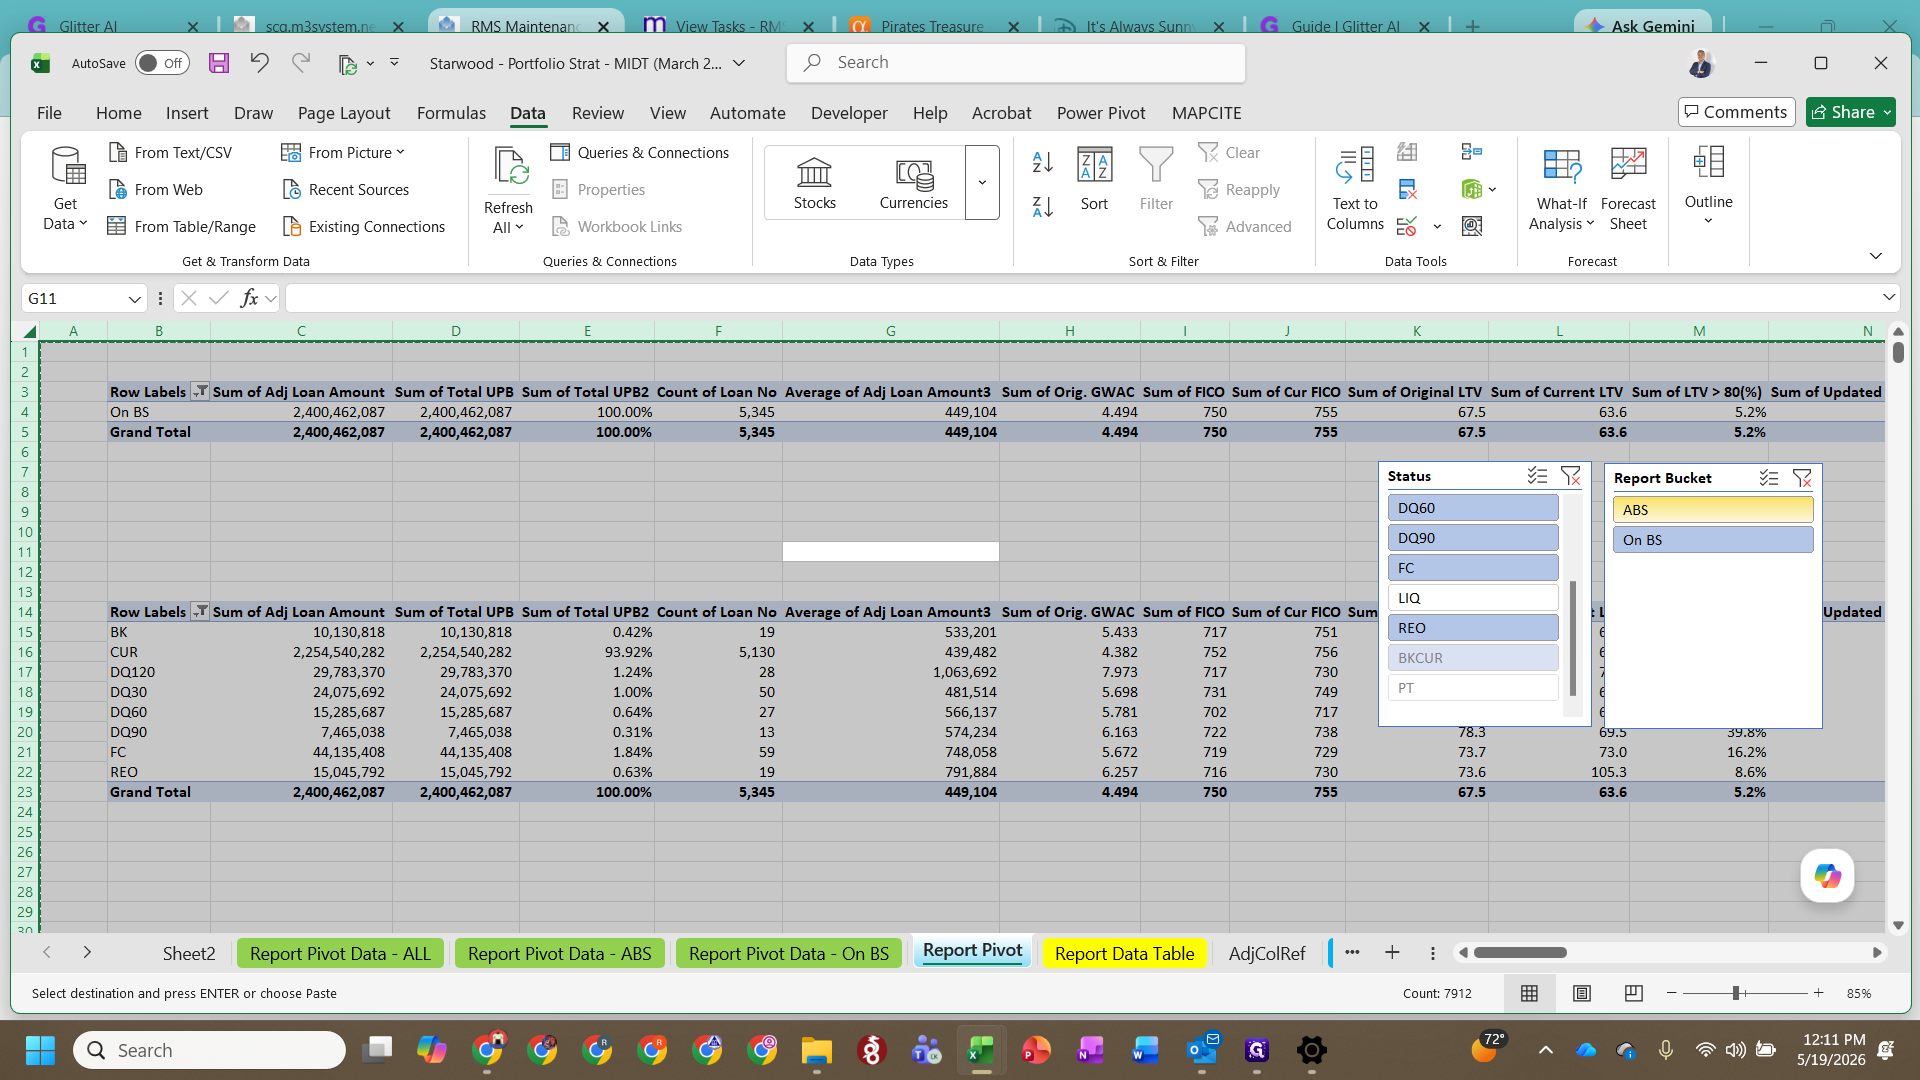
3
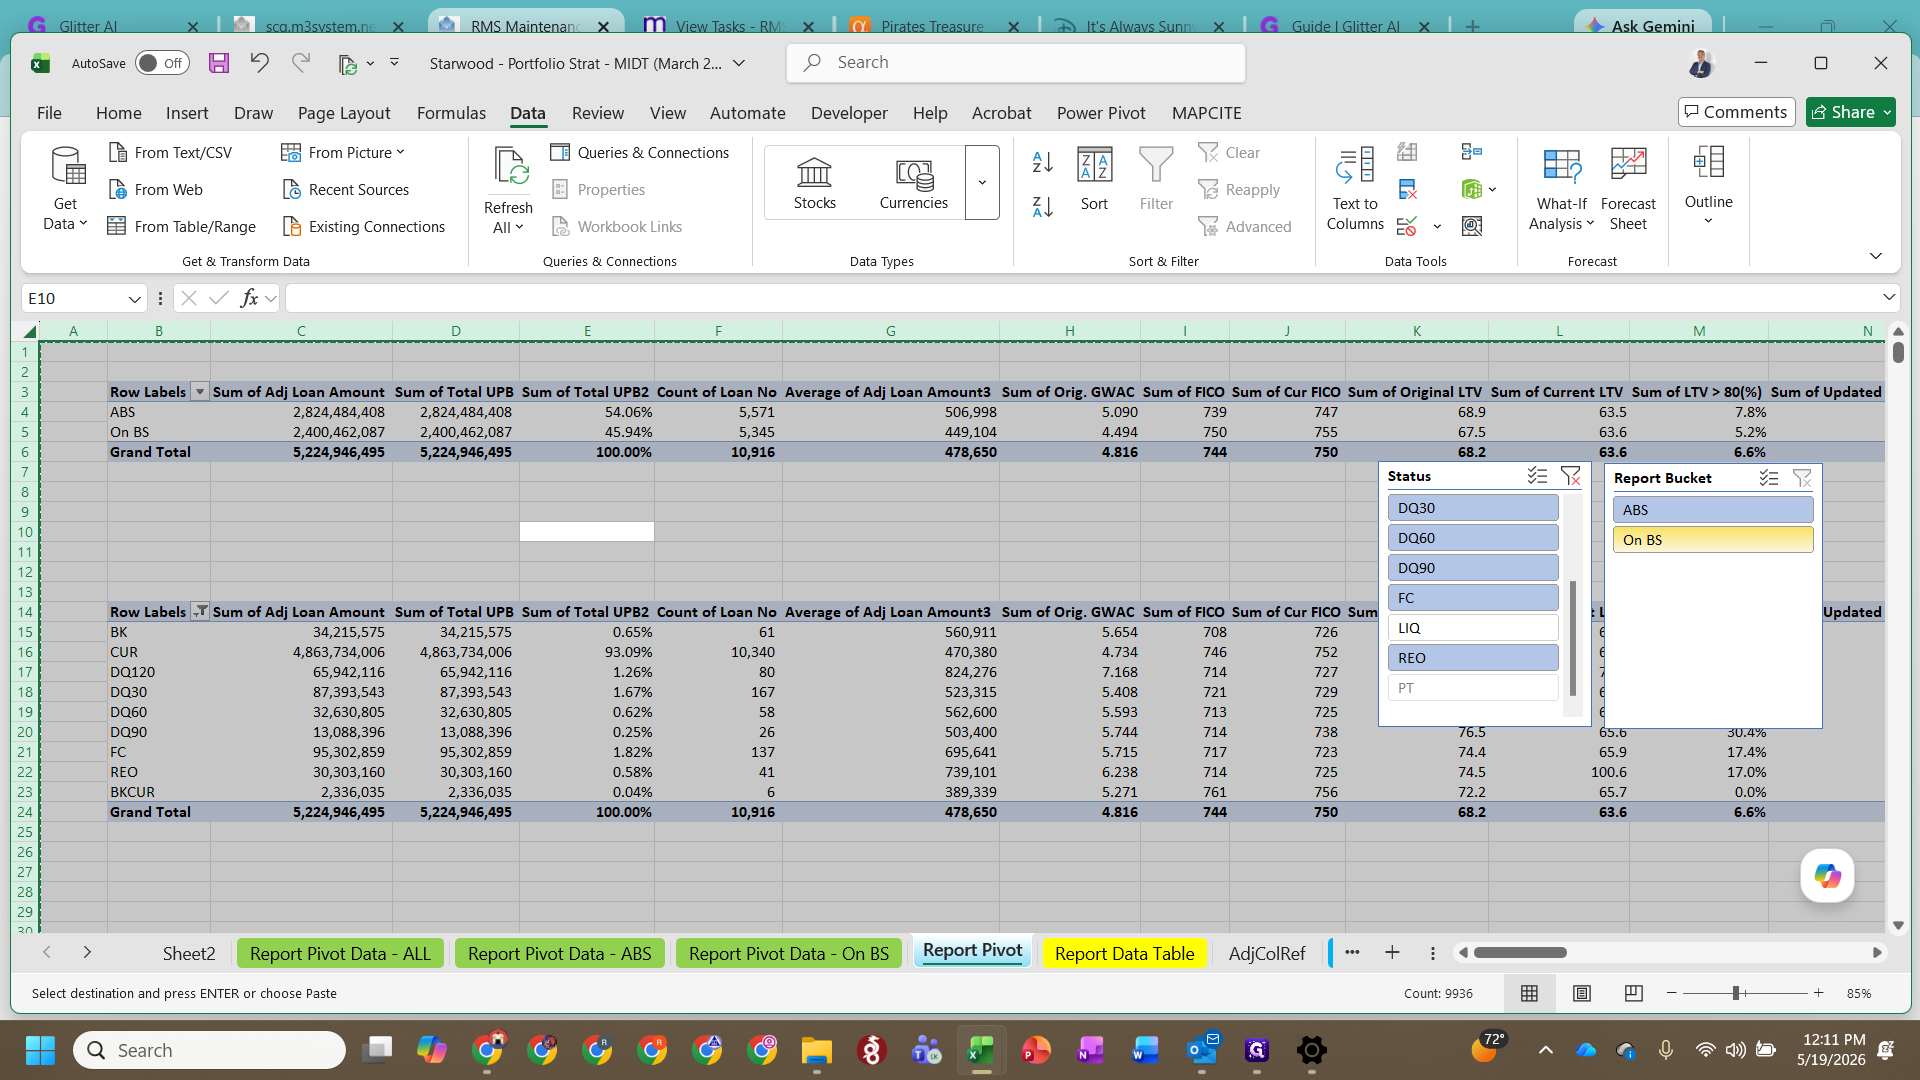
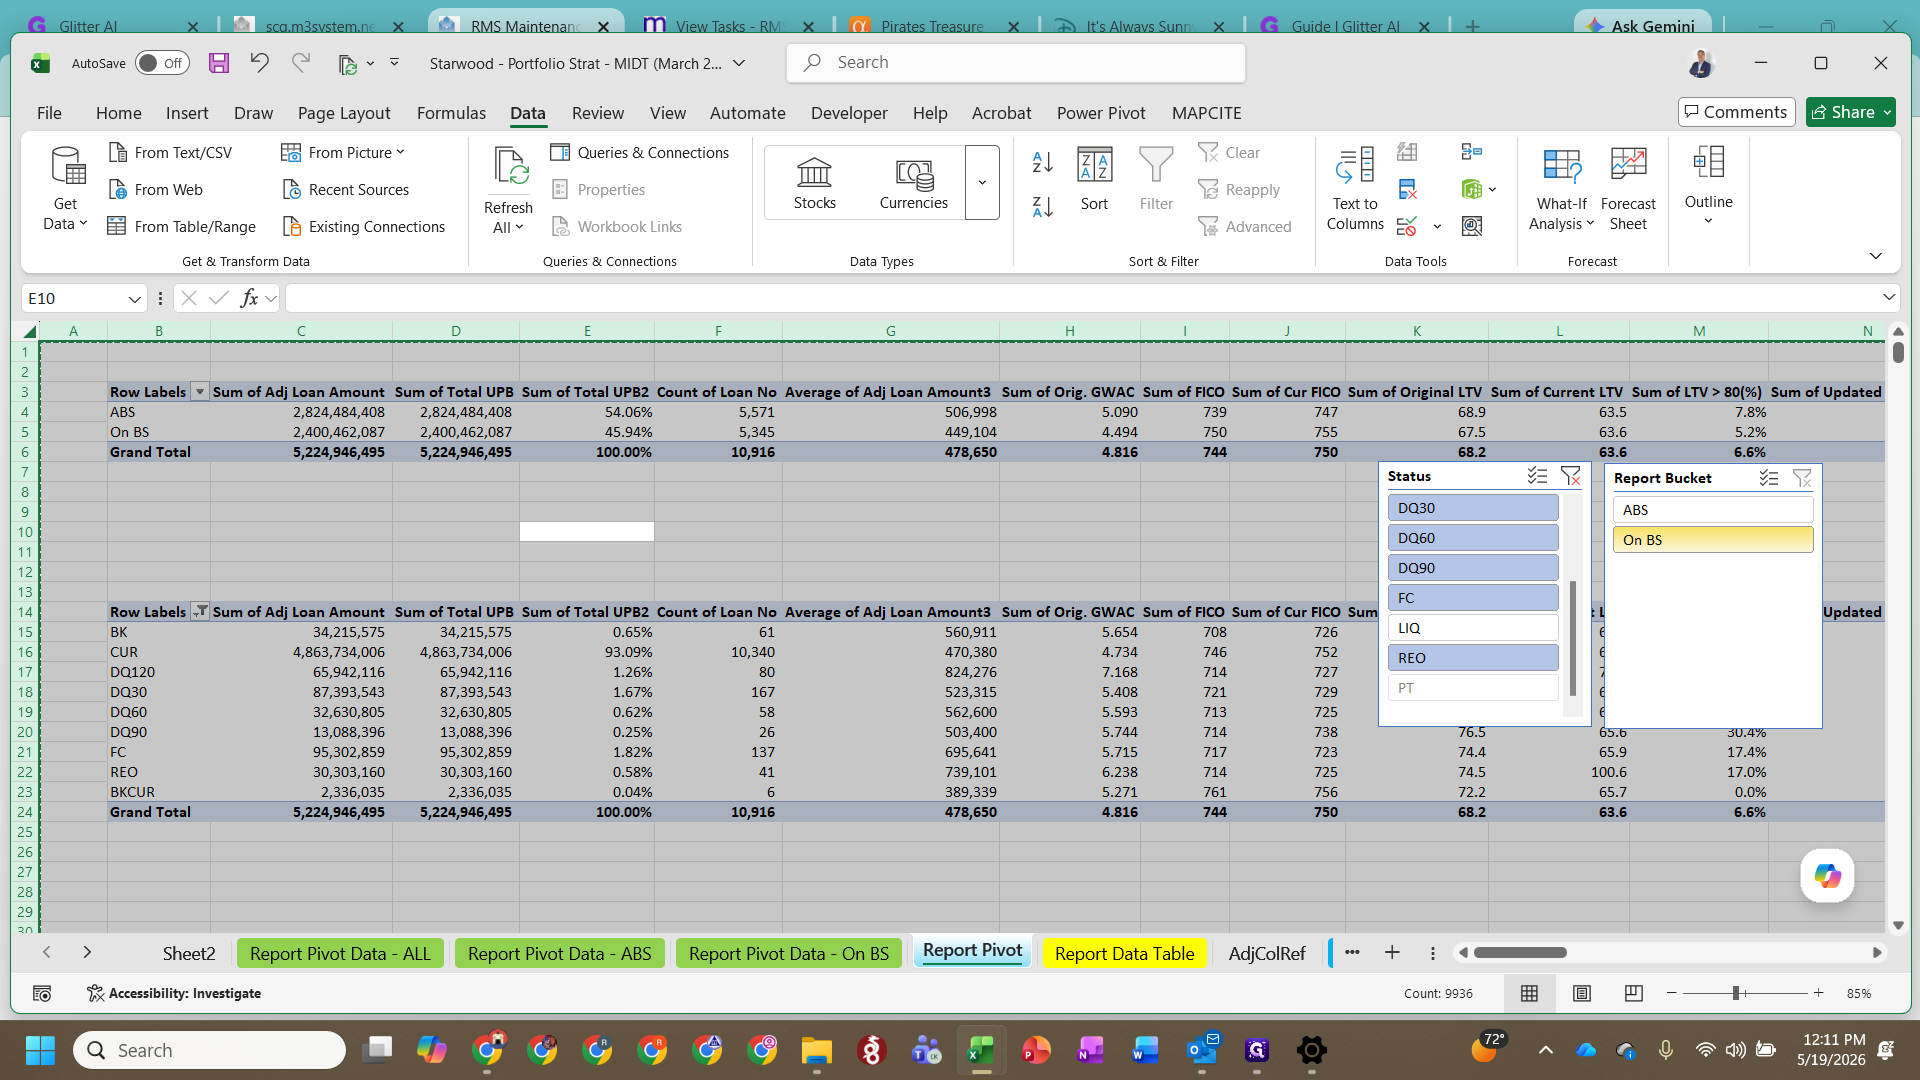
Using the Report Bucket slicer, select On BS to filter the balance sheet data.
4
Select the filtered data, copy it, and paste it back as values to hardcode the numbers.
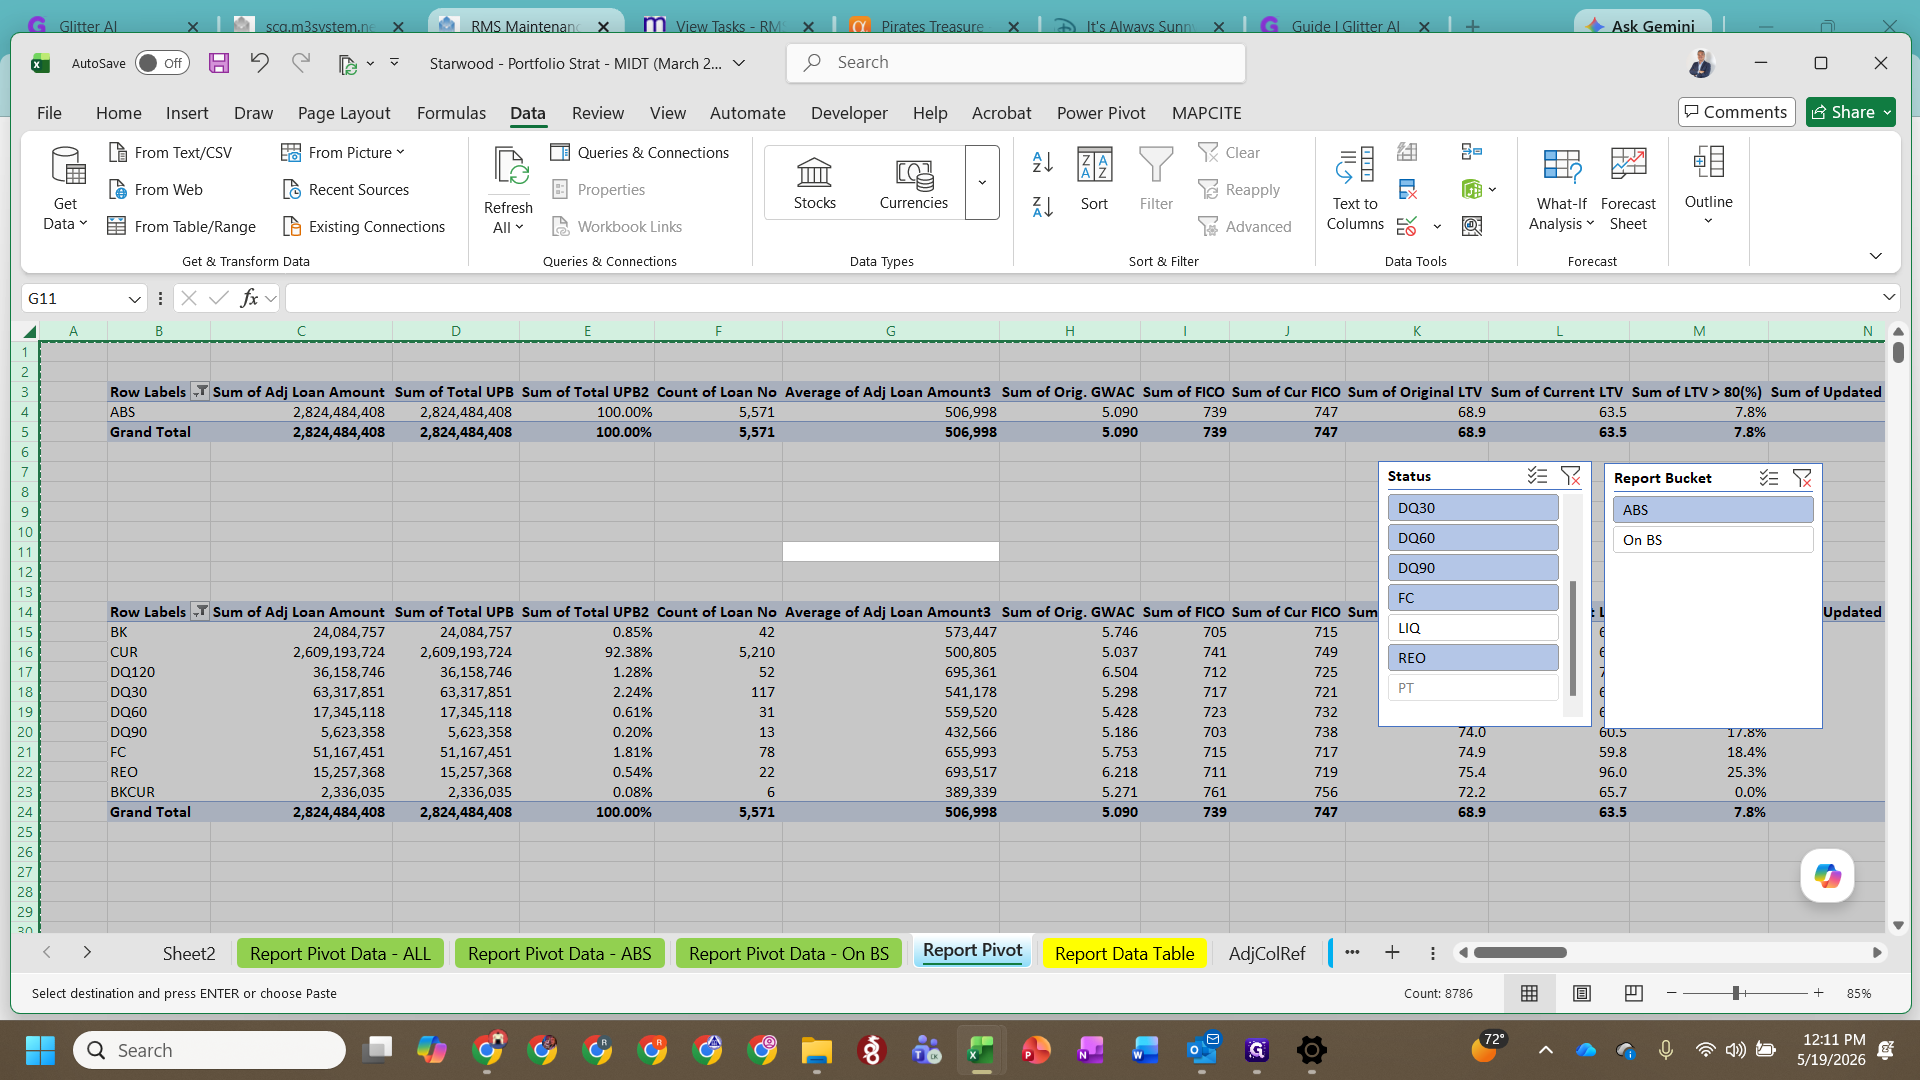
5
Update the Report Bucket slicer to select the ABS filter.
6
Copy the newly filtered ABS data and paste it as values.
Creating the New Month's Files
It is critical to have both the Report file and the Strat file open simultaneously. The report file is dynamically linked to the Strat files. Saving both files while they are open maintains this connection for the new month.
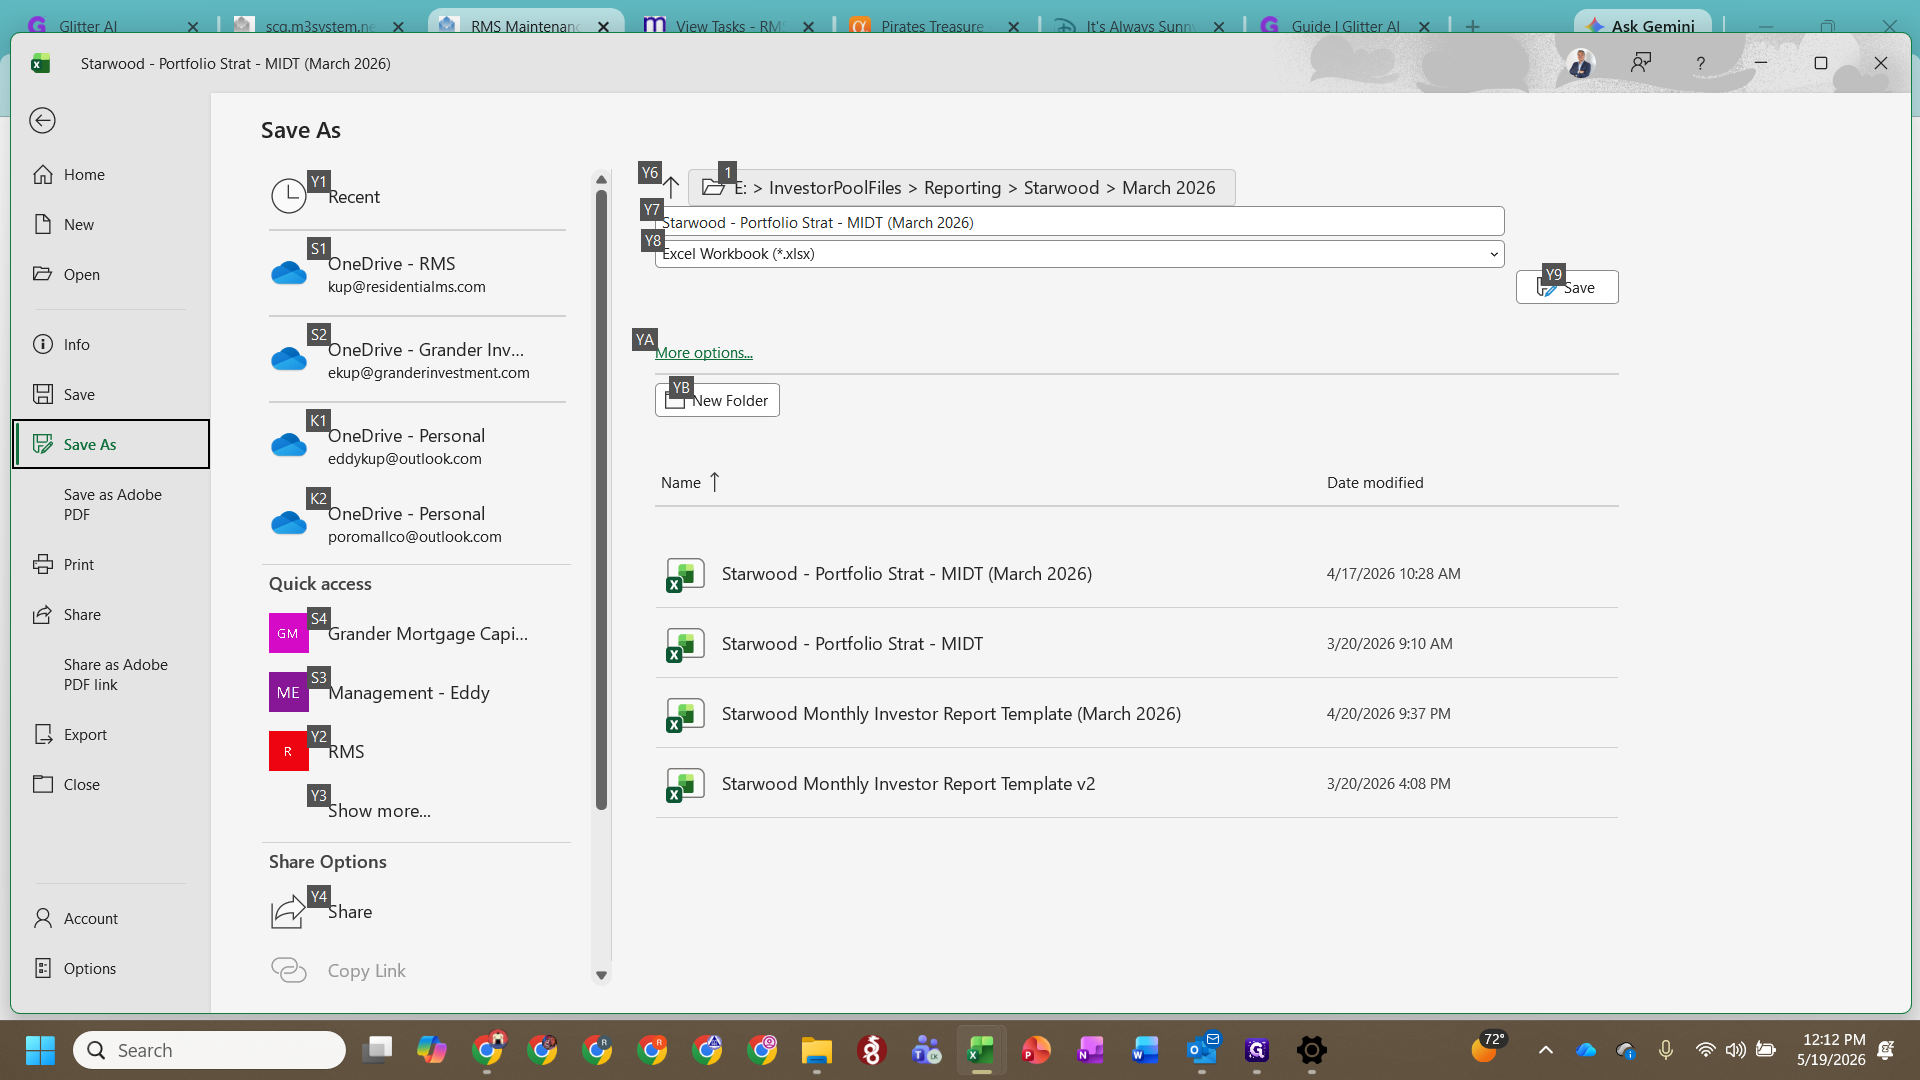
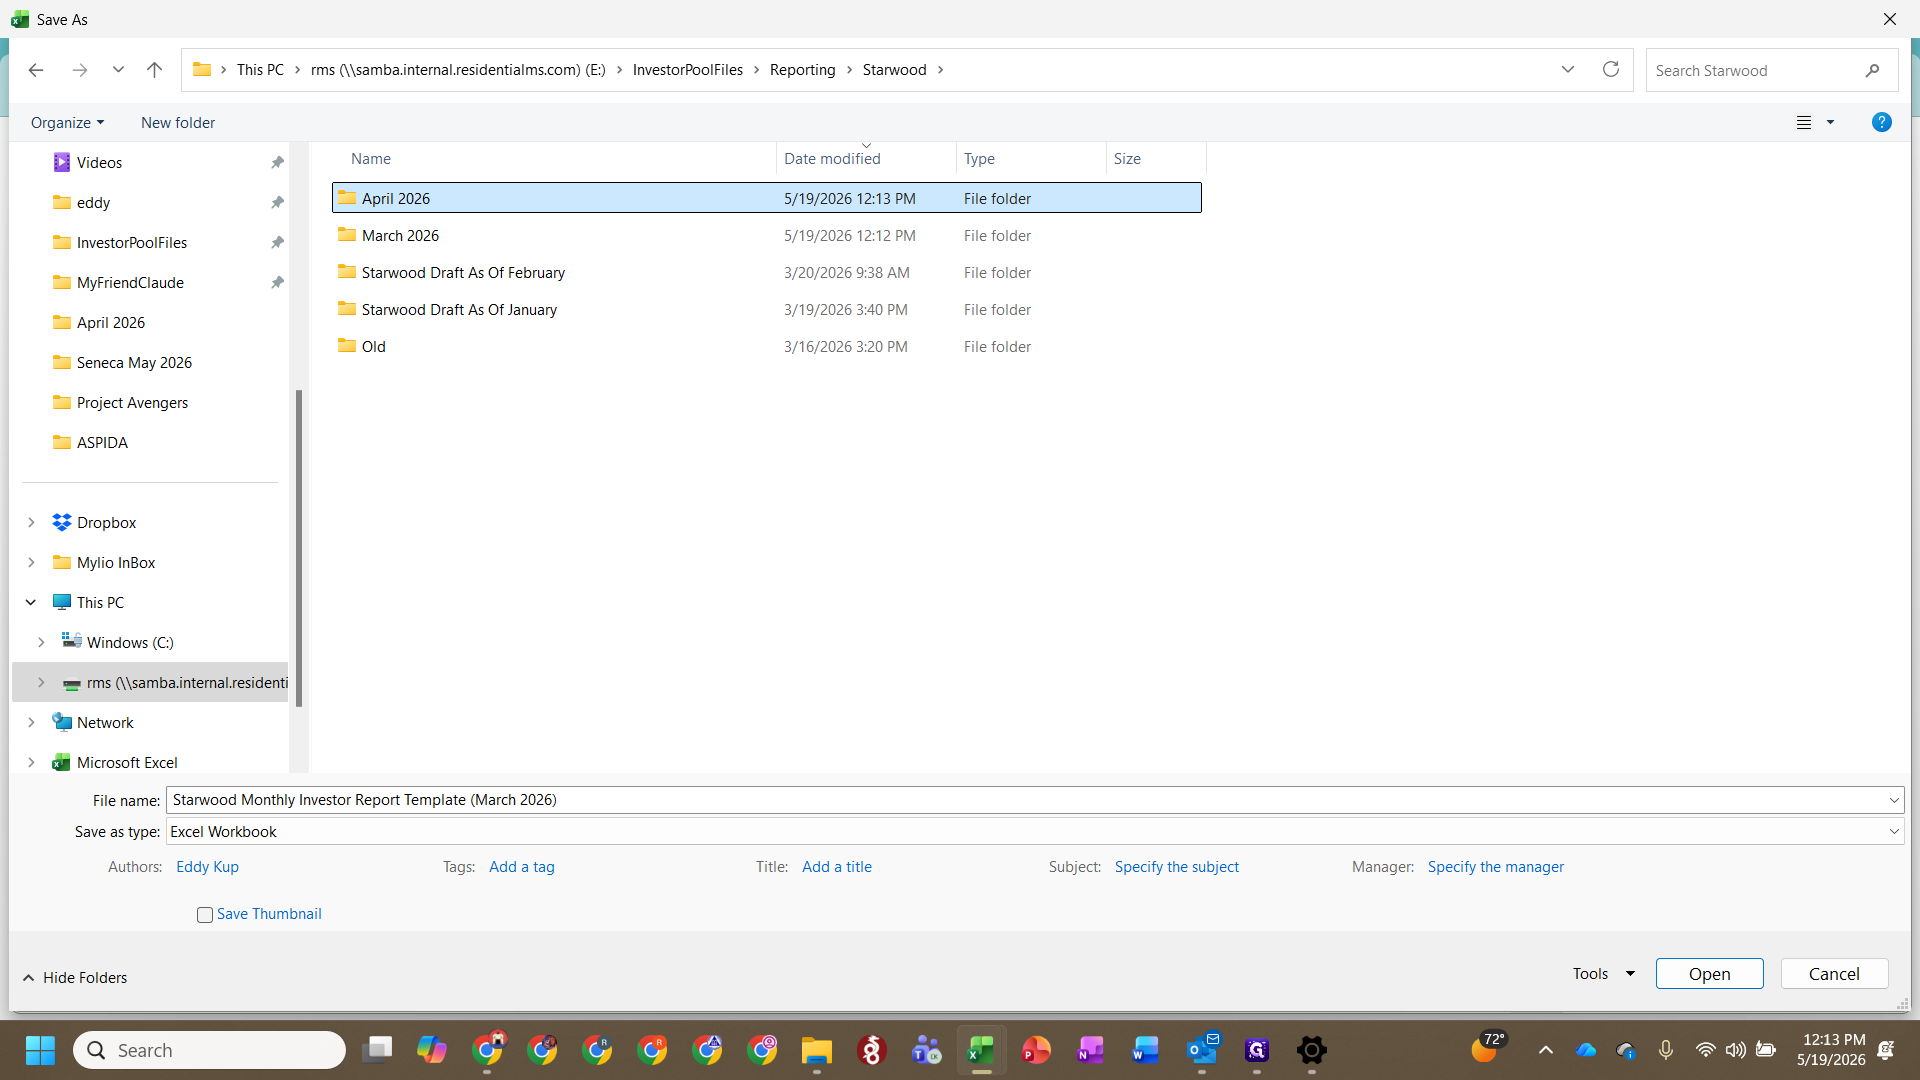
7
Go to File > Save As and navigate to the new month's folder (e.g., April 2026).
8
Update the file name to reflect the new month and click Save.
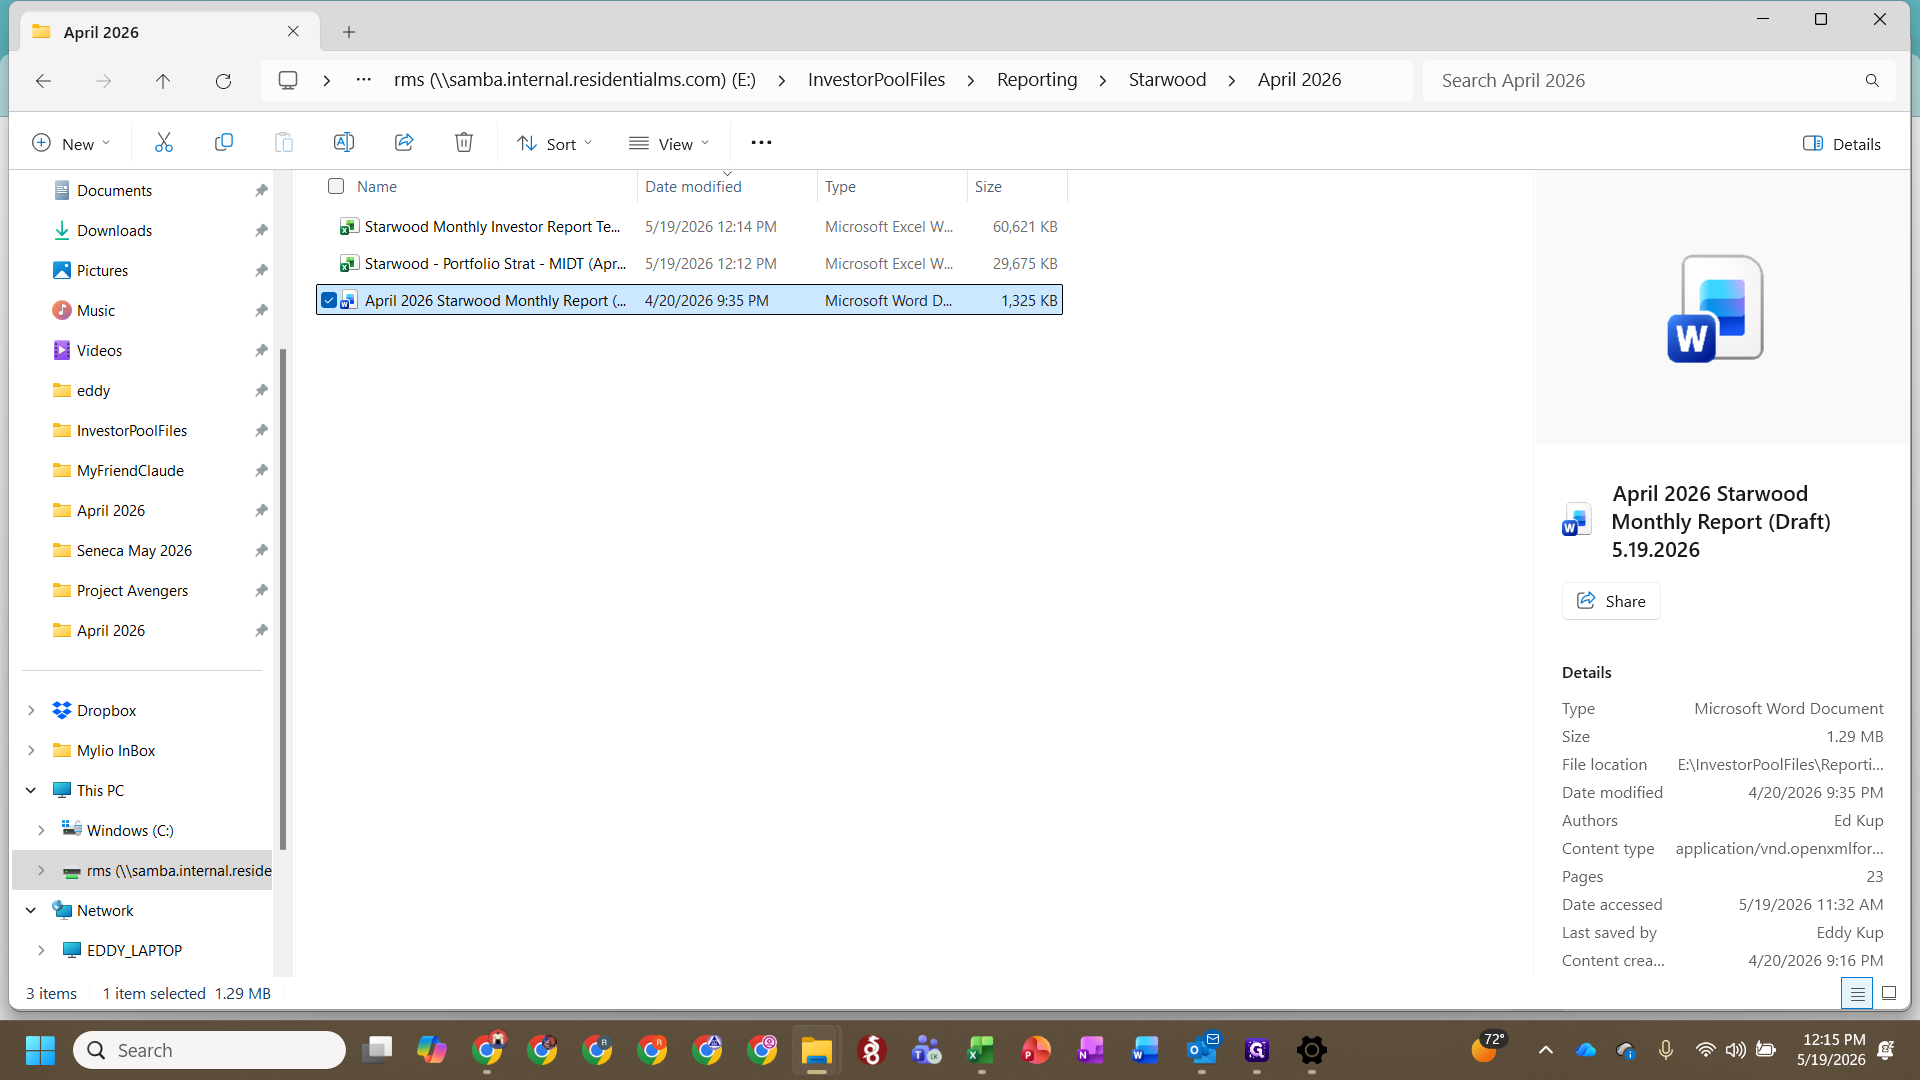
9
Open the linked Starwood Monthly Investor Report Template Excel file.
10
Save this file into the new month's folder as well, updating the file name accordingly.
Once both files are saved and linked, review the self-check formulas within the workbook. Verify that the check cells evaluate to zero, confirming that the data matches across all sections of the report.
Updating the Word Document Exhibits
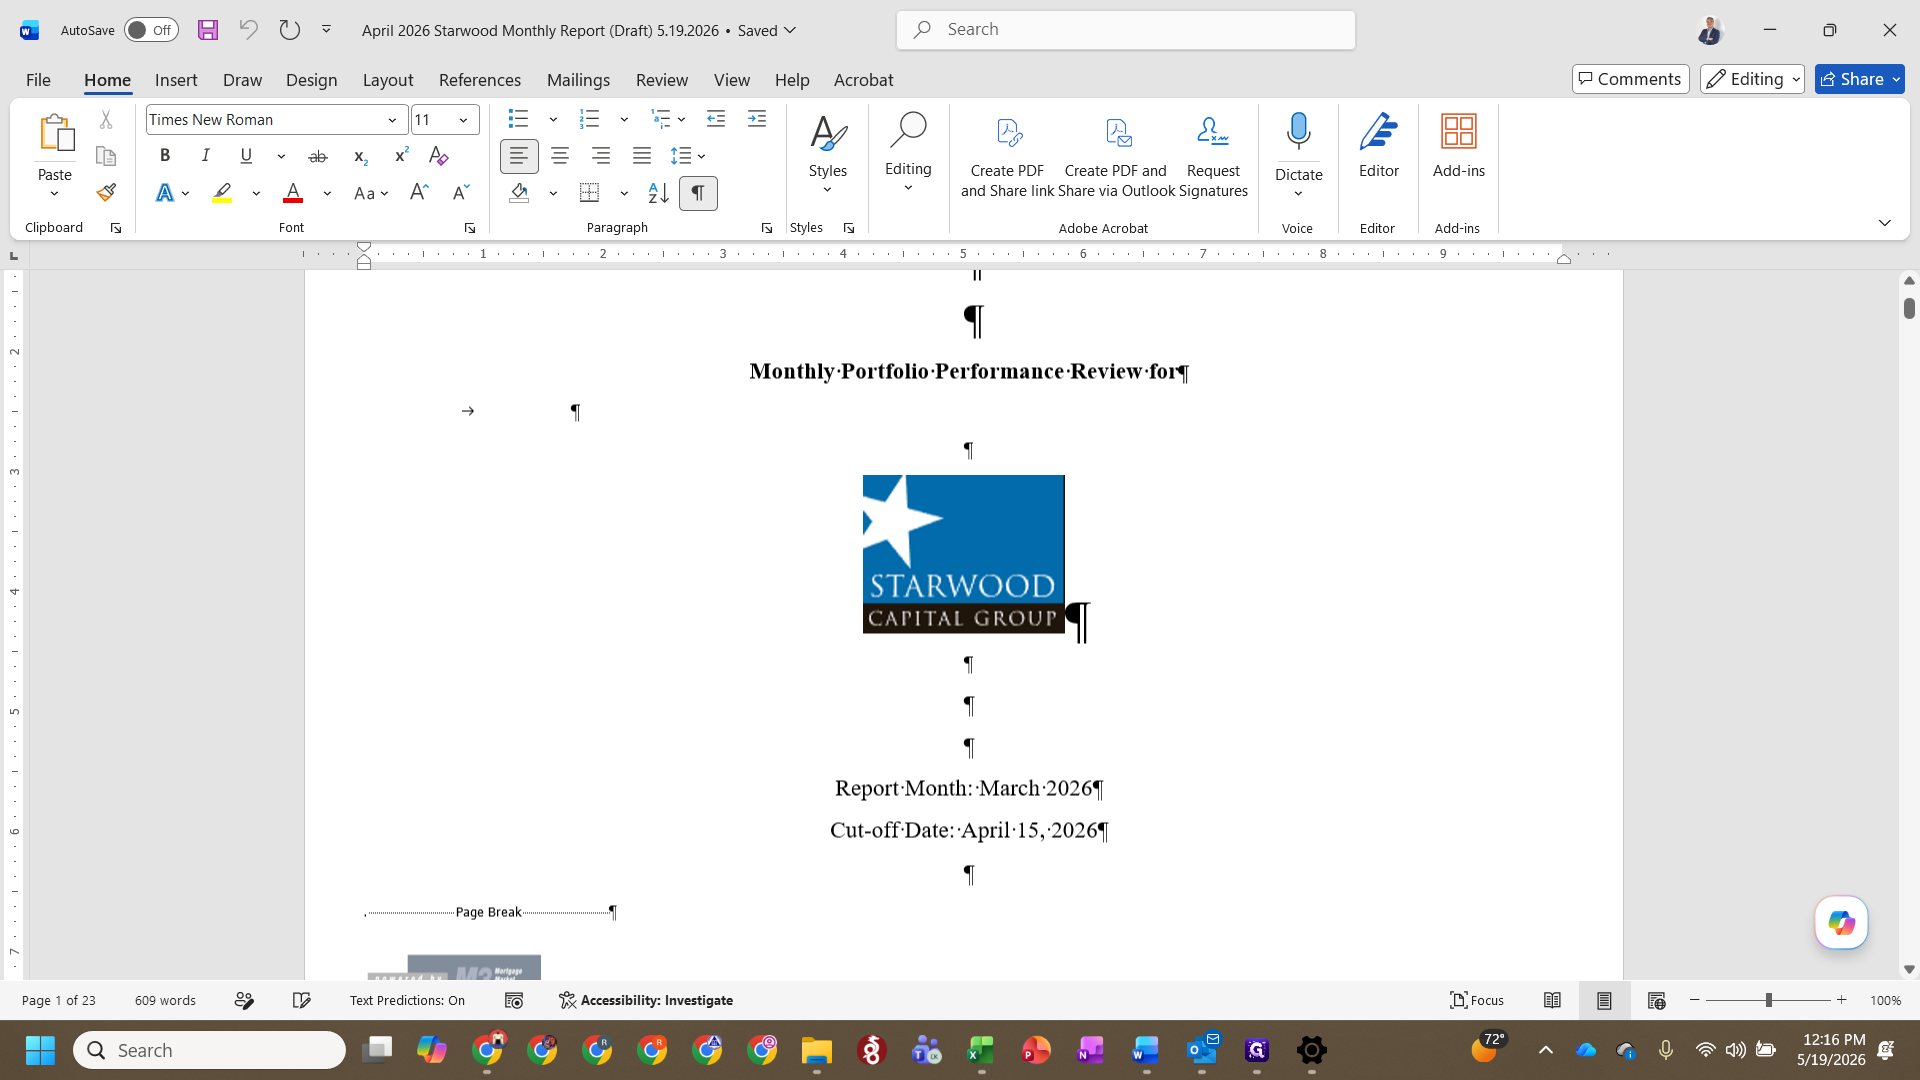
11
Open the draft Word document for the new month (e.g., April 2026 Starwood Monthly Report (Draft)).
12
Update the cutoff dates in the document header to match the new reporting period.
The Executive Summary text is provided separately by the Asset Management group. You will insert their text into the document once it is received.
You must transfer the updated tables and charts from your Excel report into the Word document as pictures.
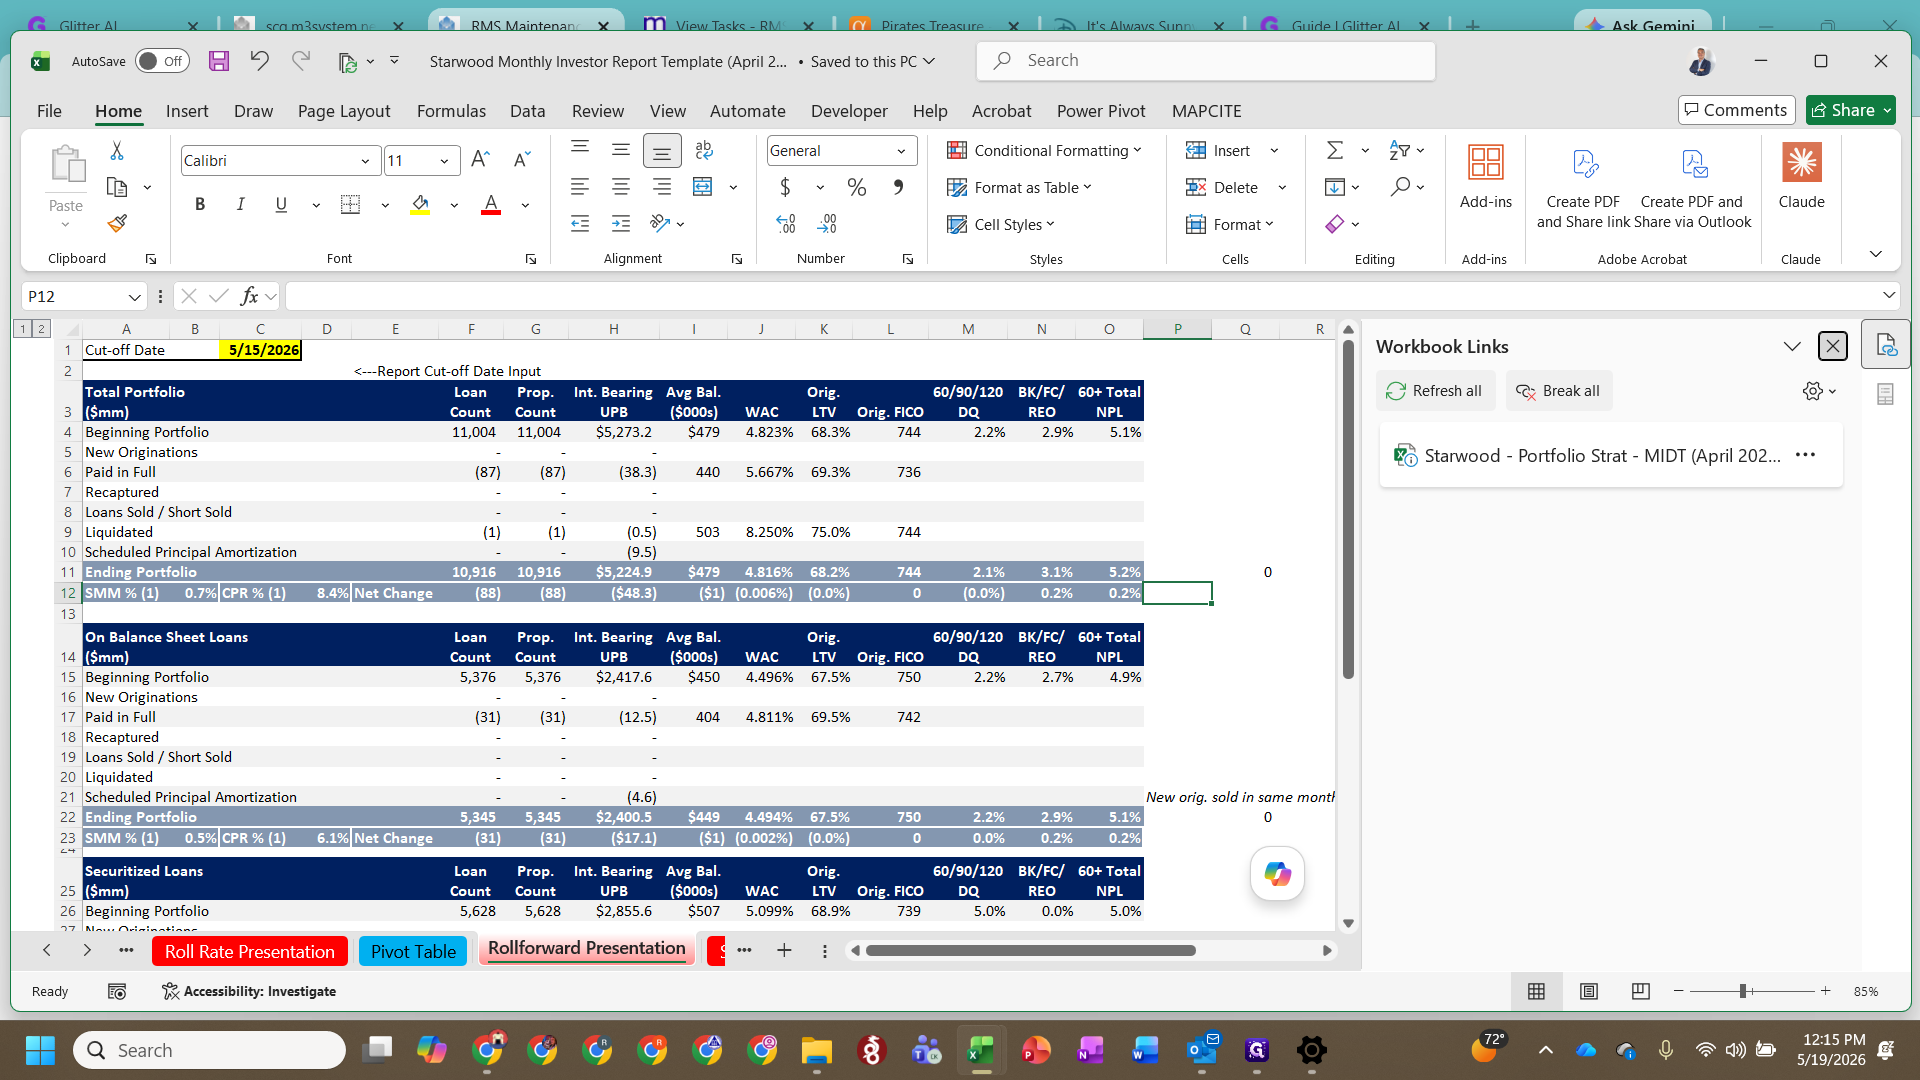
13
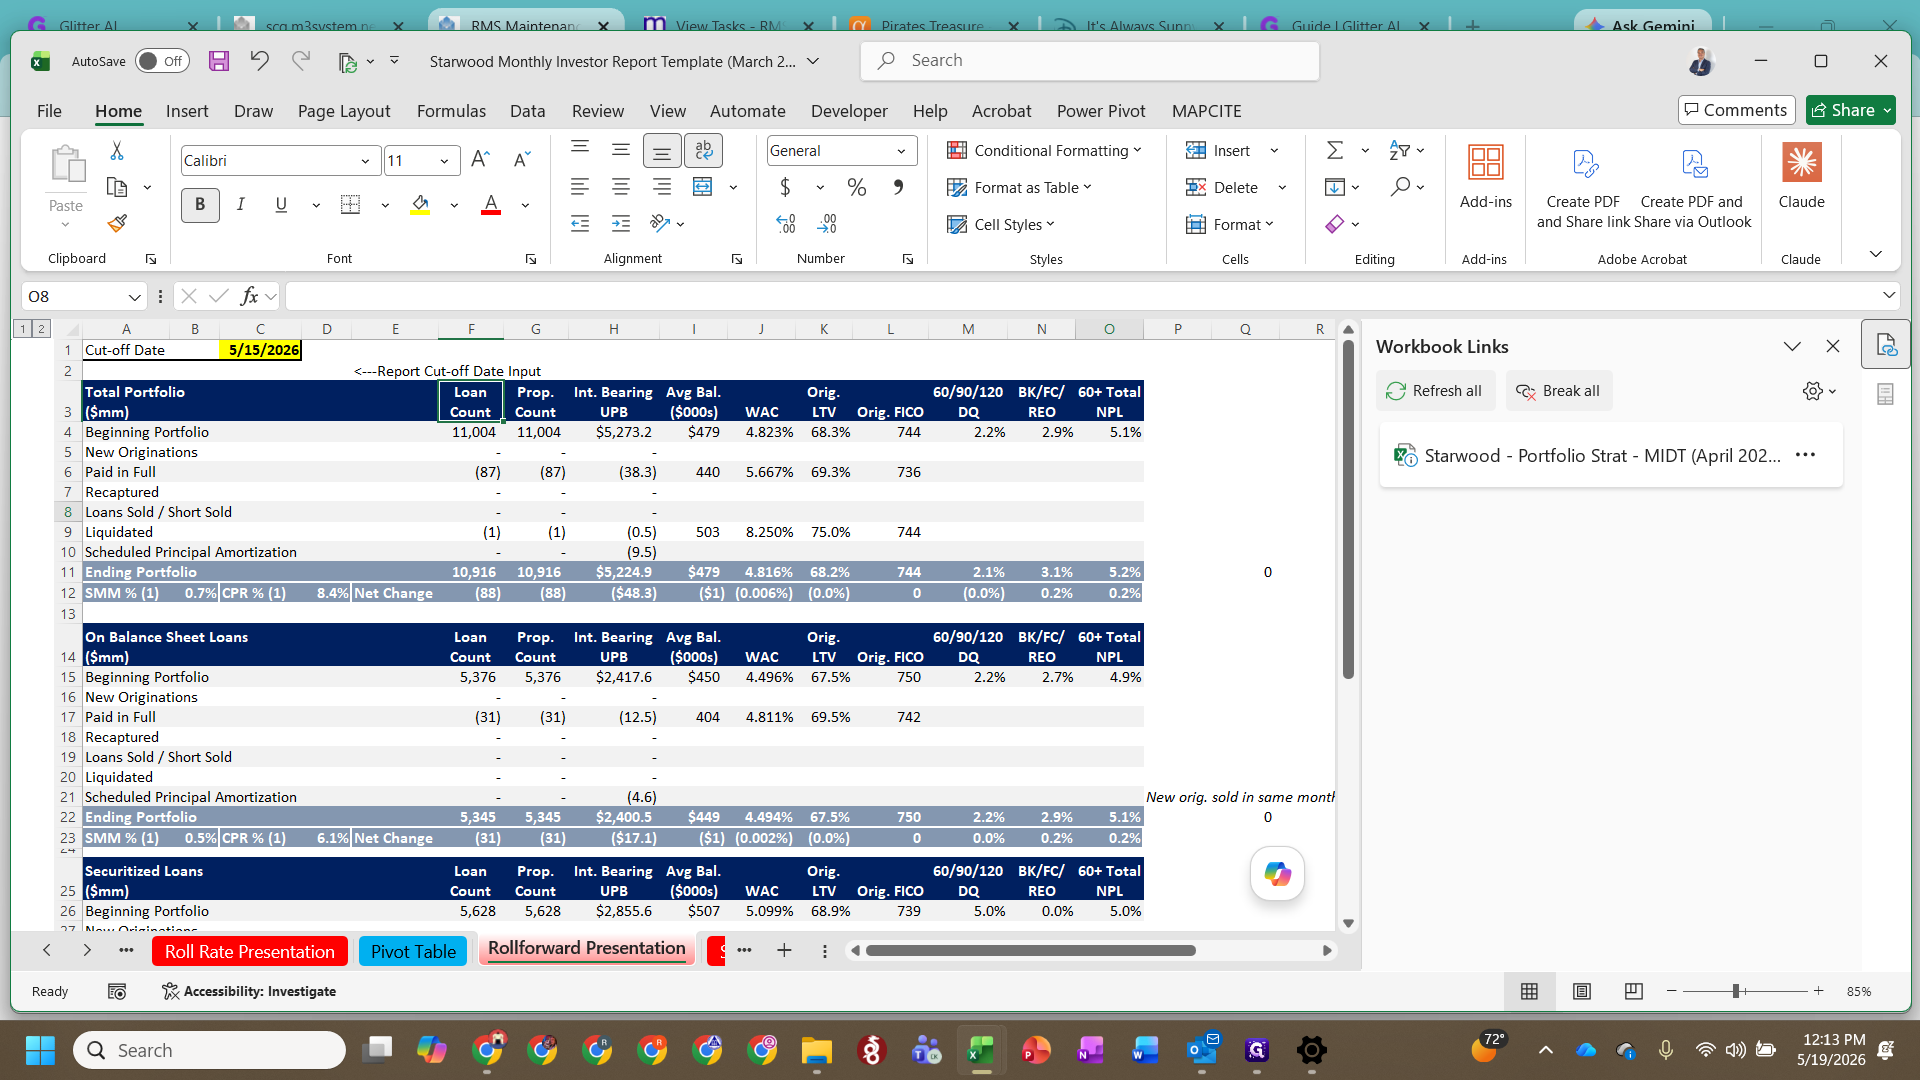
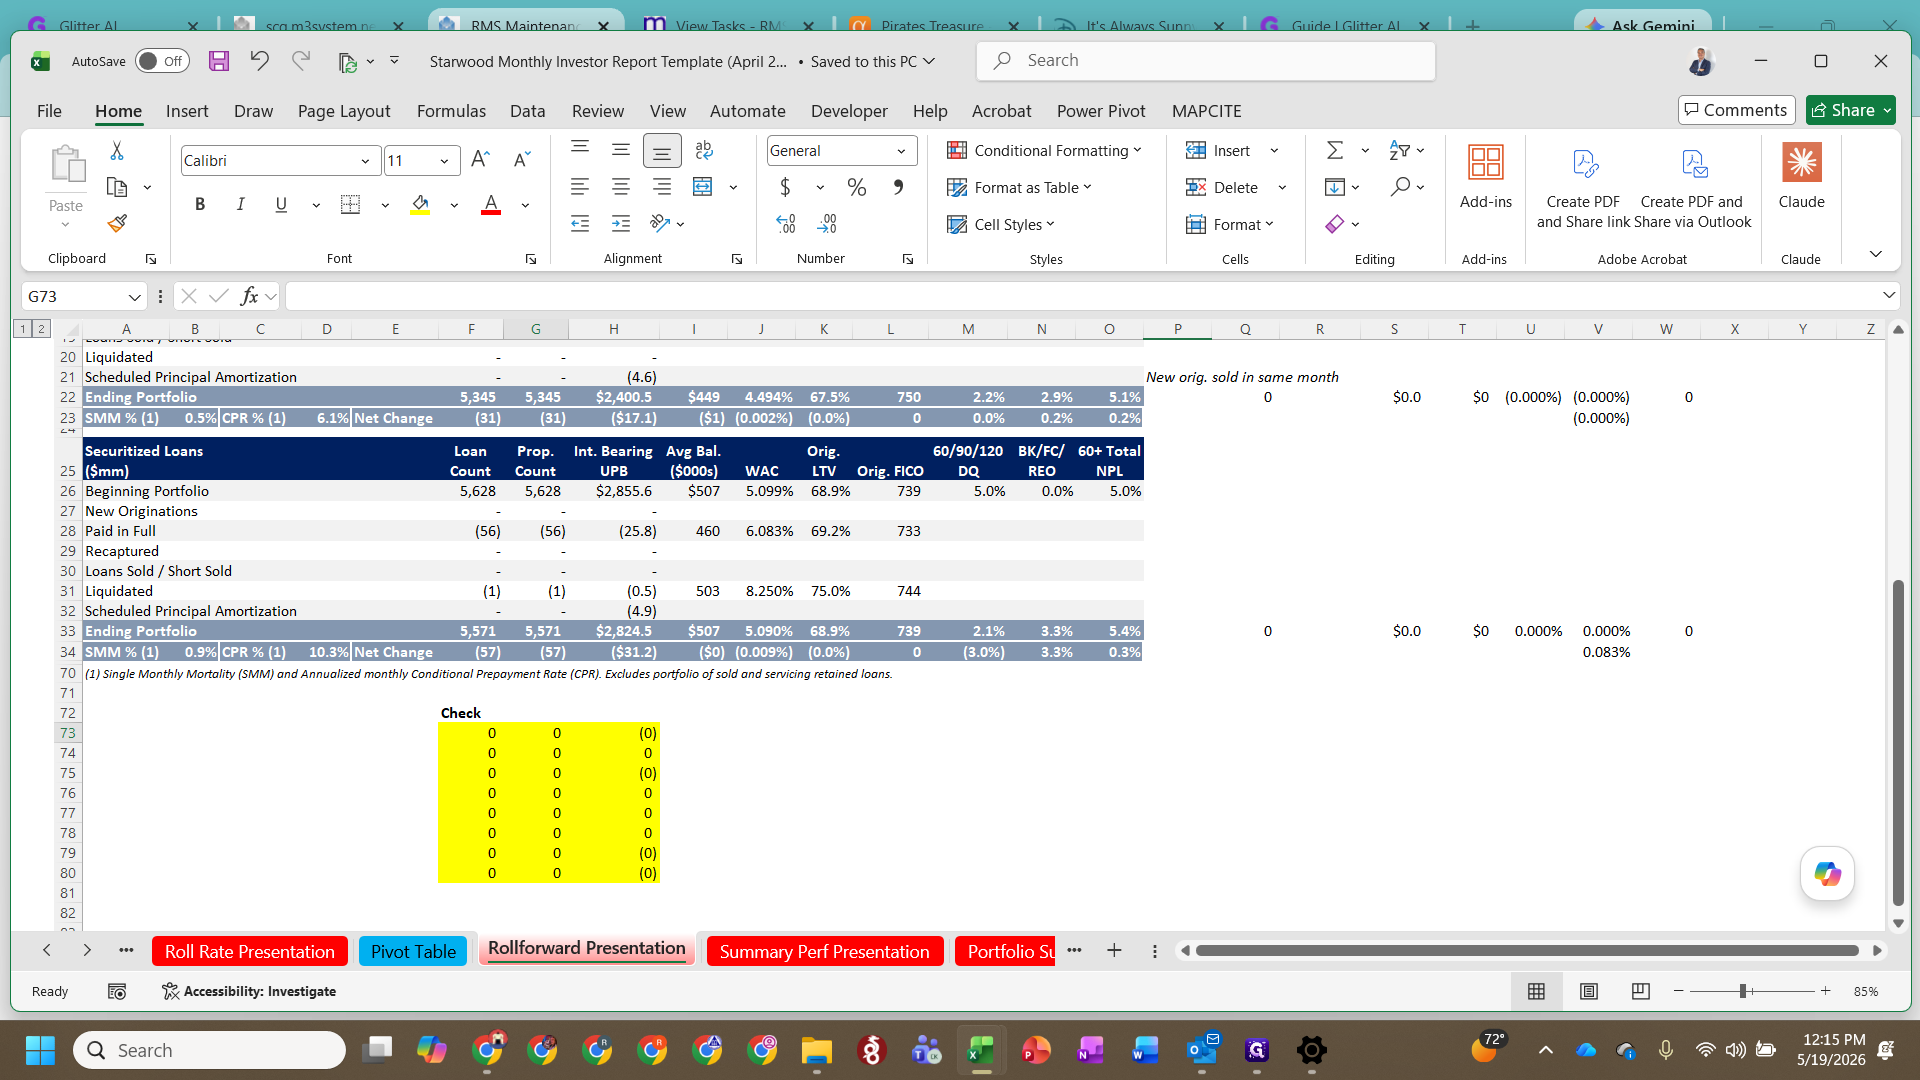
In the Report Excel file, navigate to the first exhibit tab, such as Rollforward Presentation.
14
Select and copy the entire presentation table.
15
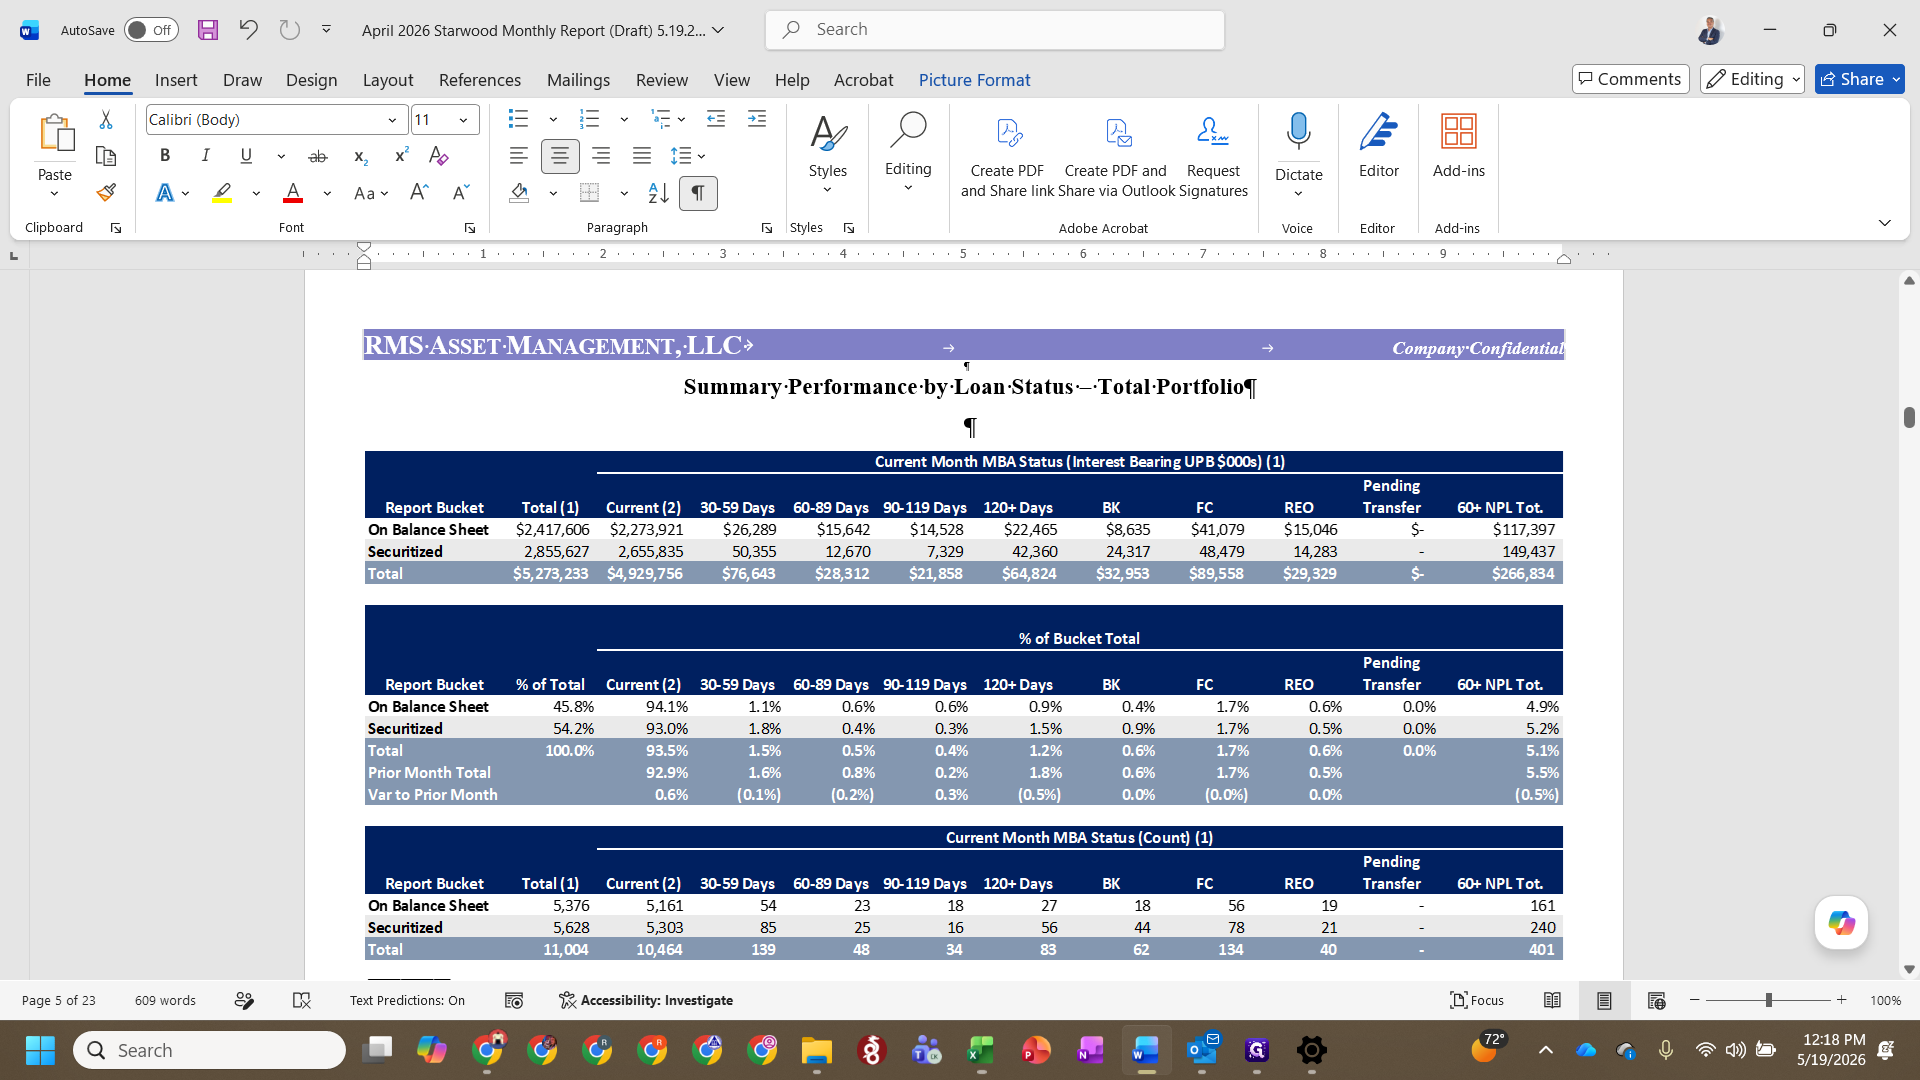
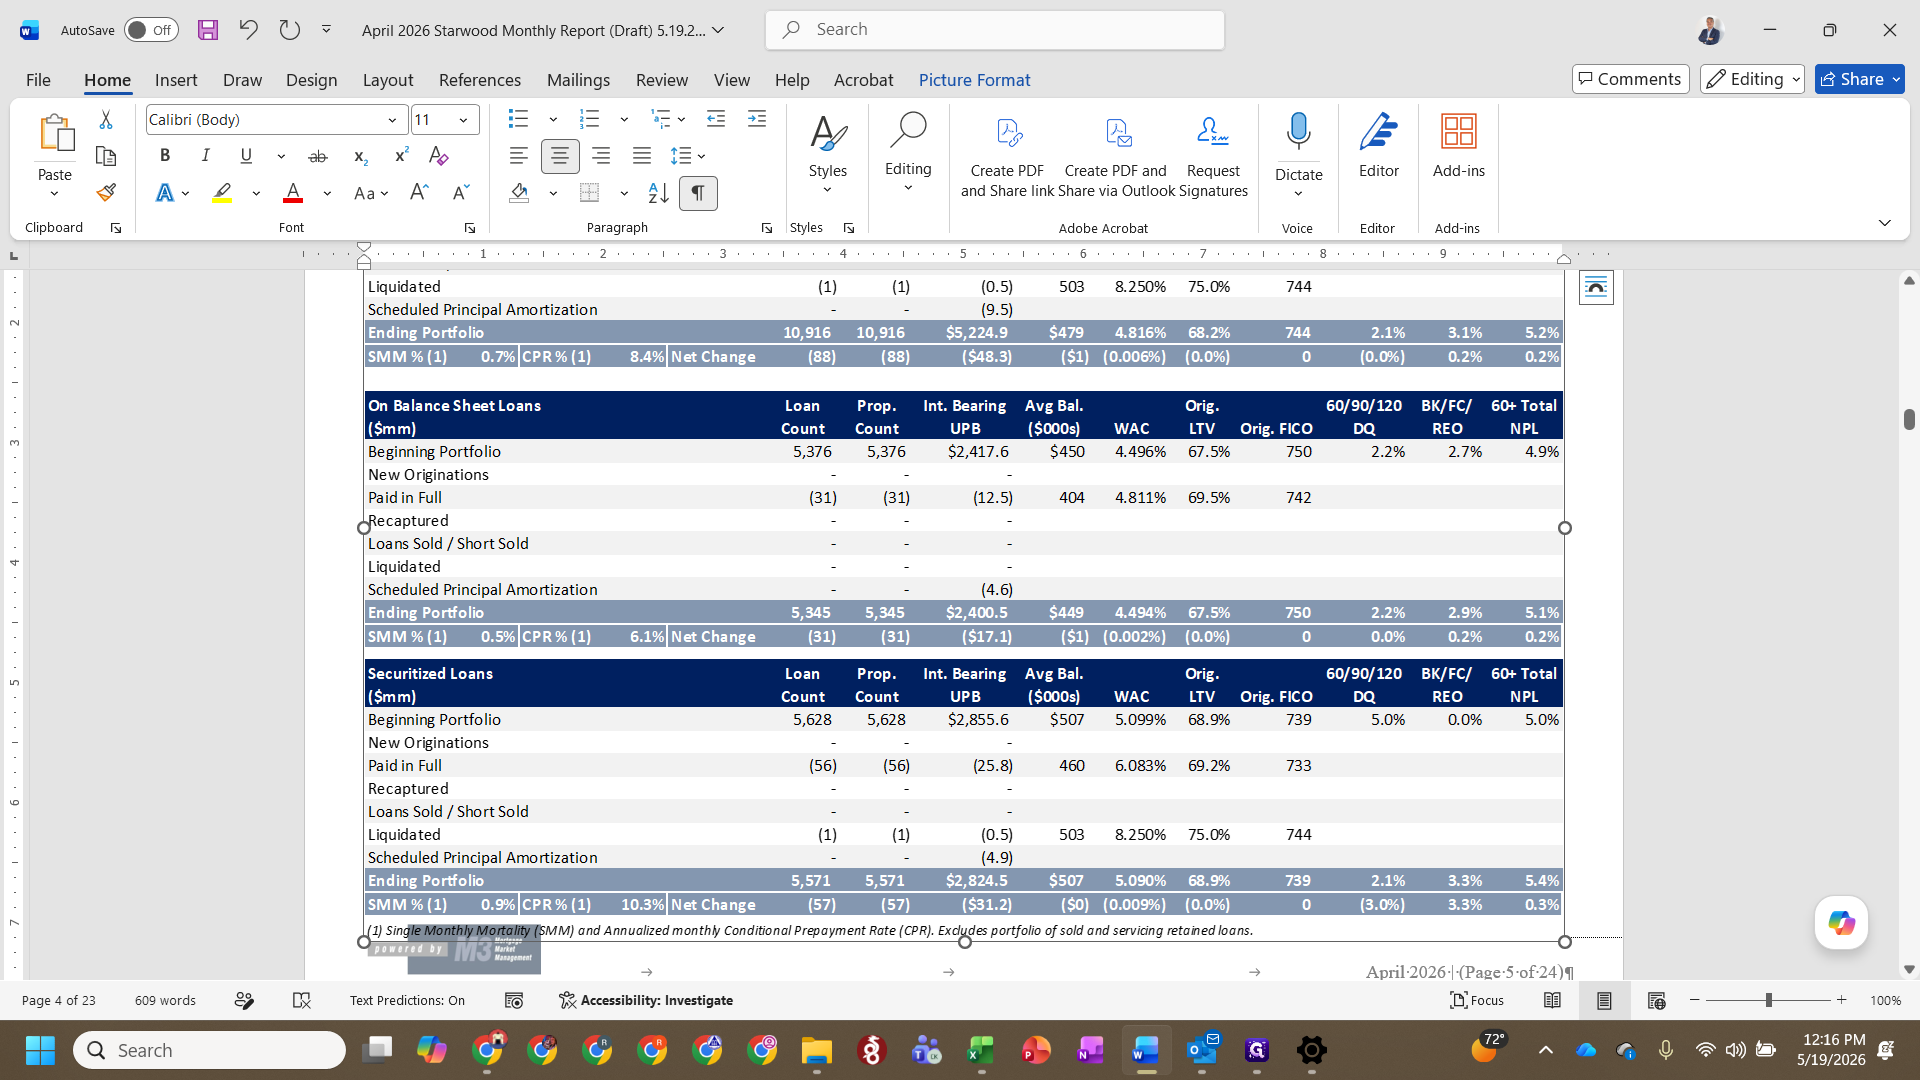
Switch to the Word document, select the previous month's table, and paste the new table as a Picture.
16
Resize the pasted picture so it fits appropriately within the page margins.
Repeat this process for all remaining exhibits, including performance summaries and charts.
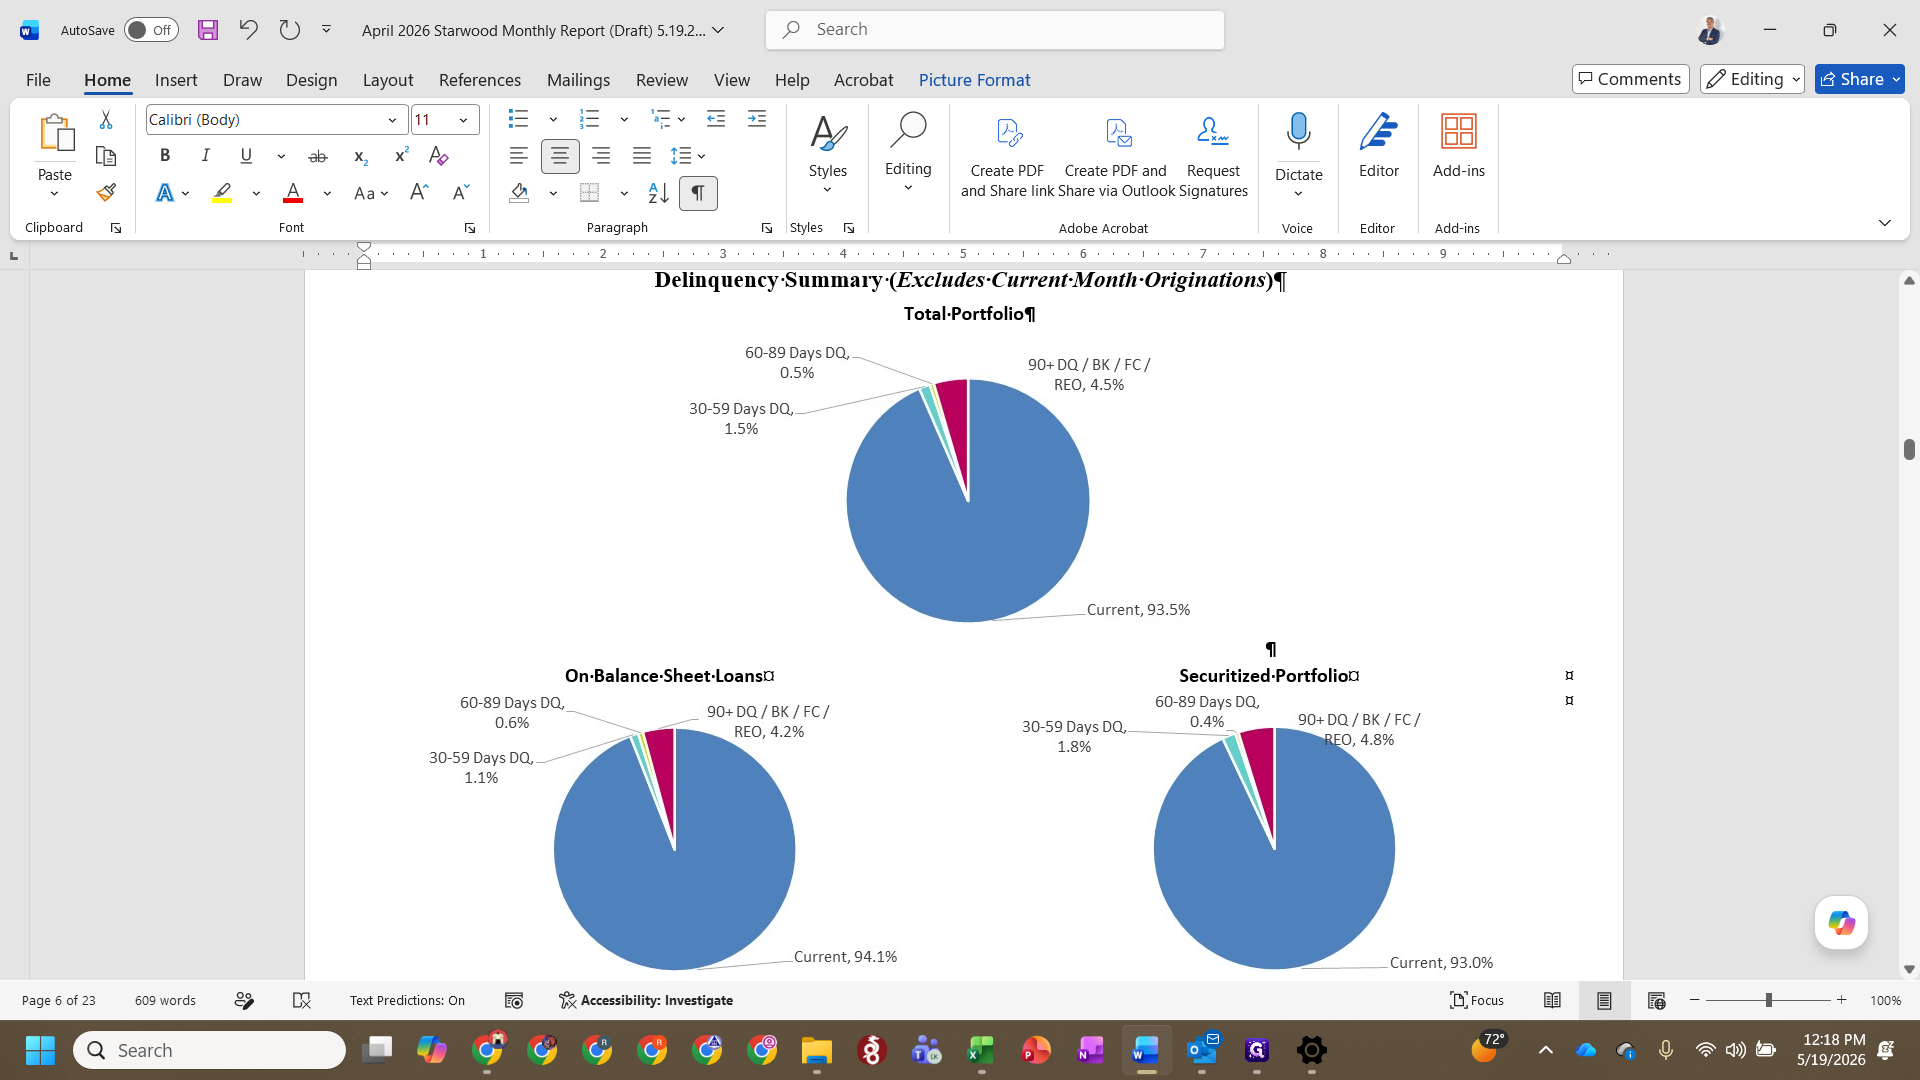
17
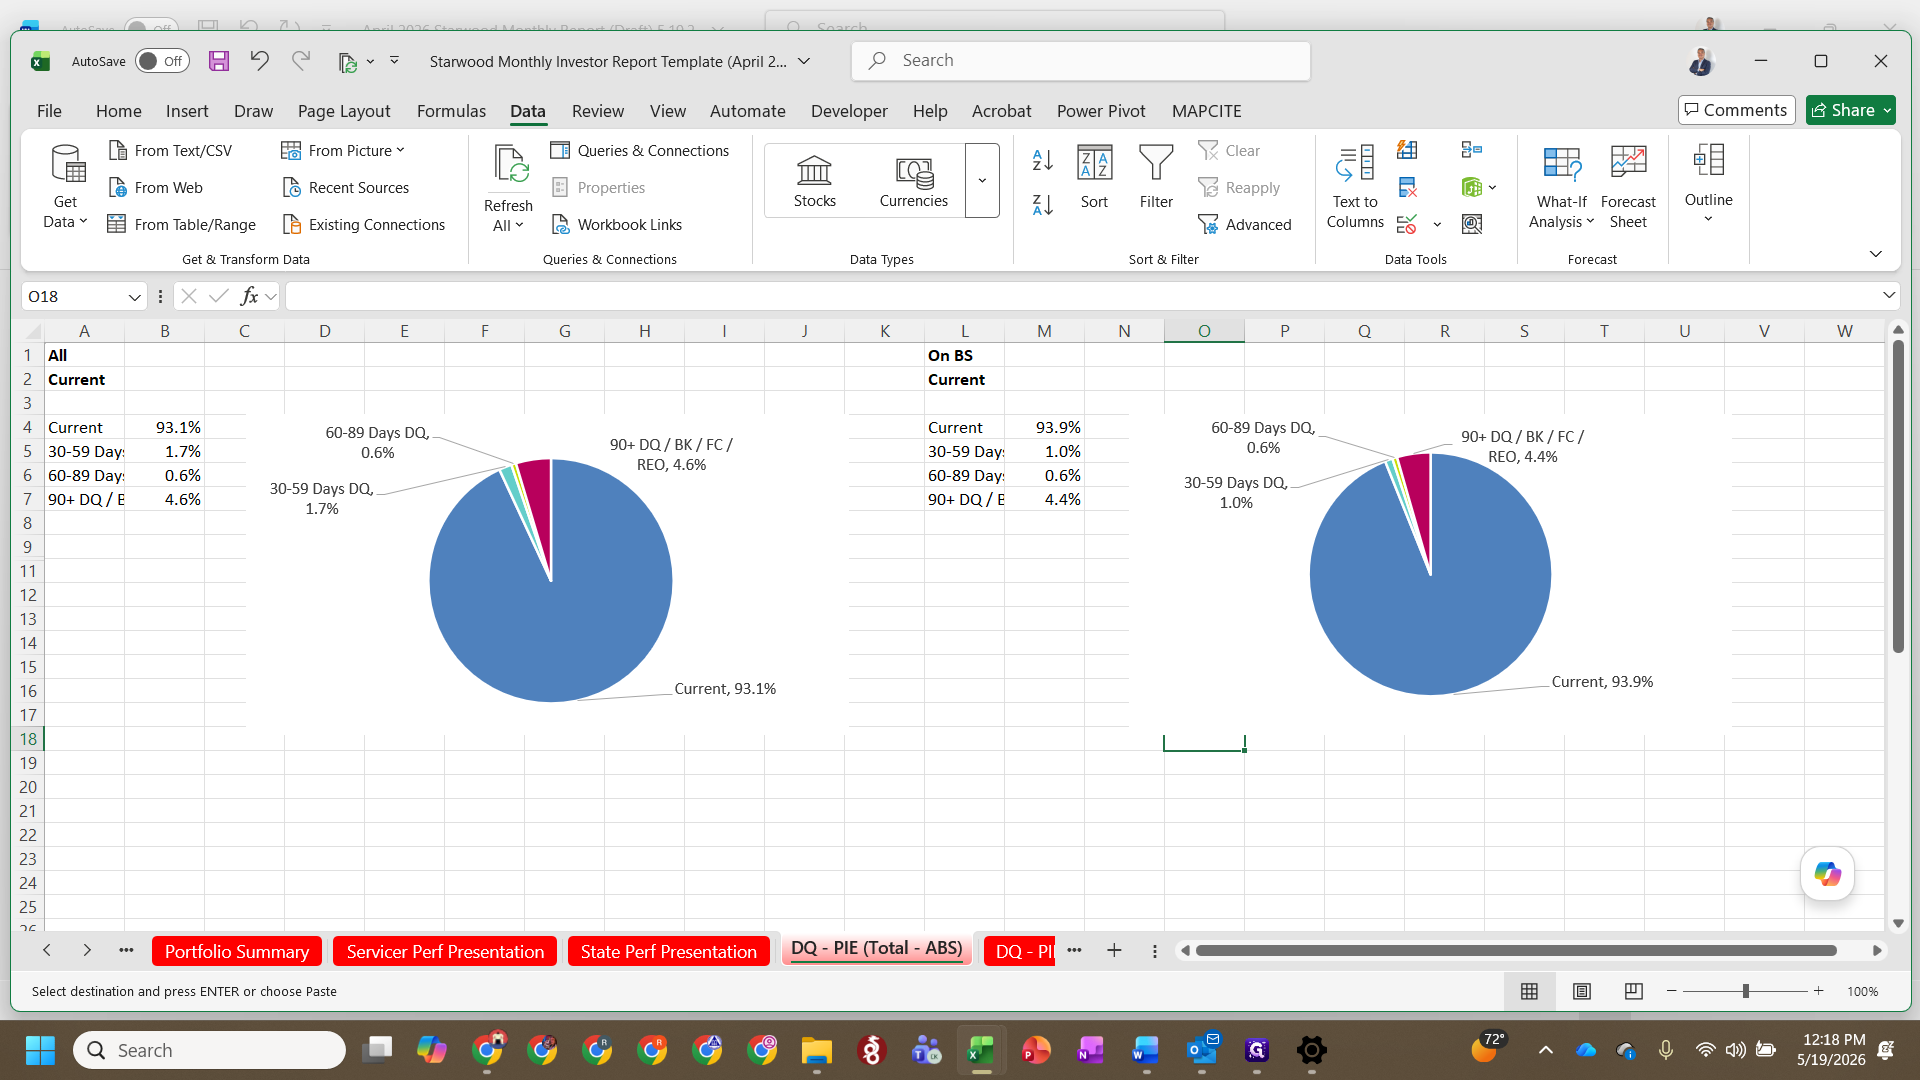
In Excel, locate and copy the updated delinquency pie charts.
18
In the Word document, paste the charts as a picture over the previous month's version.
19
When updating the Roll Rate tables go to Pivot Table in Reporting template file and use slicer to choose both (All) and On BS or ABS then copy and paste special picture.
FAQ
Q: Why don't the ending portfolio numbers in my tables match?
A: You likely need to refresh the Pivot Tables in the Excel file. The Pivot Tables calculate the data for these exhibits, so they must be refreshed after inputting new raw data.
Q: Why do I need to keep the Report and Strat files open at the same time?
A: The Monthly Investor Report file is dynamically linked to the Strat file. Having both open ensures that the external cell links automatically update to point to the new files when you perform a "Save As" into the new month's folder.