How to View Daily Stock and Inventory Reports
Learn how to access, filter, and analyze daily stock availability using different inventory report views, including Overview, Patterns, and Classic tables.
This guide shows you how to access, filter, and interpret your daily stock reports.
By completing these steps, you will be able to track item availability, analyze utilization trends, and confidently manage your rental schedules.
This guide is intended for rental store administrators and inventory managers who need to monitor product availability during their daily scheduling workflows.
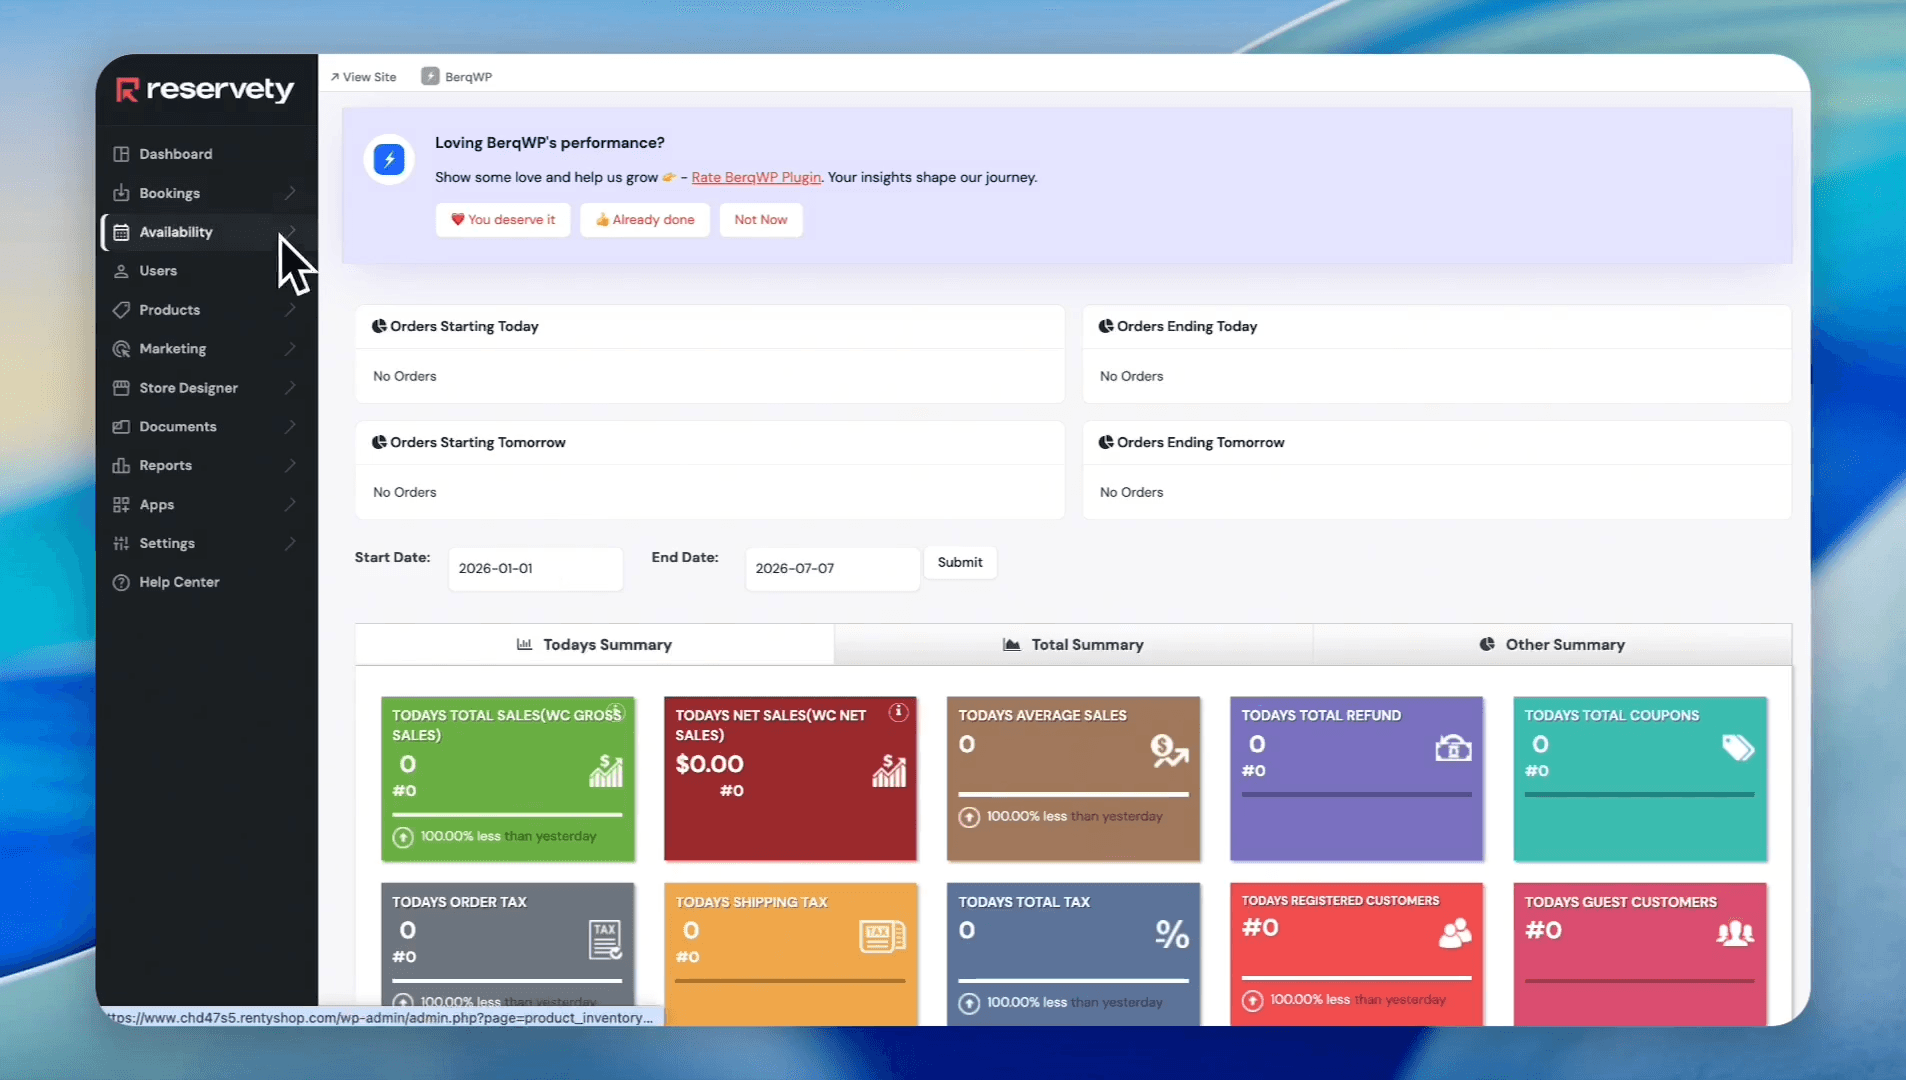
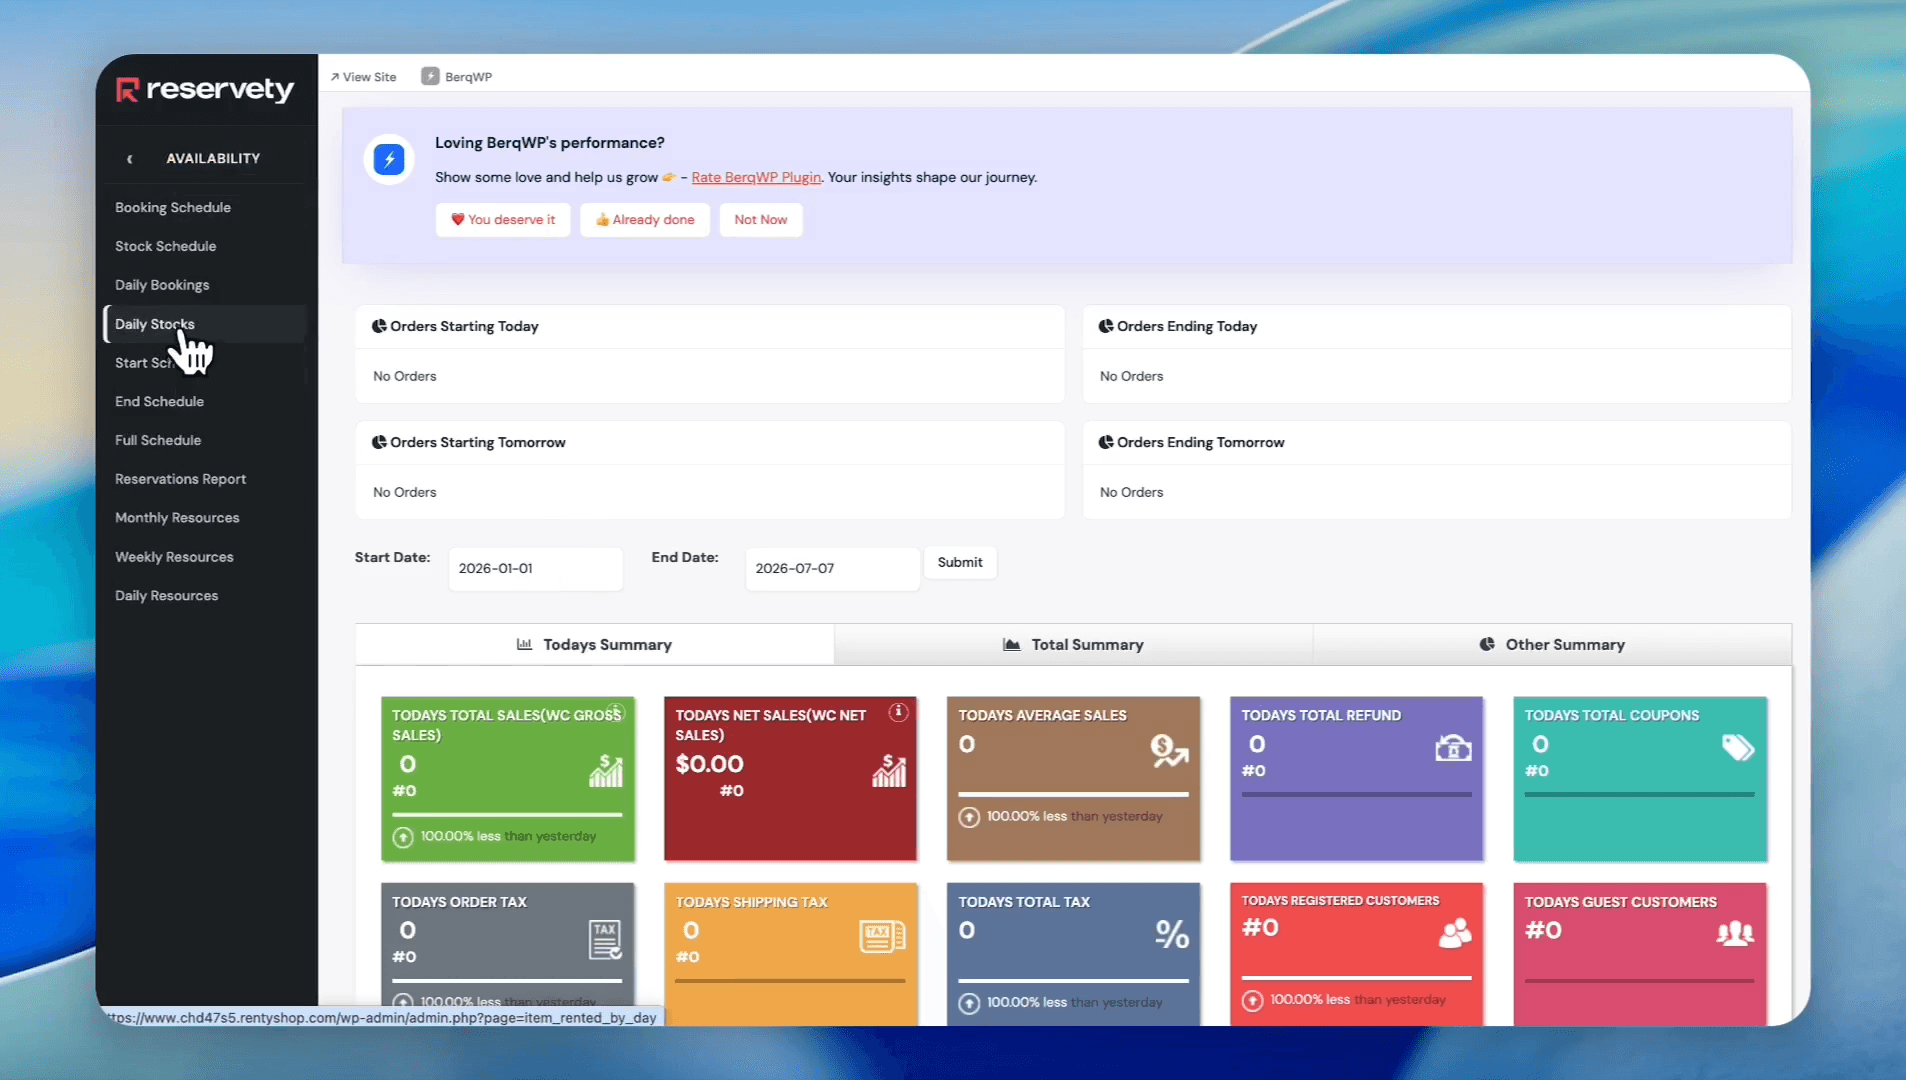
Navigating to Daily Stocks
Filtering the Inventory Report
Before viewing your stock, specify the reporting period, category, or warehouse you want to analyze.
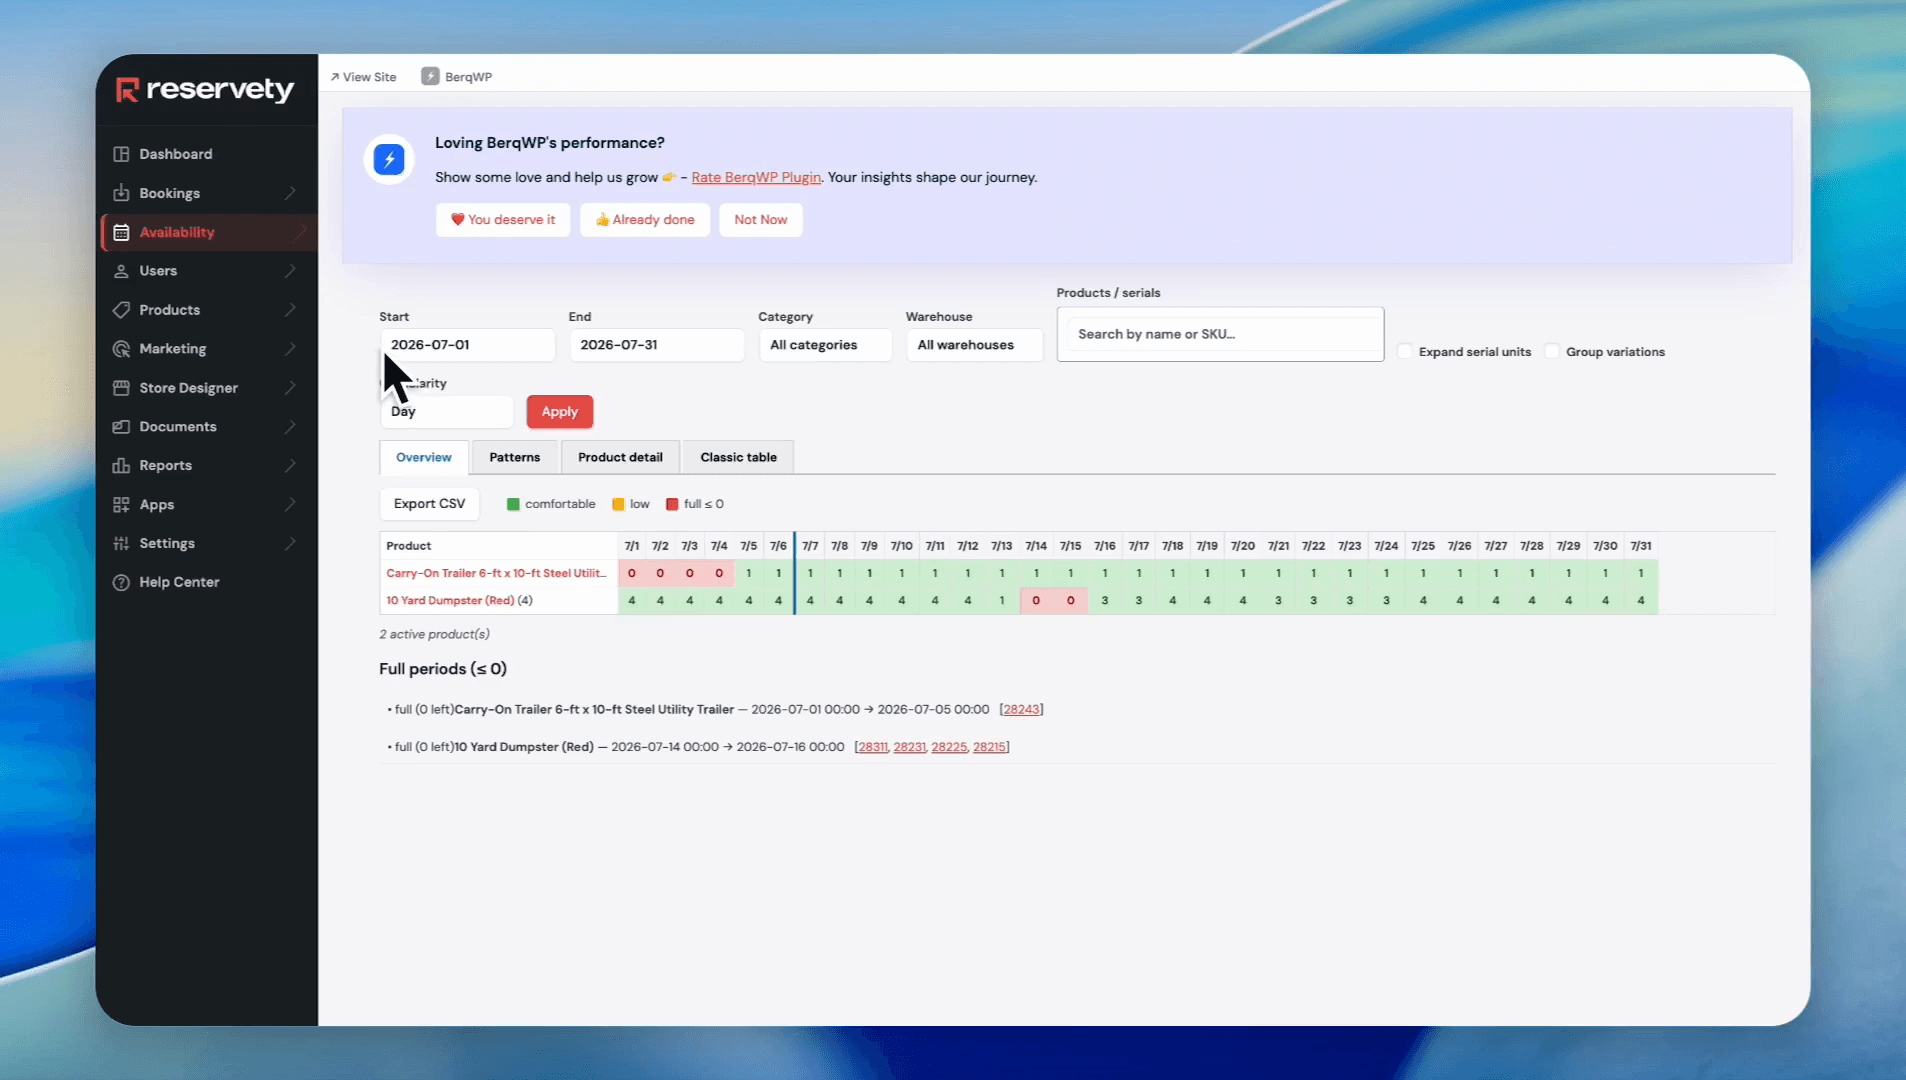
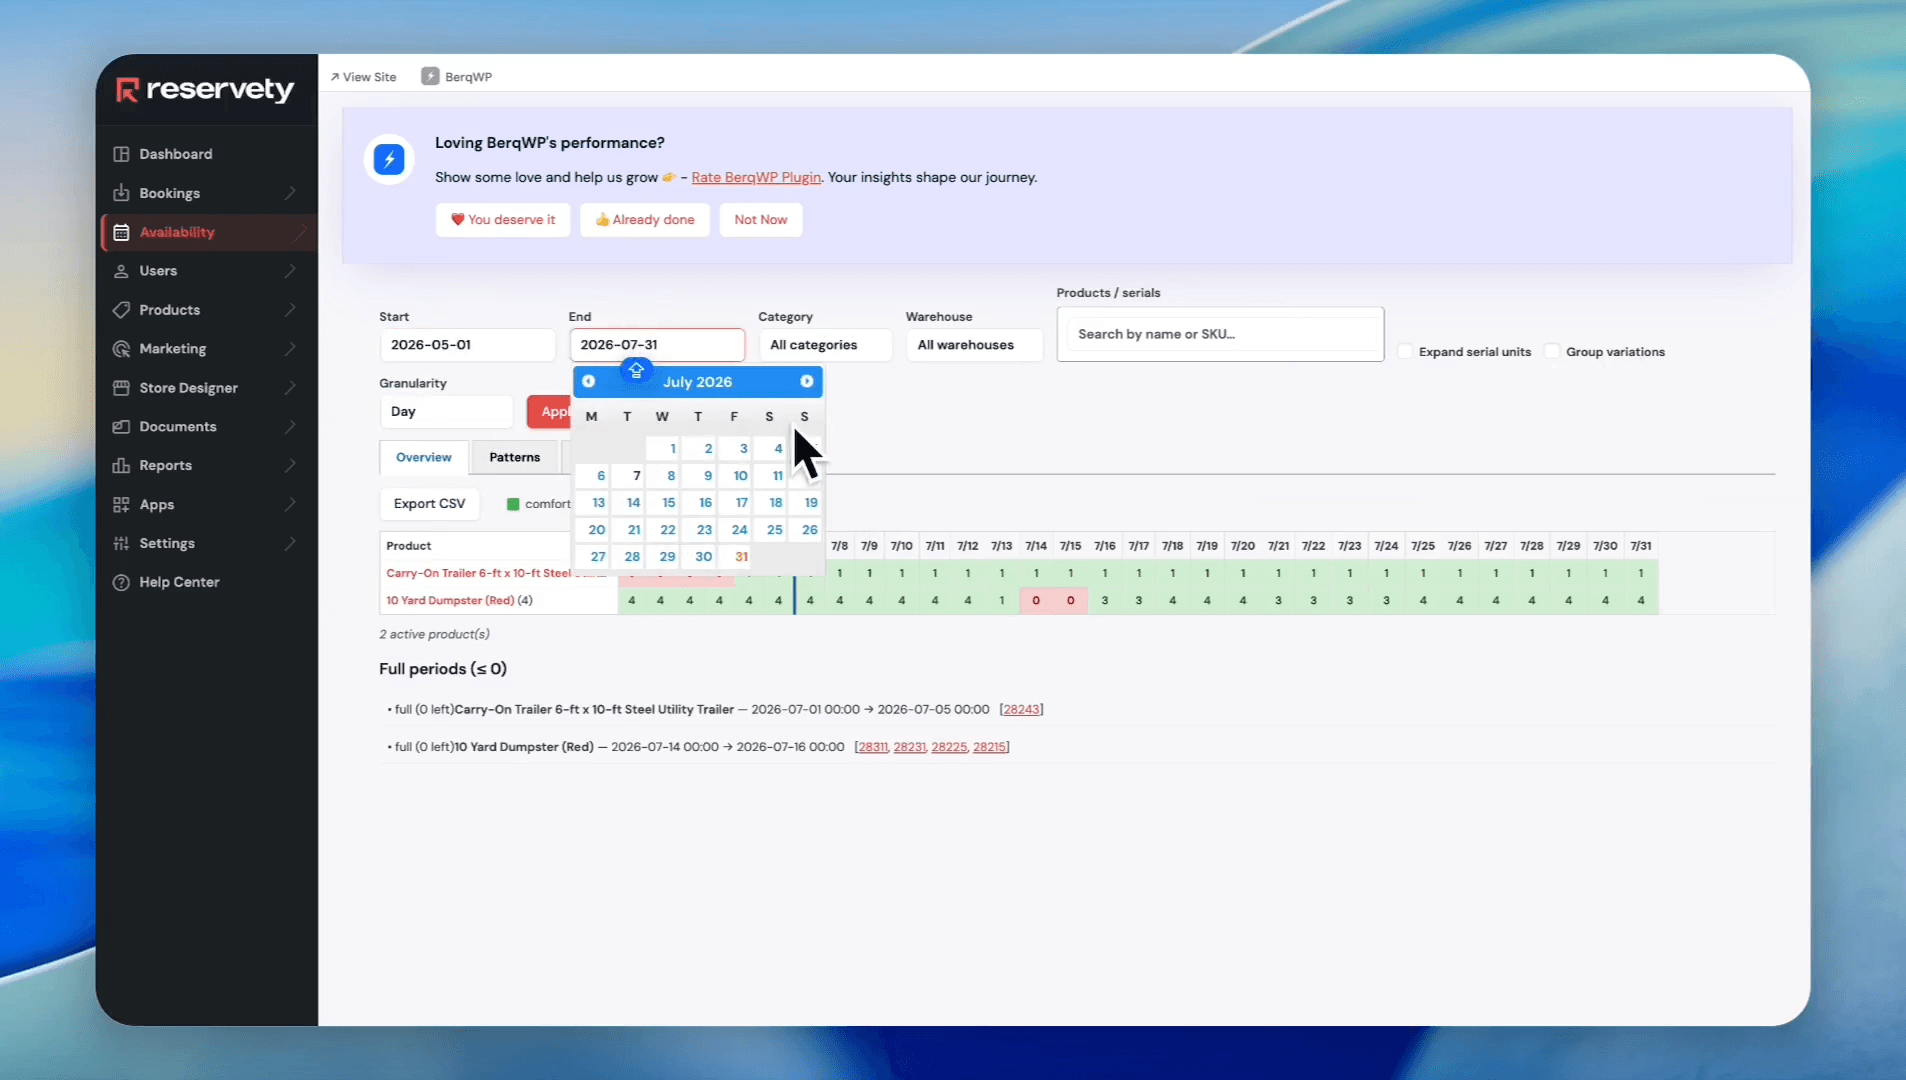
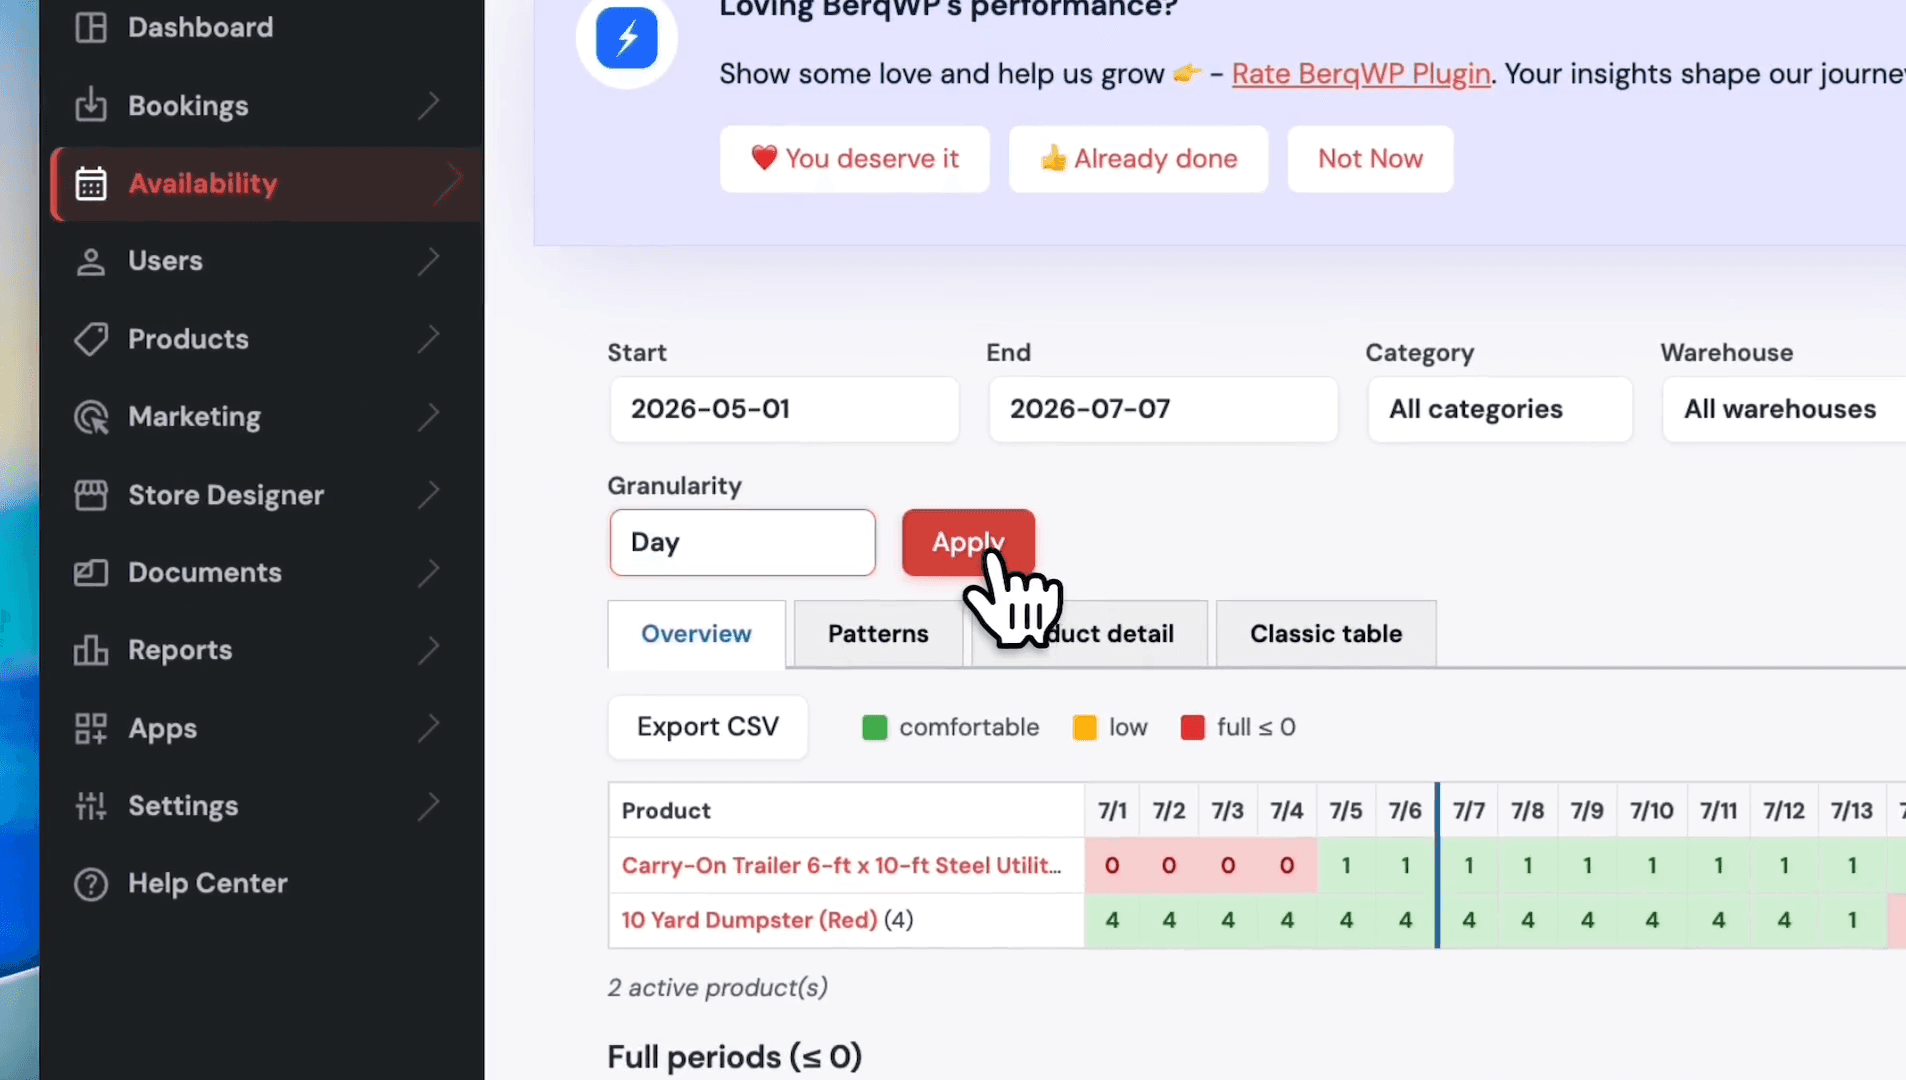
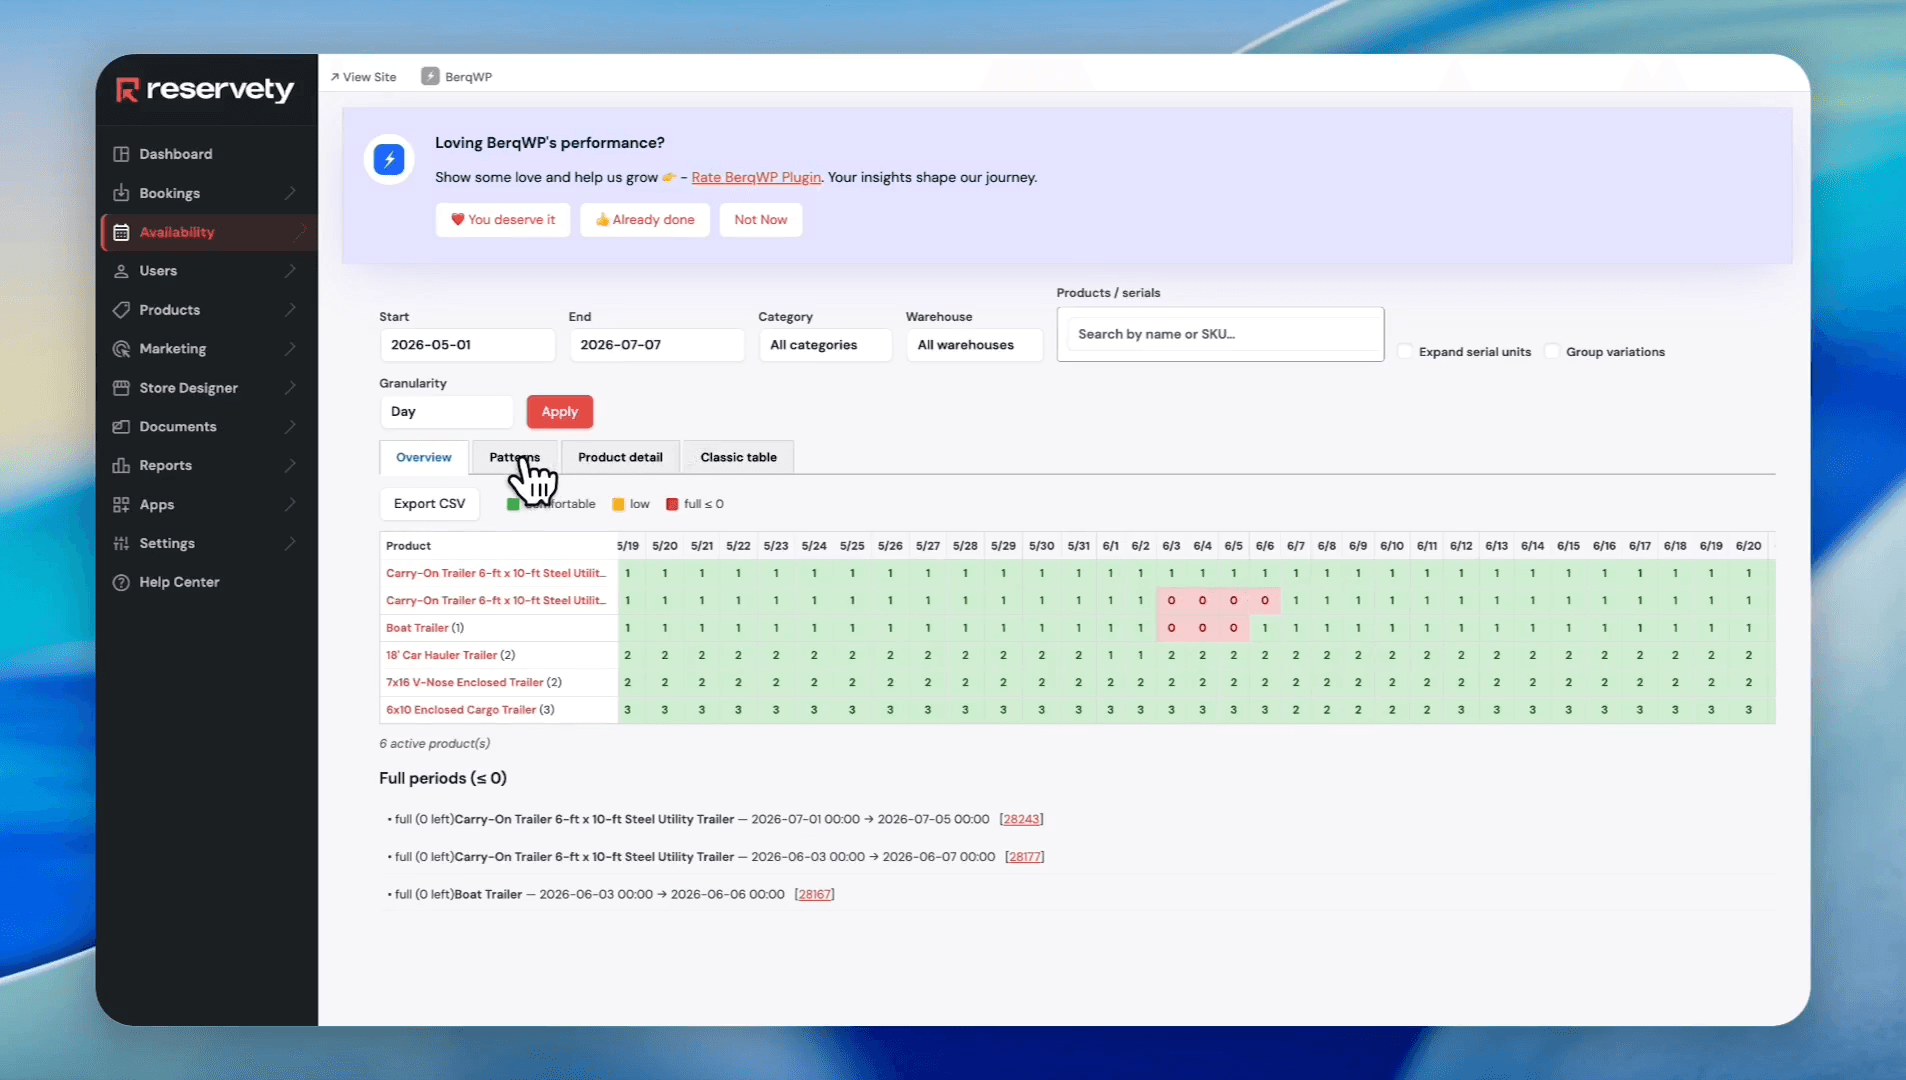
Once applied, the daily stock schedule appears, indicating availability using numbers and color codes. Green cells indicate available inventory, while other colors represent different unavailable states.
Daily Inventory Report Views
The daily inventory report offers four different views tailored to specific needs:
Report View | Best For | Description |
|---|---|---|
Overview | Quick inventory snapshots | A grid showing daily unit availability per product. Below the grid, it lists currently rented products and their dates. |
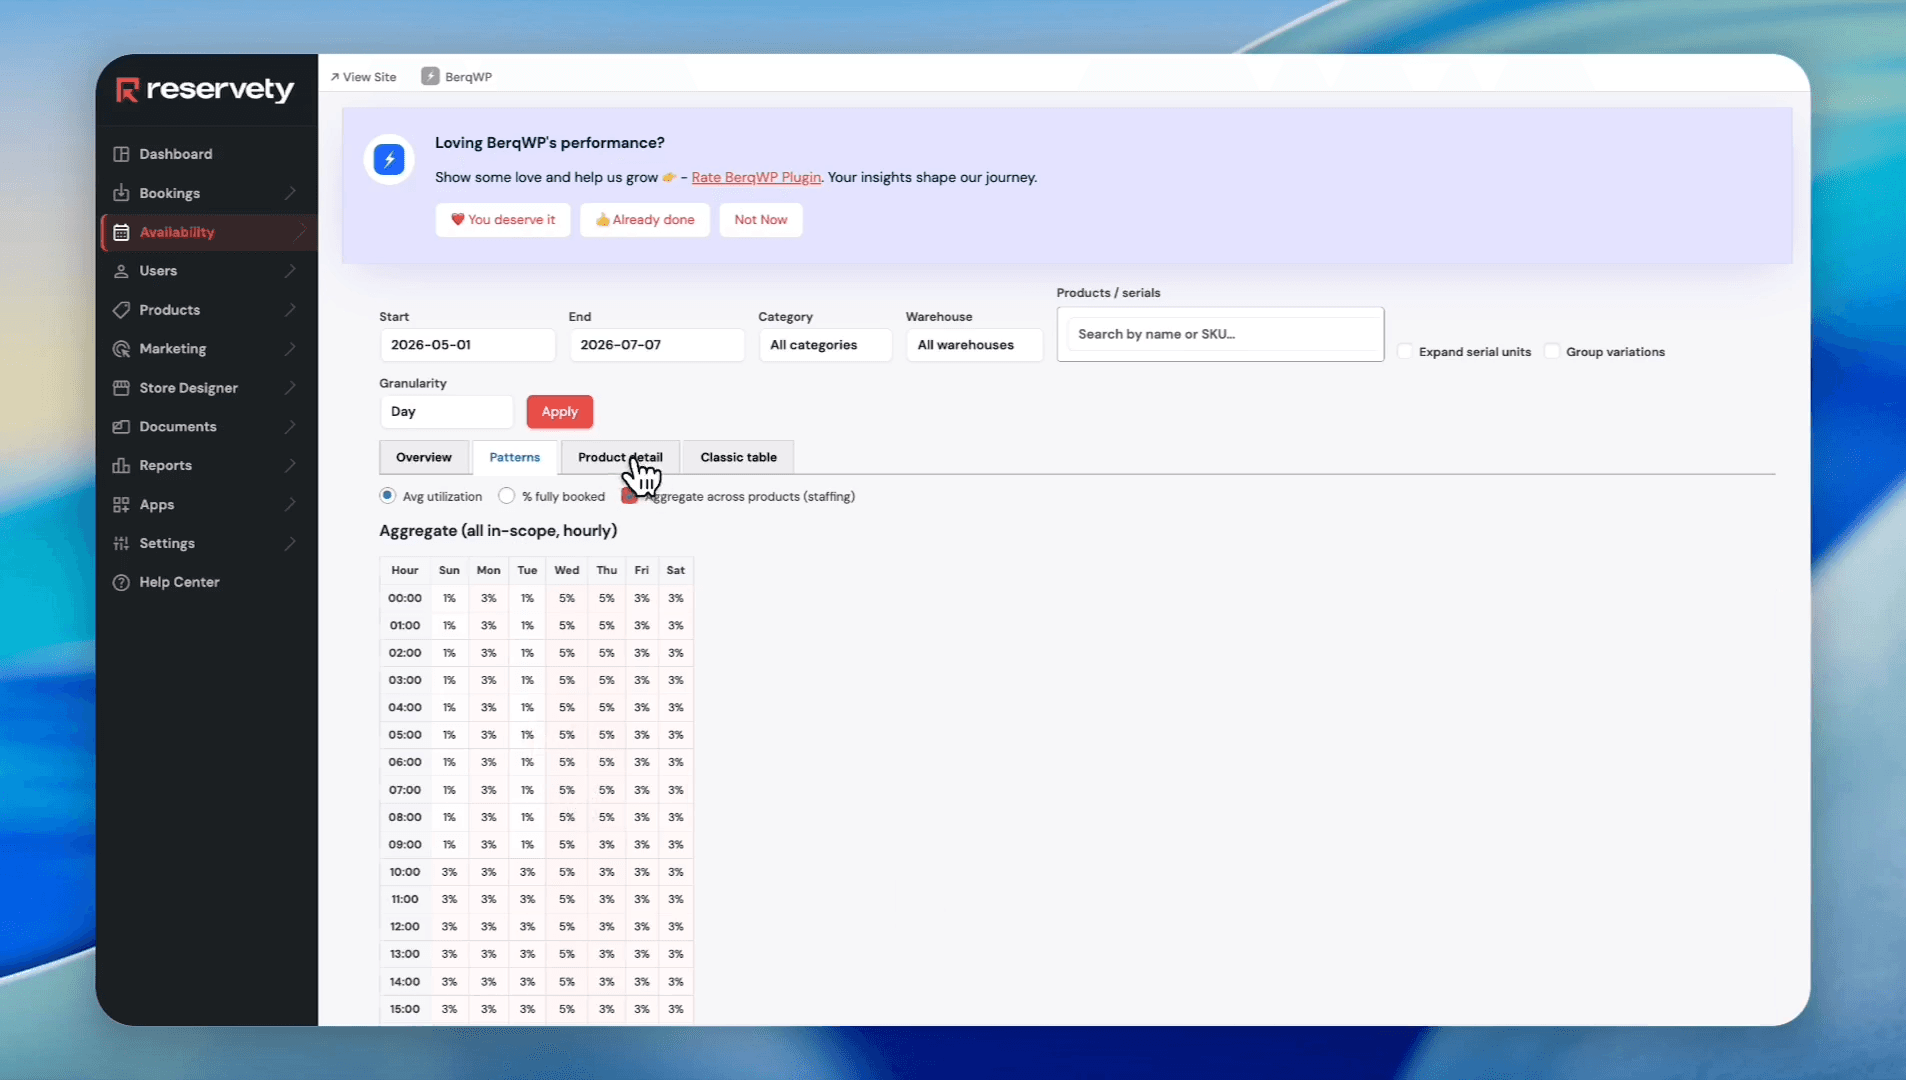
Patterns | Optimizing operations | Analyzes utilization trends throughout the week, displaying average percentages by hour and day. |
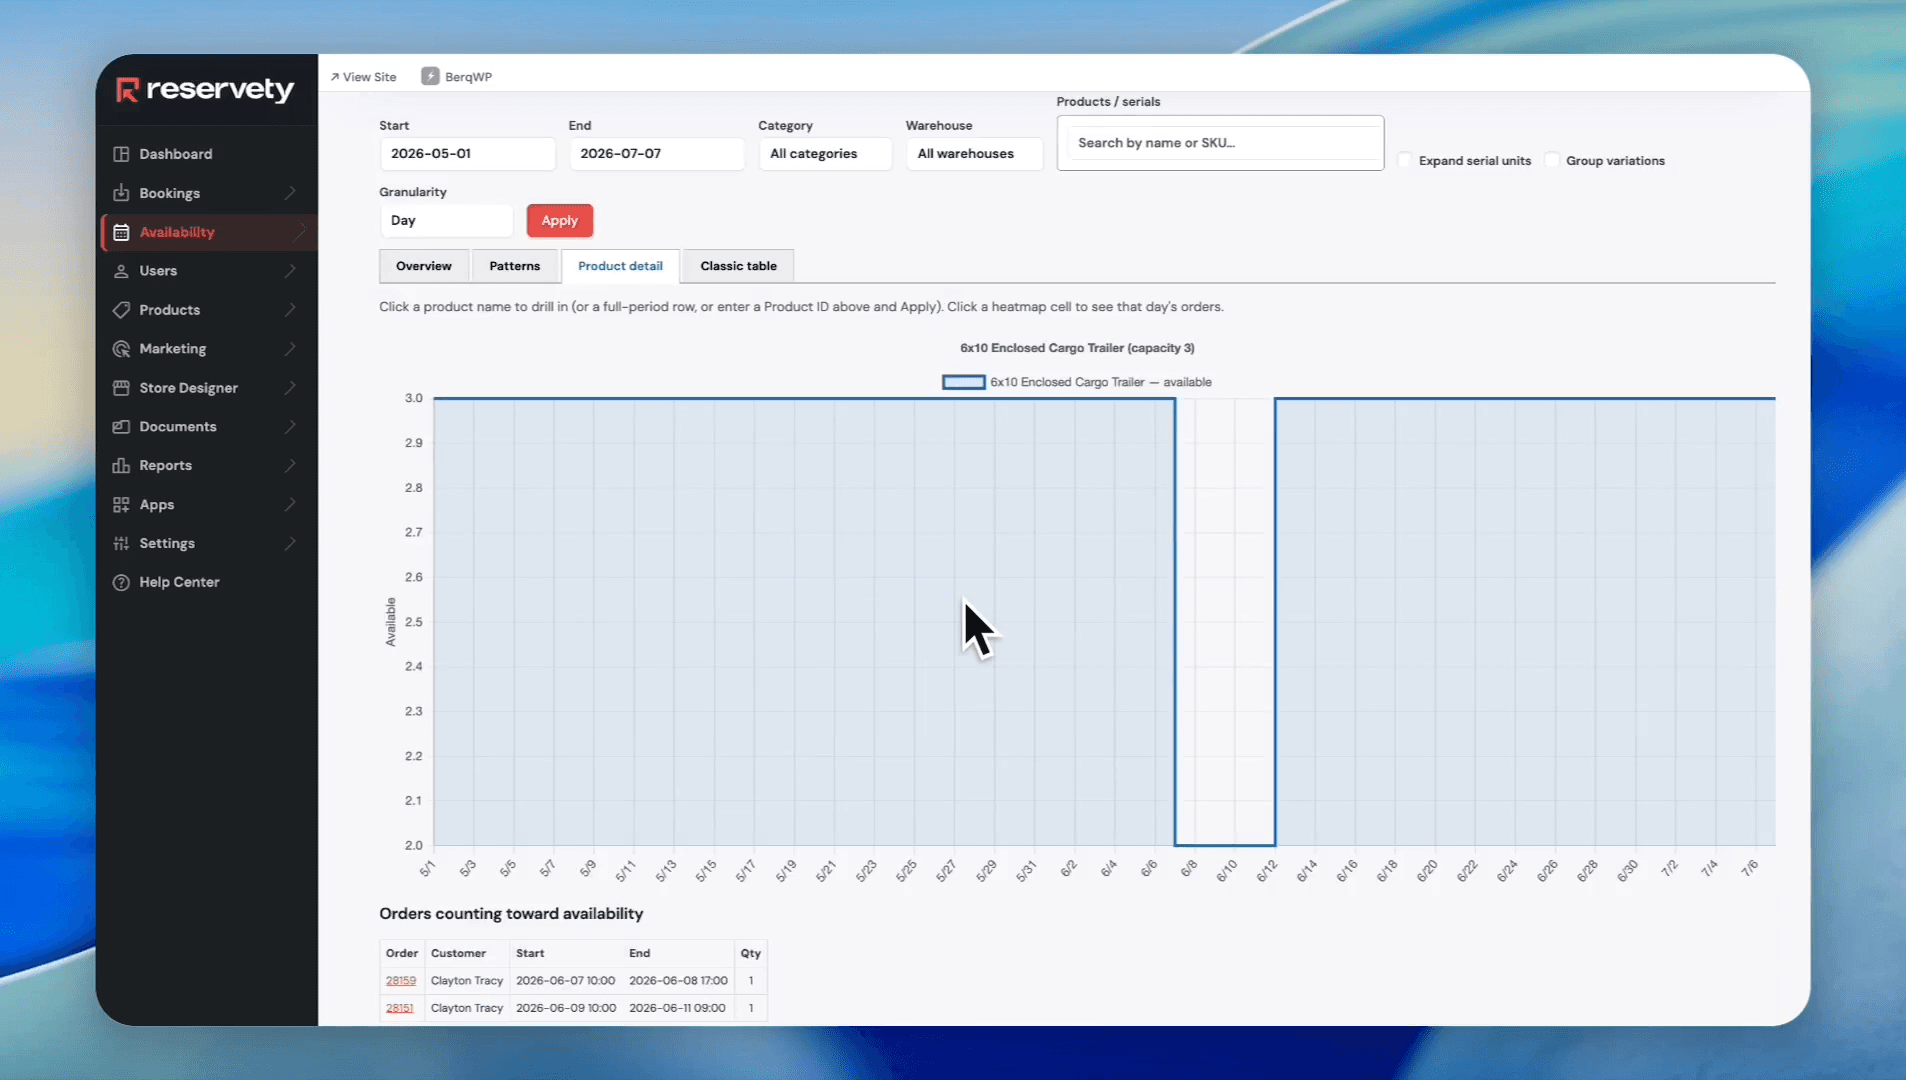
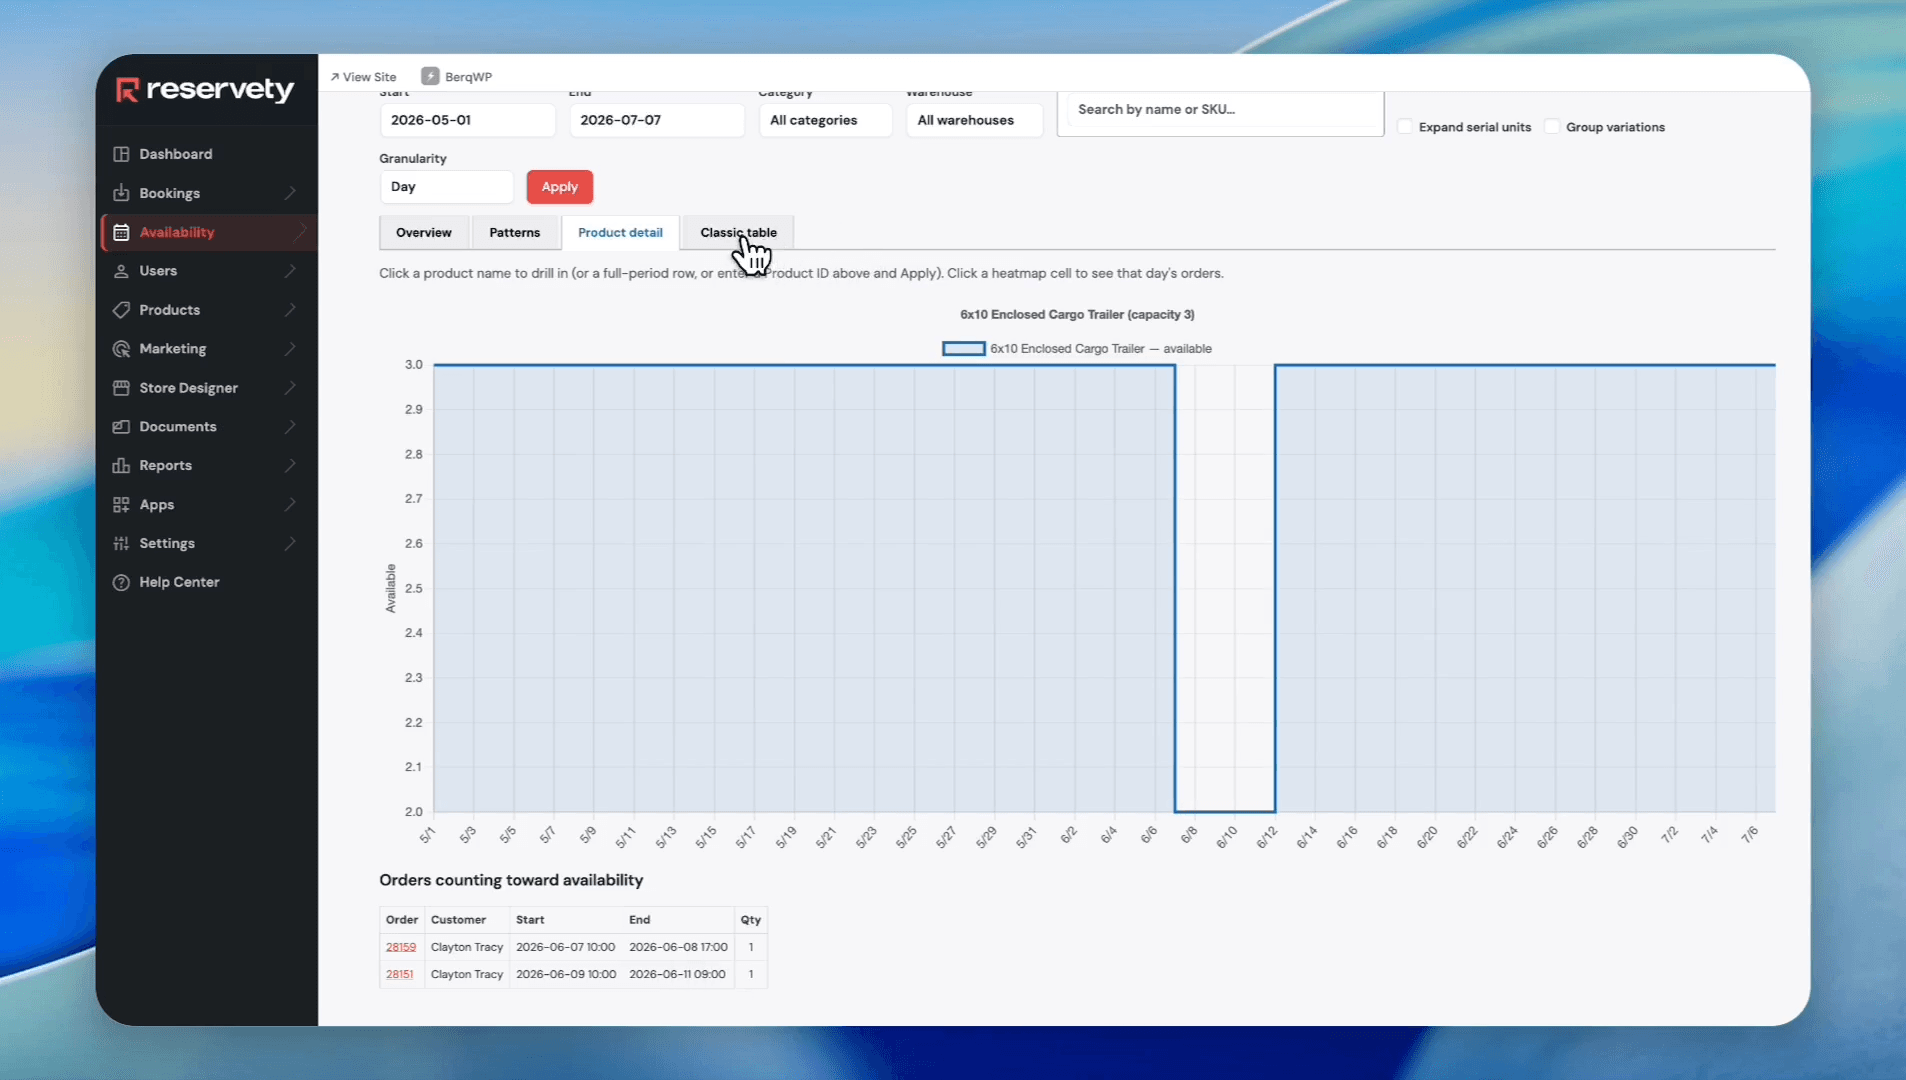
Product Details | Troubleshooting schedules | Focuses on a single product, providing a utilization graph and a list of associated bookings. |
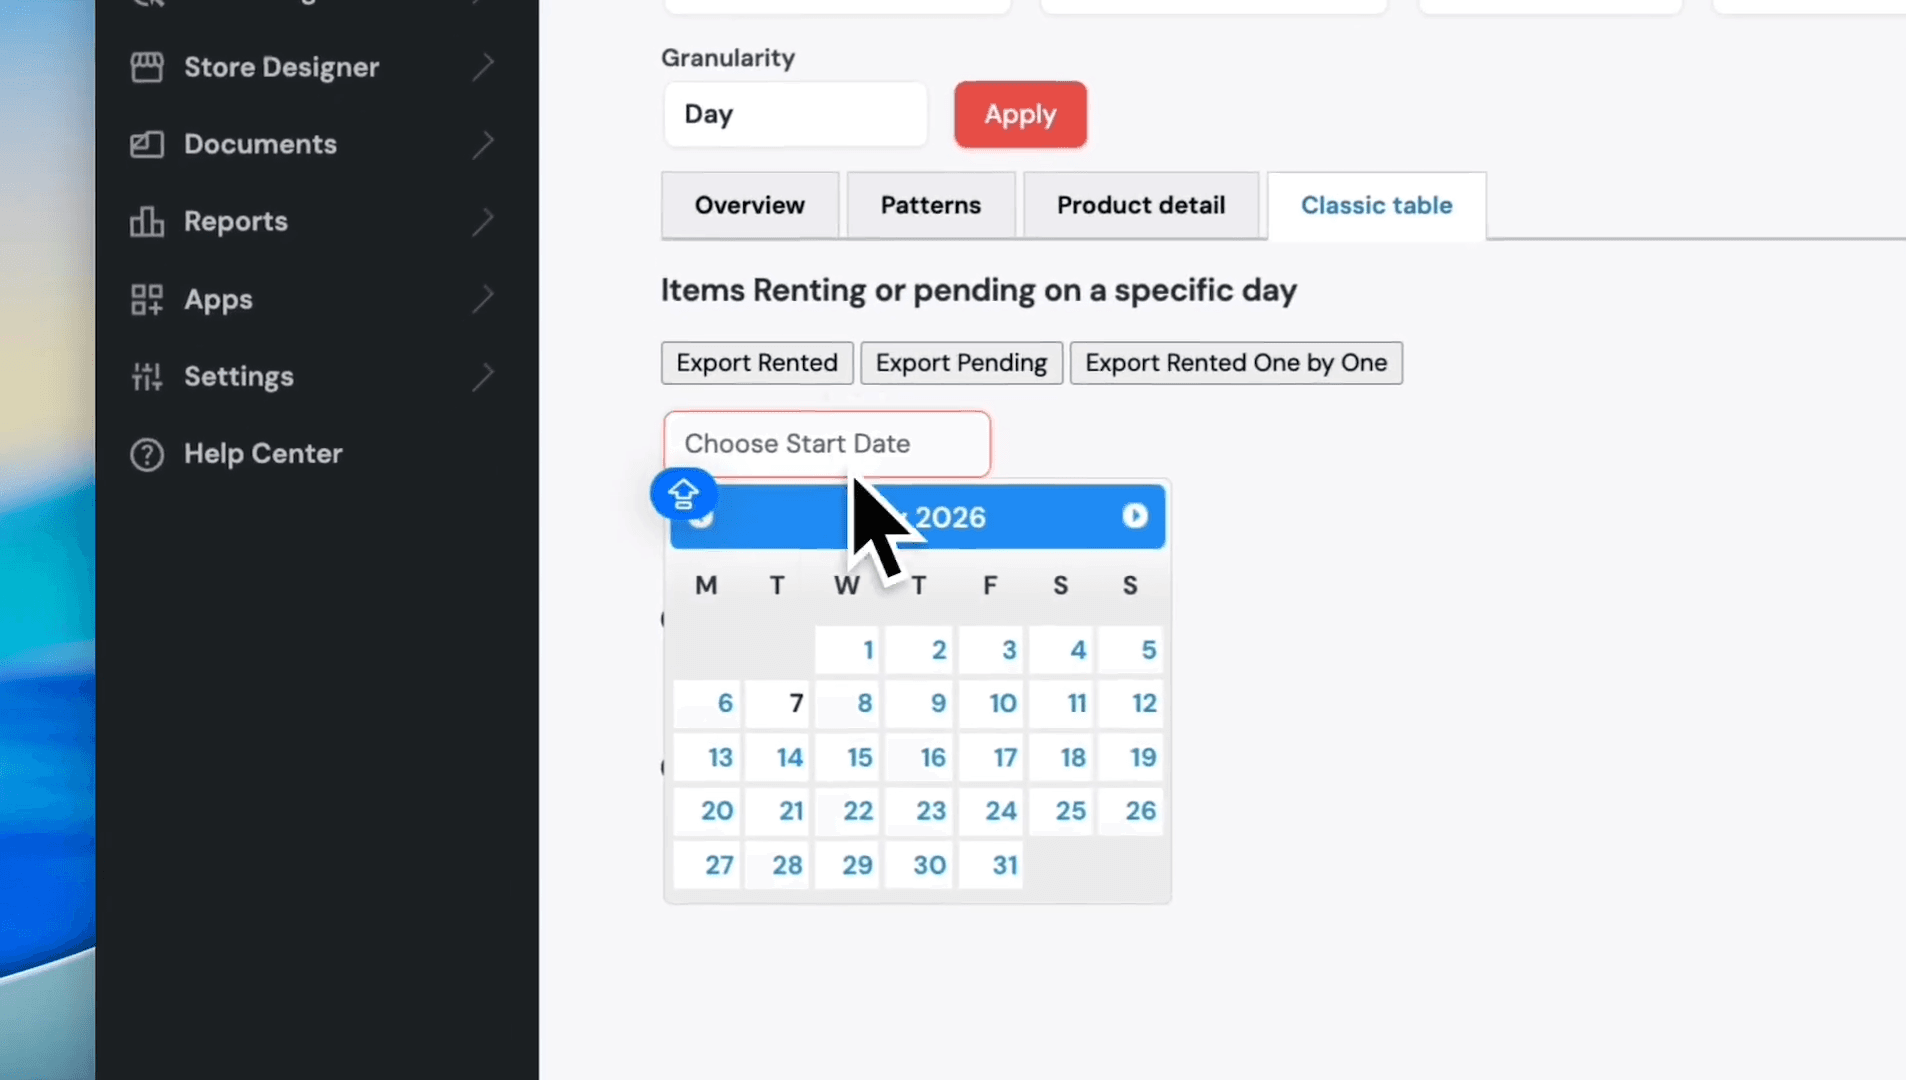
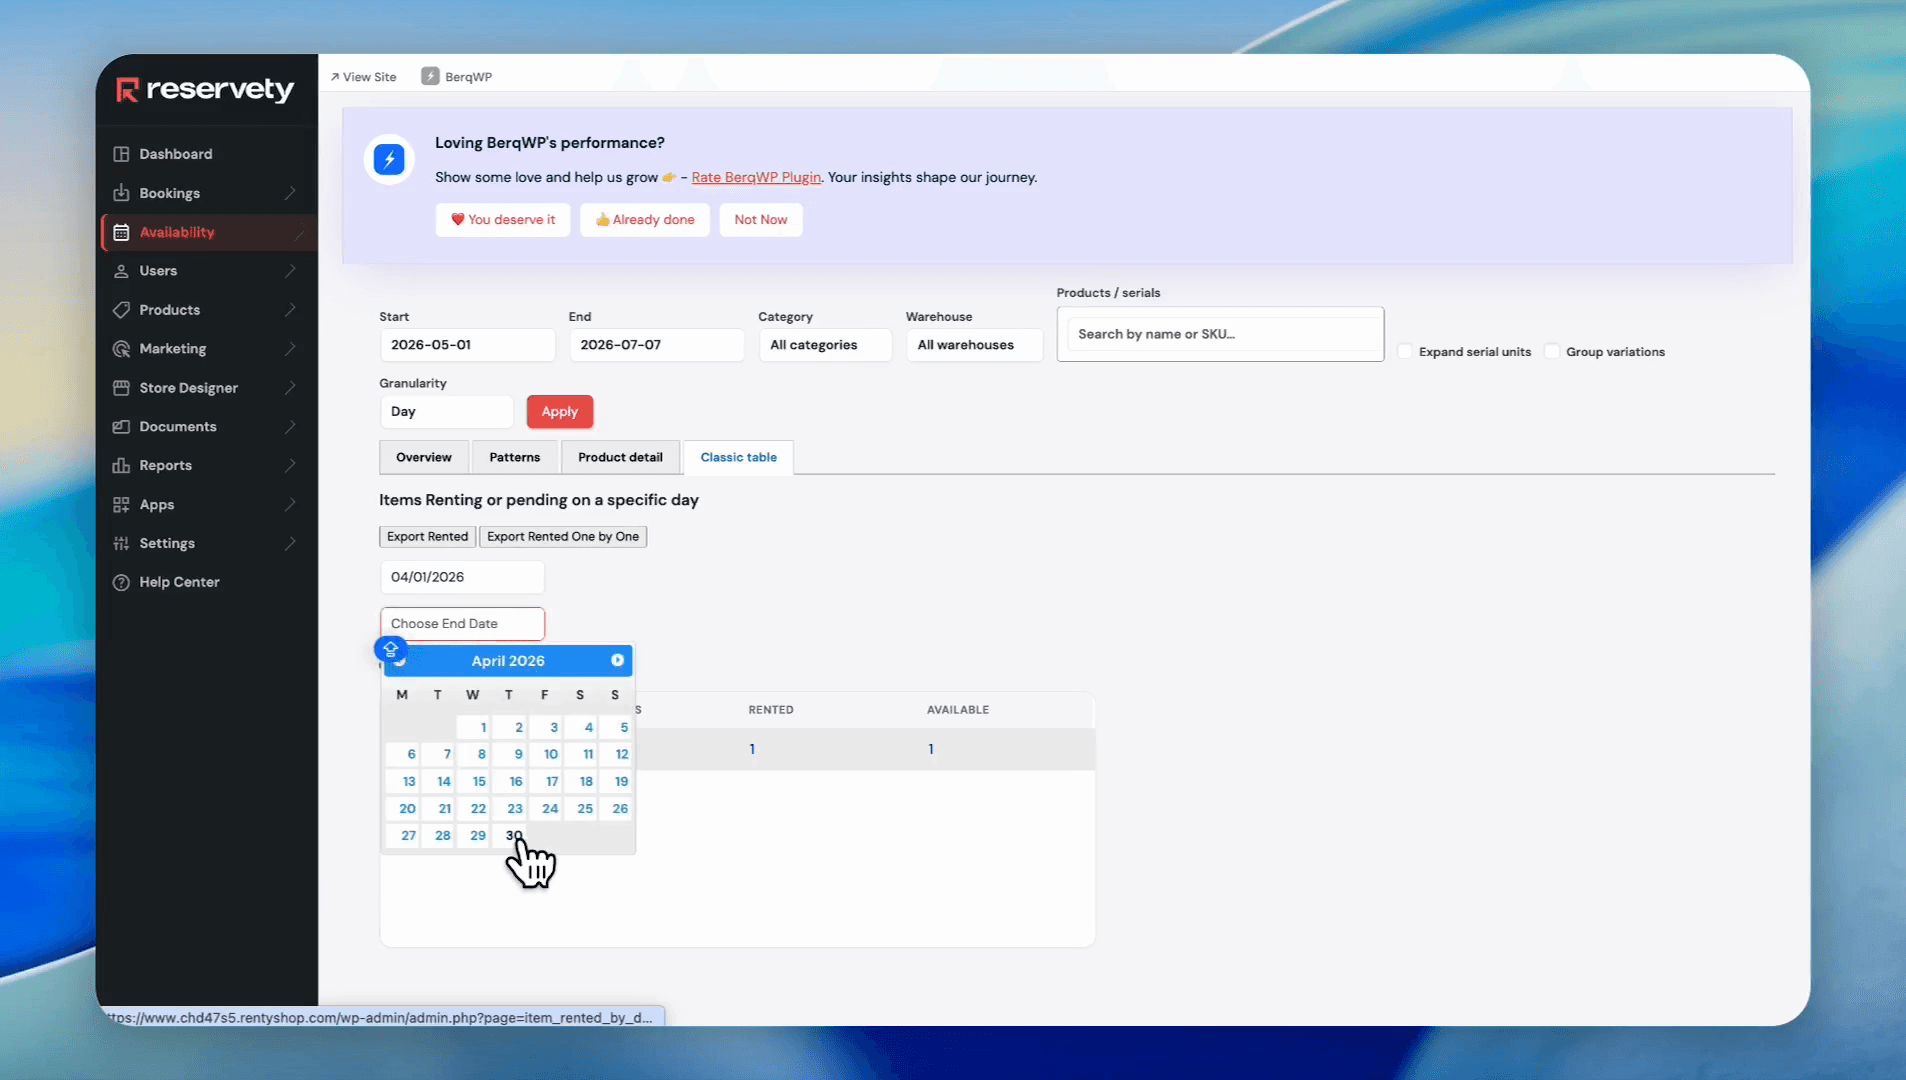
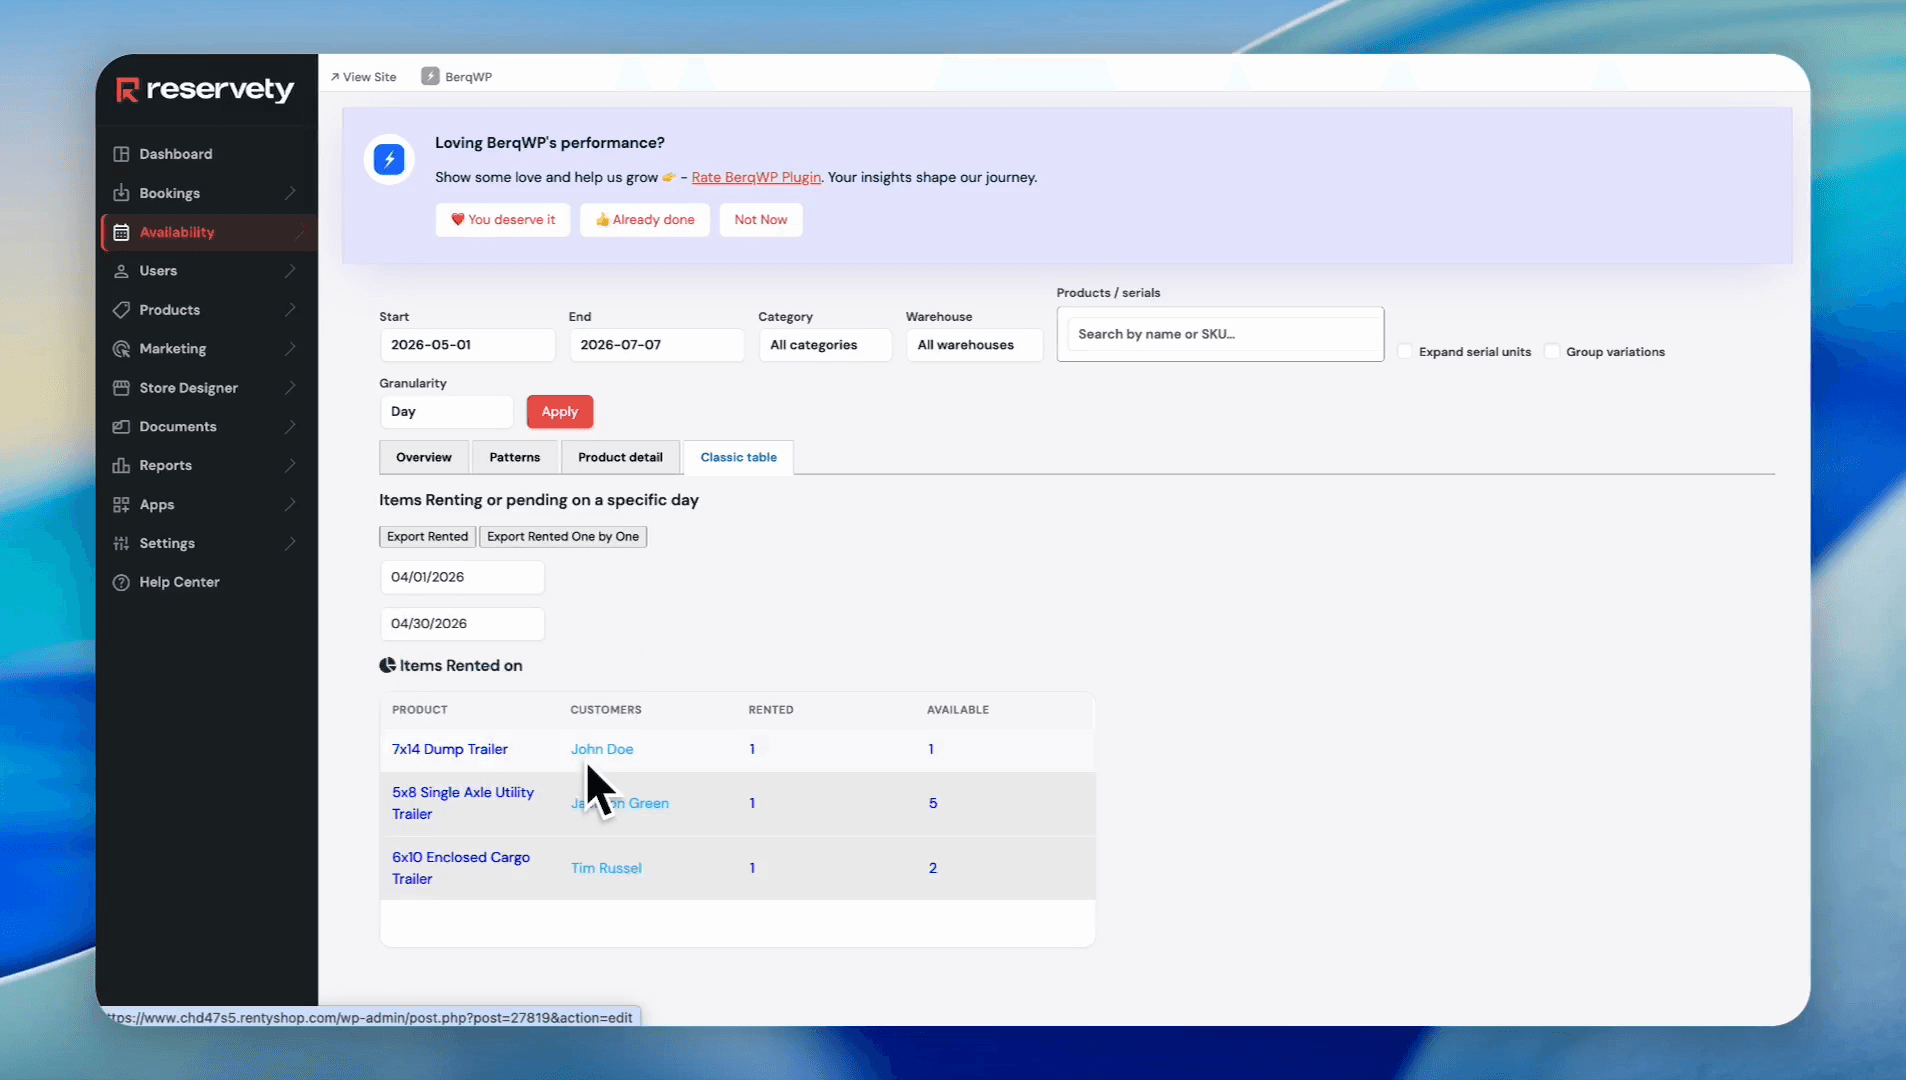
Classic Table | Specific date exports | Displays all rentals occurring on selected days alongside the number of rented vs. available units. |
Using the Patterns View
Using the Product Details View
Using the Classic Table View
If you prefer to see exact rental lists for specific date ranges, use the Classic Table view.
Q: What do the different colors mean on the Overview grid?
A: Green cells indicate available inventory for that specific date. Other colors represent different states, such as rented or unavailable items.
Q: How can I identify my busiest times to adjust pricing?
A: Use the Patterns tab. It displays your average utilization percentages by hour and by day, allowing you to easily identify busy periods and optimize your pricing and staffing accordingly.
Term | Definition |
|---|---|
Overview Report | A quick-snapshot grid where rows represent products and columns represent dates, showing daily available unit counts. |
Patterns Report | An analytical view that displays average item utilization percentages by hour and day to expose rental trends. |
Product Details Report | A dedicated view for a single product featuring a detailed utilization graph and full booking history. |
Classic Table | A traditional list view showing all active rentals and available inventory quantities for a specified start and end date. |